Tratamiento inmunosupresor para la nefritis lúpica proliferativa
Resumen
Antecedentes
La ciclofosfamida, en combinación con los corticosteroides, ha sido el tratamiento de primera línea para la inducción de la remisión de la enfermedad en la nefritis lúpica proliferativa, con una reducción de la muerte a los cinco años desde más del 50% en los años cincuenta y sesenta hasta menos del 10% en los años recientes. Hubo varias estrategias terapéuticas disponibles, diseñadas para mejorar las tasas de remisión y disminuir la toxicidad. Los tratamientos, que incluyen el micofenolato mofetilo (MMF) y los inhibidores de la calcineurina, solos y en combinación, pueden tener tasas de remisión equivalentes o mejores, una toxicidad inferior (menos alopecia e insuficiencia ovárica) y efectos inciertos sobre la muerte, la insuficiencia renal terminal (IRT) y la infección. Ésta es una actualización de una revisión Cochrane publicada por primera vez en 2004 y actualizada en 2012.
Objetivos
El objetivo fue evaluar la evidencia y evaluar los efectos beneficiosos y perjudiciales de diferentes tratamientos inmunosupresores en pacientes con nefritis lúpica comprobada con biopsia. Se analizaron las siguientes preguntas con respecto al tratamiento de la nefritis lúpica proliferativa: 1) ¿Los agentes inmunosupresores nuevos son superiores a ciclofosfamida más corticosteroides o tienen la misma efectividad? 2) ¿Qué agentes, dosis, vías de administración y duración del tratamiento se deben utilizar? 3) ¿Qué efectos tóxicos ocurren con los diferentes regímenes terapéuticos?
Métodos de búsqueda
Se realizaron búsquedas en el registro especializado del Grupo Cochrane de Riñón y Trasplante (Cochrane Kidney and Transplant Specialised Register) hasta el 2 de marzo de 2018, con apoyo del especialista en información y el uso de términos de búsqueda relevantes para esta revisión. Los estudios en el registro especializado se identifican mediante búsquedas en CENTRAL, MEDLINE y EMBASE, en actas de congresos, en el International Clinical Trials Register (ICTRP) Search Portal, y en ClinicalTrials.gov.
Criterios de selección
Se incluyeron los ensayos controlados aleatorios (ECA) y los ensayos controlados cuasialeatorios que compararon cualquier tratamiento inmunosupresor para la nefritis lúpica de clase III, IV, V+III y V+VI comprobada con biopsia en pacientes adultos o pediátricos.
Obtención y análisis de los datos
Dos autores de la revisión, de forma independiente, resumieron los datos y evaluaron los riesgos de sesgo. Los resultados dicotómicos se calcularon como cociente de riesgos (CR) y las mediciones en escalas continuas se calcularon como diferencias de medias (DM) con intervalos de confianza (IC) del 95%. Los resultados primarios fueron la muerte (todas las causas) y la remisión completa de la enfermedad para el tratamiento de inducción y la recaída de la enfermedad para el tratamiento de mantenimiento. La certeza de la evidencia se determinó mediante GRADE.
Resultados principales
En esta actualización de la revisión, se identificaron 26 estudios nuevos, lo que dio lugar a la inclusión de 74 estudios con 5175 participantes en total. Veintinueve estudios incluyeron a niños menores de 18 años de edad con nefritis lúpica; sin embargo, solo dos estudios examinaron exclusivamente el tratamiento de la nefritis lúpica en pacientes menores de 18 años de edad.
Tratamiento de inducción
Sesenta y siete estudios (4791 participantes; mediana de 12 meses de duración [intervalo 2,5 a 48 meses]) informaron sobre el tratamiento de inducción. Los efectos de todas las estrategias terapéuticas sobre la muerte (todas las causas) y la IRT no estuvieron claros (evidencia de certeza muy baja) debido a que este resultado ocurrió con muy poca frecuencia. En comparación con la ciclofosfamida intravenosa (IV), el MMF puede haber aumentado la remisión completa de la enfermedad (CR 1,17; IC del 95%: 0,97 a 1,42; evidencia de baja certeza), aunque el intervalo de efectos incluye la posibilidad de poca o ninguna diferencia.
En comparación con la ciclofosfamida IV, el MMF probablemente se asocia con una reducción en la alopecia (CR 0,29; IC del 95%: 0,19 a 0,46; 170 menos [129 menos a 194 menos] por 1000 pacientes) (evidencia de certeza moderada), un aumento de la diarrea (CR 2,42; IC del 95%: 1,64 a 3,58; 142 más [64 más a 257 más] por 1000 pacientes) (evidencia de certeza moderada) y puede haber logrado poco o ningún cambio en la infección grave (CR 1,02; IC del 95%: 0,67 a 1,54; dos menos [38 menos a 62 más] por 1000 pacientes) (evidencia de baja certeza). No se sabe si el MMF disminuyó la insuficiencia ovárica en comparación con la ciclofosfamida IV debido a que la certeza de la evidencia fue muy baja (CR 0,36; IC del 95%: 0,06 a 2,18; 26 menos [39 menos a 49 más] por 1000 pacientes). Los estudios en general no estaban diseñados para medir la IRT.
El MMF combinado con tacrolimús puede haber aumentado la remisión completa de la enfermedad (CR 2,38; IC del 95%: 1,07 a 5,30; 336 más [17 a 1048 más] por 1000 pacientes) (evidencia de baja certeza) en comparación con la ciclofosfamida IV; sin embargo, aún no están claros los efectos sobre la alopecia, la diarrea, la insuficiencia ovárica ni la infección grave. En comparación con el estándar de atención, los efectos de los productos biológicos sobre la mayoría de los resultados no están claros debido a la certeza baja a muy baja de la evidencia.
Tratamiento de mantenimiento
Nueve estudios (767 participantes; mediana 30 meses de duración [intervalo seis a 63 meses]) informaron sobre el tratamiento de mantenimiento. En el tratamiento de mantenimiento, la recaída de la enfermedad probablemente aumenta con la azatioprina en comparación con el MMF (CR 1,75; IC del 95%: 1,20 a 2,55; 114 más [30 a 236 más] por 1000 pacientes (evidencia de certeza moderada). Se compararon otras múltiples intervenciones como tratamiento de mantenimiento, pero los datos de resultado de los pacientes fueron escasos, lo que dio lugar a estimaciones poco precisas.
Conclusiones de los autores
En esta actualización de la revisión, los estudios que evaluaron el tratamiento para la nefritis lúpica proliferativa no estuvieron diseñados para evaluar la muerte (todas las causas) ni la IRT. El MMF puede dar lugar a un aumento en la remisión completa de la enfermedad en comparación con IV ciclofosfamida, con un perfil de eventos adversos aceptable, aunque la certeza de la evidencia fue baja e incluyó la posibilidad de ninguna diferencia. La calcineurina combinada con una dosis inferior de MMF puede mejorar la inducción de la remisión de la enfermedad en comparación con la ciclofosfamida IV, pero el perfil de seguridad comparativo de estos tratamientos no está claro. La azatioprina puede aumentar la recaída de la enfermedad como tratamiento de mantenimiento en comparación con el MMF.
PICO
Resumen en términos sencillos
Tratamiento inmunosupresor para los pacientes con nefritis lúpica proliferativa
¿Cuál es el problema?
En el lupus, el sistema inmunológico del cuerpo para combatir la infección ataca diferentes partes del cuerpo, incluidos los riñones. Alrededor de la mitad de todos los pacientes con lupus presentan problemas renales. Se calcula que uno de cada diez pacientes que presentan enfermedad renal por lupus (nefritis lúpica) puede desarrollar insuficiencia renal. El objetivo del tratamiento es proteger la función renal y evitar los efectos secundarios.
Aunque la esperanza de vida de los pacientes que tienen lupus ha mejorado extraordinariamente, los tratamientos disponibles pueden causar efectos secundarios graves como alopecia, infección grave e infertilidad. Es importante saber qué tratamientos ayudan a tratar el lupus a la vez que causan la menor cantidad de efectos secundarios.
¿Qué se hizo?
Se realizaron búsquedas en el Registro Especializado Cochrane de Riñón y Trasplante hasta el 2 de marzo de 2018 y se combinaron todos los estudios que examinaron los tratamientos que procuran controlar el sistema inmunológico del cuerpo para la nefritis lúpica.
¿Qué se encontró?
En esta actualización de la revisión, fue posible estudiar 74 estudios que incluyeron a 5175 pacientes con nefritis lúpica. Los tratamientos incluyeron ciclofosfamida intravenosa (administrada a través de un vena), micofenolato mofetilo (MMF) oral (comprimidos por vía oral), azatioprina y tacrolimús (utilizados solos o junto con MMF). También se encontraron estudios de tratamientos llamados terapias "biológicas", que se han diseñado para cambiar partes muy específicas del sistema inmunológico del cuerpo que provocan que se ataque a sí mismo. Se consideraron en particular resultados clave como si el tratamiento evitó que los pacientes necesitaran diálisis y si controló el daño del lupus al tejido renal (llamado remisión). También se consideraron los efectos secundarios graves como la muerte, la infección, la infertilidad y la alopecia.
Después de combinar los estudios disponibles, en comparación con la ciclofosfamida, el MMF puede ser mejor para lograr el control del daño del lupus a los riñones. Sin embargo, el intervalo del efecto real puede indicar que el MMF puede lograr poca o ninguna diferencia en la remisión de la enfermedad en comparación con el tratamiento con ciclofosfamida. El tratamiento con MMF administrado con tacrolimús puede dar lugar a una mayor remisión de la enfermedad. El MMF puede dar lugar a menos alopecia y a un empeoramiento de la diarrea, pero no existe seguridad en cuanto a si el MMF reduce la infertilidad u otros efectos secundarios graves. El MMF fue mejor que la azatioprina para prevenir la nefropatía a más largo plazo. Ninguno de los estudios señaló si el tratamiento tuvo efectos sobre la muerte o la necesidad de diálisis y la certeza de la evidencia fue muy baja en cuanto a la administración de productos biológicos en los pacientes con nefritis lúpica.
Conclusiones
Los pacientes con nefritis lúpica pueden tener resultados similares o algo mejores cuando se tratan con MMF o MMF con tacrolimús en comparación con los pacientes que reciben ciclofosfamida intravenosa. Aún no existe certeza en cuanto a cuál es el mejor tratamiento para la nefritis lúpica con el objetivo de proteger contra la necesidad de diálisis a más largo plazo.
Authors' conclusions
Summary of findings
| Patient or population: patients with induction therapy in lupus nephritis | ||||||
| Outcomes | Illustrative comparative risks* (95% CI) | Relative effect | No. of participants | Certainty of evidence | Comments | |
| Assumed risk | Corresponding risk | |||||
| IV CPA | MMF | |||||
| Death | 40 per 1000 | 53 per 1000 | RR 1.12 | 826 (8) | ⊕⊝⊝⊝ | Downgraded as follows: 1 Indirectness: time frame insufficient 2 Total number of events small 3 Severe imprecision (2 |
| ESKD | 85 per 1000 | 61 per 1000 | RR 0.71 (0.27 to 1.84) | 231 (3) | ⊕⊝⊝⊝ | Downgraded as follows: 1 Indirectness: time frame insufficient 2 Total number of events small 3 Severe imprecision (2 |
| Complete renal remission | 222 per 1000 | 260 per 1000 | RR 1.17 (0.97 to 1.42) | 828 (8) | ⊕⊕⊝⊝ | Downgraded as follows: 1 Study limitations 2 Total number of events small 3 Imprecision (2 grades): risk estimate includes null effect and estimate consistent with both appreciable |
| Partial renal remission Follow‐up: mean 24 weeks | 415 per 1000 | 423 per 1000 | RR 1.02 | 868 (9) | ⊕⊕⊝⊝ | Downgraded as follows: 1 Study limitations 2 Serious indirectness: differences in the outcome definition between studies. |
| Ovarian failure | 41 per 1000 | 15 per 1000 | RR 0.36 | 539 (3) | ⊕⊝⊝⊝ | Downgraded as follows: 1 Study limitations 2 Severe heterogeneity: point estimates varied widely 3 Total number of events small 4 Severe imprecision (2 grades): risk estimate includes null effect and estimate consistent |
| Major infection | 114 per 1000 | 116 per 1000 | RR 1.02 | 699 (6) | ⊕⊕⊝⊝ | Downgraded as follows: 1 Study limitations 2 Total number of events small 3 Severe imprecision (2 grades): risk estimate includes null effect and estimate consistent |
| Alopecia | 239 per 1000 | 69 per 1000 | RR 0.29 | 622 (3) | ⊕⊕⊕⊝ | Downgraded as follows: 1 Study limitations 2 Total number of events small Upgraded as follows: 3 Large magnitude of effect |
| Diarrhoea | 100 per 1000 | 241 per 1000 | RR 2.42 | 609 (4) | ⊕⊕⊕⊝ | Downgraded as follows: 1 Study limitations 2 Total number of events small Upgraded as follows 3 Large magnitude of effect |
| *The basis for the assumed risk for partial renal remission was prognostic studies (Fernandes das Neves 2015; Moroni 2007; So 2011; Zakharova 2016); and the assumed risk for other outcomes was calculated using the median control group risk across studies in the meta‐analysis. The corresponding risk (and its 95% confidence interval) is based on the assumed risk in the comparison group and the relative effect of the intervention (and its 95% CI) | ||||||
| GRADE Working Group certainty of evidence | ||||||
| MMF + TAC compared with IV CPA for lupus nephritis | ||||||
| Patient or population: Patients with proliferative lupus nephritis Settings: all settings Intervention: MMF + TAC Comparison: IV CPA | ||||||
| Outcomes | Illustrative comparative risks* (95% CI) | Relative effect | No. of participants | Certainty of evidence | Comments | |
| Assumed risk | Corresponding risk | |||||
| IV CPA | MMF + TAC | |||||
| Complete renal remission follow‐up: mean 24 weeks | 244 per 1000 | 580 per 1000 | RR 2.38 (1.07 to 5.30) | 402 (2) | ⊕⊕⊝⊝ | Downgraded as follows: 1Study limitation: concern regarding the incomplete reporting of IV CPA group 2Heterogeneity: substantial heterogeneity indicated by I2 statistic. Although Chi2 test was satisfied, the small number of studies may make this unreliable. 3Indirectness: Concern regarding the population, as all studies have largely included patients of Asian ethnicity. Upgraded as follows: 4Large effect size |
| Partial renal remission follow‐up: mean 24 weeks | 378 per 1000 | 378 per 1000 | RR 1.00 (0.78 to 1.28) | 402 (2) | ⊕⊕⊝⊝ | Downgraded as follows: 1Study limitation: concern regarding the incomplete reporting of IV CPA group 2 Indirectness: differences in the outcome definition between studies and concern regarding the population, as all studies have largely included patients of Asian ethnicity. |
| Stable kidney function follow‐up: mean 24 weeks | 284 per 1000 | 505 per 1000 | RR 1.78 (1.40 to 2.26) | 402 (2) | ⊕⊕⊝⊝ low1,2,3,4 | Downgraded as follows: 1Study limitation: concern regarding the incomplete reporting of IV CPA group 2 Indirectness (2 grades): differences in the outcome definition between studies and concern regarding the population, as all studies have largely included patients of Asian ethnicity. 3Total number of events small Upgraded as follows: 4Large effect size |
| *The basis for the assumed risk was calculated using the median control group risk across studies in the meta‐analyses. The corresponding risk (and its 95% confidence interval) is based on the assumed risk in the comparison group and the relative effect of the intervention (and its 95% CI). | ||||||
| GRADE Working Group certainty of evidence | ||||||
| Patient or population: patients with maintenance treatment in lupus nephritis | ||||||
| Outcomes | Illustrative comparative risks* (95% CI) | Relative effect | No. of participants | Certainty of evidence | Comments | |
| Assumed risk | Corresponding risk | |||||
| MMF | AZA | |||||
| Death | 22 per 1000 | 25 per 1000 | RR 1.15 (0.34 to 3.87) | 451 (4) | ⊕⊝⊝⊝ | Downgraded as follows: 1Total number of events small 2Severe imprecision (2 grades): risk estimate includes null effect and estimate consistent with both appreciable benefit and harm 3Indirectness: time frame insufficient |
| ESKD | 17 per 1000 | 30 per 1000 (9 to 96) | RR 1.70 (0.52 to 5.54) | 452 (4) | ⊕⊝⊝⊝ | Downgraded as follows: 1Total number of events small 2Severe imprecision (2 grades): risk estimate includes null effect and estimate consistent with both appreciable benefit and harm 3Indirectness: time frame insufficient |
| Renal relapse | 152 per 1000 | 266 per 1000 | RR 1.75 | 452 (4) | ⊕⊕⊕⊝ | Downgraded as follows: 1 Total number of events small |
| Doubling of serum creatinine Follow‐up: 36 to 72 months | 39 per 1000 | 86 per 1000 (40 to 182) | RR 2.19 (1.03 to 4.66) | 452 (4) | ⊕⊕⊝⊝ | Downgraded as follows: 1 Study limitations: (studies generally at unclear or high risk of bias for many domains) 2Total number of events small |
| Major infection | 91 per 1000 | 98 per 1000 | RR 1.08 | 412 (3) | ⊕⊕⊝⊝ | Downgraded as follows: 1 Total number of events small 2 Imprecision: wide risk estimate includes null effect |
| Leucopenia | 10 per 1000 | 54 per 1000 | RR 5.61 | 412 (3) | ⊕⊕⊝⊝ | Downgraded as follows: 1Study limitations: (studies generally at unclear or high risk of bias for many domains) 2 Imprecision: wide risk estimates |
| Alopecia | 67 per 1000 | 64 per 1000 | RR 0.95 | 412 (3) | ⊕⊕⊝⊝ | Downgraded as follows: 1Study limitations: (studies generally at unclear or high risk of bias for many domains) 2 Total number of events small |
| *The basis for the assumed risk for other outcomes was calculated using the median control group risk across studies in the meta‐analysis. The corresponding risk (and its 95% confidence interval) is based on the assumed risk in the comparison group and the relative effect of the intervention (and its 95% CI). | ||||||
| GRADE Working Group certainty of evidence | ||||||
Background
Description of the condition
Lupus nephritis occurs in about 20% to 75% of all people with systemic lupus erythematosus (SLE) (Cervera 2009), leading to end‐stage kidney disease (ESKD) in 10% to 17% of patients at 10 years (Houssiau 2010; Tektonidou 2016). Predominantly affecting young women, lupus nephritis is also more common in certain ethnic minority groups, particularly among African‐Americans and Hispanics who may also have a more aggressive form of the disease that is less responsive to treatment (Hanly 2016; Korbet 2007; Sexton 2014).
Kidney involvement ranges from mild subclinical disease, which is associated with favourable outcomes and a low chance of progression to ESKD, to severe nephritic and/or nephrotic syndrome with kidney impairment and greater risk of progression to ESKD. In the United States of America, and Australia and New Zealand, approximately 1% of patients commencing dialysis had ESKD as a consequence of lupus nephritis (ANZDATA 2016; Costenbader 2011). Patients with SLE and active lupus nephritis have reduced health‐related quality of life (Daleboudt 2011; McElhone 2006; Vu 1999). Fatigue is a frequent symptom and often identified as the most disrupting aspect of the disease in patients with lupus nephritis (Daleboudt 2011; Tench 2000), as it can limit their capacity to participate in the workforce, family, and social activities (Sutanto 2013).
Renal biopsy is required for the precise diagnosis and classification of lupus nephritis. Histological classification was introduced by the World Health Organization (WHO) in 1982 and revised in 2003 by the International Society of Nephrology (ISN) and the Renal Pathology Society (RPS). The ISN/RPS 2003 Class I and II lesions have a good prognosis and are generally not an indication for specific therapy, although some guidelines recommend therapy for people with WHO Class II lupus nephritis and proteinuria (> 2 g/d) (Tunnicliffe 2015). Proliferative disease (WHO Class III, IV, V+III and V+IV; ISN/RPS 2003 Class III (A) and (A/C), Class IV‐G and IV‐S, and Class III or IV in combination with Class V) is usually symptomatic, more fulminant, and requires treatment to induce remission and prevent significant kidney injury and premature death. Active proliferative (WHO Class IV) lupus nephritis is the most aggressive form of the condition, and has the worst prognosis without intensive immunosuppressive treatment.
Description of the intervention
Immunosuppressive therapy in the management of proliferative lupus nephritis aims to induce and maintain disease remission, in order to maximise patient and renal survival while minimising complications or treatment related adverse effects. The induction phase of therapy usually lasts six to 12 months. Common immunosuppressive agents in induction therapy include corticosteroid and an anti‐proliferative agent such as cyclophosphamide, mycophenolate mofetil (MMF), or azathioprine. Less commonly used treatments that are added to corticosteroids include tacrolimus, cyclosporin, plasma exchange or plasmapheresis, or a biologic therapy such as rituximab. Intravenous (IV) cyclophosphamide in combination with corticosteroids became standard of care therapy for inducing remission based on a landmark National Institutes of Health (NIH) trial that showed cyclophosphamide was superior over corticosteroids alone in preventing renal flares and kidney failure (Decker 1975). A meta‐analysis (Bansal 1997) and our earlier systematic review (Flanc 2004a) identified that the addition of an immunosuppressant to corticosteroids was superior to corticosteroids alone in managing proliferative lupus nephritis. Subsequently, low‐dose cyclophosphamide (Euro‐lupus regimen) has been reported to have equivalent efficacy to the NIH protocol (Houssiau 2002). The dose of corticosteroid is tapered as the disease activity is controlled and the anti‐proliferative therapy is replaced with a less toxic alternative once remission is induced. Maintenance therapy aims to maintain remission and potential treatments include: azathioprine, MMF, tacrolimus and cyclosporin.
How the intervention might work
Active lupus nephritis is characterised by an inflammatory response to immune complexes in the kidneys. Mediators of inflammation, including complement, leukocytes, and cytokines injure the kidney and amplify inflammation. The release of kidney antigens in response to this inflammatory kidney injury may result in the production of kidney‐specific autoantibodies. This organ‐specific autoimmunity may perpetuate inflammation and result in kidney injury (Rovin 2014). The mechanisms of action of therapies used in the management of lupus nephritis are diverse, and aim to attenuate inflammation. Corticosteroids and IV cyclophosphamide and other conventional treatments have a broad spectrum immunosuppressive effect, while biologic therapies, which have been of increasing focus of trials in the last decade, target B‐cells, T‐cells, cytokines or growth factors to suppress the immune response (Murphy 2013).
First‐line therapy has transformed lupus nephritis from an acute illness with five‐year survival rates at less than 50% in the 1950s to a chronic illness with five‐year survival rates greater than 90% (Houssiau 2010; Mok 2002). Response to treatment is often slow, and although remission is induced in a significant proportion of patients, the risk of relapse has been reported between 18% and 46% (Ponticelli 1998), and treatment can cause considerable toxicity, and increase the risk of infertility (Henderson 2012).
Why it is important to do this review
We conducted a systematic review of immunosuppressive treatment of proliferative lupus nephritis in 2004 (Flanc 2004a), and updated this systematic review in 2012 (Henderson 2012). The 2012 review identified 50 randomised controlled trials (RCTs) that enrolled a total of 2846 participants. The conclusion was that compared with IV cyclophosphamide, MMF was as effective in inducing disease remission, but with a lower risk of ovarian failure. MMF was more effective than azathioprine in maintaining disease remission. A recent network meta‐analysis identified that compared to IV cyclophosphamide either MMF or tacrolimus or their combination was more effective in inducing remission. Compared with IV cyclophosphamide, the combination of MMF and tacrolimus reduced ovarian failure, but either treatment alone conferred a similar risk of ovarian failure. The use of these newer therapies on outcomes such as: death, ESKD and doubling of serum creatinine (SCr) were inconclusive (Palmer 2017).
In the past five years, numerous studies have evaluated a number of regimens including MMF, tacrolimus or their combination and various biologic agents. Given the uncertainty that surrounds the safety and efficacy of these therapies, the aim of our updated review was to evaluate the relative effects of all available immunosuppressive therapies for the induction and maintenance treatment of lupus nephritis using IV cyclophosphamide as the main comparator in induction therapy and azathioprine as the main comparator in maintenance therapy.
Objectives
Our objective was to assess the evidence and evaluate the benefits and harms of different immunosuppressive treatments in people with biopsy‐proven lupus nephritis. The following questions relating to management of proliferative lupus nephritis were addressed:
-
Are new immunosuppressive agents superior to or as effective as cyclophosphamide plus corticosteroids?
-
Which agents, dosages, routes of administration and duration of therapy should be used?
-
Which toxicities occur with the different treatment regimens?
Methods
Criteria for considering studies for this review
Types of studies
We included all RCTs and quasi‐RCTs, whether published or available only in abstract form, which evaluated any of the treatment options in the focus of this review, singularly or in combination, determining the benefits and harms of different treatment options for lupus nephritis.
Types of participants
We included adults and children with biopsy‐proven proliferative lupus nephritis.
Types of interventions
We considered studies that investigated the following treatment options for either induction or maintenance therapies for lupus nephritis.
-
Corticosteroids including prednisone and methylprednisolone
-
Other immunosuppressive agents including azathioprine, cyclophosphamide, MMF, tacrolimus and cyclosporin
-
Plasma exchange or plasmapheresis
-
Biologic therapy (for example, abatacept, atacicept, laquinimod, ocrelizumab, rituximab and sirukumab).
Non‐specific treatment options (e.g. antihypertensive agents) were not included in the present analysis because these do not specifically aim to treat underlying lupus nephritis, but rather more generally, aim to prevent the progression of chronic kidney disease (CKD).
Types of outcome measures
Primary outcomes
-
Death (all causes)
-
ESKD, requirement for renal replacement therapy
-
Complete renal remission: defined as return to normal SCr, urinary protein excretion < 0.5 g/24 h, and inactive urinary sediment) following induction therapy
-
Relapse of lupus nephritis: maintenance therapy
Secondary outcomes
The following dichotomous outcome measures were considered:
-
Partial renal remission: defined as a fall to < 3.0 g/d protein if baseline ≥ 3.0 g/d or ≥ 50% reduction if < 3.0 g/d at baseline and stabilisation of SCr ± 25% (ALMS 2007)
-
Remission in proteinuria: complete and partial.
-
Relapse of lupus nephritis ‐ induction therapy
-
Doubling of SCr
-
Deterioration of kidney function: defined as more than 20% worsening of SCr
-
Stable kidney function: defined as a less than 20% worsening of SCr.
The following side effects (toxicity) of treatments were considered:
-
Ovarian failure (sustained amenorrhoea)
-
Menstrual irregularities
-
Infection
-
Major infection: all‐cause infection excluding herpes zoster virus infection
-
Herpes zoster virus infection
-
-
Development of any malignancy
-
Leucopenia (defined as < 4 x 10⁹ cells/L)
-
Bone toxicity (avascular necrosis or fracture)
-
Bladder toxicity (haemorrhagic cystitis)
-
Alopecia
-
Gastrointestinal (GI) adverse effects including diarrhoea, vomiting and nausea.
The following continuous outcomes were analysed at the end of treatment.
-
Daily proteinuria (24 hour urinary protein excretion) (g/24 h)
-
Creatinine clearance (CrCl) (mL/min)
-
SCr (μmol/L)
-
Health‐related quality of life
-
Fatigue
-
Disease activity (e.g. British Isles Lupus Assessment Group (BILAG), SLE Disease Activity Index (SLEDAI)
Search methods for identification of studies
Electronic searches
We searched the Cochrane Kidney and Transplant Specialised Register up to 2 March 2018 through contact with the Information Specialist using search terms relevant to this review. The Cochrane Kidney and Transplant Specialised Register contains studies identified from several sources.
-
Monthly searches of the Cochrane Central Register of Controlled Trials (CENTRAL)
-
Weekly searches of MEDLINE OVID SP
-
Handsearching of kidney‐related journals and the proceedings of major kidney conferences
-
Searching of the current year of EMBASE OVID SP
-
Weekly current awareness alerts for selected kidney and transplant journals
-
Searches of the International Clinical Trials Register (ICTRP) Search Portal and ClinicalTrials.gov.
Studies contained in the Specialised Register are identified through search strategies for CENTRAL, MEDLINE, and EMBASE based on the scope of Cochrane Kidney and Transplant. Details of these strategies, as well as a list of handsearched journals, conference proceedings and current awareness alerts, are available in the Specialised Register section of information about Cochrane Kidney and Transplant.
See Appendix 1 for search terms used in strategies for this review.
Searching other resources
-
Reference lists of review articles, relevant studies and clinical practice guidelines
-
Handsearching of proceedings of major rheumatology conferences
-
Letters seeking information about unpublished or incomplete studies to investigators known to be involved in previous studies.
Data collection and analysis
Selection of studies
The search strategy described was performed to identify eligible studies. The titles and abstracts resulting from the searches were screened by two authors who independently assessed retrieved abstracts, and if necessary the full text, to determine which studies satisfied the inclusion criteria. Disagreement about inclusion was resolved by discussion with a third author.
Where duplication reports of the same study were confirmed, the initial first complete publication was selected (the index publication) and was the primary data source, but any other additional prior or subsequent reports were also included. These additional prior or subsequent reports containing supplementary outcome data (such as longer‐term follow up, or different outcomes) also contributed to the meta‐analysis.
Data extraction and management
Data abstraction was performed independently by two authors using a standardised form. Unclear data were clarified by contacting the author of the study report and any relevant data obtained in this manner was included in the review (see Acknowledgements).
Assessment of risk of bias in included studies
The following items were independently assessed by two authors using the risk of bias assessment tool (Higgins 2011) (see Appendix 2).
-
Was there adequate sequence generation (selection bias)?
-
Was allocation adequately concealed (selection bias)?
-
Was knowledge of the allocated interventions adequately prevented during the study (detection bias)?
-
Participants and personnel (performance bias)
-
Outcome assessors (detection bias)
-
-
Were incomplete outcome data adequately addressed (attrition bias)?
-
Are reports of the study free of suggestion of selective outcome reporting (reporting bias)?
-
Was the study apparently free of other problems that could put it at a risk of bias?
Disagreements regarding the risk of bias adjudications were resolved by consultation with a third review author.
Measures of treatment effect
Dichotomous data
For dichotomous outcomes (death (all causes), complete or partial renal remission, complete or partial remission in proteinuria, ESKD, renal relapse, doubling of SCr, stable kidney function, ovarian failure, menstrual irregularities, major infection, herpes zoster virus infection, malignancy, leucopenia, bone toxicity, bladder toxicity, alopecia and GI disorders) results were expressed as risk ratio (RR) with 95% confidence intervals (CI).
Continuous data
Where continuous scales of measurement were used to assess the effects of treatment (urinary protein excretion, CrCl, SCr, health‐related quality of life, fatigue, disease activity) the mean difference (MD) with 95% CI was used.
Unit of analysis issues
Studies with multiple treatment groups
In studies comparing the efficacy of more than two interventions we considered the following:
-
If different interventions were of different classes (for example, MMF or tacrolimus versus IV cyclophosphamide), we included each treatment group in separate meta‐analyses, ensuring we did not include outcome data for the control group participants more than once in a single meta‐analysis.
-
If interventions were of the same therapy (for example, high dose or low dose abatacept, laquinimod), we summarised into a single group that was compared with the control group for dichotomous outcomes (we summed the sample sizes and the number of people with events across the treatment groups). For continuous data, we entered the means and standard deviations of a single intervention group (usually the highest dosage) for comparison with the control group. Where appropriate, we considered sensitivity analyses, testing the impact of including the alternative intervention group in analyses.
Dealing with missing data
Where a study reported outcome data after excluding some randomised participants from the denominator, further information required from the original author was requested by electronic mail and any relevant information obtained in this manner was included in the review. Evaluation of important numerical data such as screened, randomised patients as well as intention‐to‐treat, as‐treated and per‐protocol population were carefully performed. Attrition rates, for example drop‐outs, losses to follow‐up and withdrawals were investigated. Issues of missing data and imputation methods (for example, last‐observation‐carried‐forward) was critically appraised (Higgins 2011).
Assessment of heterogeneity
We first assessed for statistical heterogeneity visually by inspecting forest plots of standardised mean effect sizes and of risk ratios. Furthermore, we applied a Chi2 test to assess heterogeneity. With P < 0.05 used to denote statistical significance, and with I2 calculated to measure the proportion of total variation in the estimates of treatment effect that was due to heterogeneity beyond chance (Higgins 2011) and we used conventions of interpretation that were defined by Higgins 2003.
Assessment of reporting biases
Detection of potential for publication bias was planned for among the primary outcomes. We made every attempt to minimise publication bias by including unpublished studies (for example, by searching online trial registries). In order to assess publication bias we used funnel plots of the log odds ratio (OR) (effect versus standard error of the effect size) when sufficient number of studies were available (Higgins 2011). For the analysis and the interpretation of the funnel plots, other reasons for asymmetry besides publication bias were considered (for example, differences in methodological quality and true heterogeneity in intervention effects). However, the limited amount of study data published did not enable meaningful interpretation. We had also planned to conduct subgroup analysis and meta‐regression to evaluate potential sources of heterogeneity but this was not possible because of the small number of studies of paired interventions.
Data synthesis
Data were abstracted from individual studies and then pooled for summary estimates using a random‐effects model. The random‐effects model was chosen because it provides a more conservative estimate of effect in the presence of known or unknown potential heterogeneity (Deeks 2001).
Subgroup analysis and investigation of heterogeneity
Subgroup analyses are hypothesis‐forming rather than hypothesis‐testing and should be treated with caution. We considered subgroup analyses on the ethnicity of participants, class of lupus nephritis, age of the patient (adults versus children) and the type of induction therapy patients were treated with before randomisation in maintenance therapy studies in order to explore whether clinical differences between the studies may have systematically influenced the differences that were observed in the treatment outcomes. However, insufficient data were available to conduct subgroup analyses for the primary outcomes.
Sensitivity analysis
The following sensitivity analyses were considered:
-
Repeating the analysis excluding unpublished studies
-
Repeating the analysis taking account of risk of bias, as specified
-
Repeating the analysis excluding any very long or large studies to establish how much they dominate the results
-
Repeating the analysis excluding studies using the following filters: language of publication, source of funding (industry versus other), and country the study was conducted in.
However insufficient data were available to determine these factors influence of the on effect size.
'Summary of findings' tables
We presented the main results of the review in 'Summary of findings' tables. These tables present key information concerning the quality of the evidence, the magnitude of the effects of the interventions examined, and the sum of the available data for the main outcomes (Schünemann 2011a). The 'Summary of findings' tables also include an overall grading of the evidence related to each of the main outcomes using the GRADE (Grades of Recommendation, Assessment, Development and Evaluation) approach (GRADE 2008; GRADE 2011). The GRADE approach defines the quality of a body of evidence as the extent to which one can be confident that an estimate of effect or association is close to the true quantity of specific interest. The quality of a body of evidence involves consideration of within‐trial risk of bias (methodological quality), directness of evidence, heterogeneity, precision of effect estimates and risk of publication bias (Schünemann 2011b). We presented the following outcomes in the 'Summary of findings' tables.
-
Death (all causes)
-
ESKD, requirement for renal replacement therapy
-
Complete renal remission
-
Partial renal remission
-
Renal relapse
-
Doubling of SCr
-
Stable kidney function
-
Ovarian failure
-
Major infection
-
Leucopenia
-
Alopecia
-
Diarrhoea
Results
Description of studies
Results of the search
For this update, a search was conducted on 2 March 2018 (Figure 1). This new search identified 110 reports. After full‐text review 71 new studies were identified. Twenty‐six (43 reports) new studies were included and 17 (19 reports) were excluded. We identified 26 ongoing studies which will be assessed in a future update of this review. We also identified 20 new reports of 11 existing included studies. One study identified as a primary study in the 2012 review update was reallocated as a secondary report of ALMS 2007 (Sundel 2008). Four previously excluded studies have been included as they met our inclusion criteria (Abedi 2007; Florez‐Suarez 2004; Loo 2010; Zhang 1995a).

Study flow diagram.
*Non‐RCTs have been deleted from this update
Included studies
See Characteristics of included studies
After including the studies identified from the 2018 update search, a total of 236 reports of 74 studies were included in this review (Figure 1) which included a total of 5175 randomised participants (Abedi 2007; ACCESS 2014; ALMS 2007; APRIL‐LN 2012; AURA‐LV 2016; Balletta 1992; Bao 2008; Barron 1982; Belmont 1995; BELONG 2013; Boedigheimer 2017; Boletis 1999; Boumpas 1992; Cade 1973; Chan 2000; Chen 2011; Clark 1981; Clark 1984; Contreras 2004; CYCLOFA‐LUNE 2010; Decker 1975; Deng 2016; Derksen 1988; Donadio 1972; Donadio 1976; Doria 1994; Dyadyk 2001; El‐Sehemy 2006; El‐Shafey 2010; Florez‐Suarez 2004; Fries 1973; Fu 1997; Furie 2014; Ginzler 1976; Ginzler 2005; Gourley 1996; Grootscholten 2006; Hahn 1975; Hong 2007; Houssiau 2002; Jayne 2013; Kaballo 2016; Kamanamool 2017; Lewis 1992; Li 2009c; Li 2012; Liou 2007; Liu 2015; Loo 2010; Lui 1997; LUNAR 2012; MAINTAIN Nephritis 2010; Mehra 2018; Mendonca 2017; Mitwalli 2011; Mok 2016; Moroni 2006; Mulic‐Bacic 2008; MyLupus 2011; Nakamura 2002e; Ong 2005; Pal 2017; Rathi 2016; Rovin 2016; Sabry 2009; Sedhain 2016; Sesso 1994a; SIMPL 2014; Steinberg 1971; Sun 2015; Wallace 1998; Yap 2017; Yee 2004; Zhang 1995a).
Twenty‐nine studies enrolled adults and children (< 18 years) (ACCESS 2014; ALMS 2007; Bao 2008; BELONG 2013; Boumpas 1992; Cade 1973; Chen 2011; Derksen 1988; Donadio 1972; Donadio 1976; Doria 1994; El‐Shafey 2010; Houssiau 2002; Kaballo 2016; Lewis 1992; Li 2012; Loo 2010; LUNAR 2012; MAINTAIN Nephritis 2010; Mehra 2018; Mendonca 2017; Moroni 2006; Ong 2005; Rathi 2016; Sesso 1994a; Steinberg 1971; Sun 2015; Wallace 1998; Yee 2004), 29 only enrolled adults (APRIL‐LN 2012; AURA‐LV 2016; Balletta 1992; Belmont 1995; Boedigheimer 2017; Boletis 1999; Chan 2000; Clark 1984; Contreras 2004; CYCLOFA‐LUNE 2010; Dyadyk 2001; El‐Sehemy 2006; Furie 2014; Ginzler 1976; Ginzler 2005; Gourley 1996; Grootscholten 2006; Hahn 1975; Hong 2007; Kamanamool 2017; Li 2009c; Lui 1997; Mitwalli 2011; Mok 2016; MyLupus 2011; Nakamura 2002e; Rovin 2016; Sabry 2009; SIMPL 2014), 2 only enrolled children (Barron 1982; Fu 1997), and 14 studies did not specify the age of the participants.
There were 67 studies of induction therapy (4791 participants), and nine studies of maintenance therapy (767 participants; 297 had already completed an induction phase study (ALMS 2007; Chen 2011)). Follow‐up ranged from median 12 months duration (range 2.5 to 48 months) for induction therapy, and median 30 months duration (range 6 to 63 months) for maintenance therapy. The numbers of patients included in the studies ranged from 6 to 378 with a median number of 45 patients.
Of all authors contacted for further clarification for the 2012 review update, nine responded (Drs Belmont, Doria, Donadio, Fries, Gourley, Houssiau, Solomons, Wofsy and Florez‐Suarez). For the 2018 update, one author provided supplementary data (Dr Rathi).
Induction therapy
Comparators for induction therapy included the following.
-
MMF plus corticosteroid versus IV cyclophosphamide plus corticosteroid (10 studies, 878 participants: Abedi 2007; ALMS 2007; El‐Shafey 2010; Florez‐Suarez 2004; Ginzler 2005; Li 2012; Mulic‐Bacic 2008; Ong 2005; Rathi 2016; Sedhain 2016)
-
MMF plus corticosteroid versus oral cyclophosphamide plus corticosteroids (1 study, 62 participants: Chan 2000)
-
MMF plus tacrolimus plus corticosteroid versus IV cyclophosphamide plus corticosteroid (2 studies, 402 participants: Bao 2008; Liu 2015)
-
MMF plus IV cyclophosphamide and corticosteroids versus cyclophosphamide plus corticosteroids (1 study, 82 participants: Sun 2015)
-
MMF plus corticosteroids versus tacrolimus plus corticosteroids (2 studies, 190 participants: Li 2012; Mok 2016)
-
Calcineurin inhibitors (tacrolimus or cyclosporin) plus corticosteroids versus IV cyclophosphamide plus corticosteroids (4 studies, 178 participants: Chen 2011; CYCLOFA‐LUNE 2010; Hong 2007; Li 2012) or oral cyclophosphamide plus corticosteroids (1 study, 34 participants: Lui 1997)
-
Cyclophosphamide plus corticosteroid versus azathioprine plus corticosteroid (4 studies, 219 participants: El‐Sehemy 2006; Decker 1975; Dyadyk 2001; Grootscholten 2006) or lefluomide plus corticosteroid (1 study, 30 participants: Deng 2016)
-
Rituximab plus MMF versus placebo plus MMF (both arms included corticosteroids) (1 study, 144 participants: LUNAR 2012)
-
Rituximab plus cyclophosphamide versus rituximab alone (both arms included corticosteroids) (1 study, 19 participants: Li 2009c)
-
Abatacept versus placebo (2 studies; 432 participants: ACCESS 2014, Furie 2014)
-
Low dose or high dose laquinimod versus placebo (1 study, 46 participants: Jayne 2013)
-
Low dose or high dose ocrelizumab versus placebo (1 study; 378 participants: BELONG 2013)
-
Sirukumab with or without corticosteroids plus MMF or azathioprine versus placebo with or without corticosteroids plus MMF or azathioprine (1 study, 25 participants: Rovin 2016)
-
IV versus oral cyclophosphamide (2 studies, 74 participants: Decker 1975; Yee 2004)
-
Low versus high dose IV cyclophosphamide (3 studies, 253 participants: Houssiau 2002; Mitwalli 2011; Sabry 2009)
-
Standard dose corticosteroid versus reduced dose corticosteroid with both arms receiving enteric‐coated mycophenolate sodium (EC‐MPS) (1 study, 81 participants: MyLupus 2011)
-
IV versus oral corticosteroid (1 study, 22 participants: Barron 1982).
-
IV cyclophosphamide with or without corticosteroid versus corticosteroid alone (5 studies, 261 participants: Decker 1975; Boumpas 1992; Gourley 1996; Sesso 1994a; Steinberg 1971)
-
Cyclophosphamide versus azathioprine with or without corticosteroids versus corticosteroid alone (4 studies, 94 participants: Decker 1975; Cade 1973; Donadio 1972; Hahn 1975)
-
Azathioprine plus corticosteroids versus corticosteroids alone (3 studies, 78 participants: Cade 1973; Decker 1975; Hahn 1975)
-
Cyclosporin plus corticosteroids versus corticosteroids alone (1 study, 10 participants: Balletta 1992)
-
Misoprostol plus corticosteroids versus corticosteroids alone (1 study, 14 participants: Belmont 1995)
-
Plasma exchange plus immunosuppression plus corticosteroids versus immunosuppression plus corticosteroids (5 studies, 174 participants; Clark 1981; Clark 1984; Doria 1994; Lewis 1992; Wallace 1998)
-
Plasma exchange versus immunosuppression alone (2 studies, 40 participants; Derksen 1988; Nakamura 2002e)
-
Long versus short duration IV cyclophosphamide (1 study, 40 participants: Boumpas 1992)
Other comparisons
-
Plasma exchange versus immunoadsorption (1 study, 28 participants; Loo 2010)
-
MMF versus cyclophosphamide (unclear if oral or IV) (1 study, 14 participants: Yap 2017)
-
Tacrolimus + azathioprine versus IV cyclophosphamide (1 study, 58 participants: Pal 2017)
-
Atacicept plus MMF and corticosteroid versus placebo plus MMF and corticosteroid (1 study, 6 participants: APRIL‐LN 2012)
-
Low dose or high dose voclosporin versus placebo (1 study; 256 participants: AURA‐LV 2016)
-
AMG811 (anti‐IFN‐γ antibody) versus placebo (1 study; 28 participants: Boedigheimer 2017)
-
Cyclophosphamide till remission versus cyclophosphamide for 1 year (1 study, 36 participants: Zhang 1995a).
Maintenance therapy
Six studies (541 participants) compared azathioprine plus corticosteroid to another immunosuppressive agent (MMF, cyclophosphamide, cyclosporin or tacrolimus) (ALMS 2007; Chen 2011; Contreras 2004; Kaballo 2016; MAINTAIN Nephritis 2010; Moroni 2006); two studies had already completed an induction phase (ALMS 2007; Chen 2011). One study (40 participants) compared cyclophosphamide with cyclosporin (Fu 1997), one study (14 participants) compared IV cyclophosphamide to IV immunoglobulin (IVIG) (Boletis 1999) and one study compared prednisone withdrawal versus prednisone continuation (SIMPL 2014).
The maintenance phase of one study (Chan 2000) underwent a significant post‐randomisation protocol adjustment. The MMF induction arm originally switched to maintenance azathioprine at one year, but the protocol changed mid‐trial to continue MMF for two years. This was prompted by an unexpectedly high rate of renal relapse in the azathioprine maintenance group. Data for those participants on the original protocol were not reported separately from the adjusted protocol, so accordingly, only the induction phase data of this study could be included in our synthesis.
Excluded studies
See Characteristics of excluded studies.
Forty‐eight studies were excluded (Andrade‐Ortega 2010; Antunes 2001; ASPEN 2008; ATLAS 2016; Austin 2009; Balow 1981; Balow 1984; Ble 2011; Chanchairujira 2009; Clark 1993; Clark 2001a; CONTROL 2016; Davis 1999; Daza 2005; Deng 2017a; Feng 2014; Frutos 1997; Hebert 1987; Khajehdehi 2012; Kuo 2001; Li 2005; Li 2014a; LJP 394‐90‐05 2003; LJP 394‐90‐09 2005; Lu 2002; Miyasaka 2009; NCT00001212; NCT00404157; NCT00429377; NCT00436438; NCT00539799; NCT00659217; NCT01299922; NCT01342016; NCT01930890; NCT02176486; Pierucci 1989; Schaumann 1992; Su 2007; Sztejnbok 1971; Wallace 2006; Wang 2007; Witte 1993; Yap 2012; Ye 2001; Yoshida 1996; Zhang 2015c; Zheng 2005a).
The major reasons for exclusion were:
-
Diagnosis of lupus nephritis was not biopsy‐proven or was not proliferative lupus nephritis
-
That the randomised treatment comparison was not immunosuppression.
For this update non‐RCTs have been deleted.
Risk of bias in included studies
Reporting of details of study methodology was incomplete for the majority of studies, and are summarised in Figure 2.

Risk of bias graph: review authors' judgements about each risk of bias item presented as percentages across all included studies.
Allocation
Random sequence generation
Of the included studies, 25 reported adequate sequence generation (Bao 2008; Chan 2000; Chen 2011; Decker 1975; Derksen 1988; Donadio 1972; Donadio 1976; Fu 1997; Ginzler 2005; Gourley 1996; Grootscholten 2006; Hahn 1975; Houssiau 2002; Kaballo 2016; Kamanamool 2017; Lewis 1992; Li 2009c; Liu 2015; Mehra 2018; Mok 2016; Moroni 2006; Ong 2005; SIMPL 2014; Steinberg 1971; Yee 2004). Sequence generation was inadequate in five studies where alternation was used to allocate patients to treatment groups (Barron 1982; Cade 1973; Contreras 2004; Loo 2010; Sabry 2009). These studies were included in the review but deemed high risk for selection bias. Sequence generation was unclear in the remaining 44 studies.
Allocation concealment
Allocation concealment was adequate in 17 studies (ALMS 2007; Boletis 1999; Boumpas 1992; Chen 2011; Contreras 2004; CYCLOFA‐LUNE 2010; Fu 1997; Ginzler 2005; Hahn 1975; Kamanamool 2017; Lewis 1992; Li 2009c; Liu 2015; Moroni 2006; Ong 2005; SIMPL 2014; Steinberg 1971), inadequate in four studies (Barron 1982; Cade 1973; MyLupus 2011; Sabry 2009), and unclear in the remaining 53 studies.
Blinding
Performance bias
Low risk of bias was assigned to 14 studies (ACCESS 2014; APRIL‐LN 2012; AURA‐LV 2016; Belmont 1995; BELONG 2013; Boedigheimer 2017; Furie 2014; Ginzler 1976; Jayne 2013; LUNAR 2012; Mitwalli 2011; Rovin 2016; SIMPL 2014; Steinberg 1971).
High risk was assigned to 47 studies, with 46 studies being open‐label (Abedi 2007; ALMS 2007; Bao 2008; Barron 1982; Boumpas 1992; Cade 1973; Chen 2011; Clark 1981; Clark 1984; Contreras 2004; CYCLOFA‐LUNE 2010; Donadio 1972; Donadio 1976; Doria 1994; Dyadyk 2001; El‐Shafey 2010; Florez‐Suarez 2004; Fries 1973; Fu 1997; Ginzler 2005; Gourley 1996; Grootscholten 2006; Hahn 1975; Hong 2007; Kamanamool 2017; Lewis 1992; Li 2009c; Li 2012; Liou 2007; Liu 2015; Lui 1997; MAINTAIN Nephritis 2010; Mehra 2018; Mendonca 2017; Mok 2016; Moroni 2006; Mulic‐Bacic 2008; MyLupus 2011; Nakamura 2002e; Ong 2005; Pal 2017; Rathi 2016; Sedhain 2016; Sun 2015; Wallace 1998; Yee 2004; Zhang 1995a), and one study was unlikely to have treatment allocation blinded (Loo 2010). The remaining 13 studies were unclear, as they did not report blinding.
Detection bias
Nine studies reported blinding of subjective outcomes adequately (ALMS 2007; AURA‐LV 2016; Bao 2008; Chan 2000; Gourley 1996; Liu 2015; Mitwalli 2011; Moroni 2006; SIMPL 2014), the remaining studies were classified as unclear, as blinding of the outcome assessor was not reported.
Incomplete outcome data
Incomplete outcome data was addressed adequately in 54 studies (ACCESS 2014; ALMS 2007; APRIL‐LN 2012; AURA‐LV 2016; Balletta 1992; Bao 2008; Belmont 1995; Boedigheimer 2017; Boletis 1999; Boumpas 1992; Cade 1973; Chan 2000; Chen 2011; Clark 1981; Clark 1984; Contreras 2004; CYCLOFA‐LUNE 2010; Decker 1975; Doria 1994; El‐Sehemy 2006; Fu 1997; Furie 2014; Ginzler 1976; Ginzler 2005; Gourley 1996; Grootscholten 2006; Hahn 1975; Houssiau 2002; Jayne 2013; Kaballo 2016; Kamanamool 2017; Lewis 1992; Li 2009c; Li 2012; LUNAR 2012; MAINTAIN Nephritis 2010; Mehra 2018; Mendonca 2017; Mitwalli 2011; Mok 2016; Moroni 2006; Mulic‐Bacic 2008; MyLupus 2011; Ong 2005; Rovin 2016; Sabry 2009; Sesso 1994a; SIMPL 2014; Steinberg 1971; Sun 2015; Wallace 1998; Yee 2004). Three studies were inadequate (Barron 1982; BELONG 2013; Liu 2015), and the remainder were unclear.
Selective reporting
We found that 36 studies were free of selective reporting bias (ACCESS 2014; ALMS 2007; Bao 2008; Belmont 1995; BELONG 2013; Boletis 1999; Boumpas 1992; Cade 1973; Chan 2000; Chen 2011; Clark 1981; Contreras 2004; CYCLOFA‐LUNE 2010; Decker 1975; Donadio 1976; Doria 1994; El‐Shafey 2010; Furie 2014; Ginzler 1976; Gourley 1996; Grootscholten 2006; Houssiau 2002; Kaballo 2016; Kamanamool 2017; Lewis 1992; Li 2012; LUNAR 2012; MAINTAIN Nephritis 2010; Mitwalli 2011; Mok 2016; Moroni 2006; Ong 2005; Rathi 2016; Sesso 1994a; Steinberg 1971; Sun 2015). Thirty‐five studies were considered to be at high risk of reporting bias (Abedi 2007; APRIL‐LN 2012; AURA‐LV 2016; Balletta 1992; Barron 1982; Boedigheimer 2017; Clark 1984; Deng 2016; Derksen 1988; Donadio 1972; Dyadyk 2001; El‐Sehemy 2006; Florez‐Suarez 2004; Fries 1973; Fu 1997; Ginzler 2005; Hahn 1975; Hong 2007; Jayne 2013; Li 2009c; Liou 2007; Liu 2015; Loo 2010; Mehra 2018; Mendonca 2017; Mulic‐Bacic 2008; MyLupus 2011; Nakamura 2002e; Pal 2017; Rovin 2016; SIMPL 2014; Wallace 1998; Yap 2017; Yee 2004; Zhang 1995a), and the remaining three studies (Lui 1997; Sabry 2009; Sedhain 2016) were unclear.
Other potential sources of bias
Eighteen studies declared their funding sources to be independent or academic funding bodies and were judged to be free of other potential bias (Boumpas 1992; Clark 1981; Clark 1984; CYCLOFA‐LUNE 2010; Donadio 1972; Donadio 1976; Gourley 1996; Grootscholten 2006; Houssiau 2002; Kamanamool 2017; Li 2012; Liou 2007; Liu 2015; MAINTAIN Nephritis 2010; Mendonca 2017; Mok 2016; Sun 2015; Yap 2017). Eight studies that declared independent funding sources were deemed high risk because of either early termination (Ginzler 2005; Lewis 1992; Yee 2004), heavy cross‐over between treatment arms (Fries 1973; Ginzler 1976; Ginzler 2005; Steinberg 1971), pooling of studies (Decker 1975) or differences between treatment arms at baseline (Sesso 1994a). A further 20 studies declared sponsorship by a pharmaceutical industry company. Ten of the pharmaceutical sponsored studies included an author who declared pharmaceutical company affiliation; these were judged as carrying high risk of a potential source of bias (ACCESS 2014; ALMS 2007; APRIL‐LN 2012; AURA‐LV 2016; BELONG 2013; Contreras 2004; Furie 2014; LUNAR 2012; Moroni 2006; MyLupus 2011; Rovin 2016). Thirty‐three studies did not disclose study funding sources. Eleven studies exhibited potential biases, which included inadequate reporting of results (Deng 2016; Sedhain 2016), pooling of interventions into study arms (Derksen 1988), low statistical power (Boedigheimer 2017; SIMPL 2014), and differences between treatment arms at baseline (El‐Sehemy 2006; Mehra 2018; Mitwalli 2011; Loo 2010; Rathi 2016; Sabry 2009).
Effects of interventions
See: Summary of findings for the main comparison Mycophenolate mofetil (MMF) versus IV cyclophosphamide (CPA) for induction therapy; Summary of findings 2 Mycophenolate mofetil (MMF) + tacrolimus (TAC) versus IV cyclophosphamide (CPA) for induction therapy; Summary of findings 3 Azathioprine (AZA) versus mycophenolate mofetil (MMF) for maintenance therapy
Induction therapy
Main comparisons and outcomes for induction therapy, graded by certainty of the evidence, are presented in summary of findings Table for the main comparison and summary of findings Table 2.
1 & 2. MMF plus corticosteroids versus cyclophosphamide plus corticosteroid
1. Intravenous cyclophosphamide
Primary outcomes
Compared to IV cyclophosphamide, treatment with MMF may have led to increased complete disease remission (Analysis 1.2.2 (8 studies, 828 participants): RR 1.17, 95% CI 0.97 to 1.42; I2 = 0%) (low certainty evidence), although the range of effects includes the possibility of little or no difference. It is uncertain if MMF compared to IV cyclophosphamide reduced death and ESKD because the certainty of the evidence is very low (Analysis 1.1; Analysis 1.3.1).
Secondary outcomes
The studies reported that MMF may be as effective as IV cyclophosphamide in the stabilisation of kidney function (Analysis 1.4 (6 studies, 641 participants): RR 1.05, 95% CI 0.94 to 1.17; I2 = 0%) (low certainty evidence), and may be as effective in inducing partial renal remission (Analysis 1.2.2 (9 studies, 868 participants): RR 1.02, 95% CI 0.89 to 1.18; I2 = 0%). It is uncertain if MMF compared to IV cyclophosphamide increased complete remission in proteinuria (Analysis 1.2.1) and partial renal remission in proteinuria (Analysis 1.2.4) because the certainty of the evidence was very low. In terms of adverse kidney outcomes, it is uncertain if MMF compared to IV cyclophosphamide reduced renal relapse (Analysis 1.3.2) and doubling of SCr (Analysis 1.3.3) because the certainty of the evidence was very low, as few studies reported these outcomes.
Compared to IV cyclophosphamide, treatment with MMF may have made little to no difference to SCr at the end of the study (Analysis 1.14 (6 studies, 759 participants): MD 2.14 µmol/L, 95% CI ‐3.09 to 7.37; I2 = 0%) (low certainty evidence), although we cannot be certain of its effect on daily proteinuria (Analysis 1.13) because the certainty of evidence was very low. A considerable level of heterogeneity was observed among studies examining daily proteinuria (I2 = 63%). One study (Ong 2005) recruited patients with significantly greater proteinuria among cyclophosphamide treated patients at baseline, an observation which persisted to follow‐up. Exclusion of this study reduced the level of heterogeneity slightly (I2 = 26%).
MMF probably reduced alopecia (Analysis 1.11 (3 studies, 622 participants): RR 0.29, 95% CI 0.19 to 0.46; I2 = 0%), but probably increased diarrhoea (Analysis 1.12.1 (4 studies, 609 participants): RR 2.42, 95% CI 1.64 to 3.58) (moderate certainty evidence). Compared to IV cyclophosphamide, MMF may have made little or no difference to major infection (Analysis 1.7.1 (6 studies, 699 participants): RR 1.02, 95% CI 0.67 to 1.54; I2 = 0%) (low certainty evidence). We were unable to determine if MMF reduced ovarian failure (Analysis 1.5), herpes zoster virus infection (Analysis 1.7.2), malignancy (Analysis 1.8), leucopenia (Analysis 1.9), vomiting (Analysis 1.12.2), nausea (Analysis 1.12.3), or GI upset (Analysis 1.12.4) compared to IV cyclophosphamide because the certainty of evidence was very low, as few studies reported these outcomes and events. In this review update, the introduction of a new study increased heterogeneity and imprecision of the effect estimates, to include both appreciable benefit and harm for the outcomes ovarian failure (RR 0.36, 95% CI 0.06 to 2.18; I2 = 39%) and leucopenia (RR 0.59, 95% CI 0.33 to 1.08; I2 = 59%). As a result, the certainty of the evidence for these outcomes was downgraded to very low. For the ovarian failure outcome, the inclusion Rathi 2016 which compared a low dose IV cyclophosphamide (“Euro‐lupus”) to MMF, introduced three events and the benefit of MMF demonstrated in the 2012 Cochrane review update was no longer apparent.
2. Oral cyclophosphamide
Only one study examined the use of MMF plus corticosteroids versus oral cyclophosphamide and corticosteroids in induction therapy of proliferative lupus nephritis (Chan 2000).
Primary outcome
We were unable to determine if MMF compared to oral cyclophosphamide reduced death because the certainty of the evidence was very low (Analysis 2.1). However, MMF may have made little or no difference to ESKD (Analysis 2.3.1 (62 participants): RR 0.19, 95% CI 0.01 to 3.76)
Secondary outcomes
Chan 2000 reported MMF compared to oral cyclophosphamide may make little or no difference in the inducing complete remission in proteinuria (Analysis 2.2.1 (62 participants): RR 0.98, 95% CI 0.74 to 1.30) and partial remission in proteinuria (Analysis 2.2.2 (62 participants): RR 1.07, 95% CI 0.44 to 2.59) (low certainty evidence). Similarly, MMF may have made little or no difference to renal relapse (Analysis 2.3.2 (62 participants): RR 1.15, 95% CI 0.55 to 2.37), doubling of SCr (Analysis 2.3.3 (62 participants): RR 0.63, 95% CI 0.11 to 3.48), and daily proteinuria (Analysis 2.10 (42 participants): MD 0.30 g/24 h, 95% CI ‐0.19 to 0.79) (low certainty evidence).
Chan 2000 reported the use of MMF may have reduced ovarian failure (Analysis 2.4 (53 participants): RR 0.10, 95% CI 0.01 to 0.73), major infection (Analysis 2.5.1 (62 participants): RR 0.21, 95% CI 0.05 to 0.89), leucopenia (Analysis 2.6 (62 participants): RR 0.06, 95% CI 0.00 to 0.92), and alopecia (Analysis 2.8 (62 participants): RR 0.05, 95% CI 0.00 to 0.81) compared to oral cyclophosphamide (low certainty evidence). MMF compared to oral cyclophosphamide may have made little or no difference to: herpes zoster virus infection (Analysis 2.5.2 (62 participants): RR 0.38, 95% CI 0.08 to 1.79) and GI upset (Analysis 2.9 (62 participants): RR 2.81, 95% CI 0.31 to 25.58) (low certainty evidence). We were unable to determine if MMF compared to oral cyclophosphamide reduced bone toxicity (Analysis 2.7) because the certainty of the evidence was very low.
3. MMF plus tacrolimus and corticosteroid versus IV cyclophosphamide plus corticosteroid
Primary outcomes
MMF in combination with tacrolimus may improve the induction of complete renal remission (Analysis 3.2.1 (2 studies, 402 participants): RR 2.38, 95% CI 1.07 to 5.30; I2 = 57%) (low certainty evidence), while it is uncertain whether combination therapy reduces death (Analysis 3.1) because the certainty of the evidence was very low.
Secondary outcomes
MMF in combination with tacrolimus may have increased induction of complete remission in proteinuria (Analysis 3.2.3 (2 studies, 402 participants): RR 2.38, 95% CI 1.07 to 5.30; I2 = 57%), and achievement of stable kidney function stable kidney function (Analysis 3.4 (2 studies, 402 participants): RR 1.78, 95% CI 1.40 to 2.26; I2 = 0%) (low certainty evidence). Combination therapy may have made little or no difference in inducing partial renal remission (Analysis 3.2.2 (2 studies, 402 participants): RR 1.00, 95% CI 0.78 to 1.28; I2 = 0%) and partial remission in proteinuria (Analysis 3.2.4 (2 studies, 402 participants): RR 0.98, 95% CI 0.76 to 1.26; I2 = 0%) when compared with IV cyclophosphamide (low certainty evidence). It is uncertain if combination therapy compared to IV cyclophosphamide reduced daily proteinuria (Analysis 3.12 (1 study, 40 participants): MD ‐1.69 g/24 h, 95% CI ‐2.8 to ‐0.57) because the certainty of the evidence was very low.
MMF plus tacrolimus compared to IV cyclophosphamide may have made little or no difference to menstrual irregularities (Analysis 3.6 (1 study, 323 participants): RR 0.28, 95% CI 0.06 to 1.35) (low certainty of evidence). It is uncertain the effects that MMF plus tacrolimus may have had on the following outcomes: doubling of SCr (Analysis 3.3.1), ovarian failure (Analysis 3.5), major infection (Analysis 3.7.1), herpes zoster virus infection (Analysis 3.7.2), leucopenia (Analysis 3.8), bone toxicity (Analysis 3.9), alopecia (Analysis 3.10), diarrhoea (Analysis 3.11.1) and GI upset (Analysis 3.11.2), because the certainty of the evidence was very low, due to risk of bias concerns, indirectness of the population and imprecision of the point estimates because of a small sample size and few event numbers.
4. MMF plus IV cyclophosphamide versus IV cyclophosphamide alone
One study compared MMF plus Iv cyclophosphamide versus IV cyclophosphamide alone (Sun 2015).
Primary outcomes
Compared to IV cyclophosphamide alone, It is uncertain if MMF in combination with cyclophosphamide improves the induction of complete renal remission (Analysis 4.2.1) and reduces death (Analysis 4.1) because the certainty of the evidence was very low.
Secondary outcomes
MMF in combination with IV cyclophosphamide may reduce major infection compared to treatment with IV cyclophosphamide alone (Analysis 4.4.1 (82 participants): RR 0.37, 95% CI 0.14 to 0.93) and may make little or no difference to daily proteinuria (Analysis 4.6 (77 participants): MD ‐0.54 g/24 h, 95% CI ‐1.12 to 0.04).
Compared to IV cyclophosphamide alone, It is uncertain if the combination of MMF and IV cyclophosphamide reduces menstrual irregularities (Analysis 4.3) or leucopenia (Analysis 4.5).
5. MMF plus corticosteroid versus tacrolimus plus corticosteroid
Primary outcomes
MMF compared to tacrolimus may have made little or no difference in inducing complete renal remission (Analysis 5.2.1 (3 studies, 273 participants): RR 1.02, 95% CI 0.83 to 1.26; I2 = 0%) (low certainty evidence). It is uncertain if MMF compared to tacrolimus reduced death (Analysis 5.1) or ESKD (Analysis 5.3.1) because the certainty of the evidence was very low.
Secondary outcomes
For secondary efficacy outcomes, MMF compared to tacrolimus may have made little or no difference in achieving partial renal remission (Analysis 5.2.2 (2 studies, 190 participants): RR 0.83, 95% CI 0.51 to 1.36; I2 = 0%), complete remission in proteinuria (Analysis 5.2.3 (1 study, 40 participants): RR 1.00, 95% CI 0.50 to 1.98), partial remission in proteinuria (Analysis 5.2.4 (2 studies, 190 participants): RR 0.90, 95% CI 0.79 to 1.03; I2 = 0%), deterioration in kidney function (Analysis 5.3.5 (1 study, 150 participants): RR 0.54, 95% CI 0.27 to 1.09), and stable kidney function (Analysis 5.4 (1 study, 40 participants): RR 1.00, 95% CI 0.50 to 1.98) (low certainty evidence). The use of MMF may have reduced renal relapse (Analysis 5.3.2 (1 study, 150 participants): RR 0.67, 95% CI 0.48 to 0.98) compared to tacrolimus (low certainty evidence). It is uncertain whether MMF improves daily proteinuria (Analysis 5.9), SCr (Analysis 5.11), and CrCl (Analysis 5.12), because the certainty of the evidence was very low. MMF compared to tacrolimus may have made little or no difference to renal disease activity (SLEDAI) (Analysis 5.10.1 (2 studies, 233 participants): MD ‐0.21, 95% CI ‐2.05 to 1.63; I2 = 71%) and extrarenal disease activity (SLEDAI) (Analysis 5.10.2 (2 studies, 233 participants): MD ‐0.26, 95% CI ‐0.74, 0.22; I2 = 0%) (low evidence certainty).
For outcomes, menstrual irregularities (Analysis 5.5: 1 study, 40 participants), major infection (Analysis 5.6.1: 2 studies, 190 participants), herpes zoster virus infection (Analysis 5.6.2: 1 study, 150 participants), leucopenia (Analysis 5.7: 1 study, 40 participants), and alopecia (Analysis 5.8: 1 study, 150 participants), we were unable to be certain of the effect of the MMF compared to tacrolimus because the certainty of the evidence was very low.
6. Calcineurin inhibitors plus corticosteroids versus cyclophosphamide plus corticosteroid
Primary outcomes
Compared to IV cyclophosphamide, calcineurin inhibitors (tacrolimus and cyclosporin) may have made little or no difference to the induction of complete renal remission (Analysis 6.2.1 (4 studies, 178 participants): RR 1.35, 95% CI 0.94 to 1.93; I2 = 0%) (low certainty evidence). It is uncertain if calcineurin inhibitors decreased death (Analysis 6.1) or ESKD (Analysis 6.3.1) compared to IV cyclophosphamide because the certainty of the evidence was very low.
Secondary outcomes
Compared to IV cyclophosphamide, calcineurin inhibitors may have improved the induction of complete remission in proteinuria (Analysis 6.2.3 (3 studies, 105 participants): RR 1.71, 95% CI 1.08 to 2.70; I2 = 0%) and may have made little or no difference to the induction of partial renal remission (Analysis 6.2.2 (4 studies, 178 participants): RR 0.88, 95% CI 0.61 to 1.26) (low certainty evidence). The effect of calcineurin inhibitors compared to IV cyclophosphamide on doubling of SCr (Analysis 6.3.2), stable kidney function (Analysis 6.4), ovarian failure (Analysis 6.5), menstrual irregularities (Analysis 6.6), major infection (Analysis 6.7.1), herpes zoster virus infection (Analysis 6.7.2), leucopenia (Analysis 6.9), alopecia (Analysis 6.10), and GI symptoms (Analysis 6.11) is unclear because the certainty of the evidence was very low. It is unclear the effect that calcineurin inhibitors have on continuous outcomes daily proteinuria (Analysis 6.12), CrCl (Analysis 6.13), and SCr (Analysis 6.14) at 9, 12 and 18 months compared to IV cyclophosphamide because the certainty of the evidence was very low.
An extended follow‐up study of 38 participants from CYCLOFA‐LUNE 2010 examined long‐term safety and efficacy outcomes, but it was uncertain if cyclosporin reduced doubling of SCr (Analysis 6.3.3), premature ovarian failure (Analysis 6.5.3), and malignancy (Analysis 6.8), or improved daily proteinuria (Analysis 6.12) and SCr (Analysis 6.14) because the certainty of the evidence was very low.
7. Cyclophosphamide plus corticosteroid versus azathioprine plus corticosteroids
Primary outcome
The risk of death at five years (Analysis 7.1.1: 2 studies, 146 participants) and at 10 years (Analysis 7.1.2: 1 study, 59 participants) is uncertain because the certainty of the evidence was very low. Additionally, it is uncertain if azathioprine compared to cyclophosphamide reduced ESKD (Analysis 7.3.1: 2 studies, 144 participants).
Secondary outcomes
For efficacy outcomes it is uncertain if azathioprine compared to cyclophosphamide improved the rates of complete remission in proteinuria (Analysis 7.2.1: 1 study, 59 participants), partial remission in proteinuria (Analysis 7.2.2: 1 study, 59 participants), and stable kidney function (Analysis 7.4: 1 study, 57 participants) because the certainty of the evidence was very low. Similarly, for adverse renal outcomes it is not certain if azathioprine compared to cyclophosphamide reduced renal relapse (Analysis 7.3.3: 1 study, 87 participants) and deterioration of kidney function (Analysis 7.3.6: 1 study, 30 participants) because the certainty of evidence was very low; although, it may have reduced doubling of SCr (Analysis 7.3.5 (2 studies, 144 participants): RR 0.48, 95% CI 0.24 to 0.95; I2 = 0%) (low certainty evidence).
For safety outcomes, azathioprine may have made little or no difference to ovarian failure (Analysis 7.5 (2 studies, 126 participants): RR 2.11, 95% CI 0.59 to 7.53; I2 = 34%) (low certainty evidence). However, it is uncertain if it reduced menstrual irregularities (Analysis 7.6: 1 study, 15 participants), major infection (Analysis 7.7.1: 1 study 57 participants), herpes zoster virus infection (Analysis 7.7.2: 1 study, 57 participants), malignancy (Analysis 7.8: 2 studies, 144 participants), bone toxicity (Analysis 7.9: 1 study, 87 participants), and bladder toxicity (Analysis 7.10: 2 studies, 144 participants) because the certainty of the evidence was very low.
8. Rituximab + MMF versus placebo + MMF (both arms included corticosteroids)
Primary outcomes
It is uncertain if rituximab plus MMF versus placebo plus MMF improved the induction of complete renal remission (Analysis 8.2.1) or reduced death (Analysis 8.1.1), because the certainty of the evidence was very low.
Secondary outcomes
Rituximab plus MMF compared to placebo plus MMF may have made little or no difference in the stabilisation of kidney function (Analysis 8.3 (1 study, 144 participants): RR 1.24, 95% CI 0.90 to 1.7) (low certainty evidence). It is uncertain if it improved the induction of complete remission in proteinuria (Analysis 8.2.3), partial renal remission (Analysis 8.2.2), or reduced major infection (Analysis 8.4.1), herpes zoster virus infection (Analysis 8.4.2), and leucopenia (Analysis 8.5) because the certainty of the evidence was very low.
9. Rituximab plus cyclophosphamide versus rituximab alone
One study compared rituximab plus cyclophosphamide versus rituximab alone (Li 2009c).
Primary outcomes
It is uncertain if rituximab plus cyclophosphamide compared to rituximab alone improved the induction of complete renal remission (Analysis 9.1.1) because the certainty of the evidence was very low.
Secondary outcomes
Similarly, it is uncertain if rituximab plus cyclophosphamide improved the induction of partial renal remission (Analysis 9.1.2), reduced major infection (Analysis 9.2.1) and herpes zoster virus infection (Analysis 9.2.2), or improved daily proteinuria (Analysis 9.3), CrCl (Analysis 9.4), and SCr (Analysis 9.5) compared to rituximab alone because the certainty of the evidence was very low.
10, 11, 12, & 13. Other biologics versus placebo (both arms included standard of care therapy (MMF or CPA))
Primary outcomes
It is uncertain if biologics: abatacept, atacicpet, laquinimod, ocrelizumab and sirukumab improved the induction of complete renal remission (Analysis 10.2.(1,2,3); Analysis 11.2.(1,2,3); Analysis 12.2.(1,2,3)), reduced death (Analysis 10.1.(1,2,3); Analysis 11.1.(1.2.3); Analysis 12.1.(1,2,3); Analysis 13.1), and reduced ESKD (Analysis 10.3.(1,2,3)) compared to standard of care therapy because the certainty of the evidence was very low.
Secondary outcomes
It was uncertain if the abatacept or ocrelizumab improved the induction of partial renal remission (Analysis 10.2.(4.5.6); Analysis 12.2.(4,5,6)) because the certainty of the evidence was very low. Likewise, it was uncertain if the biologics compared to placebo plus standard of care therapy reduced renal relapse (Analysis 10.3.4); major infection (Analysis 10.4.(1,2,3); Analysis 12.3.(1,2,3); Analysis 13.2), herpes zoster virus infection (Analysis 10.5), malignancy (Analysis 13.3), and diarrhoea (Analysis 13.4) because the certainty of the evidence was very low.
It is uncertain if abatacept with standard of care therapy compared to placebo with standard of care therapy improved the physical and mental component of the health‐related quality of life (SF‐36) (Analysis 10.6) and disease activity (BILAG) (Analysis 10.7) because the certainty of the evidence was very low.
14. Intravenous versus oral cyclophosphamide
Primary outcomes
We were unable to determine if IV cyclophosphamide compared to oral cyclophosphamide reduced death (Analysis 14.1) because the certainty of the evidence was very low. IV cyclophosphamide compared to oral cyclophosphamide may have made little or no difference to ESKD (Analysis 14.2.1 (2 studies, 67 participants): RR 0.23, 95% CI 0.04 to 1.28; I2 = 0%) (low certainty evidence).
Secondary outcomes
For adverse renal outcomes, IV cyclophosphamide may have made little or no difference to doubling of SCr (Analysis 14.2.2 (2 studies, 67 participants): RR 0.67, 95% CI 0.23 to 1.98; I2 = 0%) (low certainty evidence). It is uncertain if IV compared to oral cyclophosphamide reduced the deterioration of kidney function (Analysis 14.2.3) and improved the achievement of stable kidney function (Analysis 14.3) because the certainty of the evidence was very low. For safety outcomes, IV compared to oral cyclophosphamide may have made little or no difference to ovarian failure (Analysis 14.4 (2 studies, 56 participants): RR 0.70, 95% CI 0.37 to 1.30; I2 = 0%) and major infection (Analysis 14.5.1 (2 studies, 67 participants): RR 1.16, 95% CI 0.47 to 2.90; I2 = 0%) (low certainty evidence), and it is uncertain if IV cyclophosphamide reduced herpes zoster virus infection (Analysis 14.5.2), malignancy (Analysis 14.6), bladder toxicity (Analysis 14.7), and GI upset (Analysis 14.8.1) because the certainty of the evidence was very low.
15. High versus low dose cyclophosphamide
Primary outcomes
Compared to high dose cyclophosphamide, the use of low dose cyclophosphamide may have been as effective in inducing complete renal remission (Analysis 15.2.1 (3 studies, 267 participants): RR 1.09, 95% CI 0.63 to 1.86; I2 = 67%) and may have made little or no difference to ESKD (Analysis 15.3.1 (2 studies, 135 participants): RR 0.49, 95% CI 0.05 to 5.20) (low certainty evidence). However, it is uncertain if compared to high dose cyclophosphamide, low dose cyclophosphamide reduced ESKD at 5 years (Analysis 15.3.2) and 10 years (Analysis 15.3.3), and reduced death at 6 months (Analysis 15.1.1), 12 months (Analysis 15.1.2), 5 years (Analysis 15.1.3), and 10 years (Analysis 15.1.4) because the certainty of the evidence was very low.
Secondary outcomes
Low dose cyclophosphamide may have made little or no difference to efficacy outcomes of partial renal remission (Analysis 15.2.2 (3 studies, 267 participants): RR 0.88, 95% CI 0.69 to 1.14; I2 = 0%) and stabilisation of kidney function at 3 years (Analysis 15.4.1 (1 study, 89 participants): RR 0.72, 95% CI 0.50 to 1.03), and at 5 years (Analysis 15.4.2 (1 study, 85 participants): RR 0.96, 95% 0.77 to 1.20) compared to high dose cyclophosphamide (low certainty evidence). It is uncertain if low dose cyclophosphamide improved daily proteinuria (Analysis 15.12: 3 studies, 242 participants), CrCl (Analysis 15.13: 1 study, 177 participants), and SCr (Analysis 15.14 (3 studies, 247 participants) compared to high dose cyclophosphamide because the certainty of the evidence was very low.
Compared to high dose cyclophosphamide, low dose cyclophosphamide may have made little or no difference to renal relapse (Analysis 15.3.4 (3 studies, 211 participants): RR 2.75, 95% CI 0.47 to 15.98; I2 = 66%) (low certainty evidence). The risk of ovarian failure may be two times higher in patients on high dose cyclophosphamide compared to those on low dose cyclophosphamide (Analysis 15.5 (4 studies, 299 participants): RR 1.73, 95% CI 0.70 to 4.31; I2 = 19%) (low certainty evidence). Compared to high dose cyclophosphamide, low dose cyclophosphamide may make little or no difference to major infection (Analysis 15.6.1 (4 studies, 327 participants): RR 1.44, 95% CI 0.83 to 2.49; I2 = 25%), herpes zoster virus infection (Analysis 15.6.2 (3 studies, 281 participants): RR 1.58, 95% CI 0.41 to 6.05), malignancy (Analysis 15.7 (2 studies, 206 participants): RR 1.44, 95% CI 0.09 to 23.31; I2 = 41%), and leucopenia (Analysis 15.8 (3 studies, 281 participants): RR 0.82, 95% CI 0.13 to 5.15; I2 = 51%) (low certainty evidence). It is uncertain if low dose cyclophosphamide use reduced bone toxicity (Analysis 15.9: 2 studies, 164 participants) compared to high dose cyclophosphamide because the certainty of the evidence was very low.
16. Standard versus reduced dose oral corticosteroid
One study compared standard versus reduced dose oral corticosteroid (MyLupus 2011).
Primary outcomes
It was uncertain if reduced dose oral corticosteroid compared to standard dose oral corticosteroid improved the induction of complete renal remission (Analysis 16.2.1: 81 participants) and reduced death (Analysis 16.1: 81 participants) because the certainty of the evidence was very low.
Secondary outcomes
It is uncertain of the effect of reduced dose oral corticosteroid compared to standard dose oral corticosteroid improved the induction of partial renal remission (Analysis 16.2.2: 81 participants), CrCl (Analysis 16.6: 74 participants), and SCr (Analysis 16.7: 81 participants), or reduced renal relapse (Analysis 16.3: 50 participants) because the certainty of the evidence was very low. For safety outcomes, compared to standard dose corticosteroids it was uncertain if reduced dose oral corticosteroids reduced major infection (Analysis 16.4.1: 81 participants), herpes zoster virus infection (Analysis 16.4.2: 81 participants), diarrhoea (Analysis 16.5.1: 81 participants), vomiting (Analysis 16.5.2: 81 participants), and nausea (Analysis 16.5.3: 81 participants) because the certainty of the evidence was very low
17. Intravenous versus oral corticosteroids
One study compared IV versus oral corticosteroids (Barron 1982).
It was uncertain if the use of pulsed methylprednisolone compared to oral corticosteroids alone reduced death (Analysis 17.1) or renal relapse (Analysis 17.2) because the certainty of the evidence was very low. The certainty of the evidence was downgraded because of the potential risk of bias, small sample size and small event numbers.
Other comparisons (18 to 25)
Older comparisons ‐ immunosuppressive agent plus corticosteroids versus corticosteroids alone (18 to 22), plasma exchange plus immunosuppression versus immunosuppression alone (23), plasma exchange (no immunosuppression) versus immunosuppression (24) and long versus short‐duration cyclophosphamide (25) ‐ have been reported in the original Cochrane review (Flanc 2004a) and can also be found in the Data and analyses section of this review.
Maintenance therapy
Main outcomes for maintenance therapy, graded by certainty of the evidence, are presented in summary of findings Table 3.
26. Azathioprine plus corticosteroid versus mycophenolate mofetil plus corticosteroid
Primary outcomes
Compared to MMF, azathioprine probably increased renal relapse (Analysis 26.2 (4 studies, 452 participants): RR 1.75, 95% CI 1.20 to 2.55; I2 = 0%) (moderate certainty evidence). However, it is uncertain if azathioprine compared to MMF reduced death Analysis 26.1) or ESKD because the certainty of the evidence was very low (Analysis 26.3).
Secondary outcomes
It is uncertain if azathioprine compared to MMF improved daily proteinuria (Analysis 26.12) because the certainty of the evidence was very low; while it may have increased doubling of SCr (Analysis 26.4 (4 studies, 452 participants): RR 2.19, 95% CI 1.03, 4.66; I2 = 0%) (low certainty evidence).
For safety outcomes, the use of azathioprine compared to MMF may have increased leucopenia (Analysis 26.8 (3 studies, 412 participants): RR 5.61, 95% CI 1.68 to 18.72; I2 = 0%) and may have made little or no difference to major infection (Analysis 26.6 (3 studies, 412 participants): RR 1.08, 95% CI 0.60 to 1.96; I2 = 0%), alopecia (Analysis 26.10 (3 studies, 412 participants): RR 0.95, 95% CI 0.46 to 1.95; I2 = 0%), nausea (Analysis 26.11.2 (2 studies, 307 participants): RR 1.08, 95% CI 0.65 to 1.80; I2 = 0%), and diarrhoea (Analysis 26.11.3 (2 studies, 307 participants): RR 0.74, 95% CI 0.31 to 1.73; I2 = 33%) (low certainty evidence). It is unclear if azathioprine compared to MMF reduced ovarian failure (Analysis 26.5), herpes zoster virus infection (Analysis 26.6.2), malignancy (Analysis 26.7), bone toxicity (Analysis 26.9), and vomiting (Analysis 26.11.4) because the certainty of the evidence was very low.
27, 28 & 29. Azathioprine plus corticosteroid versus cyclophosphamide, cyclosporin or tacrolimus plus corticosteroid
Primary outcomes
It is uncertain if azathioprine compared to cyclosporin, cyclophosphamide and tacrolimus made little or no difference to death (Analysis 27.1; Analysis 28.1; Analysis 29.1), ESKD (Analysis 27.2.1; Analysis 28.2.1), and renal relapse (Analysis 27.2.2; Analysis 28.2.2; Analysis 29.1.1) because the certainty of the evidence was very low.
Secondary outcomes
It is uncertain if azathioprine compared to cyclosporin, cyclophosphamide and tacrolimus made little or no difference to daily proteinuria (Analysis 27.6), CrCl (Analysis 28.4), disease activity (SLEDAI) (Analysis 27.7), doubling of SCr (Analysis 28.2.3), major infection (Analysis 27.3.1; Analysis 29.2.1), leucopenia (Analysis 27.4), bladder toxicity (Analysis 28.3), and GI disturbance (Analysis 27.5.1; Analysis 29.3.1) because the certainty of the evidence was very low.
30. Prednisone withdrawal versus prednisone continuation
Primary outcomes
It is uncertain if prednisone withdrawal compared to prednisone continuation made little or no difference to renal and non‐renal relapse (Analysis 30.1) because the certainty of the evidence was very low.
Secondary outcomes
It is uncertain if prednisone withdrawal compared to prednisone continuation made little or no difference to major infection (Analysis 30.2) because the certainty of the evidence was very low.
31. Intravenous immunoglobulin versus intravenous cyclophosphamide
Secondary outcomes
It is uncertain if IV immunoglobulin compared to IV cyclophosphamide improved SCr, CrCl or proteinuria (Analysis 31.1; Analysis 31.2; Analysis 31.3) because the certainty of the evidence was very low.
Three studies reported health‐related quality of life, one study reported fatigue and 21 studies reported disease activity. Given the heterogeneity of reporting of these outcomes, the results have been presented in tables (Table 1; Table 2; Table 3).
| Study ID | Comparison | Therapy | Measure | Time point | Description of results |
| Abatacept versus placebo | Induction | SF‐36 physical and mental component (mean ± SD) | 6 months |
| |
| Abatacept versus placebo | Induction | SF‐36 (adjusted mean change ± SE) | 12 months |
| |
| Rituximab versus placebo | Induction | SF‐36 ‐ physical functioning (mean change ± SD) | 12 months |
|
| Study ID | Comparison | Therapy | Measure | Time point | Description of results |
| Abatacept versus placebo | Induction | Fatigue VAS (adjusted mean change ± SE) | 6 months |
| |
| Fatigue severity score (adjusted mean change ± SE) |
|
VAS ‐ visual analogue scale
| Study ID | Comparison | Measure | Time point | Description of results |
| Induction therapy | ||||
| Abatacept versus placebo | BILAG (mean ± SD) | 6 months |
| |
| MMF versus IV CPA | SLEDAI (mean change ± SD) | 6 months |
| |
| Leflunomide versus CPA | SLEDAI | 6 months | "SLEDAI scores were reduced" | |
| MMF versus IV CPA | SLAM (mean change ± SD) | 6 months |
| |
| IV CPA versus AZA | SLEDAI | 24 months | “SLEDAI and VAS scores did not differ between groups and decreased significantly and paralleled each other (r = 0.673, P<0.01)” | |
| TAC versus IC CPA | SLEDAI | 6 months | “SLEDAI level of FK506 (TAC) group is better than that of CPA group, (P<0.05)” | |
| High CPA versus low CPA | ECLAM | 12 months | “ECLAM score significantly improved in both groups during the first year of follow‐up. No significant difference was noted between patients in the low‐dose and high‐dose IV CYC groups for any of the parameters examined (P>0.05)” | |
| MMF versus TAC | SLEDAI‐2K (mean ± SD) | 12 months |
| |
| Rituximab versus rituximab + CPA | SLEDAI (mean ± SD) | 12 months |
| |
| MMF versus TAC versus IV CPA | SLEDAI (mean ± SD) | 6 months |
| |
| MMF + TAC versus IV CPA | SLEDAI (mean change ± SD) | 6 months |
| |
| PEX versus IA | SLEDAI | 6 months | “The SLEDAI gap between the study groups remained the same throughout the study. The improvements in SLEDAI score of both groups were also significantly demonstrated.” | |
| Rituximab versus placebo | BILAG (Time adjusted area under the curve minus baseline mean ± SD) | 12 months |
| |
| High‐dose CPA versus low‐dose CPA | Renal SLEDAI | 6 months | At 24 weeks, renal SLEDAI were similar between high‐dose and low‐dose cyclophosphamide | |
| MMF versus TAC | Renal SLEDAI (mean ± SD) | 6 months |
| |
| Extrarenal SLEDAI (mean ± SD) |
| |||
| Standard dose PRED versus reduced dose PRED | Global BILAG (mean ± SD) | 6 months | For both groups (reduced dose and standard dose corticosteroids) at the end of 6 months of treatment global BILAG reduced from 14 ± 5.4 to 5.0 ± 3.8 (P < 0.001) | |
| SLEDAI (mean ± SD) | For both groups (reduced dose and standard dose corticosteroids) at the end of 6 months of treatment SLEDAI reduced from16.2 ± 6.9 to 6.2 ± 5.1 (P < 0.001) | |||
| MMF versus IV CPA | SLEDAI (mean change ± SD) | 6 months |
| |
| MMF versus IV CPA | SLEDAI | 6 months | “SLEDAI improved significantly in both the groups over the study period, and there were no differences between the treatment groups.” | |
| Sirukumab versus placebo | SLEDAI‐2K | 6 months | “Eighteen patients (14 in the sirukumab group and 4 in the placebo group) had a SLEDAI‐2K RI‐50 response at any time through week 24.” | |
| Physician's and patients global assessment of disease activity | “Neither the patient’s nor the physician’s global assessment scores of disease activity showed notable improvement over time in either treatment group (data not shown)." | |||
| PE versus standard of care | SLAM (mean ± SD) | 12 months |
| |
| Maintenance therapy | ||||
| AZA versus MMF | SLEDAI | 36 months | "SLEDAI and ECLAM scores decreased similarly in both groups" | |
| ECLAM | ||||
| AZA versus CSA | SLEDAI (mean ± SD) | 24 months |
| |
AZA ‐ azathioprine; BILAG ‐ British Isles Lupus Assessment Group; CPA ‐ cyclophosphamide; CSA ‐ cyclosporin; ECLAM ‐ European Consensus Lupus Activity Measurement; IA ‐ immunoadsorption; MMF ‐ mycophenolate mofetil; IV ‐ intravenous; PE ‐ plasma exchange; PEX ‐ plasmapheresis; PRED ‐ corticosteroid; SLAM ‐ Systemic Lupus Activity Measure; SLEDAI ‐ Systemic Lupus Erythematosus Disease Activity Index; TAC ‐ tacrolimus
Discussion
The management of lupus nephritis has become complex and difficult to navigate because of the recent proliferation of new interventions and studies, which have been compared in numerous combination regimens. In the 1970s, it was demonstrated that compared with corticosteroids alone, the combined use of cyclophosphamide and corticosteroids induced remission, reduced ESKD and death, resulting in the use of this regimen as first‐line therapy for over 30 years.
Our earlier systematic review (Flanc 2004a) of immunosuppressive treatment of proliferative lupus nephritis found that adding cyclophosphamide or azathioprine to steroids improved or preserved kidney function when compared to steroids alone, and that plasma exchange conferred no additional benefit. In the subsequent update of the review (Henderson 2012), we found that MMF compared to cyclophosphamide had similar effects on death and inducing complete renal remission at six months, with a better safety profile as indicated by a reduced risk of ovarian failure, alopecia and leucopenia but with an increased risk of diarrhoea. Additionally, for maintenance therapy, MMF was more effective than azathioprine at preventing renal relapse with less leucopenia and no difference in other safety outcomes. Data regarding newer agents such as tacrolimus, cyclosporin and rituximab were insufficient to permit any meaningful conclusions at the time of publication. Numerous recent studies have examined the combination of MMF and tacrolimus and the use of biologics in induction therapy.
Summary of main results
As shown by eight studies involving over 800 participants with proliferative lupus nephritis in the analysis of this updated review, MMF dosed at 2 g to 3 g daily may have increased the induction of complete disease remission and stable kidney function at six months compared to cyclophosphamide, although the certainty of the evidence was low, because of study limitations and imprecision concerns, with the risk estimate including the possibility of no effect. Treatment with MMF compared to cyclophosphamide reduced the risk of alopecia but increased the risk of diarrhoea. These data justify the current use of MMF as the first‐line agent in proliferative lupus nephritis. MMF provided no benefit for other adverse events compared with cyclophosphamide, although its effect on ovarian failure is unclear. As the inclusion of one new study (Rathi 2016) has introduced greater imprecision in the ovarian failure treatment estimate, a total of three events has altered the summary estimate to suggest no benefit. This finding cannot be definitively stated as the treatment estimate is susceptible to change with addition of a few events; as a result, the certainty of the evidence has been downgraded to very low.
Compared to IV cyclophosphamide, the use of calcineurin inhibitors (tacrolimus and cyclosporin) may be as effective in inducing complete renal remission, while the combination of MMF and tacrolimus may improve the induction of complete renal remission, and achieving stable kidney function at six months. The generalisability of these findings may be limited as the two studies of combination therapy have largely included patients of Asian ethnicity, and have had serious concerns regarding selection bias and reporting bias. The safety of these therapies is unclear as the certainty of evidence is generally low to very low due to substantial imprecision in treatment effects and a small sample size and event numbers, limiting the applicability of the findings.
For maintenance therapy, MMF is probably more effective than azathioprine at preventing renal relapse with less leucopenia but there may be no difference in other outcomes (major infection, alopecia, and GI adverse events). The effectiveness and safety of many other interventions, including biologics (for example, rituximab and abatacept) and cyclosporin, is unclear because of very low certainty of the evidence, as they have only been trialled in a small number of studies with low numbers of events and inconsistent outcome reporting. The clinical role of these therapies therefore remains unclear and warrants caution.
Overall completeness and applicability of evidence
Our review was based on a highly sensitive electronic search of the Cochrane Kidney and Transplant's Specialised Register, which includes journal alerts and handsearching of all relevant conference proceedings, the reporting of existing studies evaluating induction and maintenance therapy of lupus nephritis means there are considerable gaps in the evidence. While some studies had moderate periods of follow‐up over one to two years, others were much shorter and inadequately powered to detect events in the clinically important outcomes. The average time to remission with cyclophosphamide is about 10 months (Ioannidis 2000); however, the follow‐up in the majority of induction therapy studies was six months. Furthermore, the risk of adverse events such as ovarian failure and the development of ESKD increases after six months, so there is considerable uncertainty in treatment effects across interventions, which results in an inability of patients and clinicians to evaluate the benefits and harms of therapy. Health‐related quality of life and fatigue are included in a core set of outcomes for SLE developed by OMERACT (Strand 2000). Yet, very few lupus nephritis studies have reported these patient‐reported outcomes. No standardised set of outcomes have been developed specifically for lupus nephritis studies. The development of a core set of outcomes by all stakeholders, including patients, with defined measures and definitions of renal remission (Liang 2006; van Vollenhoven 2017) would ease comparisons across studies and assist with building evidence for the induction and maintenance therapy of lupus nephritis. There were limited studies examining biologics, with sparse outcome data and confidence intervals were frequently very wide, indicating substantial uncertainty. Studies may not reflect usual clinical practice due to selection bias, with rituximab increasingly being used and showing benefit in patients who have not achieved remission with standard therapies (Weidenbusch 2013).
The disease spectrum and the proportion of patients within each class of lupus nephritis differed among studies. Furthermore, patient demographics varied among studies where environmental, socioeconomic, as well as clinical and genetic factors have been thought to play an important role explaining differences in the outcome of lupus nephritis by ethnicity. Comparing MMF with cyclophosphamide in induction therapy, six studies included primarily Asian patients (Bao 2008; Chan 2000; Li 2012; Liu 2015; Ong 2005; Rathi 2016; Sedhain 2016) and two of the largest studies comparing MMF with cyclophosphamide included higher proportions of African‐American and Hispanic patients (ALMS 2007; Ginzler 2005). Non‐Caucasian populations have a higher risk of relapse, death and CKD compared with Caucasian populations (Adler 2006; Contreras 2006) and often fail to respond to cyclophosphamide (Adler 2006; Contreras 2006; Dooley 1997). Ginzler 2005 included the largest percentage (56%) of patients of African‐American origin. This was the only study that showed a clear benefit in favour of MMF over IV cyclophosphamide for induction of remission. The Aspreva Lupus Management Study (ALMS) data which included 12% African‐American and 35% Hispanic patients, suggested interactions between group interventions and race that were not explained by differences in disease characteristics (ALMS 2007). ALMS 2007 was the only study to provide stratified results according to ethnicity and class of lupus in the update, and no studies provided stratified results according to severity of kidney impairment reducing the power to examine potential differences between these groups. Despite the lack of stratification of results, variation among studies could be considered a strength as despite clinical differences in population and histological classification, uniformity of effect demonstrated in the meta‐analysis suggest that the results were valid across race and class of lupus nephritis.
Quality of the evidence
We graded our confidence in the certainty of the evidence using the Grading of Recommendations Assessment, Development and Evaluation (GRADE) approach (GRADE 2011), which considers study limitations, imprecision, indirectness, inconsistency and publication bias. Overall, most studies had high or unclear risks of bias for most domains of study reporting assessed (Figure 2). The internal validity of the design, conduct and analysis of the included RCTs was difficult to assess in some studies because of the omission of important methodological details. No study adequately reported all domains of the risk of bias assessment so that elements of internal bias may be present in the meta‐analysis (Begg 1996; Moher 1999).
Estimated effects on efficacy and safety outcomes were frequently imprecise with confidence intervals that exhibited both considerable benefit and harm. The generalisability (directness) of the evidence was limited by the number of available studies on many treatment comparisons. Additionally, considerable clinical heterogeneity in interventions, definitions of remission and renal relapse and outcome reporting among studies hampered interpretation and presentation of important outcomes in this review. For example, comparing MMF with cyclophosphamide, there was variability among studies in therapeutic dosing, route of administration, definition of outcomes and co‐interventions. The small number of studies for some treatment comparisons limited the power of statistical testing and important inconsistencies between studies could not excluded. Publication bias (the effects of small studies on treatment effects) could not be assessed, new reports from hand‐searching conference proceedings in addition to those already searched by Cochrane Kidney and Transplant were included in the meta‐analysis to minimise publication bias. Overall, based on important limitations, we have generally moderate to very low confidence in the certainty of the evidence for the benefits and harms of induction and maintenance therapy in people with proliferative lupus nephritis.
Potential biases in the review process
Although this systematic review is reported using Cochrane methods and includes a comprehensive evidence summary for this topic, the review has limitations that might be considered. Firstly, the analysis was limited by the reporting of outcomes in the primary studies. For example, the definitions of renal remission were variable across studies. While for the analysis of these outcomes, there was evidence of low heterogeneity, indicating the meta‐analysis was appropriate, the small number of studies for treatment comparisons in this review may limit the statistical power to detect heterogeneity, and as a result it may still be present. Second, incomplete reporting of outcomes also limits the power of this review to detect differences among interventions. For example, although eight studies with 828 participants compared MMF with IV cyclophosphamide in induction therapy, only three reported on ovarian failure and one on doubling of SCr. Finally, different treatment effects for patients of different ethnic backgrounds has been hypothesised and observed (Isenberg 2010), although it could not be explored in this systematic review because of insufficient data for ethnicity in the original study reports to perform meta‐regression analyses.
Agreements and disagreements with other studies or reviews
In contrast to previous meta‐analyses (Mak 2009; Moore 2006), we re‐organised interventions according to treatments for induction of disease remission or maintenance therapy, which better reflects clinical practice. Broad inclusion criteria also helped explore the totality of evidence available, rather than limiting meta‐analysis by specific immunosuppression regimens as have previously published systematic reviews (Cao 2015; Deng 2012; Feng 2013; Hannah 2016; Kamanamool 2010; Lee 2010; Lee 2011; Liu 2012; Mak 2009; Maneiro 2014; Moore 2006; Radhakrishnan 2010; Touma 2011; Walsh 2007; Zhang 2016; Zhou 2011; Zhu 2007). A review of systematic reviews of meta‐analyses of RCTs and observational studies (Chen 2017) also showed that induction therapy with MMF compared to IV cyclophosphamide had a higher response rate and decreased alopecia. However, in contrast, the review found that MMF decreased ovarian failure and leucopenia, and calcineurin inhibitors (tacrolimus) increased complete remission and decreased ovarian failure and GI adverse events. These differences may be because the other overview included systematic reviews of observational studies and did not assess the certainty of the available evidence, and we included more recent RCTs in our review. For example, our review included Rathi 2016, which introduced further uncertainty regarding the outcomes of ovarian failure and leucopenia for MMF versus cyclophosphamide induction therapy.
Similar findings between this review and recent network meta‐analysis strengthen the conclusion that there is inconclusive evidence for therapy based on treatment effects on important safety outcomes and that MMF is the most effective therapy in maintaining disease remission (Palmer 2017; Tian 2015). While, some network meta‐analyses found similar findings in that there may be no difference between MMF, calcineurin inhibitors or their combination in inducing renal remission compared to cyclophosphamide (Tian 2014; Singh 2016), other network meta‐analyses have found that these therapies may be more effective than cyclophosphamide in inducing renal remission (Lee 2015; Palmer 2017). As there are vast options available for treatment, of which some have not been directly compared, a network meta‐analysis may allow for greater certainty about all treatment options through the use of indirect evidence. Although, given the small number of studies, an imbalance of evidence in the network, particularly tacrolimus alone or its combination with MMF may affect the power and reliability for the overall analysis, and also the network meta‐analysis may be underpowered to check for statistical heterogeneity, leading to incoherence between direct and indirect results. Considering the apparent lack of evidence and possible incoherency, the results from the network meta‐analysis should be interpreted with a degree of caution (Mills 2013).

Study flow diagram.
*Non‐RCTs have been deleted from this update
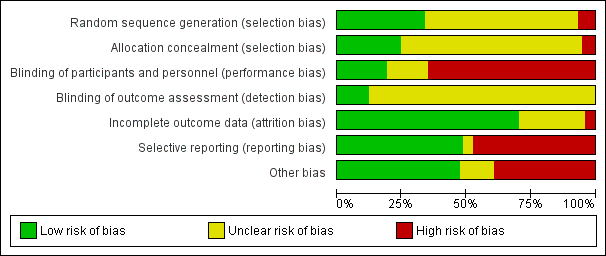
Risk of bias graph: review authors' judgements about each risk of bias item presented as percentages across all included studies.

Comparison 1 Mycophenolate mofetil (MMF) versus IV cyclophosphamide (CPA), Outcome 1 Death.

Comparison 1 Mycophenolate mofetil (MMF) versus IV cyclophosphamide (CPA), Outcome 2 Remission.

Comparison 1 Mycophenolate mofetil (MMF) versus IV cyclophosphamide (CPA), Outcome 3 Adverse renal outcomes.
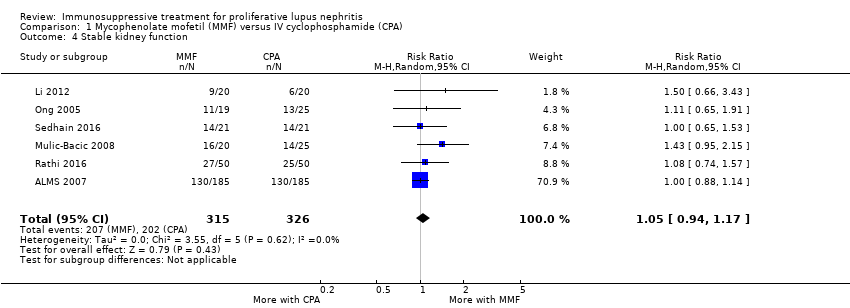
Comparison 1 Mycophenolate mofetil (MMF) versus IV cyclophosphamide (CPA), Outcome 4 Stable kidney function.
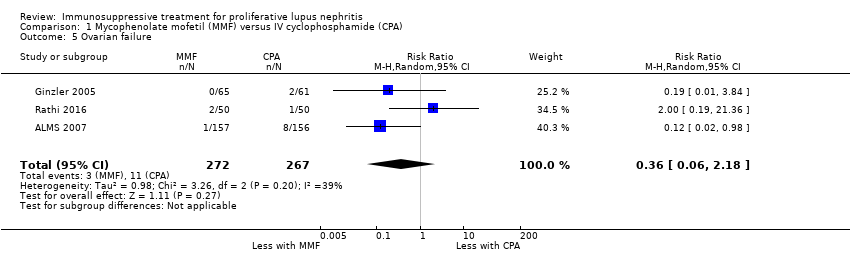
Comparison 1 Mycophenolate mofetil (MMF) versus IV cyclophosphamide (CPA), Outcome 5 Ovarian failure.
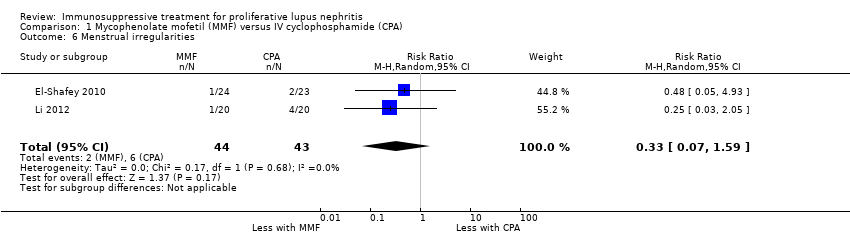
Comparison 1 Mycophenolate mofetil (MMF) versus IV cyclophosphamide (CPA), Outcome 6 Menstrual irregularities.

Comparison 1 Mycophenolate mofetil (MMF) versus IV cyclophosphamide (CPA), Outcome 7 Infection.

Comparison 1 Mycophenolate mofetil (MMF) versus IV cyclophosphamide (CPA), Outcome 8 Malignancy.

Comparison 1 Mycophenolate mofetil (MMF) versus IV cyclophosphamide (CPA), Outcome 9 Leucopenia.

Comparison 1 Mycophenolate mofetil (MMF) versus IV cyclophosphamide (CPA), Outcome 10 Bladder toxicity.
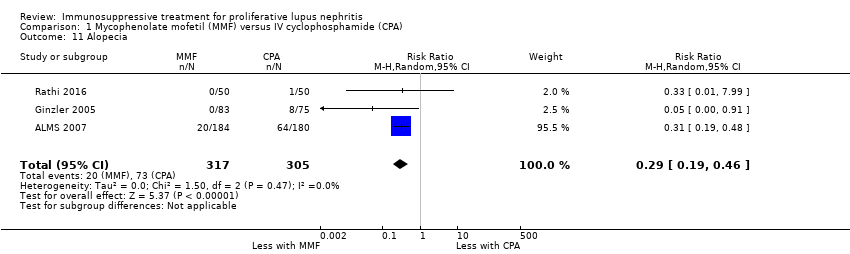
Comparison 1 Mycophenolate mofetil (MMF) versus IV cyclophosphamide (CPA), Outcome 11 Alopecia.

Comparison 1 Mycophenolate mofetil (MMF) versus IV cyclophosphamide (CPA), Outcome 12 Gastrointestinal (GI) adverse events.
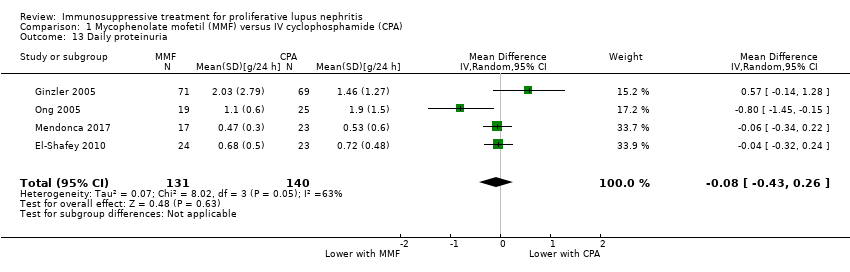
Comparison 1 Mycophenolate mofetil (MMF) versus IV cyclophosphamide (CPA), Outcome 13 Daily proteinuria.

Comparison 1 Mycophenolate mofetil (MMF) versus IV cyclophosphamide (CPA), Outcome 14 Serum creatinine.
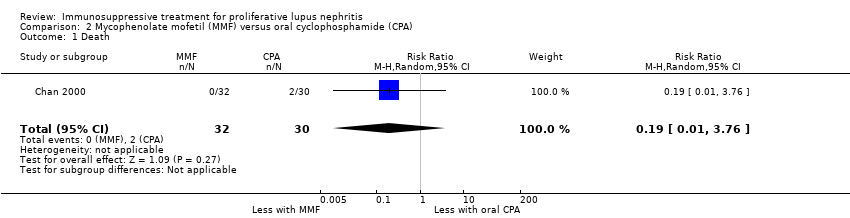
Comparison 2 Mycophenolate mofetil (MMF) versus oral cyclophosphamide (CPA), Outcome 1 Death.

Comparison 2 Mycophenolate mofetil (MMF) versus oral cyclophosphamide (CPA), Outcome 2 Remission.

Comparison 2 Mycophenolate mofetil (MMF) versus oral cyclophosphamide (CPA), Outcome 3 Adverse renal outcomes.
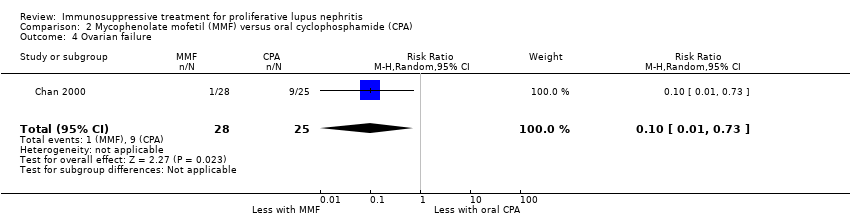
Comparison 2 Mycophenolate mofetil (MMF) versus oral cyclophosphamide (CPA), Outcome 4 Ovarian failure.
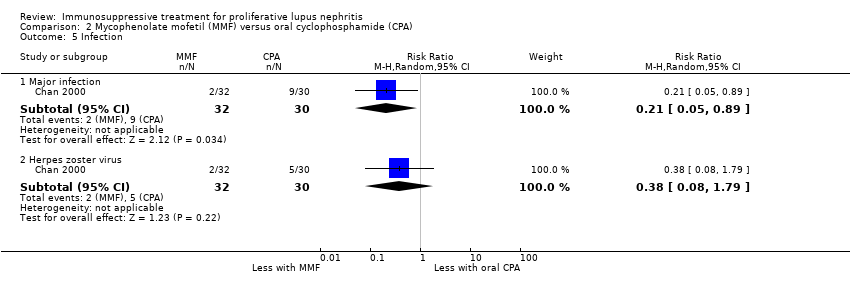
Comparison 2 Mycophenolate mofetil (MMF) versus oral cyclophosphamide (CPA), Outcome 5 Infection.
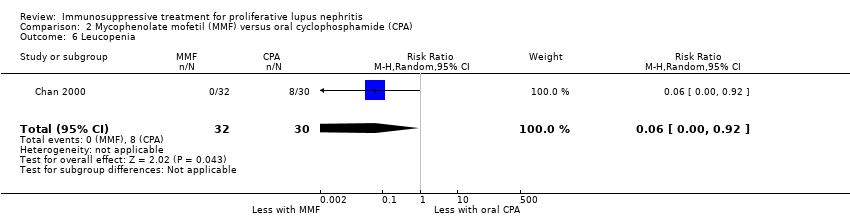
Comparison 2 Mycophenolate mofetil (MMF) versus oral cyclophosphamide (CPA), Outcome 6 Leucopenia.
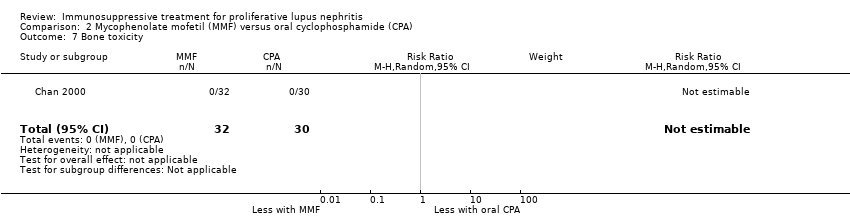
Comparison 2 Mycophenolate mofetil (MMF) versus oral cyclophosphamide (CPA), Outcome 7 Bone toxicity.

Comparison 2 Mycophenolate mofetil (MMF) versus oral cyclophosphamide (CPA), Outcome 8 Alopecia.

Comparison 2 Mycophenolate mofetil (MMF) versus oral cyclophosphamide (CPA), Outcome 9 Gastrointestinal (GI) adverse events.

Comparison 2 Mycophenolate mofetil (MMF) versus oral cyclophosphamide (CPA), Outcome 10 Daily proteinuria.

Comparison 3 Mycophenolate mofetil (MMF) + tacrolimus (TAC) versus IV cyclophosphamide (CPA), Outcome 1 Death.

Comparison 3 Mycophenolate mofetil (MMF) + tacrolimus (TAC) versus IV cyclophosphamide (CPA), Outcome 2 Remission.
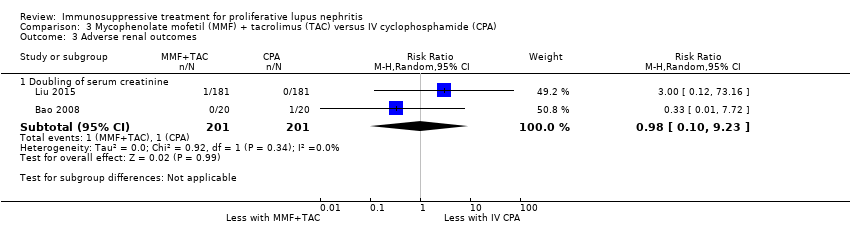
Comparison 3 Mycophenolate mofetil (MMF) + tacrolimus (TAC) versus IV cyclophosphamide (CPA), Outcome 3 Adverse renal outcomes.

Comparison 3 Mycophenolate mofetil (MMF) + tacrolimus (TAC) versus IV cyclophosphamide (CPA), Outcome 4 Stable kidney function.
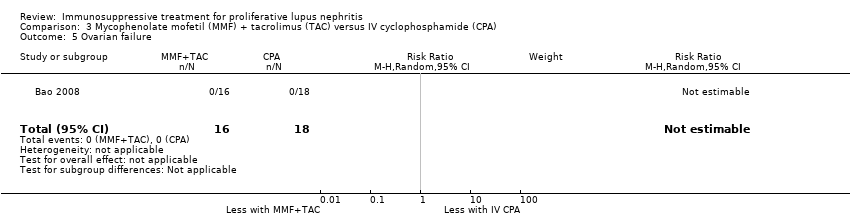
Comparison 3 Mycophenolate mofetil (MMF) + tacrolimus (TAC) versus IV cyclophosphamide (CPA), Outcome 5 Ovarian failure.

Comparison 3 Mycophenolate mofetil (MMF) + tacrolimus (TAC) versus IV cyclophosphamide (CPA), Outcome 6 Menstrual irregularities.

Comparison 3 Mycophenolate mofetil (MMF) + tacrolimus (TAC) versus IV cyclophosphamide (CPA), Outcome 7 Infection.

Comparison 3 Mycophenolate mofetil (MMF) + tacrolimus (TAC) versus IV cyclophosphamide (CPA), Outcome 8 Leucopenia.

Comparison 3 Mycophenolate mofetil (MMF) + tacrolimus (TAC) versus IV cyclophosphamide (CPA), Outcome 9 Bone toxicity.
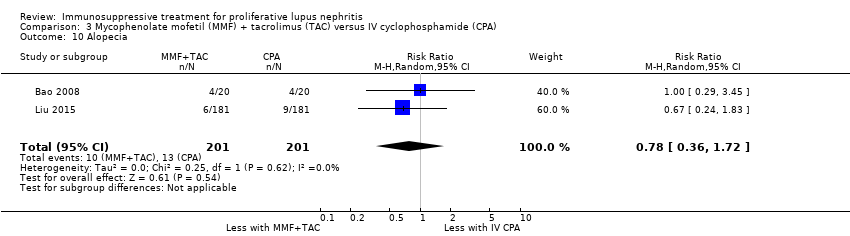
Comparison 3 Mycophenolate mofetil (MMF) + tacrolimus (TAC) versus IV cyclophosphamide (CPA), Outcome 10 Alopecia.

Comparison 3 Mycophenolate mofetil (MMF) + tacrolimus (TAC) versus IV cyclophosphamide (CPA), Outcome 11 Gastrointestinal (GI) adverse events.

Comparison 3 Mycophenolate mofetil (MMF) + tacrolimus (TAC) versus IV cyclophosphamide (CPA), Outcome 12 Daily proteinuria.

Comparison 4 Mycophenolate mofetil (MMF) + IV cyclophosphamide (CPA) versus IV CPA, Outcome 1 Death.
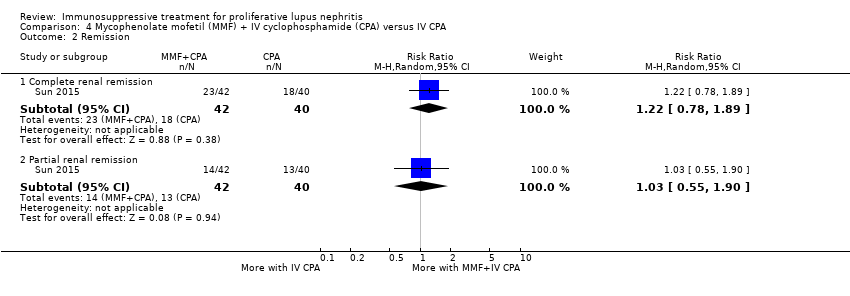
Comparison 4 Mycophenolate mofetil (MMF) + IV cyclophosphamide (CPA) versus IV CPA, Outcome 2 Remission.

Comparison 4 Mycophenolate mofetil (MMF) + IV cyclophosphamide (CPA) versus IV CPA, Outcome 3 Menstrual irregularities.

Comparison 4 Mycophenolate mofetil (MMF) + IV cyclophosphamide (CPA) versus IV CPA, Outcome 4 Infection.

Comparison 4 Mycophenolate mofetil (MMF) + IV cyclophosphamide (CPA) versus IV CPA, Outcome 5 Leucopenia.

Comparison 4 Mycophenolate mofetil (MMF) + IV cyclophosphamide (CPA) versus IV CPA, Outcome 6 Daily proteinuria.
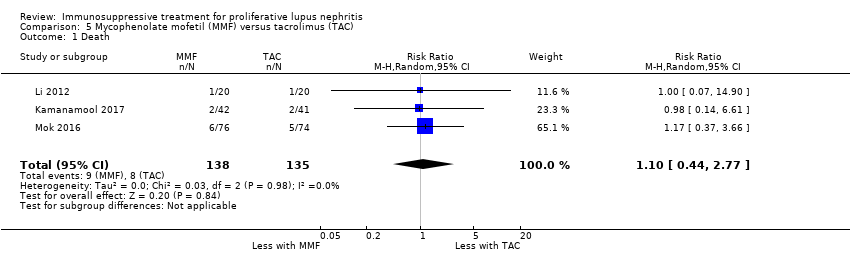
Comparison 5 Mycophenolate mofetil (MMF) versus tacrolimus (TAC), Outcome 1 Death.

Comparison 5 Mycophenolate mofetil (MMF) versus tacrolimus (TAC), Outcome 2 Remission.

Comparison 5 Mycophenolate mofetil (MMF) versus tacrolimus (TAC), Outcome 3 Adverse renal outcomes.
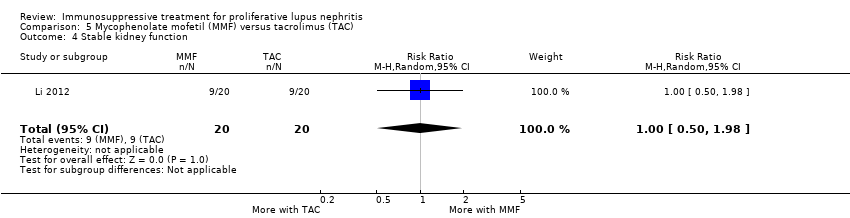
Comparison 5 Mycophenolate mofetil (MMF) versus tacrolimus (TAC), Outcome 4 Stable kidney function.

Comparison 5 Mycophenolate mofetil (MMF) versus tacrolimus (TAC), Outcome 5 Menstrual irregularities.

Comparison 5 Mycophenolate mofetil (MMF) versus tacrolimus (TAC), Outcome 6 Infection.
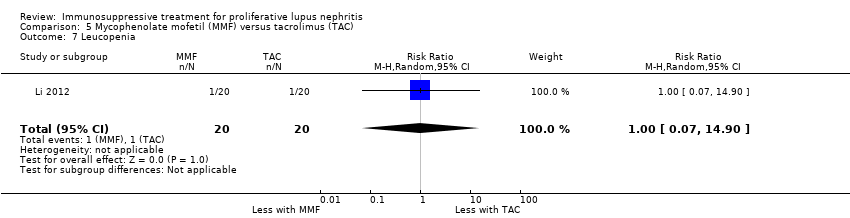
Comparison 5 Mycophenolate mofetil (MMF) versus tacrolimus (TAC), Outcome 7 Leucopenia.

Comparison 5 Mycophenolate mofetil (MMF) versus tacrolimus (TAC), Outcome 8 Alopecia.

Comparison 5 Mycophenolate mofetil (MMF) versus tacrolimus (TAC), Outcome 9 Daily proteinuria (at 24 weeks).

Comparison 5 Mycophenolate mofetil (MMF) versus tacrolimus (TAC), Outcome 10 Disease activity.

Comparison 5 Mycophenolate mofetil (MMF) versus tacrolimus (TAC), Outcome 11 Serum creatinine.

Comparison 5 Mycophenolate mofetil (MMF) versus tacrolimus (TAC), Outcome 12 Creatinine clearance.

Comparison 6 Calcineurin inhibitors (CNI) versus IV cyclophosphamide (CPA), Outcome 1 Death.

Comparison 6 Calcineurin inhibitors (CNI) versus IV cyclophosphamide (CPA), Outcome 2 Remission.

Comparison 6 Calcineurin inhibitors (CNI) versus IV cyclophosphamide (CPA), Outcome 3 Adverse renal outcomes.
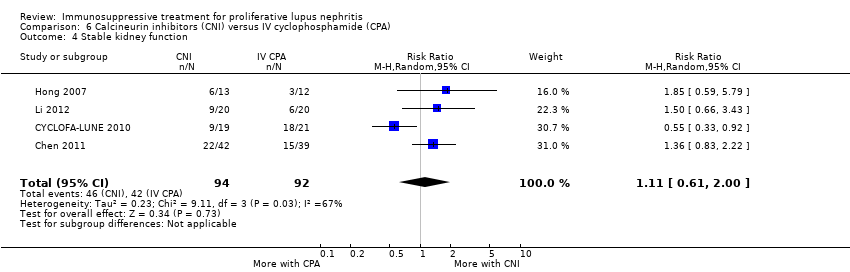
Comparison 6 Calcineurin inhibitors (CNI) versus IV cyclophosphamide (CPA), Outcome 4 Stable kidney function.

Comparison 6 Calcineurin inhibitors (CNI) versus IV cyclophosphamide (CPA), Outcome 5 Ovarian failure.
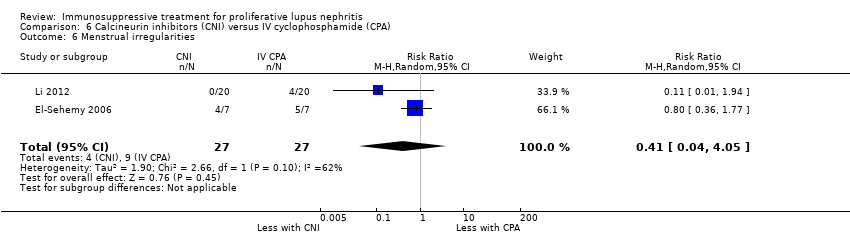
Comparison 6 Calcineurin inhibitors (CNI) versus IV cyclophosphamide (CPA), Outcome 6 Menstrual irregularities.
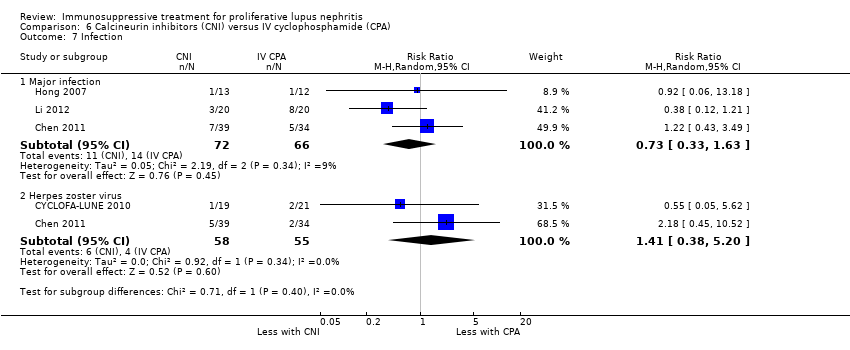
Comparison 6 Calcineurin inhibitors (CNI) versus IV cyclophosphamide (CPA), Outcome 7 Infection.
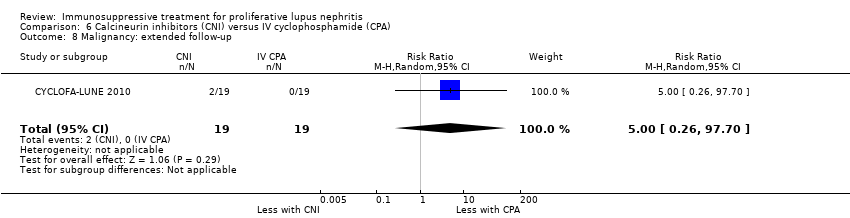
Comparison 6 Calcineurin inhibitors (CNI) versus IV cyclophosphamide (CPA), Outcome 8 Malignancy: extended follow‐up.
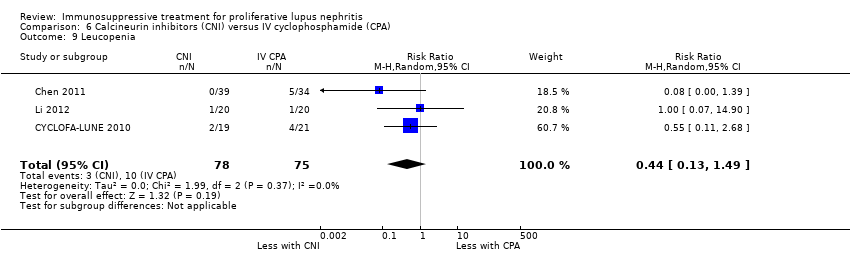
Comparison 6 Calcineurin inhibitors (CNI) versus IV cyclophosphamide (CPA), Outcome 9 Leucopenia.
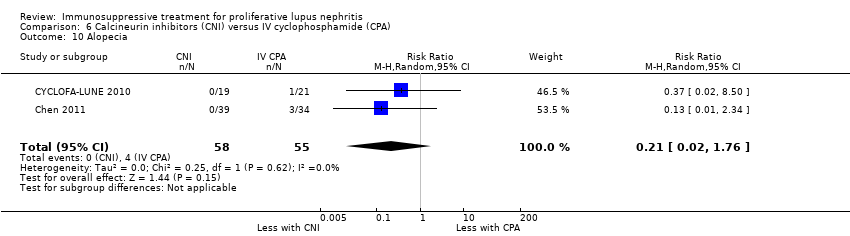
Comparison 6 Calcineurin inhibitors (CNI) versus IV cyclophosphamide (CPA), Outcome 10 Alopecia.

Comparison 6 Calcineurin inhibitors (CNI) versus IV cyclophosphamide (CPA), Outcome 11 Gastrointestinal (GI) adverse events.
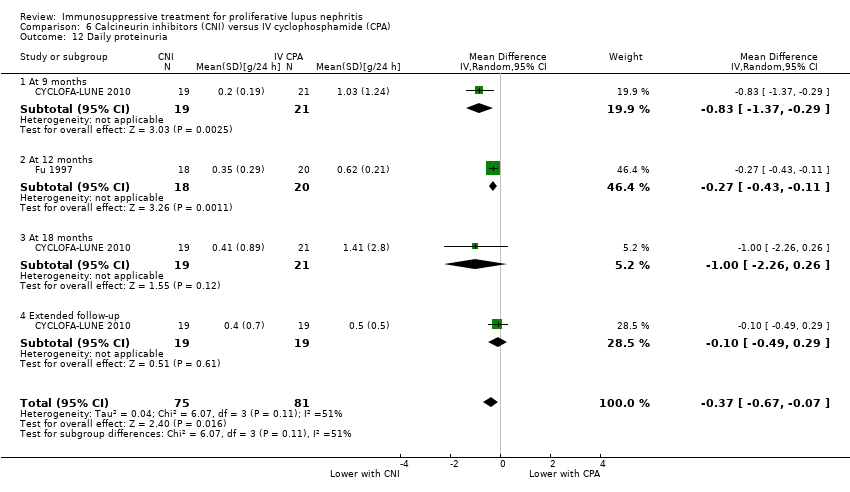
Comparison 6 Calcineurin inhibitors (CNI) versus IV cyclophosphamide (CPA), Outcome 12 Daily proteinuria.

Comparison 6 Calcineurin inhibitors (CNI) versus IV cyclophosphamide (CPA), Outcome 13 Creatinine clearance.

Comparison 6 Calcineurin inhibitors (CNI) versus IV cyclophosphamide (CPA), Outcome 14 Serum creatinine.
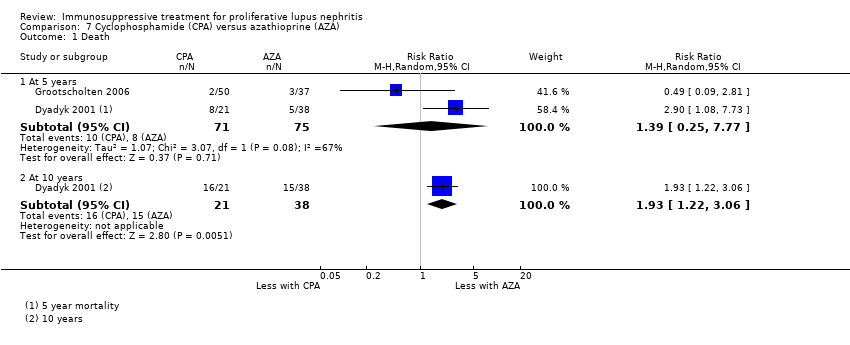
Comparison 7 Cyclophosphamide (CPA) versus azathioprine (AZA), Outcome 1 Death.

Comparison 7 Cyclophosphamide (CPA) versus azathioprine (AZA), Outcome 2 Remission in proteinuria.
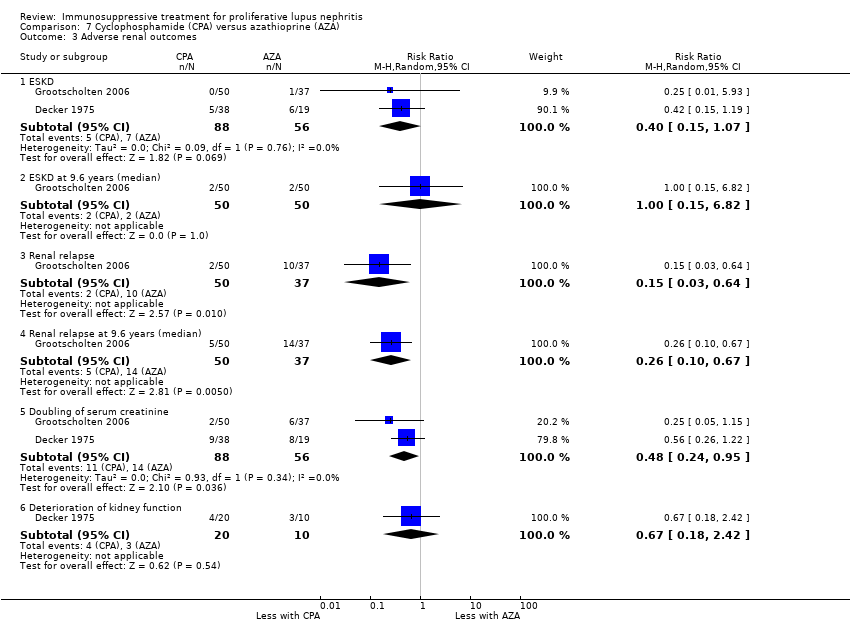
Comparison 7 Cyclophosphamide (CPA) versus azathioprine (AZA), Outcome 3 Adverse renal outcomes.

Comparison 7 Cyclophosphamide (CPA) versus azathioprine (AZA), Outcome 4 Stable kidney function.

Comparison 7 Cyclophosphamide (CPA) versus azathioprine (AZA), Outcome 5 Ovarian failure.

Comparison 7 Cyclophosphamide (CPA) versus azathioprine (AZA), Outcome 6 Menstrual irregularities.
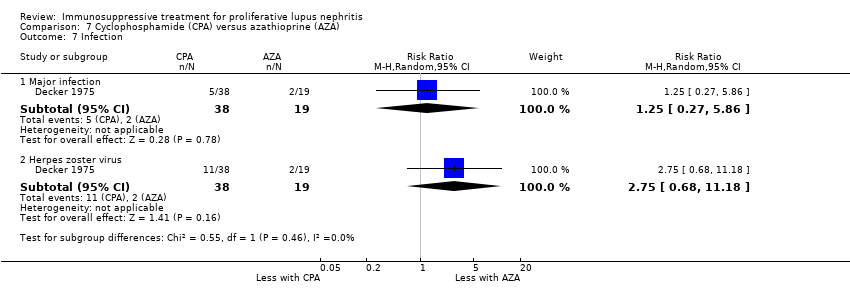
Comparison 7 Cyclophosphamide (CPA) versus azathioprine (AZA), Outcome 7 Infection.

Comparison 7 Cyclophosphamide (CPA) versus azathioprine (AZA), Outcome 8 Malignancy.

Comparison 7 Cyclophosphamide (CPA) versus azathioprine (AZA), Outcome 9 Bone toxicity.

Comparison 7 Cyclophosphamide (CPA) versus azathioprine (AZA), Outcome 10 Bladder toxicity.

Comparison 8 Rituximab (RTX) + mycophenolate mofetil (MMF) versus placebo + MMF, Outcome 1 Death.
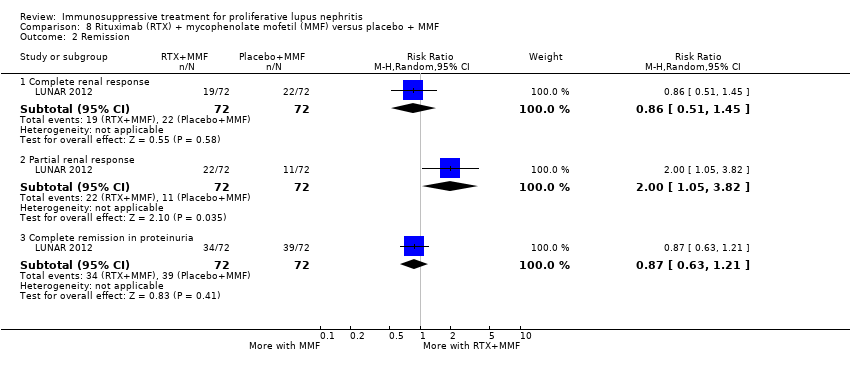
Comparison 8 Rituximab (RTX) + mycophenolate mofetil (MMF) versus placebo + MMF, Outcome 2 Remission.
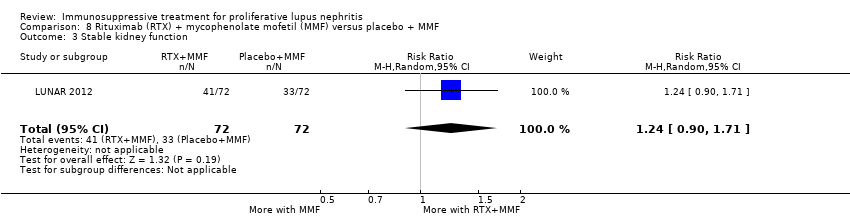
Comparison 8 Rituximab (RTX) + mycophenolate mofetil (MMF) versus placebo + MMF, Outcome 3 Stable kidney function.

Comparison 8 Rituximab (RTX) + mycophenolate mofetil (MMF) versus placebo + MMF, Outcome 4 Infection.

Comparison 8 Rituximab (RTX) + mycophenolate mofetil (MMF) versus placebo + MMF, Outcome 5 Leucopenia.

Comparison 9 Rituximab (RTX) + cyclophosphamide (CPA) versus RTX, Outcome 1 Remission.

Comparison 9 Rituximab (RTX) + cyclophosphamide (CPA) versus RTX, Outcome 2 Infection.

Comparison 9 Rituximab (RTX) + cyclophosphamide (CPA) versus RTX, Outcome 3 Daily proteinuria.
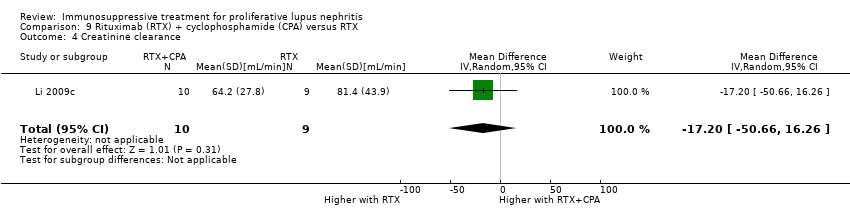
Comparison 9 Rituximab (RTX) + cyclophosphamide (CPA) versus RTX, Outcome 4 Creatinine clearance.

Comparison 9 Rituximab (RTX) + cyclophosphamide (CPA) versus RTX, Outcome 5 Serum creatinine.

Comparison 10 Abatacept + other immunosuppressive agent (IS) + versus placebo + other IS, Outcome 1 Death.

Comparison 10 Abatacept + other immunosuppressive agent (IS) + versus placebo + other IS, Outcome 2 Remission.

Comparison 10 Abatacept + other immunosuppressive agent (IS) + versus placebo + other IS, Outcome 3 Adverse renal outcomes.

Comparison 10 Abatacept + other immunosuppressive agent (IS) + versus placebo + other IS, Outcome 4 Major Infection.
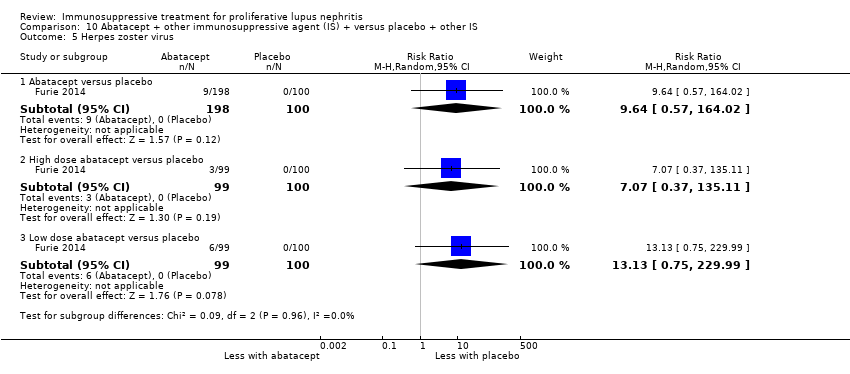
Comparison 10 Abatacept + other immunosuppressive agent (IS) + versus placebo + other IS, Outcome 5 Herpes zoster virus.

Comparison 10 Abatacept + other immunosuppressive agent (IS) + versus placebo + other IS, Outcome 6 Health‐related quality of life.

Comparison 10 Abatacept + other immunosuppressive agent (IS) + versus placebo + other IS, Outcome 7 Disease activity (BILAG).

Comparison 11 Laquinimod + other immunosuppressive agent (IS) versus placebo + other IS, Outcome 1 Death.

Comparison 11 Laquinimod + other immunosuppressive agent (IS) versus placebo + other IS, Outcome 2 Complete remission.

Comparison 12 Ocrelizumab + other immunosuppressive agent (IS) versus placebo + other IS, Outcome 1 Death.
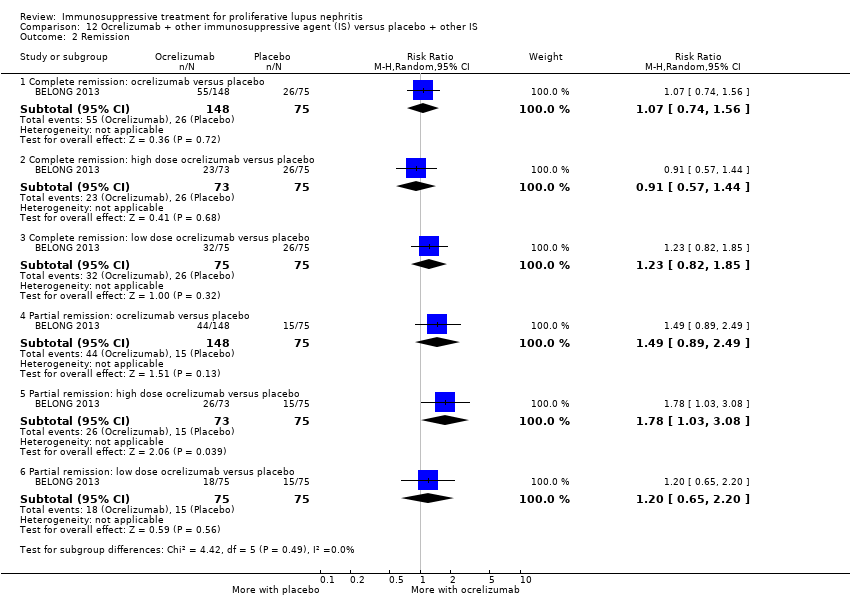
Comparison 12 Ocrelizumab + other immunosuppressive agent (IS) versus placebo + other IS, Outcome 2 Remission.
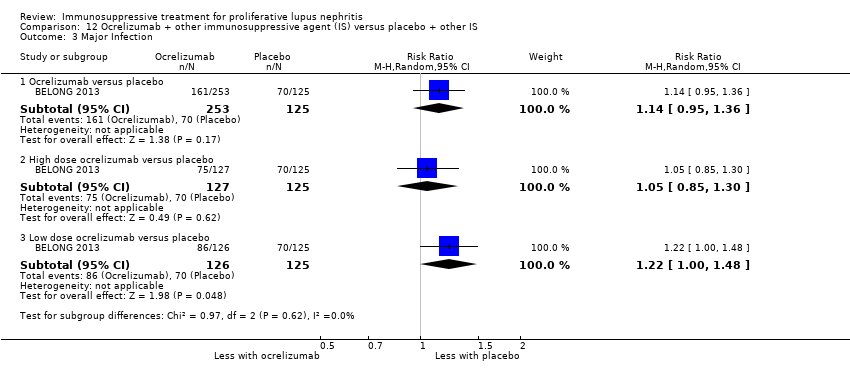
Comparison 12 Ocrelizumab + other immunosuppressive agent (IS) versus placebo + other IS, Outcome 3 Major Infection.

Comparison 13 Sirukumab + other immunosuppressive agent (IS) versus placebo + other IS, Outcome 1 Death.

Comparison 13 Sirukumab + other immunosuppressive agent (IS) versus placebo + other IS, Outcome 2 Infection.

Comparison 13 Sirukumab + other immunosuppressive agent (IS) versus placebo + other IS, Outcome 3 Malignancy.
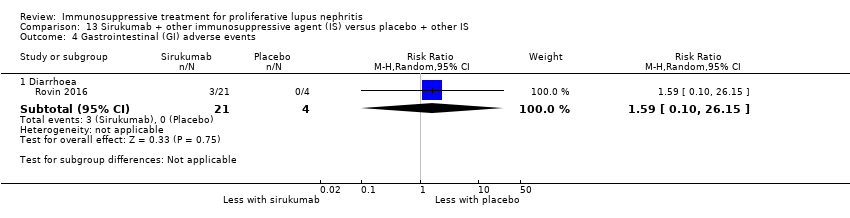
Comparison 13 Sirukumab + other immunosuppressive agent (IS) versus placebo + other IS, Outcome 4 Gastrointestinal (GI) adverse events.
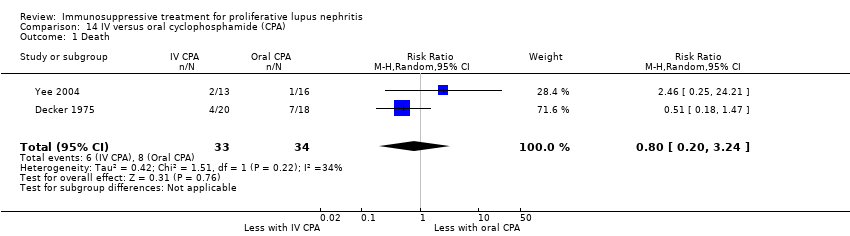
Comparison 14 IV versus oral cyclophosphamide (CPA), Outcome 1 Death.
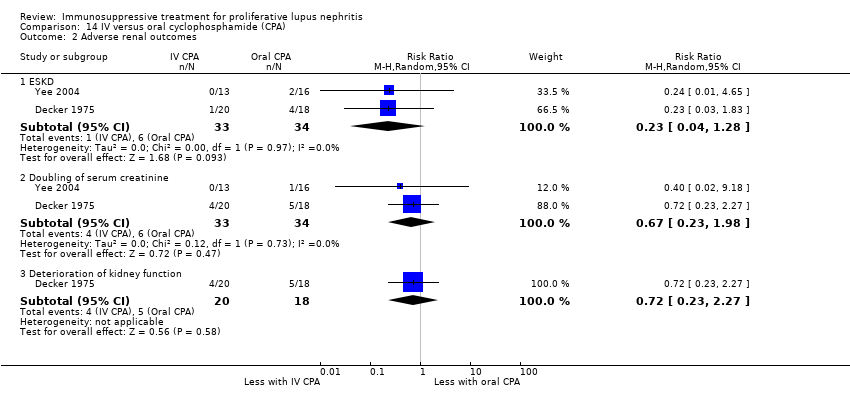
Comparison 14 IV versus oral cyclophosphamide (CPA), Outcome 2 Adverse renal outcomes.

Comparison 14 IV versus oral cyclophosphamide (CPA), Outcome 3 Stable kidney function.

Comparison 14 IV versus oral cyclophosphamide (CPA), Outcome 4 Ovarian failure.

Comparison 14 IV versus oral cyclophosphamide (CPA), Outcome 5 Infection.

Comparison 14 IV versus oral cyclophosphamide (CPA), Outcome 6 Malignancy.

Comparison 14 IV versus oral cyclophosphamide (CPA), Outcome 7 Bladder toxicity.

Comparison 14 IV versus oral cyclophosphamide (CPA), Outcome 8 Gastrointestinal (GI) adverse events.

Comparison 15 Low versus high dose cyclophosphamide (CPA), Outcome 1 Death.

Comparison 15 Low versus high dose cyclophosphamide (CPA), Outcome 2 Remission.

Comparison 15 Low versus high dose cyclophosphamide (CPA), Outcome 3 Adverse renal outcomes.
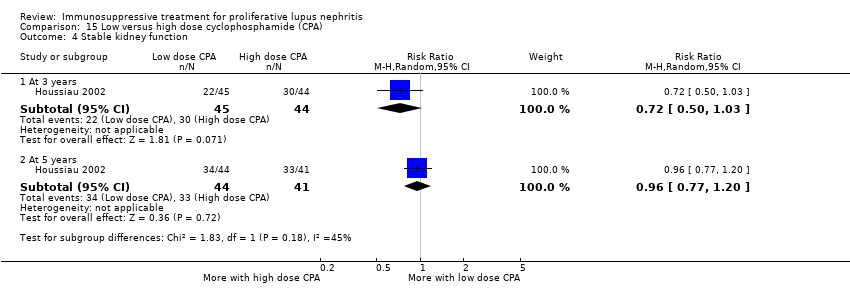
Comparison 15 Low versus high dose cyclophosphamide (CPA), Outcome 4 Stable kidney function.

Comparison 15 Low versus high dose cyclophosphamide (CPA), Outcome 5 Ovarian failure.

Comparison 15 Low versus high dose cyclophosphamide (CPA), Outcome 6 Infection.

Comparison 15 Low versus high dose cyclophosphamide (CPA), Outcome 7 Malignancy.
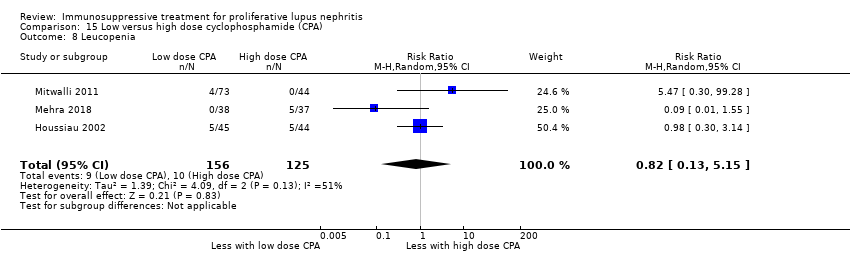
Comparison 15 Low versus high dose cyclophosphamide (CPA), Outcome 8 Leucopenia.

Comparison 15 Low versus high dose cyclophosphamide (CPA), Outcome 9 Bone toxicity.

Comparison 15 Low versus high dose cyclophosphamide (CPA), Outcome 10 Alopecia.

Comparison 15 Low versus high dose cyclophosphamide (CPA), Outcome 11 Gastrointestinal (GI) adverse events.
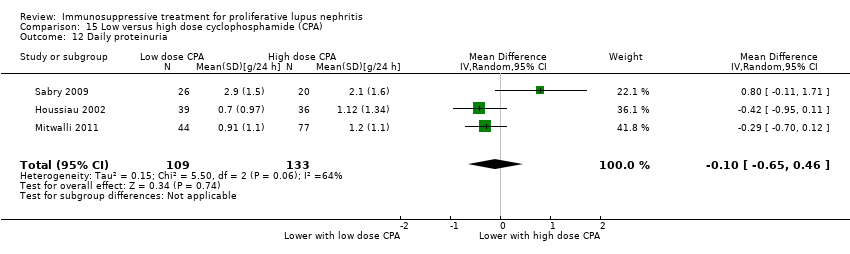
Comparison 15 Low versus high dose cyclophosphamide (CPA), Outcome 12 Daily proteinuria.

Comparison 15 Low versus high dose cyclophosphamide (CPA), Outcome 13 Creatinine clearance.

Comparison 15 Low versus high dose cyclophosphamide (CPA), Outcome 14 Serum creatinine.

Comparison 15 Low versus high dose cyclophosphamide (CPA), Outcome 15 Disease activity (SLEDAI).

Comparison 16 Standard versus reduced dose oral corticosteroids, Outcome 1 Death.
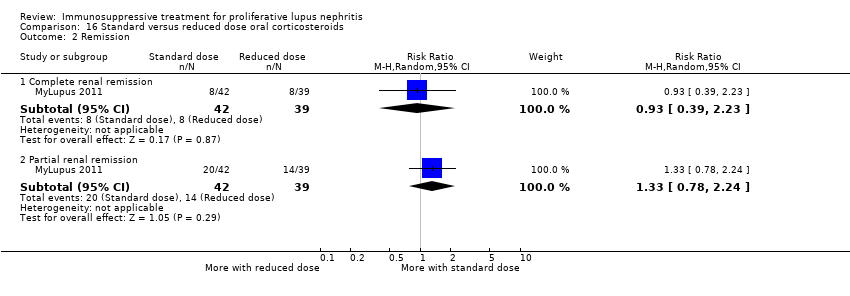
Comparison 16 Standard versus reduced dose oral corticosteroids, Outcome 2 Remission.

Comparison 16 Standard versus reduced dose oral corticosteroids, Outcome 3 Relapse.
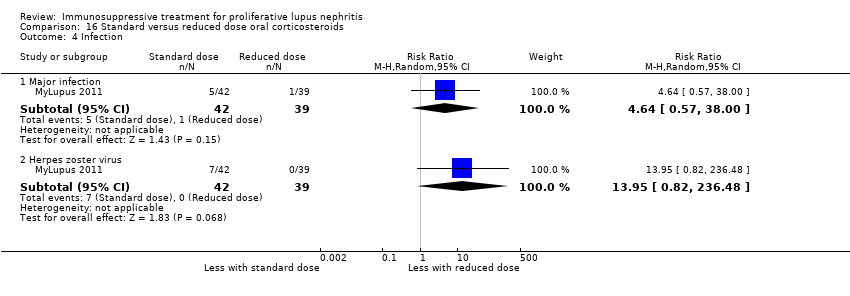
Comparison 16 Standard versus reduced dose oral corticosteroids, Outcome 4 Infection.

Comparison 16 Standard versus reduced dose oral corticosteroids, Outcome 5 Gastrointestinal (GI) adverse events.

Comparison 16 Standard versus reduced dose oral corticosteroids, Outcome 6 Creatinine clearance.

Comparison 16 Standard versus reduced dose oral corticosteroids, Outcome 7 Serum creatinine.

Comparison 17 IV versus oral corticosteroids, Outcome 1 Death.

Comparison 17 IV versus oral corticosteroids, Outcome 2 Adverse renal outcomes.

Comparison 18 Cyclophosphamide (CPA) + corticosteroids versus corticosteroids, Outcome 1 Death.

Comparison 18 Cyclophosphamide (CPA) + corticosteroids versus corticosteroids, Outcome 2 Complete remission of proteinuria.

Comparison 18 Cyclophosphamide (CPA) + corticosteroids versus corticosteroids, Outcome 3 Adverse renal outcomes.

Comparison 18 Cyclophosphamide (CPA) + corticosteroids versus corticosteroids, Outcome 4 Deterioration of kidney function.

Comparison 18 Cyclophosphamide (CPA) + corticosteroids versus corticosteroids, Outcome 5 Stable kidney function.
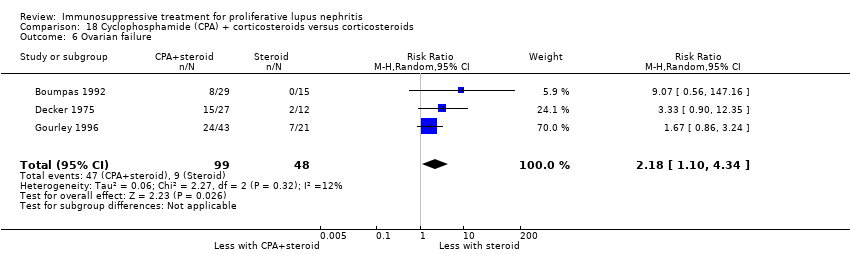
Comparison 18 Cyclophosphamide (CPA) + corticosteroids versus corticosteroids, Outcome 6 Ovarian failure.

Comparison 18 Cyclophosphamide (CPA) + corticosteroids versus corticosteroids, Outcome 7 Infection.

Comparison 18 Cyclophosphamide (CPA) + corticosteroids versus corticosteroids, Outcome 8 Malignancy.
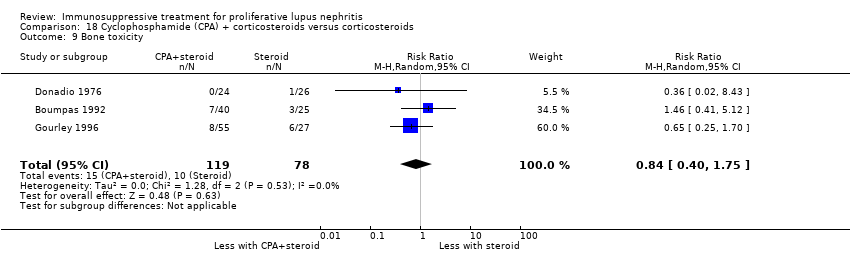
Comparison 18 Cyclophosphamide (CPA) + corticosteroids versus corticosteroids, Outcome 9 Bone toxicity.

Comparison 18 Cyclophosphamide (CPA) + corticosteroids versus corticosteroids, Outcome 10 Bladder toxicity.

Comparison 18 Cyclophosphamide (CPA) + corticosteroids versus corticosteroids, Outcome 11 Daily proteinuria.

Comparison 18 Cyclophosphamide (CPA) + corticosteroids versus corticosteroids, Outcome 12 Serum creatinine.
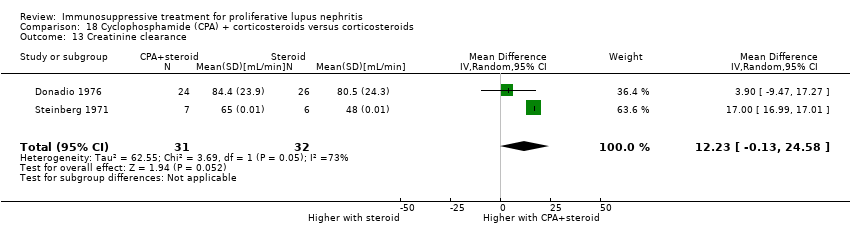
Comparison 18 Cyclophosphamide (CPA) + corticosteroids versus corticosteroids, Outcome 13 Creatinine clearance.

Comparison 19 Cyclophosphamide (CPA) + azathioprine (AZA) + corticosteroids versus corticosteroids alone, Outcome 1 Death.
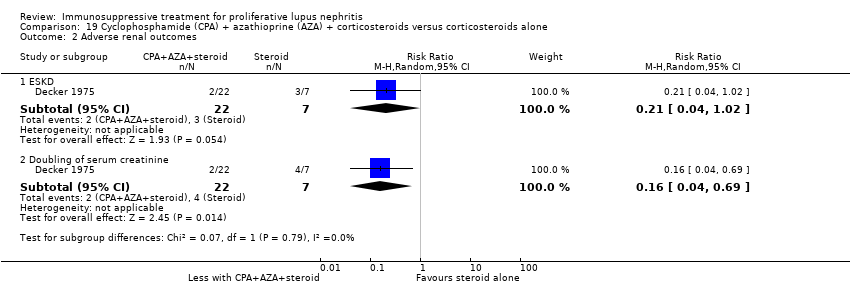
Comparison 19 Cyclophosphamide (CPA) + azathioprine (AZA) + corticosteroids versus corticosteroids alone, Outcome 2 Adverse renal outcomes.

Comparison 19 Cyclophosphamide (CPA) + azathioprine (AZA) + corticosteroids versus corticosteroids alone, Outcome 3 Stable kidney function.
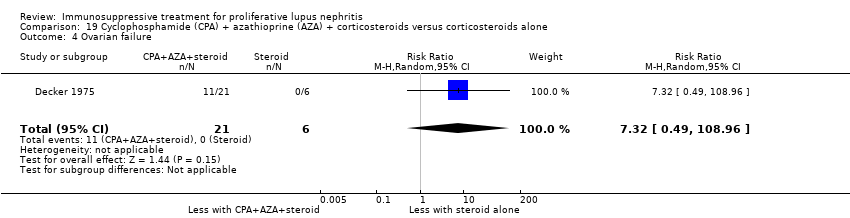
Comparison 19 Cyclophosphamide (CPA) + azathioprine (AZA) + corticosteroids versus corticosteroids alone, Outcome 4 Ovarian failure.

Comparison 19 Cyclophosphamide (CPA) + azathioprine (AZA) + corticosteroids versus corticosteroids alone, Outcome 5 Infection.

Comparison 19 Cyclophosphamide (CPA) + azathioprine (AZA) + corticosteroids versus corticosteroids alone, Outcome 6 Bladder toxicity.

Comparison 20 Azathioprine (AZA) + corticosteroids versus corticosteroids alone, Outcome 1 Death.

Comparison 20 Azathioprine (AZA) + corticosteroids versus corticosteroids alone, Outcome 2 Complete remission of proteinuria.
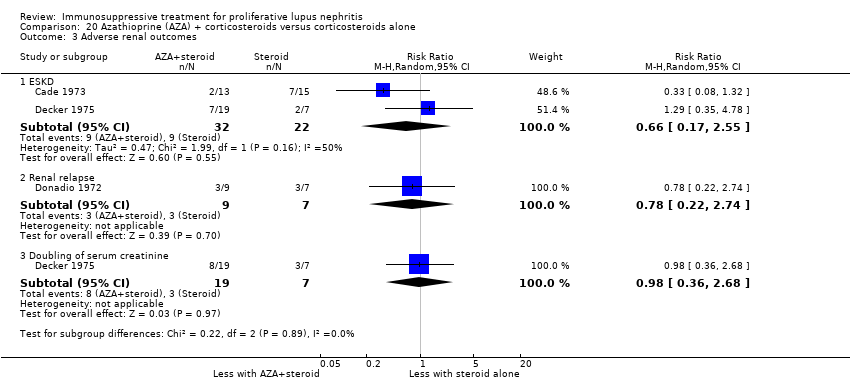
Comparison 20 Azathioprine (AZA) + corticosteroids versus corticosteroids alone, Outcome 3 Adverse renal outcomes.
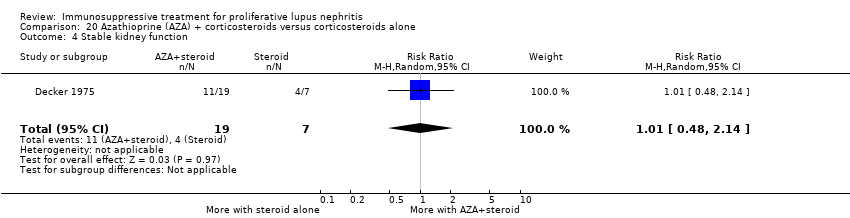
Comparison 20 Azathioprine (AZA) + corticosteroids versus corticosteroids alone, Outcome 4 Stable kidney function.
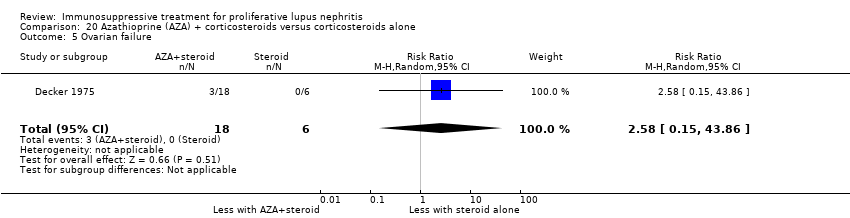
Comparison 20 Azathioprine (AZA) + corticosteroids versus corticosteroids alone, Outcome 5 Ovarian failure.

Comparison 20 Azathioprine (AZA) + corticosteroids versus corticosteroids alone, Outcome 6 Infection.

Comparison 20 Azathioprine (AZA) + corticosteroids versus corticosteroids alone, Outcome 7 Malignancy.
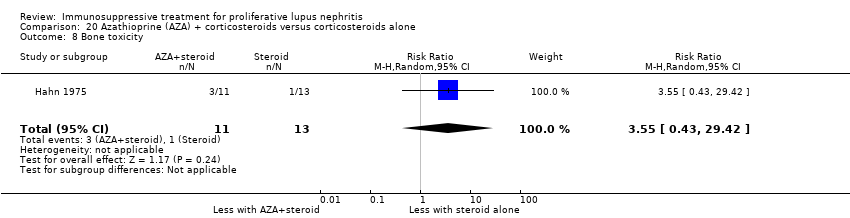
Comparison 20 Azathioprine (AZA) + corticosteroids versus corticosteroids alone, Outcome 8 Bone toxicity.

Comparison 20 Azathioprine (AZA) + corticosteroids versus corticosteroids alone, Outcome 9 Creatinine clearance.
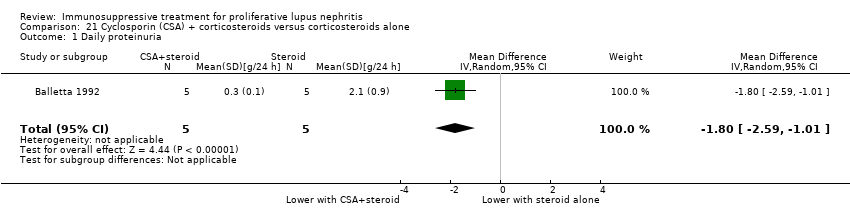
Comparison 21 Cyclosporin (CSA) + corticosteroids versus corticosteroids alone, Outcome 1 Daily proteinuria.

Comparison 21 Cyclosporin (CSA) + corticosteroids versus corticosteroids alone, Outcome 2 Serum creatinine.

Comparison 21 Cyclosporin (CSA) + corticosteroids versus corticosteroids alone, Outcome 3 Creatinine clearance.

Comparison 22 Misoprostol + corticosteroids versus corticosteroids alone, Outcome 1 Adverse renal outcomes.
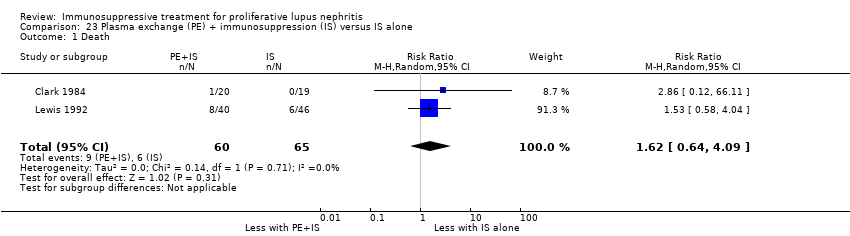
Comparison 23 Plasma exchange (PE) + immunosuppression (IS) versus IS alone, Outcome 1 Death.
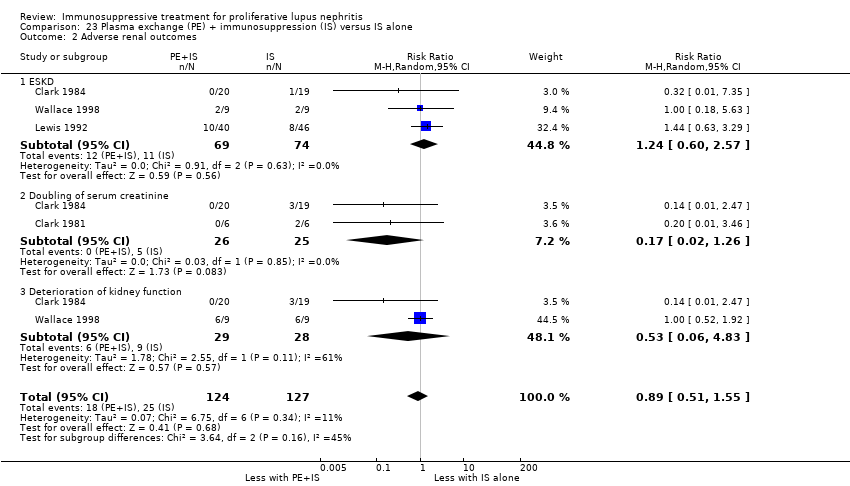
Comparison 23 Plasma exchange (PE) + immunosuppression (IS) versus IS alone, Outcome 2 Adverse renal outcomes.
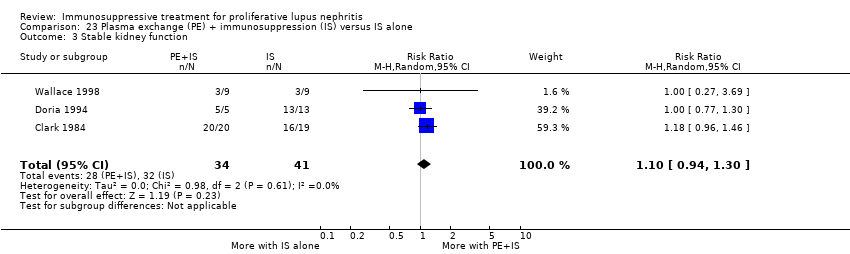
Comparison 23 Plasma exchange (PE) + immunosuppression (IS) versus IS alone, Outcome 3 Stable kidney function.
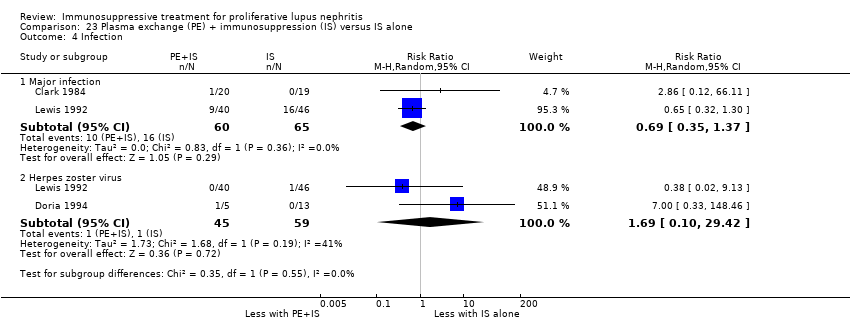
Comparison 23 Plasma exchange (PE) + immunosuppression (IS) versus IS alone, Outcome 4 Infection.
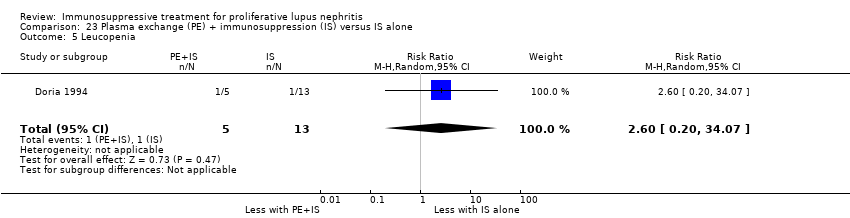
Comparison 23 Plasma exchange (PE) + immunosuppression (IS) versus IS alone, Outcome 5 Leucopenia.

Comparison 23 Plasma exchange (PE) + immunosuppression (IS) versus IS alone, Outcome 6 Daily proteinuria.

Comparison 23 Plasma exchange (PE) + immunosuppression (IS) versus IS alone, Outcome 7 Serum creatinine.
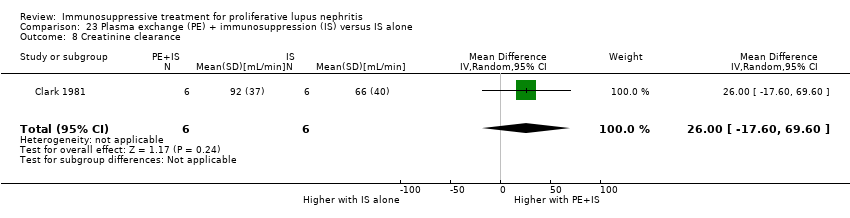
Comparison 23 Plasma exchange (PE) + immunosuppression (IS) versus IS alone, Outcome 8 Creatinine clearance.
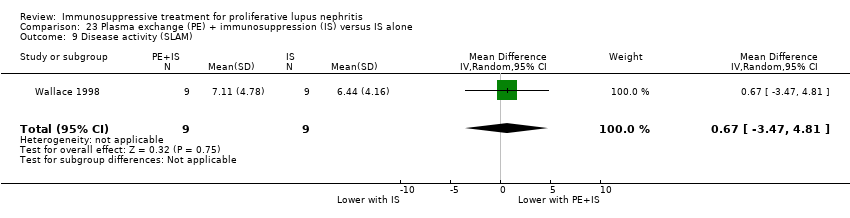
Comparison 23 Plasma exchange (PE) + immunosuppression (IS) versus IS alone, Outcome 9 Disease activity (SLAM).

Comparison 24 Plasma exchange (PE) versus immunosuppression (IS), Outcome 1 Adverse renal outcomes.
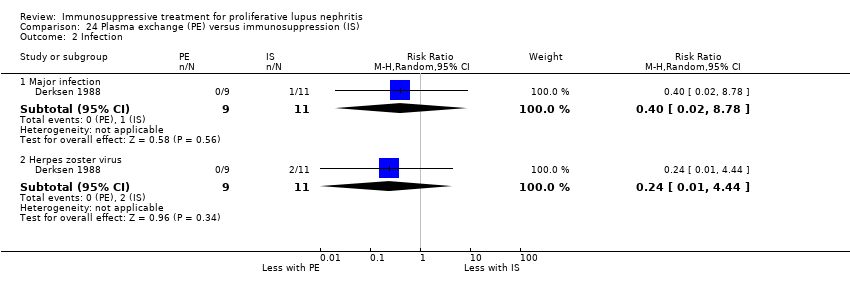
Comparison 24 Plasma exchange (PE) versus immunosuppression (IS), Outcome 2 Infection.

Comparison 24 Plasma exchange (PE) versus immunosuppression (IS), Outcome 3 Leucopenia.

Comparison 24 Plasma exchange (PE) versus immunosuppression (IS), Outcome 4 Alopecia.

Comparison 24 Plasma exchange (PE) versus immunosuppression (IS), Outcome 5 Daily proteinuria.

Comparison 24 Plasma exchange (PE) versus immunosuppression (IS), Outcome 6 Creatinine clearance.

Comparison 25 Long versus short duration cyclophosphamide (CPA), Outcome 1 Adverse renal outcomes.

Comparison 25 Long versus short duration cyclophosphamide (CPA), Outcome 2 Stable kidney function.
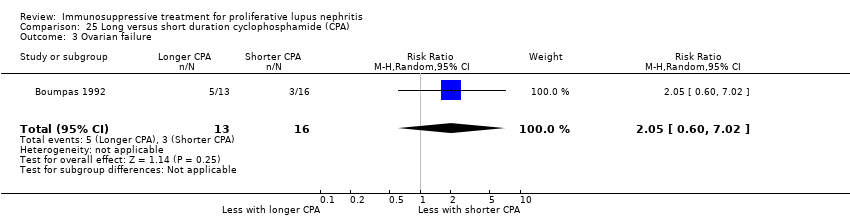
Comparison 25 Long versus short duration cyclophosphamide (CPA), Outcome 3 Ovarian failure.

Comparison 25 Long versus short duration cyclophosphamide (CPA), Outcome 4 Infection.

Comparison 25 Long versus short duration cyclophosphamide (CPA), Outcome 5 Malignancy.
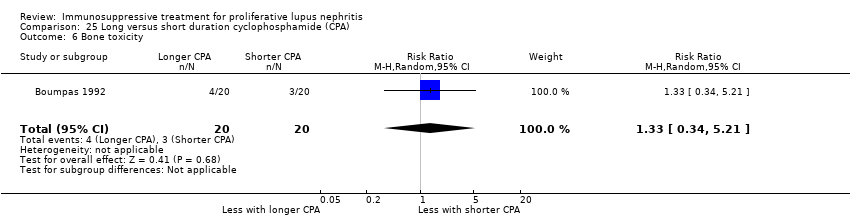
Comparison 25 Long versus short duration cyclophosphamide (CPA), Outcome 6 Bone toxicity.

Comparison 25 Long versus short duration cyclophosphamide (CPA), Outcome 7 Bladder toxicity.
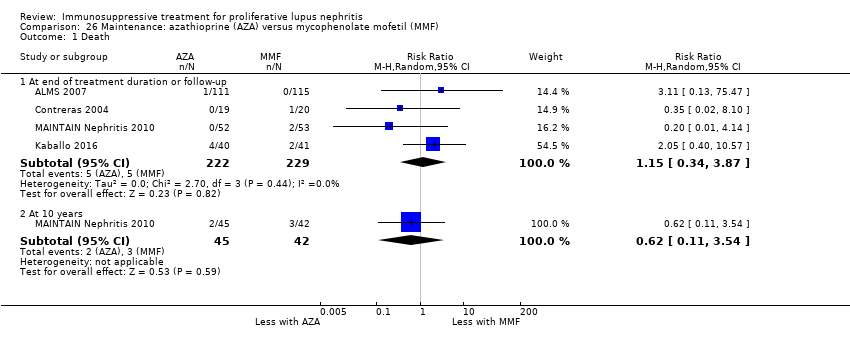
Comparison 26 Maintenance: azathioprine (AZA) versus mycophenolate mofetil (MMF), Outcome 1 Death.
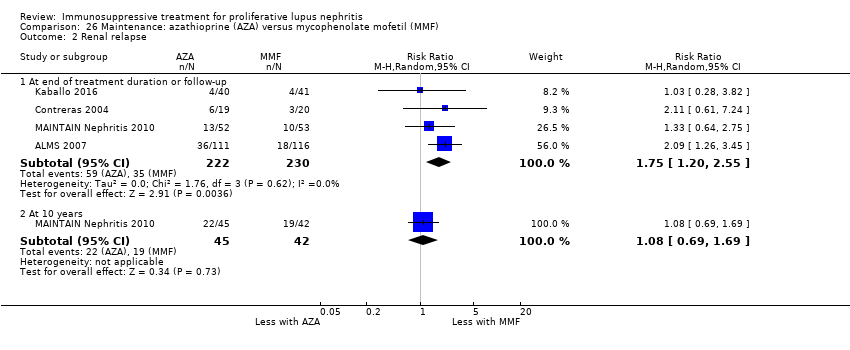
Comparison 26 Maintenance: azathioprine (AZA) versus mycophenolate mofetil (MMF), Outcome 2 Renal relapse.
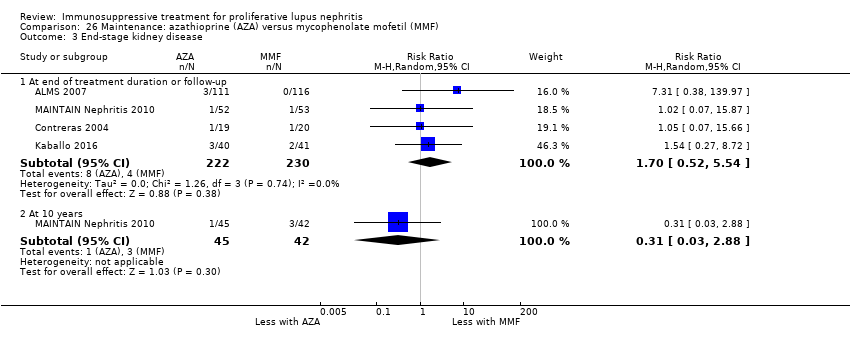
Comparison 26 Maintenance: azathioprine (AZA) versus mycophenolate mofetil (MMF), Outcome 3 End‐stage kidney disease.
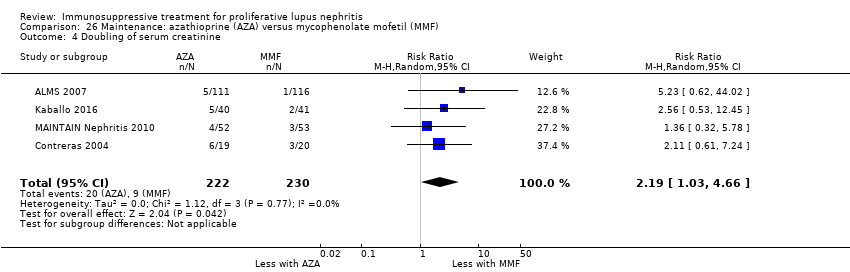
Comparison 26 Maintenance: azathioprine (AZA) versus mycophenolate mofetil (MMF), Outcome 4 Doubling of serum creatinine.

Comparison 26 Maintenance: azathioprine (AZA) versus mycophenolate mofetil (MMF), Outcome 5 Ovarian failure.

Comparison 26 Maintenance: azathioprine (AZA) versus mycophenolate mofetil (MMF), Outcome 6 Infection.
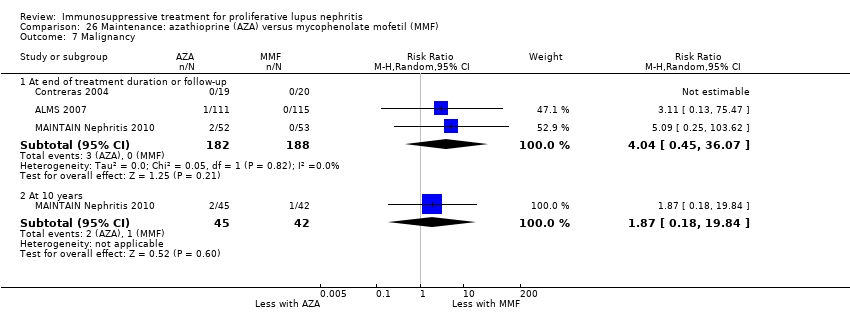
Comparison 26 Maintenance: azathioprine (AZA) versus mycophenolate mofetil (MMF), Outcome 7 Malignancy.
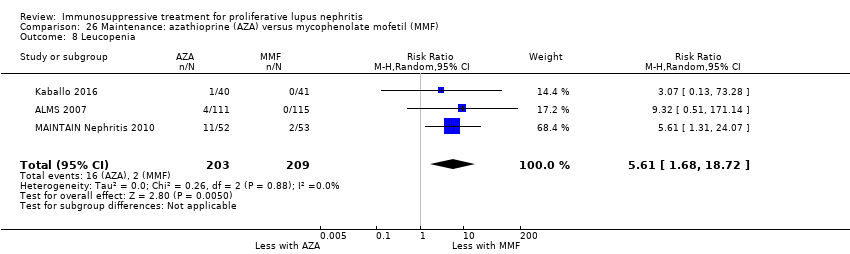
Comparison 26 Maintenance: azathioprine (AZA) versus mycophenolate mofetil (MMF), Outcome 8 Leucopenia.

Comparison 26 Maintenance: azathioprine (AZA) versus mycophenolate mofetil (MMF), Outcome 9 Bone toxicity.

Comparison 26 Maintenance: azathioprine (AZA) versus mycophenolate mofetil (MMF), Outcome 10 Alopecia.

Comparison 26 Maintenance: azathioprine (AZA) versus mycophenolate mofetil (MMF), Outcome 11 Gastrointestinal (GI) adverse events.

Comparison 26 Maintenance: azathioprine (AZA) versus mycophenolate mofetil (MMF), Outcome 12 Daily proteinuria.

Comparison 27 Maintenance: azathioprine (AZA) versus cyclosporin (CSA), Outcome 1 Death.
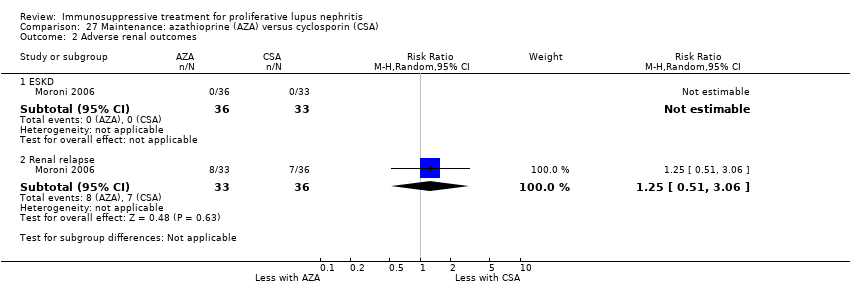
Comparison 27 Maintenance: azathioprine (AZA) versus cyclosporin (CSA), Outcome 2 Adverse renal outcomes.

Comparison 27 Maintenance: azathioprine (AZA) versus cyclosporin (CSA), Outcome 3 Infection.

Comparison 27 Maintenance: azathioprine (AZA) versus cyclosporin (CSA), Outcome 4 Leucopenia.

Comparison 27 Maintenance: azathioprine (AZA) versus cyclosporin (CSA), Outcome 5 Gastrointestinal (GI) adverse events.
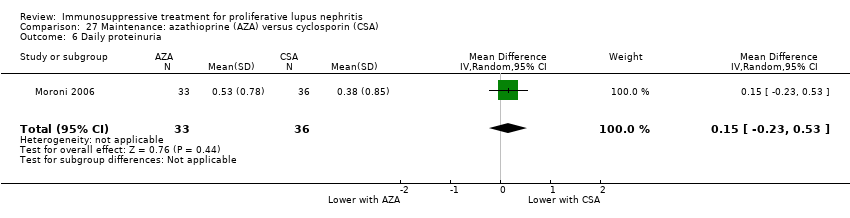
Comparison 27 Maintenance: azathioprine (AZA) versus cyclosporin (CSA), Outcome 6 Daily proteinuria.
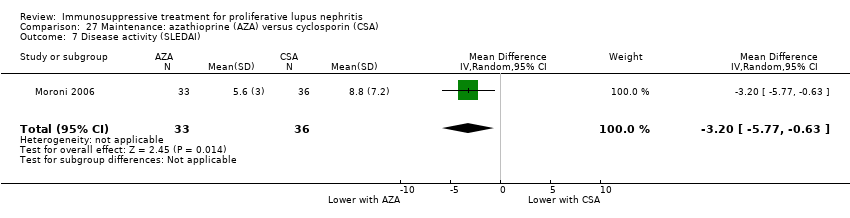
Comparison 27 Maintenance: azathioprine (AZA) versus cyclosporin (CSA), Outcome 7 Disease activity (SLEDAI).

Comparison 28 Maintenance: azathioprine (AZA) versus cyclophosphamide (CPA), Outcome 1 Death.

Comparison 28 Maintenance: azathioprine (AZA) versus cyclophosphamide (CPA), Outcome 2 Adverse renal outcomes.

Comparison 28 Maintenance: azathioprine (AZA) versus cyclophosphamide (CPA), Outcome 3 Bladder toxicity.

Comparison 28 Maintenance: azathioprine (AZA) versus cyclophosphamide (CPA), Outcome 4 Creatinine clearance.
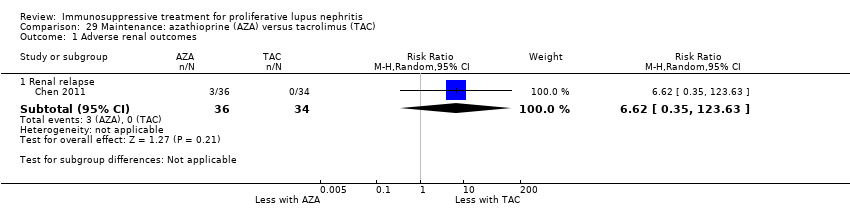
Comparison 29 Maintenance: azathioprine (AZA) versus tacrolimus (TAC), Outcome 1 Adverse renal outcomes.

Comparison 29 Maintenance: azathioprine (AZA) versus tacrolimus (TAC), Outcome 2 Infection.

Comparison 29 Maintenance: azathioprine (AZA) versus tacrolimus (TAC), Outcome 3 Gastrointestinal (GI) adverse events.
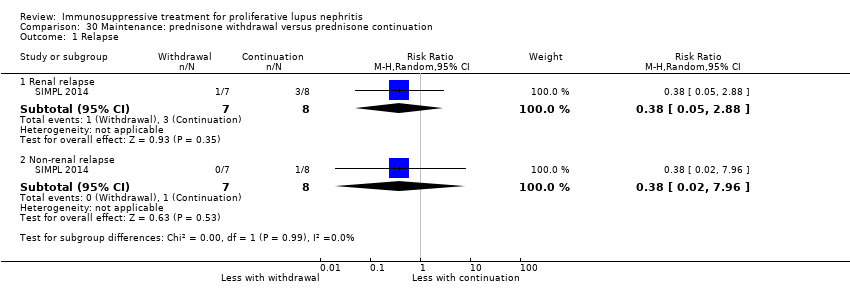
Comparison 30 Maintenance: prednisone withdrawal versus prednisone continuation, Outcome 1 Relapse.

Comparison 30 Maintenance: prednisone withdrawal versus prednisone continuation, Outcome 2 Major infection.

Comparison 31 Maintenance: intravenous immunoglobulin (IVIG) versus intravenous cyclophosphamide (IV CPA), Outcome 1 Creatinine clearance.
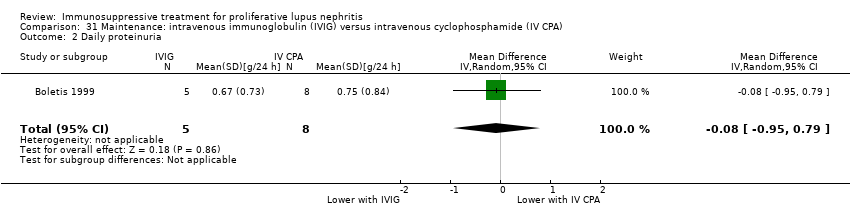
Comparison 31 Maintenance: intravenous immunoglobulin (IVIG) versus intravenous cyclophosphamide (IV CPA), Outcome 2 Daily proteinuria.

Comparison 31 Maintenance: intravenous immunoglobulin (IVIG) versus intravenous cyclophosphamide (IV CPA), Outcome 3 Serum creatinine.
| Patient or population: patients with induction therapy in lupus nephritis | ||||||
| Outcomes | Illustrative comparative risks* (95% CI) | Relative effect | No. of participants | Certainty of evidence | Comments | |
| Assumed risk | Corresponding risk | |||||
| IV CPA | MMF | |||||
| Death | 40 per 1000 | 53 per 1000 | RR 1.12 | 826 (8) | ⊕⊝⊝⊝ | Downgraded as follows: 1 Indirectness: time frame insufficient 2 Total number of events small 3 Severe imprecision (2 |
| ESKD | 85 per 1000 | 61 per 1000 | RR 0.71 (0.27 to 1.84) | 231 (3) | ⊕⊝⊝⊝ | Downgraded as follows: 1 Indirectness: time frame insufficient 2 Total number of events small 3 Severe imprecision (2 |
| Complete renal remission | 222 per 1000 | 260 per 1000 | RR 1.17 (0.97 to 1.42) | 828 (8) | ⊕⊕⊝⊝ | Downgraded as follows: 1 Study limitations 2 Total number of events small 3 Imprecision (2 grades): risk estimate includes null effect and estimate consistent with both appreciable |
| Partial renal remission Follow‐up: mean 24 weeks | 415 per 1000 | 423 per 1000 | RR 1.02 | 868 (9) | ⊕⊕⊝⊝ | Downgraded as follows: 1 Study limitations 2 Serious indirectness: differences in the outcome definition between studies. |
| Ovarian failure | 41 per 1000 | 15 per 1000 | RR 0.36 | 539 (3) | ⊕⊝⊝⊝ | Downgraded as follows: 1 Study limitations 2 Severe heterogeneity: point estimates varied widely 3 Total number of events small 4 Severe imprecision (2 grades): risk estimate includes null effect and estimate consistent |
| Major infection | 114 per 1000 | 116 per 1000 | RR 1.02 | 699 (6) | ⊕⊕⊝⊝ | Downgraded as follows: 1 Study limitations 2 Total number of events small 3 Severe imprecision (2 grades): risk estimate includes null effect and estimate consistent |
| Alopecia | 239 per 1000 | 69 per 1000 | RR 0.29 | 622 (3) | ⊕⊕⊕⊝ | Downgraded as follows: 1 Study limitations 2 Total number of events small Upgraded as follows: 3 Large magnitude of effect |
| Diarrhoea | 100 per 1000 | 241 per 1000 | RR 2.42 | 609 (4) | ⊕⊕⊕⊝ | Downgraded as follows: 1 Study limitations 2 Total number of events small Upgraded as follows 3 Large magnitude of effect |
| *The basis for the assumed risk for partial renal remission was prognostic studies (Fernandes das Neves 2015; Moroni 2007; So 2011; Zakharova 2016); and the assumed risk for other outcomes was calculated using the median control group risk across studies in the meta‐analysis. The corresponding risk (and its 95% confidence interval) is based on the assumed risk in the comparison group and the relative effect of the intervention (and its 95% CI) | ||||||
| GRADE Working Group certainty of evidence | ||||||
| MMF + TAC compared with IV CPA for lupus nephritis | ||||||
| Patient or population: Patients with proliferative lupus nephritis Settings: all settings Intervention: MMF + TAC Comparison: IV CPA | ||||||
| Outcomes | Illustrative comparative risks* (95% CI) | Relative effect | No. of participants | Certainty of evidence | Comments | |
| Assumed risk | Corresponding risk | |||||
| IV CPA | MMF + TAC | |||||
| Complete renal remission follow‐up: mean 24 weeks | 244 per 1000 | 580 per 1000 | RR 2.38 (1.07 to 5.30) | 402 (2) | ⊕⊕⊝⊝ | Downgraded as follows: 1Study limitation: concern regarding the incomplete reporting of IV CPA group 2Heterogeneity: substantial heterogeneity indicated by I2 statistic. Although Chi2 test was satisfied, the small number of studies may make this unreliable. 3Indirectness: Concern regarding the population, as all studies have largely included patients of Asian ethnicity. Upgraded as follows: 4Large effect size |
| Partial renal remission follow‐up: mean 24 weeks | 378 per 1000 | 378 per 1000 | RR 1.00 (0.78 to 1.28) | 402 (2) | ⊕⊕⊝⊝ | Downgraded as follows: 1Study limitation: concern regarding the incomplete reporting of IV CPA group 2 Indirectness: differences in the outcome definition between studies and concern regarding the population, as all studies have largely included patients of Asian ethnicity. |
| Stable kidney function follow‐up: mean 24 weeks | 284 per 1000 | 505 per 1000 | RR 1.78 (1.40 to 2.26) | 402 (2) | ⊕⊕⊝⊝ low1,2,3,4 | Downgraded as follows: 1Study limitation: concern regarding the incomplete reporting of IV CPA group 2 Indirectness (2 grades): differences in the outcome definition between studies and concern regarding the population, as all studies have largely included patients of Asian ethnicity. 3Total number of events small Upgraded as follows: 4Large effect size |
| *The basis for the assumed risk was calculated using the median control group risk across studies in the meta‐analyses. The corresponding risk (and its 95% confidence interval) is based on the assumed risk in the comparison group and the relative effect of the intervention (and its 95% CI). | ||||||
| GRADE Working Group certainty of evidence | ||||||
| Patient or population: patients with maintenance treatment in lupus nephritis | ||||||
| Outcomes | Illustrative comparative risks* (95% CI) | Relative effect | No. of participants | Certainty of evidence | Comments | |
| Assumed risk | Corresponding risk | |||||
| MMF | AZA | |||||
| Death | 22 per 1000 | 25 per 1000 | RR 1.15 (0.34 to 3.87) | 451 (4) | ⊕⊝⊝⊝ | Downgraded as follows: 1Total number of events small 2Severe imprecision (2 grades): risk estimate includes null effect and estimate consistent with both appreciable benefit and harm 3Indirectness: time frame insufficient |
| ESKD | 17 per 1000 | 30 per 1000 (9 to 96) | RR 1.70 (0.52 to 5.54) | 452 (4) | ⊕⊝⊝⊝ | Downgraded as follows: 1Total number of events small 2Severe imprecision (2 grades): risk estimate includes null effect and estimate consistent with both appreciable benefit and harm 3Indirectness: time frame insufficient |
| Renal relapse | 152 per 1000 | 266 per 1000 | RR 1.75 | 452 (4) | ⊕⊕⊕⊝ | Downgraded as follows: 1 Total number of events small |
| Doubling of serum creatinine Follow‐up: 36 to 72 months | 39 per 1000 | 86 per 1000 (40 to 182) | RR 2.19 (1.03 to 4.66) | 452 (4) | ⊕⊕⊝⊝ | Downgraded as follows: 1 Study limitations: (studies generally at unclear or high risk of bias for many domains) 2Total number of events small |
| Major infection | 91 per 1000 | 98 per 1000 | RR 1.08 | 412 (3) | ⊕⊕⊝⊝ | Downgraded as follows: 1 Total number of events small 2 Imprecision: wide risk estimate includes null effect |
| Leucopenia | 10 per 1000 | 54 per 1000 | RR 5.61 | 412 (3) | ⊕⊕⊝⊝ | Downgraded as follows: 1Study limitations: (studies generally at unclear or high risk of bias for many domains) 2 Imprecision: wide risk estimates |
| Alopecia | 67 per 1000 | 64 per 1000 | RR 0.95 | 412 (3) | ⊕⊕⊝⊝ | Downgraded as follows: 1Study limitations: (studies generally at unclear or high risk of bias for many domains) 2 Total number of events small |
| *The basis for the assumed risk for other outcomes was calculated using the median control group risk across studies in the meta‐analysis. The corresponding risk (and its 95% confidence interval) is based on the assumed risk in the comparison group and the relative effect of the intervention (and its 95% CI). | ||||||
| GRADE Working Group certainty of evidence | ||||||
| Study ID | Comparison | Therapy | Measure | Time point | Description of results |
| Abatacept versus placebo | Induction | SF‐36 physical and mental component (mean ± SD) | 6 months |
| |
| Abatacept versus placebo | Induction | SF‐36 (adjusted mean change ± SE) | 12 months |
| |
| Rituximab versus placebo | Induction | SF‐36 ‐ physical functioning (mean change ± SD) | 12 months |
|
| Study ID | Comparison | Therapy | Measure | Time point | Description of results |
| Abatacept versus placebo | Induction | Fatigue VAS (adjusted mean change ± SE) | 6 months |
| |
| Fatigue severity score (adjusted mean change ± SE) |
| ||||
| VAS ‐ visual analogue scale | |||||
| Study ID | Comparison | Measure | Time point | Description of results |
| Induction therapy | ||||
| Abatacept versus placebo | BILAG (mean ± SD) | 6 months |
| |
| MMF versus IV CPA | SLEDAI (mean change ± SD) | 6 months |
| |
| Leflunomide versus CPA | SLEDAI | 6 months | "SLEDAI scores were reduced" | |
| MMF versus IV CPA | SLAM (mean change ± SD) | 6 months |
| |
| IV CPA versus AZA | SLEDAI | 24 months | “SLEDAI and VAS scores did not differ between groups and decreased significantly and paralleled each other (r = 0.673, P<0.01)” | |
| TAC versus IC CPA | SLEDAI | 6 months | “SLEDAI level of FK506 (TAC) group is better than that of CPA group, (P<0.05)” | |
| High CPA versus low CPA | ECLAM | 12 months | “ECLAM score significantly improved in both groups during the first year of follow‐up. No significant difference was noted between patients in the low‐dose and high‐dose IV CYC groups for any of the parameters examined (P>0.05)” | |
| MMF versus TAC | SLEDAI‐2K (mean ± SD) | 12 months |
| |
| Rituximab versus rituximab + CPA | SLEDAI (mean ± SD) | 12 months |
| |
| MMF versus TAC versus IV CPA | SLEDAI (mean ± SD) | 6 months |
| |
| MMF + TAC versus IV CPA | SLEDAI (mean change ± SD) | 6 months |
| |
| PEX versus IA | SLEDAI | 6 months | “The SLEDAI gap between the study groups remained the same throughout the study. The improvements in SLEDAI score of both groups were also significantly demonstrated.” | |
| Rituximab versus placebo | BILAG (Time adjusted area under the curve minus baseline mean ± SD) | 12 months |
| |
| High‐dose CPA versus low‐dose CPA | Renal SLEDAI | 6 months | At 24 weeks, renal SLEDAI were similar between high‐dose and low‐dose cyclophosphamide | |
| MMF versus TAC | Renal SLEDAI (mean ± SD) | 6 months |
| |
| Extrarenal SLEDAI (mean ± SD) |
| |||
| Standard dose PRED versus reduced dose PRED | Global BILAG (mean ± SD) | 6 months | For both groups (reduced dose and standard dose corticosteroids) at the end of 6 months of treatment global BILAG reduced from 14 ± 5.4 to 5.0 ± 3.8 (P < 0.001) | |
| SLEDAI (mean ± SD) | For both groups (reduced dose and standard dose corticosteroids) at the end of 6 months of treatment SLEDAI reduced from16.2 ± 6.9 to 6.2 ± 5.1 (P < 0.001) | |||
| MMF versus IV CPA | SLEDAI (mean change ± SD) | 6 months |
| |
| MMF versus IV CPA | SLEDAI | 6 months | “SLEDAI improved significantly in both the groups over the study period, and there were no differences between the treatment groups.” | |
| Sirukumab versus placebo | SLEDAI‐2K | 6 months | “Eighteen patients (14 in the sirukumab group and 4 in the placebo group) had a SLEDAI‐2K RI‐50 response at any time through week 24.” | |
| Physician's and patients global assessment of disease activity | “Neither the patient’s nor the physician’s global assessment scores of disease activity showed notable improvement over time in either treatment group (data not shown)." | |||
| PE versus standard of care | SLAM (mean ± SD) | 12 months |
| |
| Maintenance therapy | ||||
| AZA versus MMF | SLEDAI | 36 months | "SLEDAI and ECLAM scores decreased similarly in both groups" | |
| ECLAM | ||||
| AZA versus CSA | SLEDAI (mean ± SD) | 24 months |
| |
| AZA ‐ azathioprine; BILAG ‐ British Isles Lupus Assessment Group; CPA ‐ cyclophosphamide; CSA ‐ cyclosporin; ECLAM ‐ European Consensus Lupus Activity Measurement; IA ‐ immunoadsorption; MMF ‐ mycophenolate mofetil; IV ‐ intravenous; PE ‐ plasma exchange; PEX ‐ plasmapheresis; PRED ‐ corticosteroid; SLAM ‐ Systemic Lupus Activity Measure; SLEDAI ‐ Systemic Lupus Erythematosus Disease Activity Index; TAC ‐ tacrolimus | ||||
| Outcome or subgroup title | No. of studies | No. of participants | Statistical method | Effect size |
| 1 Death Show forest plot | 8 | 826 | Risk Ratio (M‐H, Random, 95% CI) | 1.12 [0.61, 2.06] |
| 2 Remission Show forest plot | 9 | Risk Ratio (M‐H, Random, 95% CI) | Subtotals only | |
| 2.1 Complete renal remission: MMF versus IV CPA | 9 | 868 | Risk Ratio (M‐H, Random, 95% CI) | 1.17 [0.97, 1.42] |
| 2.2 Partial renal remission: MMF versus IV CPA | 9 | 868 | Risk Ratio (M‐H, Random, 95% CI) | 1.02 [0.89, 1.18] |
| 2.3 Complete remission in proteinuria: MMF versus IV CPA | 6 | 686 | Risk Ratio (M‐H, Random, 95% CI) | 1.16 [0.85, 1.58] |
| 2.4 Partial remission in proteinuria: MMF versus IV CPA | 6 | 744 | Risk Ratio (M‐H, Random, 95% CI) | 1.03 [0.91, 1.18] |
| 3 Adverse renal outcomes Show forest plot | 4 | Risk Ratio (M‐H, Random, 95% CI) | Subtotals only | |
| 3.1 ESKD | 3 | 231 | Risk Ratio (M‐H, Random, 95% CI) | 0.71 [0.27, 1.84] |
| 3.2 Renal relapse | 1 | 140 | Risk Ratio (M‐H, Random, 95% CI) | 0.97 [0.39, 2.44] |
| 3.3 Doubling of serum creatinine | 1 | 40 | Risk Ratio (M‐H, Random, 95% CI) | 0.0 [0.0, 0.0] |
| 4 Stable kidney function Show forest plot | 6 | 641 | Risk Ratio (M‐H, Random, 95% CI) | 1.05 [0.94, 1.17] |
| 5 Ovarian failure Show forest plot | 3 | 539 | Risk Ratio (M‐H, Random, 95% CI) | 0.36 [0.06, 2.18] |
| 6 Menstrual irregularities Show forest plot | 2 | 87 | Risk Ratio (M‐H, Random, 95% CI) | 0.33 [0.07, 1.59] |
| 7 Infection Show forest plot | 7 | 1452 | Risk Ratio (M‐H, Random, 95% CI) | 1.13 [0.81, 1.58] |
| 7.1 Major infection | 6 | 699 | Risk Ratio (M‐H, Random, 95% CI) | 1.02 [0.67, 1.54] |
| 7.2 Herpes zoster virus | 6 | 753 | Risk Ratio (M‐H, Random, 95% CI) | 1.39 [0.78, 2.46] |
| 8 Malignancy Show forest plot | 1 | 364 | Risk Ratio (M‐H, Random, 95% CI) | 0.65 [0.11, 3.86] |
| 9 Leucopenia Show forest plot | 6 | 753 | Risk Ratio (M‐H, Random, 95% CI) | 0.59 [0.33, 1.08] |
| 10 Bladder toxicity Show forest plot | 1 | 364 | Risk Ratio (M‐H, Random, 95% CI) | 0.33 [0.01, 7.95] |
| 11 Alopecia Show forest plot | 3 | 622 | Risk Ratio (M‐H, Random, 95% CI) | 0.29 [0.19, 0.46] |
| 12 Gastrointestinal (GI) adverse events Show forest plot | 4 | Risk Ratio (M‐H, Random, 95% CI) | Subtotals only | |
| 12.1 Diarrhoea | 4 | 609 | Risk Ratio (M‐H, Random, 95% CI) | 2.42 [1.64, 3.58] |
| 12.2 Vomiting | 3 | 562 | Risk Ratio (M‐H, Random, 95% CI) | 0.48 [0.24, 0.97] |
| 12.3 Nausea | 3 | 562 | Risk Ratio (M‐H, Random, 95% CI) | 0.48 [0.23, 0.98] |
| 12.4 GI upset | 3 | 569 | Risk Ratio (M‐H, Random, 95% CI) | 0.91 [0.78, 1.06] |
| 13 Daily proteinuria Show forest plot | 4 | 271 | Mean Difference (IV, Random, 95% CI) | ‐0.08 [‐0.43, 0.26] |
| 14 Serum creatinine Show forest plot | 6 | 759 | Mean Difference (IV, Random, 95% CI) | 2.14 [‐3.09, 7.37] |
| Outcome or subgroup title | No. of studies | No. of participants | Statistical method | Effect size |
| 1 Death Show forest plot | 1 | 62 | Risk Ratio (M‐H, Random, 95% CI) | 0.19 [0.01, 3.76] |
| 2 Remission Show forest plot | 1 | Risk Ratio (M‐H, Random, 95% CI) | Subtotals only | |
| 2.1 Complete remission in proteinuria | 1 | 62 | Risk Ratio (M‐H, Random, 95% CI) | 0.98 [0.74, 1.30] |
| 2.2 Partial remission in proteinuria | 1 | 62 | Risk Ratio (M‐H, Random, 95% CI) | 1.07 [0.44, 2.59] |
| 3 Adverse renal outcomes Show forest plot | 1 | Risk Ratio (M‐H, Random, 95% CI) | Subtotals only | |
| 3.1 ESKD | 1 | 62 | Risk Ratio (M‐H, Random, 95% CI) | 0.19 [0.01, 3.76] |
| 3.2 Renal relapse | 1 | 62 | Risk Ratio (M‐H, Random, 95% CI) | 1.15 [0.55, 2.37] |
| 3.3 Doubling of serum creatinine | 1 | 62 | Risk Ratio (M‐H, Random, 95% CI) | 0.63 [0.11, 3.48] |
| 4 Ovarian failure Show forest plot | 1 | 53 | Risk Ratio (M‐H, Random, 95% CI) | 0.10 [0.01, 0.73] |
| 5 Infection Show forest plot | 1 | Risk Ratio (M‐H, Random, 95% CI) | Subtotals only | |
| 5.1 Major infection | 1 | 62 | Risk Ratio (M‐H, Random, 95% CI) | 0.21 [0.05, 0.89] |
| 5.2 Herpes zoster virus | 1 | 62 | Risk Ratio (M‐H, Random, 95% CI) | 0.38 [0.08, 1.79] |
| 6 Leucopenia Show forest plot | 1 | 62 | Risk Ratio (M‐H, Random, 95% CI) | 0.06 [0.00, 0.92] |
| 7 Bone toxicity Show forest plot | 1 | 62 | Risk Ratio (M‐H, Random, 95% CI) | 0.0 [0.0, 0.0] |
| 8 Alopecia Show forest plot | 1 | 62 | Risk Ratio (M‐H, Random, 95% CI) | 0.05 [0.00, 0.81] |
| 9 Gastrointestinal (GI) adverse events Show forest plot | 1 | Risk Ratio (M‐H, Random, 95% CI) | Subtotals only | |
| 9.1 GI upset | 1 | 62 | Risk Ratio (M‐H, Random, 95% CI) | 2.81 [0.31, 25.58] |
| 10 Daily proteinuria Show forest plot | 1 | 42 | Mean Difference (IV, Random, 95% CI) | 0.3 [‐0.19, 0.79] |
| Outcome or subgroup title | No. of studies | No. of participants | Statistical method | Effect size |
| 1 Death Show forest plot | 2 | 402 | Risk Ratio (M‐H, Random, 95% CI) | 0.0 [0.0, 0.0] |
| 2 Remission Show forest plot | 2 | Risk Ratio (M‐H, Random, 95% CI) | Subtotals only | |
| 2.1 Complete renal remission | 2 | 402 | Risk Ratio (M‐H, Random, 95% CI) | 2.38 [1.07, 5.30] |
| 2.2 Partial renal remission | 2 | 402 | Risk Ratio (M‐H, Random, 95% CI) | 1.0 [0.78, 1.28] |
| 2.3 Complete remission in proteinuria | 2 | 402 | Risk Ratio (M‐H, Random, 95% CI) | 2.38 [1.07, 5.30] |
| 2.4 Partial remission in proteinuria | 2 | 402 | Risk Ratio (M‐H, Random, 95% CI) | 0.98 [0.76, 1.26] |
| 3 Adverse renal outcomes Show forest plot | 2 | Risk Ratio (M‐H, Random, 95% CI) | Subtotals only | |
| 3.1 Doubling of serum creatinine | 2 | 402 | Risk Ratio (M‐H, Random, 95% CI) | 0.98 [0.10, 9.23] |
| 4 Stable kidney function Show forest plot | 2 | 402 | Risk Ratio (M‐H, Random, 95% CI) | 1.78 [1.40, 2.26] |
| 5 Ovarian failure Show forest plot | 1 | 34 | Risk Ratio (M‐H, Random, 95% CI) | 0.0 [0.0, 0.0] |
| 6 Menstrual irregularities Show forest plot | 1 | 323 | Risk Ratio (M‐H, Random, 95% CI) | 0.28 [0.06, 1.35] |
| 7 Infection Show forest plot | 2 | Risk Ratio (M‐H, Random, 95% CI) | Subtotals only | |
| 7.1 Major infection | 2 | 402 | Risk Ratio (M‐H, Random, 95% CI) | 1.65 [0.11, 24.44] |
| 7.2 Herpes zoster virus | 2 | 402 | Risk Ratio (M‐H, Random, 95% CI) | 0.80 [0.22, 2.94] |
| 8 Leucopenia Show forest plot | 2 | 402 | Risk Ratio (M‐H, Random, 95% CI) | 0.23 [0.04, 1.44] |
| 9 Bone toxicity Show forest plot | 1 | 362 | Risk Ratio (M‐H, Random, 95% CI) | 3.0 [0.12, 73.16] |
| 10 Alopecia Show forest plot | 2 | 402 | Risk Ratio (M‐H, Random, 95% CI) | 0.78 [0.36, 1.72] |
| 11 Gastrointestinal (GI) adverse events Show forest plot | 2 | Risk Ratio (M‐H, Random, 95% CI) | Subtotals only | |
| 11.1 Diarrhoea | 1 | 362 | Risk Ratio (M‐H, Random, 95% CI) | 2.33 [0.92, 5.94] |
| 11.2 GI upset | 2 | 402 | Risk Ratio (M‐H, Random, 95% CI) | 0.21 [0.10, 0.41] |
| 12 Daily proteinuria Show forest plot | 1 | 40 | Mean Difference (IV, Random, 95% CI) | ‐1.69 [‐2.81, ‐0.57] |
| Outcome or subgroup title | No. of studies | No. of participants | Statistical method | Effect size |
| 1 Death Show forest plot | 1 | 82 | Risk Ratio (M‐H, Random, 95% CI) | 0.95 [0.06, 14.72] |
| 2 Remission Show forest plot | 1 | Risk Ratio (M‐H, Random, 95% CI) | Subtotals only | |
| 2.1 Complete renal remission | 1 | 82 | Risk Ratio (M‐H, Random, 95% CI) | 1.22 [0.78, 1.89] |
| 2.2 Partial renal remission | 1 | 82 | Risk Ratio (M‐H, Random, 95% CI) | 1.03 [0.55, 1.90] |
| 3 Menstrual irregularities Show forest plot | 1 | 75 | Risk Ratio (M‐H, Random, 95% CI) | 0.49 [0.16, 1.48] |
| 4 Infection Show forest plot | 1 | 82 | Risk Ratio (M‐H, Random, 95% CI) | 0.37 [0.14, 0.93] |
| 4.1 Major infection | 1 | 82 | Risk Ratio (M‐H, Random, 95% CI) | 0.37 [0.14, 0.93] |
| 5 Leucopenia Show forest plot | 1 | 82 | Risk Ratio (M‐H, Random, 95% CI) | 0.63 [0.11, 3.60] |
| 6 Daily proteinuria Show forest plot | 1 | 77 | Mean Difference (IV, Random, 95% CI) | ‐0.54 [‐1.12, 0.04] |
| Outcome or subgroup title | No. of studies | No. of participants | Statistical method | Effect size |
| 1 Death Show forest plot | 3 | 273 | Risk Ratio (M‐H, Random, 95% CI) | 1.10 [0.44, 2.77] |
| 2 Remission Show forest plot | 3 | Risk Ratio (M‐H, Random, 95% CI) | Subtotals only | |
| 2.1 Complete renal remission | 3 | 273 | Risk Ratio (M‐H, Random, 95% CI) | 1.02 [0.83, 1.26] |
| 2.2 Partial renal remission | 2 | 190 | Risk Ratio (M‐H, Random, 95% CI) | 0.83 [0.51, 1.36] |
| 2.3 Complete remission in proteinuria | 1 | 40 | Risk Ratio (M‐H, Random, 95% CI) | 1.0 [0.50, 1.98] |
| 2.4 Partial remission in proteinuria | 2 | 190 | Risk Ratio (M‐H, Random, 95% CI) | 0.90 [0.79, 1.03] |
| 3 Adverse renal outcomes Show forest plot | 1 | Risk Ratio (M‐H, Random, 95% CI) | Subtotals only | |
| 3.1 ESKD | 1 | 150 | Risk Ratio (M‐H, Random, 95% CI) | 1.22 [0.51, 2.91] |
| 3.2 Renal relapse | 1 | 150 | Risk Ratio (M‐H, Random, 95% CI) | 0.67 [0.48, 0.93] |
| 3.3 Renal relapse (nephritic flare) | 1 | 152 | Risk Ratio (M‐H, Random, 95% CI) | 0.68 [0.36, 1.28] |
| 3.4 Renal relapse (proteinuric flare) | 1 | 150 | Risk Ratio (M‐H, Random, 95% CI) | 0.67 [0.41, 1.12] |
| 3.5 Deterioration in kidney function | 1 | 150 | Risk Ratio (M‐H, Random, 95% CI) | 0.54 [0.27, 1.09] |
| 4 Stable kidney function Show forest plot | 1 | 40 | Risk Ratio (M‐H, Random, 95% CI) | 1.0 [0.50, 1.98] |
| 5 Menstrual irregularities Show forest plot | 1 | 40 | Risk Ratio (M‐H, Random, 95% CI) | 3.0 [0.13, 69.52] |
| 6 Infection Show forest plot | 2 | Risk Ratio (M‐H, Random, 95% CI) | Subtotals only | |
| 6.1 Major infection | 2 | 190 | Risk Ratio (M‐H, Random, 95% CI) | 2.14 [0.93, 4.92] |
| 6.2 Herpes zoster virus | 1 | 150 | Risk Ratio (M‐H, Random, 95% CI) | 6.82 [1.60, 28.96] |
| 7 Leucopenia Show forest plot | 1 | 40 | Risk Ratio (M‐H, Random, 95% CI) | 1.0 [0.07, 14.90] |
| 8 Alopecia Show forest plot | 1 | 150 | Risk Ratio (M‐H, Random, 95% CI) | 0.07 [0.00, 1.31] |
| 9 Daily proteinuria (at 24 weeks) Show forest plot | 1 | 150 | Mean Difference (IV, Random, 95% CI) | 0.18 [‐0.25, 0.61] |
| 10 Disease activity Show forest plot | 2 | Mean Difference (IV, Random, 95% CI) | Subtotals only | |
| 10.1 Renal SLEDAI | 2 | 233 | Mean Difference (IV, Random, 95% CI) | ‐0.21 [‐2.05, 1.63] |
| 10.2 Extrarenal SLEDAI | 2 | 233 | Mean Difference (IV, Random, 95% CI) | ‐0.26 [‐0.74, 0.22] |
| 11 Serum creatinine Show forest plot | 1 | 83 | Mean Difference (IV, Random, 95% CI) | ‐0.01 [‐0.16, 0.14] |
| 12 Creatinine clearance Show forest plot | 1 | 40 | Mean Difference (IV, Random, 95% CI) | ‐1.93 [‐7.77, 3.91] |
| Outcome or subgroup title | No. of studies | No. of participants | Statistical method | Effect size |
| 1 Death Show forest plot | 3 | Risk Ratio (M‐H, Random, 95% CI) | Subtotals only | |
| 1.1 Death | 3 | 153 | Risk Ratio (M‐H, Random, 95% CI) | 0.41 [0.06, 2.69] |
| 1.2 Death: extended follow‐up | 1 | 38 | Risk Ratio (M‐H, Random, 95% CI) | 0.0 [0.0, 0.0] |
| 2 Remission Show forest plot | 4 | Risk Ratio (M‐H, Random, 95% CI) | Subtotals only | |
| 2.1 Complete renal remission | 4 | 178 | Risk Ratio (M‐H, Random, 95% CI) | 1.35 [0.94, 1.93] |
| 2.2 Partial renal remission | 4 | 178 | Risk Ratio (M‐H, Random, 95% CI) | 0.88 [0.61, 1.26] |
| 2.3 Complete remission in proteinuria | 3 | 105 | Risk Ratio (M‐H, Random, 95% CI) | 1.71 [1.08, 2.70] |
| 3 Adverse renal outcomes Show forest plot | 2 | Risk Ratio (M‐H, Random, 95% CI) | Subtotals only | |
| 3.1 ESKD: extended follow‐up | 1 | 38 | Risk Ratio (M‐H, Random, 95% CI) | 1.0 [0.07, 14.85] |
| 3.2 Doubling of serum creatinine | 1 | 40 | Risk Ratio (M‐H, Random, 95% CI) | 0.33 [0.01, 7.72] |
| 3.3 Doubling of serum creatinine: extended follow‐up | 1 | 38 | Risk Ratio (M‐H, Random, 95% CI) | 1.0 [0.16, 6.38] |
| 4 Stable kidney function Show forest plot | 4 | 186 | Risk Ratio (M‐H, Random, 95% CI) | 1.11 [0.61, 2.00] |
| 5 Ovarian failure Show forest plot | 2 | Risk Ratio (M‐H, Random, 95% CI) | Subtotals only | |
| 5.1 Ovarian failure | 2 | 113 | Risk Ratio (M‐H, Random, 95% CI) | 0.25 [0.03, 2.18] |
| 5.2 Premature ovarian failure: extended follow‐up | 1 | 27 | Risk Ratio (M‐H, Random, 95% CI) | 0.31 [0.01, 7.02] |
| 6 Menstrual irregularities Show forest plot | 2 | 54 | Risk Ratio (M‐H, Random, 95% CI) | 0.41 [0.04, 4.05] |
| 7 Infection Show forest plot | 4 | Risk Ratio (M‐H, Random, 95% CI) | Subtotals only | |
| 7.1 Major infection | 3 | 138 | Risk Ratio (M‐H, Random, 95% CI) | 0.73 [0.33, 1.63] |
| 7.2 Herpes zoster virus | 2 | 113 | Risk Ratio (M‐H, Random, 95% CI) | 1.41 [0.38, 5.20] |
| 8 Malignancy: extended follow‐up Show forest plot | 1 | 38 | Risk Ratio (M‐H, Random, 95% CI) | 5.0 [0.26, 97.70] |
| 9 Leucopenia Show forest plot | 3 | 153 | Risk Ratio (M‐H, Random, 95% CI) | 0.44 [0.13, 1.49] |
| 10 Alopecia Show forest plot | 2 | 113 | Risk Ratio (M‐H, Random, 95% CI) | 0.21 [0.02, 1.76] |
| 11 Gastrointestinal (GI) adverse events Show forest plot | 1 | 73 | Risk Ratio (M‐H, Random, 95% CI) | 0.35 [0.12, 1.01] |
| 12 Daily proteinuria Show forest plot | 2 | 156 | Mean Difference (IV, Random, 95% CI) | ‐0.37 [‐0.67, ‐0.07] |
| 12.1 At 9 months | 1 | 40 | Mean Difference (IV, Random, 95% CI) | ‐0.83 [‐1.37, ‐0.29] |
| 12.2 At 12 months | 1 | 38 | Mean Difference (IV, Random, 95% CI) | ‐0.27 [‐0.43, ‐0.11] |
| 12.3 At 18 months | 1 | 40 | Mean Difference (IV, Random, 95% CI) | ‐1.0 [‐2.26, 0.26] |
| 12.4 Extended follow‐up | 1 | 38 | Mean Difference (IV, Random, 95% CI) | ‐0.10 [‐0.49, 0.29] |
| 13 Creatinine clearance Show forest plot | 3 | Mean Difference (IV, Random, 95% CI) | Subtotals only | |
| 13.1 At 6 months | 1 | 150 | Mean Difference (IV, Random, 95% CI) | 11.70 [1.61, 21.79] |
| 13.2 At 9 months | 1 | 40 | Mean Difference (IV, Random, 95% CI) | 14.90 [1.35, 28.45] |
| 13.3 At 12 months | 1 | 38 | Mean Difference (IV, Random, 95% CI) | ‐15.70 [‐23.71, ‐7.69] |
| 13.4 At 18 months | 1 | 40 | Mean Difference (IV, Random, 95% CI) | ‐1.40 [‐17.25, 14.45] |
| 14 Serum creatinine Show forest plot | 1 | Mean Difference (IV, Random, 95% CI) | Subtotals only | |
| 14.1 At 9 months | 1 | 40 | Mean Difference (IV, Random, 95% CI) | 12.70 [1.88, 23.52] |
| 14.2 At 18 months | 1 | 40 | Mean Difference (IV, Random, 95% CI) | 2.70 [‐11.50, 16.90] |
| 14.3 Extended follow‐up | 1 | 38 | Mean Difference (IV, Random, 95% CI) | ‐8.0 [‐20.35, 4.35] |
| Outcome or subgroup title | No. of studies | No. of participants | Statistical method | Effect size |
| 1 Death Show forest plot | 2 | Risk Ratio (M‐H, Random, 95% CI) | Subtotals only | |
| 1.1 At 5 years | 2 | 146 | Risk Ratio (M‐H, Random, 95% CI) | 1.39 [0.25, 7.77] |
| 1.2 At 10 years | 1 | 59 | Risk Ratio (M‐H, Random, 95% CI) | 1.93 [1.22, 3.06] |
| 2 Remission in proteinuria Show forest plot | 1 | Risk Ratio (M‐H, Random, 95% CI) | Subtotals only | |
| 2.1 Complete remission | 1 | 59 | Risk Ratio (M‐H, Random, 95% CI) | 2.03 [0.64, 6.46] |
| 2.2 Partial remission | 1 | 59 | Risk Ratio (M‐H, Random, 95% CI) | 1.80 [0.67, 4.81] |
| 3 Adverse renal outcomes Show forest plot | 2 | Risk Ratio (M‐H, Random, 95% CI) | Subtotals only | |
| 3.1 ESKD | 2 | 144 | Risk Ratio (M‐H, Random, 95% CI) | 0.40 [0.15, 1.07] |
| 3.2 ESKD at 9.6 years (median) | 1 | 100 | Risk Ratio (M‐H, Random, 95% CI) | 1.0 [0.15, 6.82] |
| 3.3 Renal relapse | 1 | 87 | Risk Ratio (M‐H, Random, 95% CI) | 0.15 [0.03, 0.64] |
| 3.4 Renal relapse at 9.6 years (median) | 1 | 87 | Risk Ratio (M‐H, Random, 95% CI) | 0.26 [0.10, 0.67] |
| 3.5 Doubling of serum creatinine | 2 | 144 | Risk Ratio (M‐H, Random, 95% CI) | 0.48 [0.24, 0.95] |
| 3.6 Deterioration of kidney function | 1 | 30 | Risk Ratio (M‐H, Random, 95% CI) | 0.67 [0.18, 2.42] |
| 4 Stable kidney function Show forest plot | 1 | 57 | Risk Ratio (M‐H, Random, 95% CI) | 1.32 [0.86, 2.01] |
| 5 Ovarian failure Show forest plot | 2 | 126 | Risk Ratio (M‐H, Random, 95% CI) | 2.11 [0.59, 7.53] |
| 6 Menstrual irregularities Show forest plot | 1 | 15 | Risk Ratio (M‐H, Random, 95% CI) | 1.90 [0.69, 5.23] |
| 7 Infection Show forest plot | 1 | Risk Ratio (M‐H, Random, 95% CI) | Subtotals only | |
| 7.1 Major infection | 1 | 57 | Risk Ratio (M‐H, Random, 95% CI) | 1.25 [0.27, 5.86] |
| 7.2 Herpes zoster virus | 1 | 57 | Risk Ratio (M‐H, Random, 95% CI) | 2.75 [0.68, 11.18] |
| 8 Malignancy Show forest plot | 2 | Risk Ratio (M‐H, Random, 95% CI) | Subtotals only | |
| 8.1 CPA versus AZA | 2 | 144 | Risk Ratio (M‐H, Random, 95% CI) | 0.59 [0.13, 2.63] |
| 8.2 10 year follow‐up | 1 | 87 | Risk Ratio (M‐H, Random, 95% CI) | 0.74 [0.11, 5.01] |
| 9 Bone toxicity Show forest plot | 1 | 87 | Risk Ratio (M‐H, Random, 95% CI) | 0.0 [0.0, 0.0] |
| 10 Bladder toxicity Show forest plot | 2 | 144 | Risk Ratio (M‐H, Random, 95% CI) | 3.59 [0.19, 66.14] |
| Outcome or subgroup title | No. of studies | No. of participants | Statistical method | Effect size |
| 1 Death Show forest plot | 1 | 144 | Risk Ratio (M‐H, Random, 95% CI) | 5.0 [0.24, 102.35] |
| 2 Remission Show forest plot | 1 | Risk Ratio (M‐H, Random, 95% CI) | Subtotals only | |
| 2.1 Complete renal response | 1 | 144 | Risk Ratio (M‐H, Random, 95% CI) | 0.86 [0.51, 1.45] |
| 2.2 Partial renal response | 1 | 144 | Risk Ratio (M‐H, Random, 95% CI) | 2.0 [1.05, 3.82] |
| 2.3 Complete remission in proteinuria | 1 | 144 | Risk Ratio (M‐H, Random, 95% CI) | 0.87 [0.63, 1.21] |
| 3 Stable kidney function Show forest plot | 1 | 144 | Risk Ratio (M‐H, Random, 95% CI) | 1.24 [0.90, 1.71] |
| 4 Infection Show forest plot | 1 | Risk Ratio (M‐H, Random, 95% CI) | Subtotals only | |
| 4.1 Major infection | 1 | 144 | Risk Ratio (M‐H, Random, 95% CI) | 1.0 [0.48, 2.08] |
| 4.2 Herpes zoster virus | 1 | 144 | Risk Ratio (M‐H, Random, 95% CI) | 0.82 [0.36, 1.85] |
| 5 Leucopenia Show forest plot | 1 | 144 | Risk Ratio (M‐H, Random, 95% CI) | 3.0 [0.85, 10.63] |
| Outcome or subgroup title | No. of studies | No. of participants | Statistical method | Effect size |
| 1 Remission Show forest plot | 1 | Risk Ratio (M‐H, Random, 95% CI) | Subtotals only | |
| 1.1 Complete renal response | 1 | 19 | Risk Ratio (M‐H, Random, 95% CI) | 0.9 [0.16, 5.13] |
| 1.2 Partial renal response | 1 | 19 | Risk Ratio (M‐H, Random, 95% CI) | 0.75 [0.35, 1.62] |
| 2 Infection Show forest plot | 1 | 38 | Risk Ratio (M‐H, Random, 95% CI) | 0.57 [0.08, 4.20] |
| 2.1 Major infection | 1 | 19 | Risk Ratio (M‐H, Random, 95% CI) | 0.9 [0.07, 12.38] |
| 2.2 Herpes zoster virus | 1 | 19 | Risk Ratio (M‐H, Random, 95% CI) | 0.30 [0.01, 6.62] |
| 3 Daily proteinuria Show forest plot | 1 | 19 | Mean Difference (IV, Random, 95% CI) | ‐0.30 [‐2.29, 1.69] |
| 4 Creatinine clearance Show forest plot | 1 | 19 | Mean Difference (IV, Random, 95% CI) | ‐17.20 [‐50.66, 16.26] |
| 5 Serum creatinine Show forest plot | 1 | 19 | Mean Difference (IV, Random, 95% CI) | 35.00 [‐27.14, 97.14] |
| Outcome or subgroup title | No. of studies | No. of participants | Statistical method | Effect size |
| 1 Death Show forest plot | 2 | Risk Ratio (M‐H, Random, 95% CI) | Subtotals only | |
| 1.1 Abatacept versus placebo | 2 | 432 | Risk Ratio (M‐H, Random, 95% CI) | 0.29 [0.10, 0.91] |
| 1.2 High dose abatacept versus placebo | 1 | 199 | Risk Ratio (M‐H, Random, 95% CI) | 0.29 [0.06, 1.36] |
| 1.3 Low dose abatacept versus placebo | 1 | 199 | Risk Ratio (M‐H, Random, 95% CI) | 0.29 [0.06, 1.36] |
| 2 Remission Show forest plot | 2 | Risk Ratio (M‐H, Random, 95% CI) | Subtotals only | |
| 2.1 Complete remission: abatacept versus placebo | 2 | 432 | Risk Ratio (M‐H, Random, 95% CI) | 1.13 [0.74, 1.71] |
| 2.2 Complete remission: high dose abatacept versus placebo | 1 | 199 | Risk Ratio (M‐H, Random, 95% CI) | 1.14 [0.46, 2.83] |
| 2.3 Complete remission: low dose abatacept versus placebo | 1 | 199 | Risk Ratio (M‐H, Random, 95% CI) | 1.39 [0.58, 3.31] |
| 2.4 Partial remission: abatacept versus placebo | 2 | 432 | Risk Ratio (M‐H, Random, 95% CI) | 0.88 [0.58, 1.33] |
| 2.5 Partial remission: high dose abatacept versus placebo | 1 | 199 | Risk Ratio (M‐H, Random, 95% CI) | 1.01 [0.51, 2.01] |
| 2.6 Partial remission: low dose abatacept versus placebo | 1 | 199 | Risk Ratio (M‐H, Random, 95% CI) | 0.65 [0.29, 1.43] |
| 3 Adverse renal outcomes Show forest plot | 2 | Risk Ratio (M‐H, Random, 95% CI) | Subtotals only | |
| 3.1 ESKD: Abatacept versus placebo | 1 | 298 | Risk Ratio (M‐H, Random, 95% CI) | 0.84 [0.21, 3.45] |
| 3.2 ESKD: high dose abatacept versus placebo | 1 | 199 | Risk Ratio (M‐H, Random, 95% CI) | 1.01 [0.21, 4.88] |
| 3.3 ESKD: low dose abatacept versus placebo | 1 | 199 | Risk Ratio (M‐H, Random, 95% CI) | 0.67 [0.11, 3.94] |
| 3.4 Renal relapse: abatacept versus placebo | 1 | 134 | Risk Ratio (M‐H, Random, 95% CI) | 1.03 [0.22, 4.92] |
| 4 Major Infection Show forest plot | 2 | Risk Ratio (M‐H, Random, 95% CI) | Subtotals only | |
| 4.1 Abatacept versus placebo | 2 | 432 | Risk Ratio (M‐H, Random, 95% CI) | 1.29 [0.81, 2.04] |
| 4.2 High dose abatacept versus placebo | 1 | 199 | Risk Ratio (M‐H, Random, 95% CI) | 1.37 [0.78, 2.40] |
| 4.3 Low dose abatacept versus placebo | 1 | 199 | Risk Ratio (M‐H, Random, 95% CI) | 1.07 [0.59, 1.95] |
| 5 Herpes zoster virus Show forest plot | 1 | Risk Ratio (M‐H, Random, 95% CI) | Subtotals only | |
| 5.1 Abatacept versus placebo | 1 | 298 | Risk Ratio (M‐H, Random, 95% CI) | 9.64 [0.57, 164.02] |
| 5.2 High dose abatacept versus placebo | 1 | 199 | Risk Ratio (M‐H, Random, 95% CI) | 7.07 [0.37, 135.11] |
| 5.3 Low dose abatacept versus placebo | 1 | 199 | Risk Ratio (M‐H, Random, 95% CI) | 13.13 [0.75, 229.99] |
| 6 Health‐related quality of life Show forest plot | 1 | Mean Difference (IV, Random, 95% CI) | Subtotals only | |
| 6.1 Physical component | 1 | 134 | Mean Difference (IV, Random, 95% CI) | 0.0 [‐3.73, 3.73] |
| 6.2 Mental component | 1 | 134 | Mean Difference (IV, Random, 95% CI) | ‐0.60 [‐4.50, 3.30] |
| 7 Disease activity (BILAG) Show forest plot | 1 | 134 | Mean Difference (IV, Random, 95% CI) | ‐0.40 [‐1.23, 0.43] |
| Outcome or subgroup title | No. of studies | No. of participants | Statistical method | Effect size |
| 1 Death Show forest plot | 1 | Risk Ratio (M‐H, Random, 95% CI) | Subtotals only | |
| 1.1 Laquinimod versus placebo | 1 | 46 | Risk Ratio (M‐H, Random, 95% CI) | 1.5 [0.06, 34.79] |
| 1.2 High dose laquinimod versus placebo | 1 | 30 | Risk Ratio (M‐H, Random, 95% CI) | 3.0 [0.13, 68.26] |
| 1.3 Low dose laquinimod versus placebo | 1 | 31 | Risk Ratio (M‐H, Random, 95% CI) | 0.0 [0.0, 0.0] |
| 2 Complete remission Show forest plot | 1 | Risk Ratio (M‐H, Random, 95% CI) | Subtotals only | |
| 2.1 Complete remission: laquinimod versus placebo | 1 | 46 | Risk Ratio (M‐H, Random, 95% CI) | 1.55 [0.70, 3.42] |
| 2.2 Complete remission: high dose laquinimod versus placebo | 1 | 30 | Risk Ratio (M‐H, Random, 95% CI) | 1.2 [0.47, 3.09] |
| 2.3 Complete remission: low dose laquinimod versus placebo | 1 | 31 | Risk Ratio (M‐H, Random, 95% CI) | 1.88 [0.83, 4.22] |
| Outcome or subgroup title | No. of studies | No. of participants | Statistical method | Effect size |
| 1 Death Show forest plot | 1 | Risk Ratio (M‐H, Random, 95% CI) | Subtotals only | |
| 1.1 Ocrelizumab versus placebo | 1 | 379 | Risk Ratio (M‐H, Random, 95% CI) | 0.66 [0.23, 1.85] |
| 1.2 High dose ocrelizumab versus placebo | 1 | 253 | Risk Ratio (M‐H, Random, 95% CI) | 0.81 [0.25, 2.60] |
| 1.3 Low dose ocrelizumab versus placebo | 1 | 251 | Risk Ratio (M‐H, Random, 95% CI) | 0.50 [0.13, 1.94] |
| 2 Remission Show forest plot | 1 | Risk Ratio (M‐H, Random, 95% CI) | Subtotals only | |
| 2.1 Complete remission: ocrelizumab versus placebo | 1 | 223 | Risk Ratio (M‐H, Random, 95% CI) | 1.07 [0.74, 1.56] |
| 2.2 Complete remission: high dose ocrelizumab versus placebo | 1 | 148 | Risk Ratio (M‐H, Random, 95% CI) | 0.91 [0.57, 1.44] |
| 2.3 Complete remission: low dose ocrelizumab versus placebo | 1 | 150 | Risk Ratio (M‐H, Random, 95% CI) | 1.23 [0.82, 1.85] |
| 2.4 Partial remission: ocrelizumab versus placebo | 1 | 223 | Risk Ratio (M‐H, Random, 95% CI) | 1.49 [0.89, 2.49] |
| 2.5 Partial remission: high dose ocrelizumab versus placebo | 1 | 148 | Risk Ratio (M‐H, Random, 95% CI) | 1.78 [1.03, 3.08] |
| 2.6 Partial remission: low dose ocrelizumab versus placebo | 1 | 150 | Risk Ratio (M‐H, Random, 95% CI) | 1.2 [0.65, 2.20] |
| 3 Major Infection Show forest plot | 1 | Risk Ratio (M‐H, Random, 95% CI) | Subtotals only | |
| 3.1 Ocrelizumab versus placebo | 1 | 378 | Risk Ratio (M‐H, Random, 95% CI) | 1.14 [0.95, 1.36] |
| 3.2 High dose ocrelizumab versus placebo | 1 | 252 | Risk Ratio (M‐H, Random, 95% CI) | 1.05 [0.85, 1.30] |
| 3.3 Low dose ocrelizumab versus placebo | 1 | 251 | Risk Ratio (M‐H, Random, 95% CI) | 1.22 [1.00, 1.48] |
| Outcome or subgroup title | No. of studies | No. of participants | Statistical method | Effect size |
| 1 Death Show forest plot | 1 | 25 | Risk Ratio (M‐H, Random, 95% CI) | 0.0 [0.0, 0.0] |
| 2 Infection Show forest plot | 1 | 25 | Risk Ratio (M‐H, Random, 95% CI) | 0.93 [0.66, 1.32] |
| 2.1 Major infection | 1 | 25 | Risk Ratio (M‐H, Random, 95% CI) | 0.93 [0.66, 1.32] |
| 3 Malignancy Show forest plot | 1 | 25 | Risk Ratio (M‐H, Random, 95% CI) | 0.0 [0.0, 0.0] |
| 4 Gastrointestinal (GI) adverse events Show forest plot | 1 | Risk Ratio (M‐H, Random, 95% CI) | Subtotals only | |
| 4.1 Diarrhoea | 1 | 25 | Risk Ratio (M‐H, Random, 95% CI) | 1.59 [0.10, 26.15] |
| Outcome or subgroup title | No. of studies | No. of participants | Statistical method | Effect size |
| 1 Death Show forest plot | 2 | 67 | Risk Ratio (M‐H, Random, 95% CI) | 0.80 [0.20, 3.24] |
| 2 Adverse renal outcomes Show forest plot | 2 | Risk Ratio (M‐H, Random, 95% CI) | Subtotals only | |
| 2.1 ESKD | 2 | 67 | Risk Ratio (M‐H, Random, 95% CI) | 0.23 [0.04, 1.28] |
| 2.2 Doubling of serum creatinine | 2 | 67 | Risk Ratio (M‐H, Random, 95% CI) | 0.67 [0.23, 1.98] |
| 2.3 Deterioration of kidney function | 1 | 38 | Risk Ratio (M‐H, Random, 95% CI) | 0.72 [0.23, 2.27] |
| 3 Stable kidney function Show forest plot | 1 | 38 | Risk Ratio (M‐H, Random, 95% CI) | 1.11 [0.77, 1.59] |
| 4 Ovarian failure Show forest plot | 2 | 56 | Risk Ratio (M‐H, Random, 95% CI) | 0.70 [0.37, 1.30] |
| 5 Infection Show forest plot | 2 | Risk Ratio (M‐H, Random, 95% CI) | Subtotals only | |
| 5.1 Major infection | 2 | 67 | Risk Ratio (M‐H, Random, 95% CI) | 1.16 [0.47, 2.90] |
| 5.2 Herpes zoster virus | 1 | 38 | Risk Ratio (M‐H, Random, 95% CI) | 0.75 [0.28, 2.04] |
| 6 Malignancy Show forest plot | 2 | 67 | Risk Ratio (M‐H, Random, 95% CI) | 1.43 [0.41, 4.96] |
| 7 Bladder toxicity Show forest plot | 2 | 67 | Risk Ratio (M‐H, Random, 95% CI) | 0.22 [0.03, 1.83] |
| 8 Gastrointestinal (GI) adverse events Show forest plot | 1 | Risk Ratio (M‐H, Random, 95% CI) | Subtotals only | |
| 8.1 GI upset | 1 | 29 | Risk Ratio (M‐H, Random, 95% CI) | 3.69 [0.43, 31.43] |
| Outcome or subgroup title | No. of studies | No. of participants | Statistical method | Effect size |
| 1 Death Show forest plot | 4 | Risk Ratio (M‐H, Random, 95% CI) | Subtotals only | |
| 1.1 At 6 months | 1 | 117 | Risk Ratio (M‐H, Random, 95% CI) | 1.81 [0.19, 16.85] |
| 1.2 At 12 months | 2 | 121 | Risk Ratio (M‐H, Random, 95% CI) | 0.97 [0.14, 6.56] |
| 1.3 At 5 years | 1 | 85 | Risk Ratio (M‐H, Random, 95% CI) | 0.13 [0.01, 2.51] |
| 1.4 At 10 years | 1 | 90 | Risk Ratio (M‐H, Random, 95% CI) | 0.38 [0.08, 1.87] |
| 2 Remission Show forest plot | 3 | Risk Ratio (M‐H, Random, 95% CI) | Subtotals only | |
| 2.1 Complete renal remission | 3 | 267 | Risk Ratio (M‐H, Random, 95% CI) | 1.09 [0.63, 1.86] |
| 2.2 Partial renal remission | 3 | 267 | Risk Ratio (M‐H, Random, 95% CI) | 0.88 [0.69, 1.14] |
| 3 Adverse renal outcomes Show forest plot | 3 | Risk Ratio (M‐H, Random, 95% CI) | Subtotals only | |
| 3.1 ESKD | 2 | 135 | Risk Ratio (M‐H, Random, 95% CI) | 0.49 [0.05, 5.20] |
| 3.2 ESKD at 5 years | 1 | 85 | Risk Ratio (M‐H, Random, 95% CI) | 2.80 [0.30, 25.81] |
| 3.3 ESKD at 10 years | 1 | 90 | Risk Ratio (M‐H, Random, 95% CI) | 1.91 [0.37, 9.92] |
| 3.4 Renal relapse | 3 | 211 | Risk Ratio (M‐H, Random, 95% CI) | 2.75 [0.47, 15.98] |
| 3.5 Doubling of serum creatinine | 2 | 135 | Risk Ratio (M‐H, Random, 95% CI) | 0.33 [0.04, 3.02] |
| 3.6 Doubling of serum creatinine at 5 years | 1 | 85 | Risk Ratio (M‐H, Random, 95% CI) | 0.13 [0.02, 1.04] |
| 3.7 Doubling of serum creatinine at 10 years | 1 | 90 | Risk Ratio (M‐H, Random, 95% CI) | 0.80 [0.26, 2.42] |
| 4 Stable kidney function Show forest plot | 1 | Risk Ratio (M‐H, Random, 95% CI) | Subtotals only | |
| 4.1 At 3 years | 1 | 89 | Risk Ratio (M‐H, Random, 95% CI) | 0.72 [0.50, 1.03] |
| 4.2 At 5 years | 1 | 85 | Risk Ratio (M‐H, Random, 95% CI) | 0.96 [0.77, 1.20] |
| 5 Ovarian failure Show forest plot | 4 | 299 | Risk Ratio (M‐H, Random, 95% CI) | 1.73 [0.70, 4.31] |
| 6 Infection Show forest plot | 4 | Risk Ratio (M‐H, Random, 95% CI) | Subtotals only | |
| 6.1 Major infection | 4 | 327 | Risk Ratio (M‐H, Random, 95% CI) | 1.44 [0.83, 2.49] |
| 6.2 Herpes zoster virus | 3 | 281 | Risk Ratio (M‐H, Random, 95% CI) | 1.58 [0.41, 6.05] |
| 7 Malignancy Show forest plot | 2 | 206 | Risk Ratio (M‐H, Random, 95% CI) | 1.44 [0.09, 23.31] |
| 8 Leucopenia Show forest plot | 3 | 281 | Risk Ratio (M‐H, Random, 95% CI) | 0.82 [0.13, 5.15] |
| 9 Bone toxicity Show forest plot | 2 | 164 | Risk Ratio (M‐H, Random, 95% CI) | 2.93 [0.48, 18.02] |
| 10 Alopecia Show forest plot | 1 | 75 | Risk Ratio (M‐H, Random, 95% CI) | 0.28 [0.06, 1.25] |
| 11 Gastrointestinal (GI) adverse events Show forest plot | 1 | Risk Ratio (M‐H, Random, 95% CI) | Subtotals only | |
| 11.1 GI disturbance | 1 | 75 | Risk Ratio (M‐H, Random, 95% CI) | 0.11 [0.01, 1.94] |
| 12 Daily proteinuria Show forest plot | 3 | 242 | Mean Difference (IV, Random, 95% CI) | ‐0.10 [‐0.65, 0.46] |
| 13 Creatinine clearance Show forest plot | 1 | 117 | Mean Difference (IV, Random, 95% CI) | ‐12.60 [‐23.63, ‐1.57] |
| 14 Serum creatinine Show forest plot | 3 | 247 | Mean Difference (IV, Random, 95% CI) | 2.85 [‐7.61, 13.31] |
| 15 Disease activity (SLEDAI) Show forest plot | 1 | 75 | Mean Difference (IV, Random, 95% CI) | ‐1.50 [‐3.04, 0.04] |
| Outcome or subgroup title | No. of studies | No. of participants | Statistical method | Effect size |
| 1 Death Show forest plot | 1 | 81 | Risk Ratio (M‐H, Random, 95% CI) | 4.65 [0.23, 93.95] |
| 2 Remission Show forest plot | 1 | Risk Ratio (M‐H, Random, 95% CI) | Subtotals only | |
| 2.1 Complete renal remission | 1 | 81 | Risk Ratio (M‐H, Random, 95% CI) | 0.93 [0.39, 2.23] |
| 2.2 Partial renal remission | 1 | 81 | Risk Ratio (M‐H, Random, 95% CI) | 1.33 [0.78, 2.24] |
| 3 Relapse Show forest plot | 1 | 50 | Risk Ratio (M‐H, Random, 95% CI) | 2.38 [0.10, 55.72] |
| 4 Infection Show forest plot | 1 | Risk Ratio (M‐H, Random, 95% CI) | Subtotals only | |
| 4.1 Major infection | 1 | 81 | Risk Ratio (M‐H, Random, 95% CI) | 4.64 [0.57, 38.00] |
| 4.2 Herpes zoster virus | 1 | 81 | Risk Ratio (M‐H, Random, 95% CI) | 13.95 [0.82, 236.48] |
| 5 Gastrointestinal (GI) adverse events Show forest plot | 1 | Risk Ratio (M‐H, Random, 95% CI) | Subtotals only | |
| 5.1 Diarrhoea | 1 | 81 | Risk Ratio (M‐H, Random, 95% CI) | 1.16 [0.51, 2.64] |
| 5.2 Vomiting | 1 | 81 | Risk Ratio (M‐H, Random, 95% CI) | 0.93 [0.25, 3.46] |
| 5.3 Nausea | 1 | 81 | Risk Ratio (M‐H, Random, 95% CI) | 2.79 [0.30, 25.67] |
| 6 Creatinine clearance Show forest plot | 1 | 74 | Mean Difference (IV, Random, 95% CI) | ‐5.80 [‐21.08, 9.48] |
| 7 Serum creatinine Show forest plot | 1 | 81 | Mean Difference (IV, Random, 95% CI) | ‐2.40 [‐15.98, 11.18] |
| Outcome or subgroup title | No. of studies | No. of participants | Statistical method | Effect size |
| 1 Death Show forest plot | 1 | 22 | Risk Ratio (M‐H, Random, 95% CI) | 0.0 [0.0, 0.0] |
| 2 Adverse renal outcomes Show forest plot | 1 | Risk Ratio (M‐H, Random, 95% CI) | Subtotals only | |
| 2.1 Renal relapse | 1 | 22 | Risk Ratio (M‐H, Random, 95% CI) | 0.95 [0.44, 2.04] |
| Outcome or subgroup title | No. of studies | No. of participants | Statistical method | Effect size |
| 1 Death Show forest plot | 5 | 226 | Risk Ratio (M‐H, Random, 95% CI) | 0.98 [0.53, 1.82] |
| 2 Complete remission of proteinuria Show forest plot | 1 | 13 | Risk Ratio (M‐H, Random, 95% CI) | 2.63 [0.13, 54.64] |
| 3 Adverse renal outcomes Show forest plot | 5 | Risk Ratio (M‐H, Random, 95% CI) | Subtotals only | |
| 3.1 ESKD | 5 | 278 | Risk Ratio (M‐H, Random, 95% CI) | 0.63 [0.39, 1.03] |
| 3.2 Renal relapse | 2 | 84 | Risk Ratio (M‐H, Random, 95% CI) | 0.23 [0.08, 0.62] |
| 3.3 Doubling serum creatinine | 4 | 228 | Risk Ratio (M‐H, Random, 95% CI) | 0.59 [0.40, 0.88] |
| 4 Deterioration of kidney function Show forest plot | 5 | 179 | Risk Ratio (M‐H, Random, 95% CI) | 0.78 [0.52, 1.18] |
| 5 Stable kidney function Show forest plot | 5 | 278 | Risk Ratio (M‐H, Random, 95% CI) | 1.20 [1.00, 1.45] |
| 6 Ovarian failure Show forest plot | 3 | 147 | Risk Ratio (M‐H, Random, 95% CI) | 2.18 [1.10, 4.34] |
| 7 Infection Show forest plot | 6 | Risk Ratio (M‐H, Random, 95% CI) | Subtotals only | |
| 7.1 Major infection | 6 | 291 | Risk Ratio (M‐H, Random, 95% CI) | 0.87 [0.50, 1.51] |
| 7.2 Herpes zoster virus | 3 | 199 | Risk Ratio (M‐H, Random, 95% CI) | 1.77 [0.63, 4.99] |
| 8 Malignancy Show forest plot | 2 | 117 | Risk Ratio (M‐H, Random, 95% CI) | 0.82 [0.07, 9.90] |
| 9 Bone toxicity Show forest plot | 3 | 197 | Risk Ratio (M‐H, Random, 95% CI) | 0.84 [0.40, 1.75] |
| 10 Bladder toxicity Show forest plot | 2 | 65 | Risk Ratio (M‐H, Random, 95% CI) | 2.66 [0.33, 21.68] |
| 11 Daily proteinuria Show forest plot | 3 | 92 | Mean Difference (IV, Random, 95% CI) | 0.15 [‐0.23, 0.54] |
| 12 Serum creatinine Show forest plot | 1 | 29 | Mean Difference (IV, Random, 95% CI) | ‐52.0 [‐111.39, 7.39] |
| 13 Creatinine clearance Show forest plot | 2 | 63 | Mean Difference (IV, Random, 95% CI) | 12.23 [‐0.13, 24.58] |
| Outcome or subgroup title | No. of studies | No. of participants | Statistical method | Effect size |
| 1 Death Show forest plot | 1 | 29 | Risk Ratio (M‐H, Random, 95% CI) | 0.53 [0.17, 1.68] |
| 2 Adverse renal outcomes Show forest plot | 1 | Risk Ratio (M‐H, Random, 95% CI) | Subtotals only | |
| 2.1 ESKD | 1 | 29 | Risk Ratio (M‐H, Random, 95% CI) | 0.21 [0.04, 1.02] |
| 2.2 Doubling of serum creatinine | 1 | 29 | Risk Ratio (M‐H, Random, 95% CI) | 0.16 [0.04, 0.69] |
| 3 Stable kidney function Show forest plot | 1 | 29 | Risk Ratio (M‐H, Random, 95% CI) | 1.59 [0.83, 3.06] |
| 4 Ovarian failure Show forest plot | 1 | 27 | Risk Ratio (M‐H, Random, 95% CI) | 7.32 [0.49, 108.96] |
| 5 Infection Show forest plot | 1 | Risk Ratio (M‐H, Random, 95% CI) | Subtotals only | |
| 5.1 Major infection | 1 | 29 | Risk Ratio (M‐H, Random, 95% CI) | 0.48 [0.10, 2.30] |
| 5.2 Herpes zoster virus | 1 | 29 | Risk Ratio (M‐H, Random, 95% CI) | 5.22 [0.33, 81.40] |
| 6 Bladder toxicity Show forest plot | 1 | 29 | Risk Ratio (M‐H, Random, 95% CI) | 2.43 [0.14, 42.17] |
| Outcome or subgroup title | No. of studies | No. of participants | Statistical method | Effect size |
| 1 Death Show forest plot | 3 | 78 | Risk Ratio (M‐H, Random, 95% CI) | 0.60 [0.36, 0.99] |
| 2 Complete remission of proteinuria Show forest plot | 2 | 37 | Risk Ratio (M‐H, Random, 95% CI) | 0.95 [0.54, 1.69] |
| 3 Adverse renal outcomes Show forest plot | 3 | Risk Ratio (M‐H, Random, 95% CI) | Subtotals only | |
| 3.1 ESKD | 2 | 54 | Risk Ratio (M‐H, Random, 95% CI) | 0.66 [0.17, 2.55] |
| 3.2 Renal relapse | 1 | 16 | Risk Ratio (M‐H, Random, 95% CI) | 0.78 [0.22, 2.74] |
| 3.3 Doubling of serum creatinine | 1 | 26 | Risk Ratio (M‐H, Random, 95% CI) | 0.98 [0.36, 2.68] |
| 4 Stable kidney function Show forest plot | 1 | 26 | Risk Ratio (M‐H, Random, 95% CI) | 1.01 [0.48, 2.14] |
| 5 Ovarian failure Show forest plot | 1 | 24 | Risk Ratio (M‐H, Random, 95% CI) | 2.58 [0.15, 43.86] |
| 6 Infection Show forest plot | 2 | Risk Ratio (M‐H, Random, 95% CI) | Subtotals only | |
| 6.1 Herpes zoster virus | 2 | 42 | Risk Ratio (M‐H, Random, 95% CI) | 3.56 [0.46, 27.79] |
| 7 Malignancy Show forest plot | 1 | 26 | Risk Ratio (M‐H, Random, 95% CI) | 2.0 [0.11, 37.22] |
| 8 Bone toxicity Show forest plot | 1 | 24 | Risk Ratio (M‐H, Random, 95% CI) | 3.55 [0.43, 29.42] |
| 9 Creatinine clearance Show forest plot | 1 | 24 | Mean Difference (IV, Random, 95% CI) | 5.0 [‐3.14, 13.14] |
| Outcome or subgroup title | No. of studies | No. of participants | Statistical method | Effect size |
| 1 Daily proteinuria Show forest plot | 1 | 10 | Mean Difference (IV, Random, 95% CI) | ‐1.8 [‐2.59, ‐1.01] |
| 2 Serum creatinine Show forest plot | 1 | 10 | Mean Difference (IV, Random, 95% CI) | ‐31.90 [‐73.63, 9.83] |
| 3 Creatinine clearance Show forest plot | 1 | 10 | Mean Difference (IV, Random, 95% CI) | ‐42.5 [‐85.02, 0.02] |
| Outcome or subgroup title | No. of studies | No. of participants | Statistical method | Effect size |
| 1 Adverse renal outcomes Show forest plot | 1 | Risk Ratio (M‐H, Random, 95% CI) | Subtotals only | |
| 1.1 Doubling of serum creatinine | 1 | 14 | Risk Ratio (M‐H, Random, 95% CI) | 0.0 [0.0, 0.0] |
| Outcome or subgroup title | No. of studies | No. of participants | Statistical method | Effect size |
| 1 Death Show forest plot | 2 | 125 | Risk Ratio (M‐H, Random, 95% CI) | 1.62 [0.64, 4.09] |
| 2 Adverse renal outcomes Show forest plot | 4 | 251 | Risk Ratio (M‐H, Random, 95% CI) | 0.89 [0.51, 1.55] |
| 2.1 ESKD | 3 | 143 | Risk Ratio (M‐H, Random, 95% CI) | 1.24 [0.60, 2.57] |
| 2.2 Doubling of serum creatinine | 2 | 51 | Risk Ratio (M‐H, Random, 95% CI) | 0.17 [0.02, 1.26] |
| 2.3 Deterioration of kidney function | 2 | 57 | Risk Ratio (M‐H, Random, 95% CI) | 0.53 [0.06, 4.83] |
| 3 Stable kidney function Show forest plot | 3 | 75 | Risk Ratio (M‐H, Random, 95% CI) | 1.10 [0.94, 1.30] |
| 4 Infection Show forest plot | 3 | Risk Ratio (M‐H, Random, 95% CI) | Subtotals only | |
| 4.1 Major infection | 2 | 125 | Risk Ratio (M‐H, Random, 95% CI) | 0.69 [0.35, 1.37] |
| 4.2 Herpes zoster virus | 2 | 104 | Risk Ratio (M‐H, Random, 95% CI) | 1.69 [0.10, 29.42] |
| 5 Leucopenia Show forest plot | 1 | 18 | Risk Ratio (M‐H, Random, 95% CI) | 2.60 [0.20, 34.07] |
| 6 Daily proteinuria Show forest plot | 2 | 30 | Mean Difference (IV, Random, 95% CI) | ‐0.56 [‐5.23, 4.11] |
| 7 Serum creatinine Show forest plot | 3 | 69 | Mean Difference (IV, Random, 95% CI) | ‐17.90 [‐23.41, ‐12.39] |
| 8 Creatinine clearance Show forest plot | 1 | 12 | Mean Difference (IV, Random, 95% CI) | 26.0 [‐17.60, 69.60] |
| 9 Disease activity (SLAM) Show forest plot | 1 | 18 | Mean Difference (IV, Random, 95% CI) | 0.67 [‐3.47, 4.81] |
| Outcome or subgroup title | No. of studies | No. of participants | Statistical method | Effect size |
| 1 Adverse renal outcomes Show forest plot | 1 | Risk Ratio (M‐H, Random, 95% CI) | Subtotals only | |
| 1.1 ESKD | 1 | 20 | Risk Ratio (M‐H, Random, 95% CI) | 0.24 [0.01, 4.44] |
| 2 Infection Show forest plot | 1 | Risk Ratio (M‐H, Random, 95% CI) | Subtotals only | |
| 2.1 Major infection | 1 | 20 | Risk Ratio (M‐H, Random, 95% CI) | 0.4 [0.02, 8.78] |
| 2.2 Herpes zoster virus | 1 | 20 | Risk Ratio (M‐H, Random, 95% CI) | 0.24 [0.01, 4.44] |
| 3 Leucopenia Show forest plot | 1 | 20 | Risk Ratio (M‐H, Random, 95% CI) | 0.24 [0.01, 4.44] |
| 4 Alopecia Show forest plot | 1 | 20 | Risk Ratio (M‐H, Random, 95% CI) | 0.0 [0.0, 0.0] |
| 5 Daily proteinuria Show forest plot | 1 | 20 | Mean Difference (IV, Random, 95% CI) | ‐0.10 [‐0.45, 0.25] |
| 6 Creatinine clearance Show forest plot | 1 | 20 | Mean Difference (IV, Random, 95% CI) | 15.30 [‐5.40, 36.00] |
| Outcome or subgroup title | No. of studies | No. of participants | Statistical method | Effect size |
| 1 Adverse renal outcomes Show forest plot | 1 | Risk Ratio (M‐H, Random, 95% CI) | Subtotals only | |
| 1.1 ESKD | 1 | 40 | Risk Ratio (M‐H, Random, 95% CI) | 0.4 [0.09, 1.83] |
| 1.2 Doubling of serum creatinine | 1 | 40 | Risk Ratio (M‐H, Random, 95% CI) | 0.43 [0.13, 1.43] |
| 1.3 Deterioration of kidney function | 1 | 40 | Risk Ratio (M‐H, Random, 95% CI) | 0.43 [0.13, 1.43] |
| 2 Stable kidney function Show forest plot | 1 | 40 | Risk Ratio (M‐H, Random, 95% CI) | 1.31 [0.90, 1.89] |
| 3 Ovarian failure Show forest plot | 1 | 29 | Risk Ratio (M‐H, Random, 95% CI) | 2.05 [0.60, 7.02] |
| 4 Infection Show forest plot | 1 | Risk Ratio (M‐H, Random, 95% CI) | Subtotals only | |
| 4.1 Major infection | 1 | 40 | Risk Ratio (M‐H, Random, 95% CI) | 1.0 [0.07, 14.90] |
| 4.2 Herpes zoster virus | 1 | 40 | Risk Ratio (M‐H, Random, 95% CI) | 0.5 [0.05, 5.08] |
| 5 Malignancy Show forest plot | 1 | 40 | Risk Ratio (M‐H, Random, 95% CI) | 3.0 [0.13, 69.52] |
| 6 Bone toxicity Show forest plot | 1 | 40 | Risk Ratio (M‐H, Random, 95% CI) | 1.33 [0.34, 5.21] |
| 7 Bladder toxicity Show forest plot | 1 | 40 | Risk Ratio (M‐H, Random, 95% CI) | 0.0 [0.0, 0.0] |
| Outcome or subgroup title | No. of studies | No. of participants | Statistical method | Effect size |
| 1 Death Show forest plot | 4 | Risk Ratio (M‐H, Random, 95% CI) | Subtotals only | |
| 1.1 At end of treatment duration or follow‐up | 4 | 451 | Risk Ratio (M‐H, Random, 95% CI) | 1.15 [0.34, 3.87] |
| 1.2 At 10 years | 1 | 87 | Risk Ratio (M‐H, Random, 95% CI) | 0.62 [0.11, 3.54] |
| 2 Renal relapse Show forest plot | 4 | Risk Ratio (M‐H, Random, 95% CI) | Subtotals only | |
| 2.1 At end of treatment duration or follow‐up | 4 | 452 | Risk Ratio (M‐H, Random, 95% CI) | 1.75 [1.20, 2.55] |
| 2.2 At 10 years | 1 | 87 | Risk Ratio (M‐H, Random, 95% CI) | 1.08 [0.69, 1.69] |
| 3 End‐stage kidney disease Show forest plot | 4 | Risk Ratio (M‐H, Random, 95% CI) | Subtotals only | |
| 3.1 At end of treatment duration or follow‐up | 4 | 452 | Risk Ratio (M‐H, Random, 95% CI) | 1.70 [0.52, 5.54] |
| 3.2 At 10 years | 1 | 87 | Risk Ratio (M‐H, Random, 95% CI) | 0.31 [0.03, 2.88] |
| 4 Doubling of serum creatinine Show forest plot | 4 | 452 | Risk Ratio (M‐H, Random, 95% CI) | 2.19 [1.03, 4.66] |
| 5 Ovarian failure Show forest plot | 2 | 177 | Risk Ratio (M‐H, Random, 95% CI) | 0.77 [0.17, 3.42] |
| 6 Infection Show forest plot | 3 | Risk Ratio (M‐H, Random, 95% CI) | Subtotals only | |
| 6.1 Major infection | 3 | 412 | Risk Ratio (M‐H, Random, 95% CI) | 1.08 [0.60, 1.96] |
| 6.2 Herpes zoster virus | 1 | 105 | Risk Ratio (M‐H, Random, 95% CI) | 1.27 [0.36, 4.48] |
| 7 Malignancy Show forest plot | 3 | Risk Ratio (M‐H, Random, 95% CI) | Subtotals only | |
| 7.1 At end of treatment duration or follow‐up | 3 | 370 | Risk Ratio (M‐H, Random, 95% CI) | 4.04 [0.45, 36.07] |
| 7.2 At 10 years | 1 | 87 | Risk Ratio (M‐H, Random, 95% CI) | 1.87 [0.18, 19.84] |
| 8 Leucopenia Show forest plot | 3 | 412 | Risk Ratio (M‐H, Random, 95% CI) | 5.61 [1.68, 18.72] |
| 9 Bone toxicity Show forest plot | 1 | 105 | Risk Ratio (M‐H, Random, 95% CI) | 3.06 [0.13, 73.36] |
| 10 Alopecia Show forest plot | 3 | 412 | Risk Ratio (M‐H, Random, 95% CI) | 0.95 [0.46, 1.95] |
| 11 Gastrointestinal (GI) adverse events Show forest plot | 3 | Risk Ratio (M‐H, Random, 95% CI) | Subtotals only | |
| 11.1 GI symptoms | 1 | 105 | Risk Ratio (M‐H, Random, 95% CI) | 1.02 [0.41, 2.51] |
| 11.2 Nausea | 2 | 307 | Risk Ratio (M‐H, Random, 95% CI) | 1.08 [0.65, 1.80] |
| 11.3 Diarrhoea | 2 | 307 | Risk Ratio (M‐H, Random, 95% CI) | 0.74 [0.31, 1.73] |
| 11.4 Vomiting | 2 | 307 | Risk Ratio (M‐H, Random, 95% CI) | 0.81 [0.18, 3.62] |
| 12 Daily proteinuria Show forest plot | 1 | 81 | Mean Difference (IV, Random, 95% CI) | 0.40 [‐0.53, 1.33] |
| Outcome or subgroup title | No. of studies | No. of participants | Statistical method | Effect size |
| 1 Death Show forest plot | 1 | 69 | Risk Ratio (M‐H, Random, 95% CI) | 0.0 [0.0, 0.0] |
| 2 Adverse renal outcomes Show forest plot | 1 | Risk Ratio (M‐H, Random, 95% CI) | Subtotals only | |
| 2.1 ESKD | 1 | 69 | Risk Ratio (M‐H, Random, 95% CI) | 0.0 [0.0, 0.0] |
| 2.2 Renal relapse | 1 | 69 | Risk Ratio (M‐H, Random, 95% CI) | 1.25 [0.51, 3.06] |
| 3 Infection Show forest plot | 1 | Risk Ratio (M‐H, Random, 95% CI) | Subtotals only | |
| 3.1 Major infection | 1 | 69 | Risk Ratio (M‐H, Random, 95% CI) | 2.18 [1.01, 4.73] |
| 4 Leucopenia Show forest plot | 1 | 69 | Risk Ratio (M‐H, Random, 95% CI) | 2.73 [0.95, 7.86] |
| 5 Gastrointestinal (GI) adverse events Show forest plot | 1 | Risk Ratio (M‐H, Random, 95% CI) | Subtotals only | |
| 5.1 GI disturbance | 1 | 69 | Risk Ratio (M‐H, Random, 95% CI) | 0.30 [0.09, 0.97] |
| 6 Daily proteinuria Show forest plot | 1 | 69 | Mean Difference (IV, Random, 95% CI) | 0.15 [‐0.23, 0.53] |
| 7 Disease activity (SLEDAI) Show forest plot | 1 | 69 | Mean Difference (IV, Random, 95% CI) | ‐3.20 [‐5.77, ‐0.63] |
| Outcome or subgroup title | No. of studies | No. of participants | Statistical method | Effect size |
| 1 Death Show forest plot | 1 | 39 | Risk Ratio (M‐H, Random, 95% CI) | 0.12 [0.01, 2.03] |
| 2 Adverse renal outcomes Show forest plot | 1 | Risk Ratio (M‐H, Random, 95% CI) | Subtotals only | |
| 2.1 ESKD | 1 | 39 | Risk Ratio (M‐H, Random, 95% CI) | 0.35 [0.04, 3.09] |
| 2.2 Renal relapse | 1 | 39 | Risk Ratio (M‐H, Random, 95% CI) | 0.79 [0.34, 1.85] |
| 2.3 Doubling of serum creatinine | 1 | 39 | Risk Ratio (M‐H, Random, 95% CI) | 0.79 [0.34, 1.85] |
| 3 Bladder toxicity Show forest plot | 1 | 39 | Risk Ratio (M‐H, Random, 95% CI) | 0.0 [0.0, 0.0] |
| 4 Creatinine clearance Show forest plot | 1 | 38 | Mean Difference (IV, Random, 95% CI) | ‐15.70 [‐23.71, ‐7.69] |
| Outcome or subgroup title | No. of studies | No. of participants | Statistical method | Effect size |
| 1 Adverse renal outcomes Show forest plot | 1 | Risk Ratio (M‐H, Random, 95% CI) | Subtotals only | |
| 1.1 Renal relapse | 1 | 70 | Risk Ratio (M‐H, Random, 95% CI) | 6.62 [0.35, 123.63] |
| 2 Infection Show forest plot | 1 | Risk Ratio (M‐H, Random, 95% CI) | Subtotals only | |
| 2.1 Major infection | 1 | 70 | Risk Ratio (M‐H, Random, 95% CI) | 1.26 [0.30, 5.22] |
| 3 Gastrointestinal (GI) adverse events Show forest plot | 1 | Risk Ratio (M‐H, Random, 95% CI) | Subtotals only | |
| 3.1 GI disturbance | 1 | 70 | Risk Ratio (M‐H, Random, 95% CI) | 1.89 [0.18, 19.89] |
| Outcome or subgroup title | No. of studies | No. of participants | Statistical method | Effect size |
| 1 Relapse Show forest plot | 1 | Risk Ratio (M‐H, Random, 95% CI) | Subtotals only | |
| 1.1 Renal relapse | 1 | 15 | Risk Ratio (M‐H, Random, 95% CI) | 0.38 [0.05, 2.88] |
| 1.2 Non‐renal relapse | 1 | 15 | Risk Ratio (M‐H, Random, 95% CI) | 0.38 [0.02, 7.96] |
| 2 Major infection Show forest plot | 1 | 15 | Risk Ratio (M‐H, Random, 95% CI) | 0.57 [0.06, 5.03] |
| Outcome or subgroup title | No. of studies | No. of participants | Statistical method | Effect size |
| 1 Creatinine clearance Show forest plot | 1 | 13 | Mean Difference (IV, Random, 95% CI) | 2.20 [‐37.85, 42.25] |
| 2 Daily proteinuria Show forest plot | 1 | 13 | Mean Difference (IV, Random, 95% CI) | ‐0.08 [‐0.95, 0.79] |
| 3 Serum creatinine Show forest plot | 1 | 14 | Mean Difference (IV, Random, 95% CI) | ‐35.40 [‐128.90, 58.10] |