Tratamiento inmunosupresor para la nefritis lúpica proliferativa
Referencias
References to studies included in this review
References to studies excluded from this review
References to ongoing studies
Additional references
References to other published versions of this review
Characteristics of studies
Characteristics of included studies [ordered by study ID]
| Methods |
| |
| Participants |
| |
| Interventions | Induction therapy: duration of treatment was 18 months
| |
| Outcomes |
| |
| Notes |
| |
| Risk of bias | ||
| Bias | Authors' judgement | Support for judgement |
| Random sequence generation (selection bias) | Unclear risk | Study was described as randomised, method of randomisation was not reported |
| Allocation concealment (selection bias) | Unclear risk | Insufficient information to permit judgement |
| Blinding of participants and personnel (performance bias) | High risk | Open‐label study |
| Blinding of outcome assessment (detection bias) | Unclear risk | Insufficient information to permit judgement |
| Incomplete outcome data (attrition bias) | Unclear risk | Insufficient information to permit judgement |
| Selective reporting (reporting bias) | High risk | Data unable to be meta‐analysed |
| Other bias | Unclear risk | Abstract‐only publication; insufficient information to permit judgement |
| Methods |
| |
| Participants |
| |
| Interventions | Induction therapy: duration of treatment was 6 months
| |
| Outcomes |
| |
| Notes |
| |
| Risk of bias | ||
| Bias | Authors' judgement | Support for judgement |
| Random sequence generation (selection bias) | Unclear risk | Study was described as randomised, method of randomisation was not reported |
| Allocation concealment (selection bias) | Unclear risk | Insufficient information to permit judgement |
| Blinding of participants and personnel (performance bias) | Low risk | Double‐blind with identical placebo |
| Blinding of outcome assessment (detection bias) | Unclear risk | Insufficient information to permit judgement |
| Incomplete outcome data (attrition bias) | Low risk | No missing outcome data |
| Selective reporting (reporting bias) | Low risk | Study protocol available and pre‐specified outcomes were reported |
| Other bias | High risk | Some authors involved in data acquisition and analysis are employees of pharmaceutical companies |
| Methods |
| |
| Participants |
| |
| Interventions | Induction therapy: duration of therapy was 6 months
Maintenance therapy: duration of therapy was 36 months
| |
| Outcomes | Induction therapy
Maintenance therapy
| |
| Notes |
| |
| Risk of bias | ||
| Bias | Authors' judgement | Support for judgement |
| Random sequence generation (selection bias) | Unclear risk | Participants randomly assigned (1:1, stratified by race and biopsy class, non‐blocked) but sequence of generation is not reported |
| Allocation concealment (selection bias) | Low risk | Central, computerised, interactive voice response system. Method would not allow investigator/participant to know or influence intervention group |
| Blinding of participants and personnel (performance bias) | High risk | Induction therapy ‐ Open‐label study; maintenance therapy ‐ double‐blind |
| Blinding of outcome assessment (detection bias) | Low risk | Primary outcome assessed by blinded Clinical EndPoints Committee |
| Incomplete outcome data (attrition bias) | Low risk | No missing outcome data; Induction therapy (group 1: 1 lost to follow‐up; group 2: 2 lost to follow‐up) |
| Selective reporting (reporting bias) | Low risk | Study protocol available and pre‐specified outcomes were reported |
| Other bias | High risk | Sponsored by Aspreva Pharmaceuticals Corporation included in the data analysis & authorship |
| Methods |
| |
| Participants |
| |
| Interventions | Induction therapy: duration of therapy was 12 months
| |
| Outcomes |
| |
| Notes |
| |
| Risk of bias | ||
| Bias | Authors' judgement | Support for judgement |
| Random sequence generation (selection bias) | Unclear risk | Study was described as randomised, method of randomisation was not reported |
| Allocation concealment (selection bias) | Unclear risk | Insufficient information to permit judgement |
| Blinding of participants and personnel (performance bias) | Low risk | Double‐blind, double‐dummy placebo study |
| Blinding of outcome assessment (detection bias) | Unclear risk | Insufficient information to permit judgement |
| Incomplete outcome data (attrition bias) | Low risk | No missing outcome data |
| Selective reporting (reporting bias) | High risk | Study protocol available and not all prespecified outcomes were reported |
| Other bias | High risk | Sponsor involved in authorship. The study was terminated early; there were differences in characteristics (for example eGFR) between groups at baseline |
| Methods |
| |
| Participants |
| |
| Interventions | Induction therapy: duration of therapy was 6 months
| |
| Outcomes |
| |
| Notes |
| |
| Risk of bias | ||
| Bias | Authors' judgement | Support for judgement |
| Random sequence generation (selection bias) | Unclear risk | Study was described as randomised, method of randomisation was not reported |
| Allocation concealment (selection bias) | Unclear risk | Insufficient information to permit judgement |
| Blinding of participants and personnel (performance bias) | Low risk | Double‐blind |
| Blinding of outcome assessment (detection bias) | Low risk | Outcome assessor blinded according to protocol |
| Incomplete outcome data (attrition bias) | Low risk | No missing outcome data |
| Selective reporting (reporting bias) | High risk | Not all pre‐specified outcomes reported |
| Other bias | High risk | Pharma funded; some authors involved are employees of Aurinia |
| Methods |
| |
| Participants |
| |
| Interventions | Induction therapy
| |
| Outcomes |
| |
| Notes |
| |
| Risk of bias | ||
| Bias | Authors' judgement | Support for judgement |
| Random sequence generation (selection bias) | Unclear risk | Study was described as randomised, method of randomisation was not reported |
| Allocation concealment (selection bias) | Unclear risk | Insufficient information to permit judgement |
| Blinding of participants and personnel (performance bias) | Unclear risk | Insufficient information to permit judgement |
| Blinding of outcome assessment (detection bias) | Unclear risk | Insufficient information to permit judgement |
| Incomplete outcome data (attrition bias) | Low risk | No missing outcome data |
| Selective reporting (reporting bias) | High risk | Not all expected outcomes are reported |
| Other bias | Low risk | The study appears to be free of other sources of bias |
| Methods |
| |
| Participants |
| |
| Interventions | Induction therapy
| |
| Outcomes |
| |
| Notes |
| |
| Risk of bias | ||
| Bias | Authors' judgement | Support for judgement |
| Random sequence generation (selection bias) | Low risk | A computer‐generated randomisation list was drawn up by a statistician with a block of every four participants. They enrolled participants were allocated the next available number upon entry into the study |
| Allocation concealment (selection bias) | Unclear risk | A computer‐generated randomisation list was given to the pharmacy department. Each patient collected medication directly from the pharmacy department. Unclear whether participants and or investigators might have an opportunity to influence assignment |
| Blinding of participants and personnel (performance bias) | High risk | Open‐label study |
| Blinding of outcome assessment (detection bias) | Low risk | Adjudication of primary and key secondary outcome judged at coordinating centre by personnel who had no knowledge of the treatment assignment and ratings were confirmed by repeat testing after a 1 month interval |
| Incomplete outcome data (attrition bias) | Low risk | No missing outcome data |
| Selective reporting (reporting bias) | Low risk | All expected outcomes were reported |
| Other bias | Low risk | Supported by Roche China and Astellas Ireland. Co. Ltd. Partially supported but no role in design, study or analysis |
| Methods |
| |
| Participants |
| |
| Interventions | Induction therapy
| |
| Outcomes |
| |
| Notes |
| |
| Risk of bias | ||
| Bias | Authors' judgement | Support for judgement |
| Random sequence generation (selection bias) | High risk | Participants were entered in alternating fashion into one of two treatment groups |
| Allocation concealment (selection bias) | High risk | Knowledge of prior allocation due to lack of random sequence generation and blinding |
| Blinding of participants and personnel (performance bias) | High risk | No blinding due to lack of allocation concealment |
| Blinding of outcome assessment (detection bias) | Unclear risk | Insufficient information to permit judgement |
| Incomplete outcome data (attrition bias) | High risk | Other patients were randomised, but only those with > 6 months follow‐up included in analysis. It is unclear how many other patients were randomised. |
| Selective reporting (reporting bias) | High risk | Not all of the pre‐specified primary outcomes were reported |
| Other bias | Low risk | The study appears to be free of other sources of bias |
| Methods |
| |
| Participants |
| |
| Interventions | Induction therapy
| |
| Outcomes |
| |
| Notes |
| |
| Risk of bias | ||
| Bias | Authors' judgement | Support for judgement |
| Random sequence generation (selection bias) | Unclear risk | Participants randomly assigned but methods of sequence generation are not described |
| Allocation concealment (selection bias) | Unclear risk | Insufficient information to permit judgement |
| Blinding of participants and personnel (performance bias) | Low risk | Double‐blind study |
| Blinding of outcome assessment (detection bias) | Unclear risk | Insufficient information to permit judgement |
| Incomplete outcome data (attrition bias) | Low risk | Reasons for missing outcome data unlikely to be related to true outcome |
| Selective reporting (reporting bias) | Low risk | Study protocol available and pre‐specified outcomes were reported |
| Other bias | Low risk | The study appears to be free of other sources of bias |
| Methods |
| |
| Participants |
| |
| Interventions | Induction therapy: duration of treatment 48 weeks
| |
| Outcomes |
| |
| Notes |
| |
| Risk of bias | ||
| Bias | Authors' judgement | Support for judgement |
| Random sequence generation (selection bias) | Unclear risk | Study was described as randomised, method of randomisation was not reported |
| Allocation concealment (selection bias) | Unclear risk | Insufficient information to permit judgement |
| Blinding of participants and personnel (performance bias) | Low risk | Double‐blind, placebo‐controlled study |
| Blinding of outcome assessment (detection bias) | Unclear risk | Insufficient information to permit judgement |
| Incomplete outcome data (attrition bias) | High risk | Study was terminated before completion. Only 36.8% of patients completed the 48‐week treatment period and were included in the analysis |
| Selective reporting (reporting bias) | Low risk | Study protocol available and pre‐specified outcomes were reported |
| Other bias | High risk | Genentech and Hoffman‐La Roche funded the study and were involved in study design; Conflict of interest of authors relating to the pharmaceutical companies that funded the study; High drop‐out rates (around 52%) with the early termination of the study; The 1000 mg ocrelizumab‐treated group had slightly higher proportion of Caucasian patients and a lower proportion of Asian patients than the other two groups |
| Methods |
| |
| Participants |
| |
| Interventions | Induction therapy
| |
| Outcomes |
| |
| Notes |
| |
| Risk of bias | ||
| Bias | Authors' judgement | Support for judgement |
| Random sequence generation (selection bias) | Unclear risk | Study was described as randomised, method of randomisation was not reported |
| Allocation concealment (selection bias) | Unclear risk | Insufficient information to permit judgement |
| Blinding of participants and personnel (performance bias) | Low risk | Double‐blind study |
| Blinding of outcome assessment (detection bias) | Unclear risk | Insufficient information to permit judgement |
| Incomplete outcome data (attrition bias) | Low risk | No missing outcome data |
| Selective reporting (reporting bias) | High risk | Not all expected clinical outcomes reported |
| Other bias | High risk | Phase 1b study, study underpowered; study sponsor involved in data acquisition, data analysis and reporting of the study |
| Methods |
| |
| Participants |
| |
| Interventions | Maintenance therapy: duration of treatment was 18 months
Both groups
| |
| Outcomes |
| |
| Notes |
| |
| Risk of bias | ||
| Bias | Authors' judgement | Support for judgement |
| Random sequence generation (selection bias) | Unclear risk | Study was described as randomised, method of randomisation was not reported |
| Allocation concealment (selection bias) | Low risk | Randomisation was done with sealed envelopes |
| Blinding of participants and personnel (performance bias) | Unclear risk | Whether participants and investigators were blinded was not described and treatment options were quite different suggesting that personnel were not blinded |
| Blinding of outcome assessment (detection bias) | Unclear risk | Insufficient information to permit judgement |
| Incomplete outcome data (attrition bias) | Low risk | No missing outcome data |
| Selective reporting (reporting bias) | Low risk | Study protocol available and pre‐specified outcomes were reported |
| Other bias | Low risk | The study appears to be free of other sources of bias |
| Methods |
| |
| Participants |
| |
| Interventions | Induction therapy
Other/additional treatment
| |
| Outcomes |
| |
| Notes |
| |
| Risk of bias | ||
| Bias | Authors' judgement | Support for judgement |
| Random sequence generation (selection bias) | Unclear risk | "Patients were assigned randomly to one of three treatment groups". No further details on randomisation |
| Allocation concealment (selection bias) | Low risk | Allocation drawn from a set of masked cards |
| Blinding of participants and personnel (performance bias) | High risk | Open‐label study |
| Blinding of outcome assessment (detection bias) | Unclear risk | Insufficient information to permit judgement |
| Incomplete outcome data (attrition bias) | Low risk | No missing outcome data |
| Selective reporting (reporting bias) | Low risk | Study protocol available and pre‐specified outcomes were reported |
| Other bias | Low risk | The study appears to be free of other sources of bias |
| Methods |
| |
| Participants |
| |
| Interventions | Induction therapy
| |
| Outcomes |
| |
| Notes |
| |
| Risk of bias | ||
| Bias | Authors' judgement | Support for judgement |
| Random sequence generation (selection bias) | High risk | Chronological appearance |
| Allocation concealment (selection bias) | High risk | Assigned in alternate fashion by division secretary |
| Blinding of participants and personnel (performance bias) | High risk | Open‐label study |
| Blinding of outcome assessment (detection bias) | Unclear risk | Insufficient information to permit judgement |
| Incomplete outcome data (attrition bias) | Low risk | Insufficient information to permit judgement |
| Selective reporting (reporting bias) | Low risk | All pre‐specified outcomes are reported |
| Other bias | Low risk | The study appears to be free of other sources of bias |
| Methods |
| |
| Participants |
| |
| Interventions | Induction and maintenance therapy
Other information
| |
| Outcomes |
| |
| Notes |
| |
| Risk of bias | ||
| Bias | Authors' judgement | Support for judgement |
| Random sequence generation (selection bias) | Low risk | Participants randomly assigned by drawing envelopes to one of two treatment groups in an open‐label manner |
| Allocation concealment (selection bias) | Unclear risk | Insufficient information to permit judgement |
| Blinding of participants and personnel (performance bias) | Unclear risk | Insufficient information to permit judgement |
| Blinding of outcome assessment (detection bias) | Low risk | "...Clinical status was reviewed and categorised at the coordinating centre by personnel who had no knowledge of the treatment assignment...." |
| Incomplete outcome data (attrition bias) | Low risk | No missing outcome data |
| Selective reporting (reporting bias) | Low risk | Study protocol available and pre‐specified outcomes were reported |
| Other bias | Low risk | The study appears to be free of other sources of bias |
| Methods |
| |
| Participants |
| |
| Interventions | Induction therapy: duration of therapy was 6 months
Long‐term maintenance therapy: duration of therapy was 6 months
| |
| Outcomes |
| |
| Notes |
| |
| Risk of bias | ||
| Bias | Authors' judgement | Support for judgement |
| Random sequence generation (selection bias) | Low risk | Randomisation was conducted at a central office using a computer‐based random allocation sequence table; randomisation not stratified by centre or baseline characteristic |
| Allocation concealment (selection bias) | Low risk | Allocation concealment performed by enclosing assignments in sequentially numbered, opaque, closed envelopes |
| Blinding of participants and personnel (performance bias) | High risk | Open‐label study |
| Blinding of outcome assessment (detection bias) | Unclear risk | Insufficient information to permit judgement |
| Incomplete outcome data (attrition bias) | Low risk | The primary outcome (complete remission) and secondary outcomes partial remission and treatment failure were reported on an intention to treat bases. The attrition rate for secondary safety outcomes were 92.8% (39/42) for the TAC group and 87.2% for the IV CPA group. |
| Selective reporting (reporting bias) | Low risk | Study protocol available and prespecified outcomes were reported |
| Other bias | Low risk | Astellas Pharmaceutics supplied TAC but had no role in the design or conduct of the study or analysis or interpretation of results |
| Methods |
| |
| Participants |
| |
| Interventions | Induction therapy
| |
| Outcomes |
| |
| Notes |
| |
| Risk of bias | ||
| Bias | Authors' judgement | Support for judgement |
| Random sequence generation (selection bias) | Unclear risk | Study was described as randomised, method of randomisation was not reported |
| Allocation concealment (selection bias) | Unclear risk | Insufficient information to permit judgement |
| Blinding of participants and personnel (performance bias) | High risk | Open‐label study |
| Blinding of outcome assessment (detection bias) | Unclear risk | Insufficient information to permit judgement |
| Incomplete outcome data (attrition bias) | Low risk | No missing outcome data |
| Selective reporting (reporting bias) | Low risk | Study protocol available and pre‐specified outcomes were reported |
| Other bias | Low risk | Supported from a grant from Physicians' Services Incorporated Foundation. The study appears to be free of other sources of bias |
| Methods |
| |
| Participants |
| |
| Interventions | Induction therapy
| |
| Outcomes |
| |
| Notes |
| |
| Risk of bias | ||
| Bias | Authors' judgement | Support for judgement |
| Random sequence generation (selection bias) | Unclear risk | Study was described as randomised, method of randomisation was not reported |
| Allocation concealment (selection bias) | Unclear risk | "Designated non‐medical person at each Centre who removed a pre‐folded slip of paper from a bowl" |
| Blinding of participants and personnel (performance bias) | High risk | Open‐label study |
| Blinding of outcome assessment (detection bias) | Unclear risk | Insufficient information to permit judgement |
| Incomplete outcome data (attrition bias) | Low risk | No missing outcome data |
| Selective reporting (reporting bias) | High risk | Not all relevant outcomes are reported |
| Other bias | Low risk | Supported from a grant from Physicians' Services Incorporated Foundation. The study appears to be free of other sources of bias |
| Methods |
| |
| Participants |
| |
| Interventions | Maintenance therapy: duration of therapy 1 to 3 years
| |
| Outcomes |
| |
| Notes |
| |
| Risk of bias | ||
| Bias | Authors' judgement | Support for judgement |
| Random sequence generation (selection bias) | High risk | "After induction, participants were randomly assigned, in order of enrolment by means of sealed envelopes (stratified in two groups: blacks and other participants)." ‐ consecutive sequence generation |
| Allocation concealment (selection bias) | Low risk | Sealed envelopes used |
| Blinding of participants and personnel (performance bias) | High risk | Open‐label study |
| Blinding of outcome assessment (detection bias) | Unclear risk | Insufficient information to permit judgement |
| Incomplete outcome data (attrition bias) | Low risk | No missing outcome data |
| Selective reporting (reporting bias) | Low risk | Study protocol available and pre‐specified outcomes were reported |
| Other bias | High risk | Roche pharmaceutical providing research nurse support and MMF 1999 to 2003. Authors received fees for lectures and a grant from Roche Pharmaceuticals. |
| Methods |
| |
| Participants |
| |
| Interventions | Induction and maintenance therapy: duration of therapy was 9 months induction therapy and 9 months maintenance therapy
| |
| Outcomes |
| |
| Notes |
| |
| Risk of bias | ||
| Bias | Authors' judgement | Support for judgement |
| Random sequence generation (selection bias) | Unclear risk | Randomisation 1:1, non‐blocked methods for sequence generation not reported |
| Allocation concealment (selection bias) | Low risk | Central computerised system |
| Blinding of participants and personnel (performance bias) | High risk | Open‐label study |
| Blinding of outcome assessment (detection bias) | Unclear risk | Insufficient information to permit judgement |
| Incomplete outcome data (attrition bias) | Low risk | No missing outcome data |
| Selective reporting (reporting bias) | Low risk | Study protocol available and pre‐specified outcomes were reported |
| Other bias | Low risk | Research grants from the IGA Ministry of Health, Czech Republic. The study appears to be free of other sources of bias |
| Methods |
| |
| Participants |
| |
| Interventions | Induction therapy: duration of therapy until 18 months of remission had been achieved or 4 years of protocol therapy
| |
| Outcomes |
| |
| Notes |
| |
| Risk of bias | ||
| Bias | Authors' judgement | Support for judgement |
| Random sequence generation (selection bias) | Low risk | "...drawing marked card sequence from a table of random numbers...” |
| Allocation concealment (selection bias) | Unclear risk | Insufficient information to permit judgement |
| Blinding of participants and personnel (performance bias) | Unclear risk | Insufficient information to permit judgement |
| Blinding of outcome assessment (detection bias) | Unclear risk | Insufficient information to permit judgement |
| Incomplete outcome data (attrition bias) | Low risk | 3.6% (4/111) of participants excluded as they did not complete 3 months of treatment |
| Selective reporting (reporting bias) | Low risk | All expected outcomes were reported |
| Other bias | High risk | Patients were assigned to treatment groups 1, 2 and 3 from the beginning of the study (1969). Treatment groups 4 and 5 were introduced in January 1973. Pooling of multiple studies |
| Methods |
| |
| Participants |
| |
| Interventions | Induction therapy: duration of therapy was 6 months
| |
| Outcomes |
| |
| Notes |
| |
| Risk of bias | ||
| Bias | Authors' judgement | Support for judgement |
| Random sequence generation (selection bias) | Unclear risk | Insufficient information to permit judgement |
| Allocation concealment (selection bias) | Unclear risk | Insufficient information to permit judgement |
| Blinding of participants and personnel (performance bias) | Unclear risk | Insufficient information to permit judgement |
| Blinding of outcome assessment (detection bias) | Unclear risk | Insufficient information to permit judgement |
| Incomplete outcome data (attrition bias) | Unclear risk | Insufficient information to permit judgement |
| Selective reporting (reporting bias) | High risk | Not all pre‐specified outcomes found on the protocol are reported; data could not be meta‐analysed |
| Other bias | High risk | Primary outcomes identified on clinicaltrials.gov page not reported. Focus on p‐values in the results, with no reporting of the continuous or categorical data |
| Methods |
| |
| Participants |
| |
| Interventions | Induction therapy: duration of therapy was 26 weeks
| |
| Outcomes |
| |
| Notes |
| |
| Risk of bias | ||
| Bias | Authors' judgement | Support for judgement |
| Random sequence generation (selection bias) | Low risk | Drawing lots from card sequence |
| Allocation concealment (selection bias) | Unclear risk | Insufficient information to permit judgement |
| Blinding of participants and personnel (performance bias) | Unclear risk | Insufficient information to permit judgement |
| Blinding of outcome assessment (detection bias) | Unclear risk | Insufficient information to permit judgement |
| Incomplete outcome data (attrition bias) | Unclear risk | Insufficient information to permit judgement |
| Selective reporting (reporting bias) | High risk | Not all expected outcomes are reported |
| Other bias | High risk | Pooling interventions in cytotoxic group |
| Methods |
| |
| Participants |
| |
| Interventions | Induction therapy
| |
| Outcomes |
| |
| Notes |
| |
| Risk of bias | ||
| Bias | Authors' judgement | Support for judgement |
| Random sequence generation (selection bias) | Low risk | Participants allocated within each category to treatment group A or B according to random selection. Table of random numbers used. Each incoming set of 4 participants assigned to 2 As and 2 Bs in random order |
| Allocation concealment (selection bias) | Unclear risk | Insufficient information to permit judgement |
| Blinding of participants and personnel (performance bias) | High risk | Open‐label study |
| Blinding of outcome assessment (detection bias) | Unclear risk | Insufficient information to permit judgement |
| Incomplete outcome data (attrition bias) | Unclear risk | Insufficient information to permit judgement |
| Selective reporting (reporting bias) | High risk | One or more reported primary outcomes were not pre‐specified |
| Other bias | Low risk | The study appears to be free of other sources of bias |
| Methods |
| |
| Participants |
| |
| Interventions | Induction therapy
| |
| Outcomes |
| |
| Notes |
| |
| Risk of bias | ||
| Bias | Authors' judgement | Support for judgement |
| Random sequence generation (selection bias) | Low risk | Random number tables used |
| Allocation concealment (selection bias) | Unclear risk | Insufficient information to permit judgement |
| Blinding of participants and personnel (performance bias) | High risk | Open‐label study |
| Blinding of outcome assessment (detection bias) | Unclear risk | Insufficient information to permit judgement |
| Incomplete outcome data (attrition bias) | Unclear risk | Insufficient information to permit judgement |
| Selective reporting (reporting bias) | Low risk | All expected outcomes are reported |
| Other bias | Low risk | The study appears to be free of other sources of bias |
| Methods |
| |
| Participants |
| |
| Interventions | Induction therapy
| |
| Outcomes |
| |
| Notes |
| |
| Risk of bias | ||
| Bias | Authors' judgement | Support for judgement |
| Random sequence generation (selection bias) | Unclear risk | Study was described as randomised, method of randomisation was not reported |
| Allocation concealment (selection bias) | Unclear risk | Insufficient information to permit judgement |
| Blinding of participants and personnel (performance bias) | High risk | Open‐label study |
| Blinding of outcome assessment (detection bias) | Unclear risk | Insufficient information to permit judgement |
| Incomplete outcome data (attrition bias) | Low risk | No missing outcome data |
| Selective reporting (reporting bias) | Low risk | All relevant outcomes reported |
| Other bias | Low risk | The study appears to be free of other sources of bias |
| Methods |
| |
| Participants |
| |
| Interventions | Induction therapy
| |
| Outcomes |
| |
| Notes |
| |
| Risk of bias | ||
| Bias | Authors' judgement | Support for judgement |
| Random sequence generation (selection bias) | Unclear risk | Study was described as randomised, method of randomisation was not reported |
| Allocation concealment (selection bias) | Unclear risk | Insufficient information to permit judgement |
| Blinding of participants and personnel (performance bias) | High risk | Open‐label study |
| Blinding of outcome assessment (detection bias) | Unclear risk | Insufficient information to permit judgement |
| Incomplete outcome data (attrition bias) | Unclear risk | Insufficient information to permit judgement |
| Selective reporting (reporting bias) | High risk | Not all relevant reported outcomes are reported |
| Other bias | Low risk | The study appears to be free of other sources of bias |
| Methods |
| |
| Participants |
| |
| Interventions | Induction therapy: duration of therapy not reported
| |
| Outcomes |
| |
| Notes |
| |
| Risk of bias | ||
| Bias | Authors' judgement | Support for judgement |
| Random sequence generation (selection bias) | Unclear risk | Study was described as randomised, method of randomisation was not reported |
| Allocation concealment (selection bias) | Unclear risk | Insufficient information to permit judgement |
| Blinding of participants and personnel (performance bias) | Unclear risk | Insufficient information to permit judgement |
| Blinding of outcome assessment (detection bias) | Unclear risk | Insufficient information to permit judgement |
| Incomplete outcome data (attrition bias) | Low risk | No missing outcome data |
| Selective reporting (reporting bias) | High risk | Not all expected patient outcomes reported |
| Other bias | High risk | Baseline kidney function highly different between groups. Reported outcomes with patients transferred to different groups |
| Methods |
| |
| Participants |
| |
| Interventions | Induction therapy: duration of therapy was 6 months
| |
| Outcomes |
| |
| Notes |
| |
| Risk of bias | ||
| Bias | Authors' judgement | Support for judgement |
| Random sequence generation (selection bias) | Unclear risk | Study was described as randomised, method of randomisation was not reported |
| Allocation concealment (selection bias) | Unclear risk | Insufficient information to permit judgement |
| Blinding of participants and personnel (performance bias) | High risk | Open‐label study |
| Blinding of outcome assessment (detection bias) | Unclear risk | Insufficient information to permit judgement |
| Incomplete outcome data (attrition bias) | Unclear risk | Insufficient information to permit judgement |
| Selective reporting (reporting bias) | Low risk | Study protocol available and pre‐specified outcomes were reported |
| Other bias | Low risk | The study appears to be free of other sources of bias |
| Methods |
| |
| Participants |
| |
| Interventions | Induction therapy: duration of treatment was 12 months
| |
| Outcomes |
| |
| Notes |
| |
| Risk of bias | ||
| Bias | Authors' judgement | Support for judgement |
| Random sequence generation (selection bias) | Unclear risk | Study was described as randomised, method of randomisation was not reported |
| Allocation concealment (selection bias) | Unclear risk | Insufficient information to permit judgement |
| Blinding of participants and personnel (performance bias) | High risk | Open‐label study |
| Blinding of outcome assessment (detection bias) | Unclear risk | Insufficient information to permit judgement |
| Incomplete outcome data (attrition bias) | Unclear risk | Insufficient information to permit judgement |
| Selective reporting (reporting bias) | High risk | Data unable to be meta‐analysed |
| Other bias | High risk | abstract‐only publication; funded by Roche Mexico |
| Methods |
| |
| Participants |
| |
| Interventions | Induction therapy
| |
| Outcomes |
| |
| Notes |
| |
| Risk of bias | ||
| Bias | Authors' judgement | Support for judgement |
| Random sequence generation (selection bias) | Unclear risk | Study was described as randomised, method of randomisation was not reported |
| Allocation concealment (selection bias) | Unclear risk | Insufficient information to permit judgement |
| Blinding of participants and personnel (performance bias) | High risk | Open‐label study |
| Blinding of outcome assessment (detection bias) | Unclear risk | Insufficient information to permit judgement |
| Incomplete outcome data (attrition bias) | Unclear risk | Insufficient information to permit judgement |
| Selective reporting (reporting bias) | High risk | Not all relevant reported outcomes are reported |
| Other bias | High risk | Heavy cross‐over between groups |
| Methods |
| |
| Participants |
| |
| Interventions | Maintenance therapy: duration of treatment was 12 months
| |
| Outcomes |
| |
| Notes |
| |
| Risk of bias | ||
| Bias | Authors' judgement | Support for judgement |
| Random sequence generation (selection bias) | Low risk | Participants randomly assigned (1:1, stratified by race and biopsy class, non‐blocked) by a central computerised, interactive voice response system random number table |
| Allocation concealment (selection bias) | Low risk | Used sealed, completely opaque, envelopes numbered in sequence according to a table of random numbers |
| Blinding of participants and personnel (performance bias) | High risk | Open‐label study |
| Blinding of outcome assessment (detection bias) | Unclear risk | Insufficient information to permit judgement |
| Incomplete outcome data (attrition bias) | Low risk | No missing outcome data |
| Selective reporting (reporting bias) | High risk | Not all of the study’s prespecified primary outcomes were reported |
| Other bias | Low risk | Funding source not declared. The study appears to be free of other sources of bias |
| Methods |
| |
| Participants |
| |
| Interventions | Induction therapy: duration of therapy was 12 months
| |
| Outcomes |
| |
| Notes |
| |
| Risk of bias | ||
| Bias | Authors' judgement | Support for judgement |
| Random sequence generation (selection bias) | Unclear risk | Study was described as randomised, method of randomisation was not reported, however patients were stratified according to prior treatment |
| Allocation concealment (selection bias) | Unclear risk | Insufficient information to permit judgement |
| Blinding of participants and personnel (performance bias) | Low risk | Double‐blind, double dummy placebo study |
| Blinding of outcome assessment (detection bias) | Unclear risk | Insufficient information to permit judgement |
| Incomplete outcome data (attrition bias) | Low risk | Not all relevant reported outcomes are reported |
| Selective reporting (reporting bias) | Low risk | Study protocol available and pre‐specified outcomes were reported |
| Other bias | High risk | Sponsor included in data analysis/authorship |
| Methods |
| |
| Participants |
| |
| Interventions | Induction therapy: duration of treatment was 4 months
| |
| Outcomes |
| |
| Notes |
| |
| Risk of bias | ||
| Bias | Authors' judgement | Support for judgement |
| Random sequence generation (selection bias) | Unclear risk | Study was described as randomised, method of randomisation was not reported |
| Allocation concealment (selection bias) | Unclear risk | Insufficient information to permit judgement |
| Blinding of participants and personnel (performance bias) | Low risk | Double‐blind with a cross‐over to other treatment under certain conditions (predetermined therapeutic failures) |
| Blinding of outcome assessment (detection bias) | Unclear risk | Insufficient information to permit judgement |
| Incomplete outcome data (attrition bias) | Low risk | No missing outcome data |
| Selective reporting (reporting bias) | Low risk | Study protocol available and prespecified outcomes were reported |
| Other bias | High risk | Cross‐over design and reporting of results, difficult to separate treatment effects |
| Methods |
| |
| Participants |
| |
| Interventions | Induction therapy: duration of therapy was 24 weeks
| |
| Outcomes |
| |
| Notes |
| |
| Risk of bias | ||
| Bias | Authors' judgement | Support for judgement |
| Random sequence generation (selection bias) | Low risk | Treatment assigned at central site with the use of sealed envelopes |
| Allocation concealment (selection bias) | Low risk | Sealed envelopes used |
| Blinding of participants and personnel (performance bias) | High risk | Open‐label study |
| Blinding of outcome assessment (detection bias) | Unclear risk | Insufficient information to permit judgement |
| Incomplete outcome data (attrition bias) | Low risk | No missing outcome data |
| Selective reporting (reporting bias) | High risk | Due to early termination, primary outcome as per protocol not reported; Not all expected outcomes reported |
| Other bias | High risk | The study was terminated early and there was heavy cross‐over between study arms. Funding provided by a supplemental grant from Roche laboratories |
| Methods |
| |
| Participants |
| |
| Interventions | Induction therapy
| |
| Outcomes |
| |
| Notes |
| |
| Risk of bias | ||
| Bias | Authors' judgement | Support for judgement |
| Random sequence generation (selection bias) | Low risk | Masked cards from table of random numbers |
| Allocation concealment (selection bias) | Unclear risk | Using masked card but no description methods of allocation concealment |
| Blinding of participants and personnel (performance bias) | High risk | Open‐label study |
| Blinding of outcome assessment (detection bias) | Low risk | Outcome data with the exception of adverse events, were collected in a blinded manner |
| Incomplete outcome data (attrition bias) | Low risk | No missing outcome data; participants at endpoints censored but considered in final analysis |
| Selective reporting (reporting bias) | Low risk | Study protocol available and prespecified outcomes were reported |
| Other bias | Low risk | The study appears to be free of other sources of bias |
| Methods |
| |
| Participants |
| |
| Interventions | Induction and maintenance therapy
| |
| Outcomes |
| |
| Notes |
| |
| Risk of bias | ||
| Bias | Authors' judgement | Support for judgement |
| Random sequence generation (selection bias) | Low risk | Randomisation performed at a central office with a computer program, using the minimisation determinants: centre, SCr (< 150 or > 150 μmol/L), WHO class III or IV, previous treatment with immunosuppressive medication for lupus nephritis |
| Allocation concealment (selection bias) | Unclear risk | Central office with computer program. Not sufficiently clear to determine risk |
| Blinding of participants and personnel (performance bias) | High risk | Open‐label study |
| Blinding of outcome assessment (detection bias) | Unclear risk | Insufficient information to permit judgement |
| Incomplete outcome data (attrition bias) | Low risk | No missing outcome data |
| Selective reporting (reporting bias) | Low risk | Study protocol available and pre‐specified outcomes were reported |
| Other bias | Low risk | Funding from Dutch Kidney Foundation and Dutch League against Rheumatism. One author disclosed speaking fees from Novartis. The study appears to be free of other sources of bias |
| Methods |
| |
| Participants |
| |
| Interventions | Induction therapy: duration of therapy was 24 months
| |
| Outcomes |
| |
| Notes |
| |
| Risk of bias | ||
| Bias | Authors' judgement | Support for judgement |
| Random sequence generation (selection bias) | Low risk | Slips of paper bearing letters A or B sealed in envelopes then placed in a drawer. On randomising patient, envelopes drawn randomly from drawer |
| Allocation concealment (selection bias) | Low risk | Sealed envelopes used in randomisation |
| Blinding of participants and personnel (performance bias) | High risk | Open‐label study |
| Blinding of outcome assessment (detection bias) | Unclear risk | Insufficient information to permit judgement |
| Incomplete outcome data (attrition bias) | Low risk | No missing outcome data |
| Selective reporting (reporting bias) | High risk | Not all expected clinical outcomes were reported |
| Other bias | Low risk | The study appears to be free of other sources of bias |
| Methods |
| |
| Participants |
| |
| Interventions | Induction therapy
| |
| Outcomes |
| |
| Notes |
| |
| Risk of bias | ||
| Bias | Authors' judgement | Support for judgement |
| Random sequence generation (selection bias) | Unclear risk | Insufficient information to permit judgement |
| Allocation concealment (selection bias) | Unclear risk | Insufficient information to permit judgement |
| Blinding of participants and personnel (performance bias) | High risk | Open‐label study |
| Blinding of outcome assessment (detection bias) | Unclear risk | Insufficient information to permit judgement |
| Incomplete outcome data (attrition bias) | Unclear risk | Insufficient information to permit judgement |
| Selective reporting (reporting bias) | High risk | Not all expected outcomes reported |
| Other bias | Unclear risk | Abstract‐only publication; insufficient information to permit judgement |
| Methods |
| |
| Participants |
| |
| Interventions | Induction and maintenance therapy
| |
| Outcomes |
| |
| Notes |
| |
| Risk of bias | ||
| Bias | Authors' judgement | Support for judgement |
| Random sequence generation (selection bias) | Low risk | Randomisation by minimisation |
| Allocation concealment (selection bias) | Unclear risk | Insufficient information to permit judgement |
| Blinding of participants and personnel (performance bias) | Unclear risk | Insufficient information to permit judgement |
| Blinding of outcome assessment (detection bias) | Unclear risk | Insufficient information to permit judgement |
| Incomplete outcome data (attrition bias) | Low risk | No missing outcome data |
| Selective reporting (reporting bias) | Low risk | Study protocol available and pre‐specified outcomes were reported |
| Other bias | Low risk | Supported by the European League Against Rheumatism. The study appears to be free of other sources of bias |
| Methods |
| |
| Participants |
| |
| Interventions | Induction therapy: duration of treatment was 6 months
| |
| Outcomes |
| |
| Notes |
| |
| Risk of bias | ||
| Bias | Authors' judgement | Support for judgement |
| Random sequence generation (selection bias) | Unclear risk | Insufficient information to permit judgement |
| Allocation concealment (selection bias) | Unclear risk | Insufficient information to permit judgement |
| Blinding of participants and personnel (performance bias) | Low risk | Double‐blind, double dummy placebo study |
| Blinding of outcome assessment (detection bias) | Unclear risk | Insufficient information to permit judgement |
| Incomplete outcome data (attrition bias) | Low risk | No missing outcome data |
| Selective reporting (reporting bias) | High risk | Not all prespecified outcomes were reported |
| Other bias | Unclear risk | Abstract‐only publication; insufficient information to permit judgement |
| Methods |
| |
| Participants |
| |
| Interventions | Maintenance therapy
| |
| Outcomes |
| |
| Notes |
| |
| Risk of bias | ||
| Bias | Authors' judgement | Support for judgement |
| Random sequence generation (selection bias) | Low risk | Patients stratified by block randomisation (stratification factors were gender, age and weight) |
| Allocation concealment (selection bias) | Unclear risk | Insufficient information to permit judgement |
| Blinding of participants and personnel (performance bias) | Unclear risk | Insufficient information to permit judgement |
| Blinding of outcome assessment (detection bias) | Unclear risk | Insufficient information to permit judgement |
| Incomplete outcome data (attrition bias) | Low risk | No missing outcome data |
| Selective reporting (reporting bias) | Low risk | Trial registration was not reported, all expected outcomes were reported |
| Other bias | Low risk | The study appears to be free of other sources of bias |
| Methods |
| |
| Participants |
| |
| Interventions | Induction therapy
| |
| Outcomes |
| |
| Notes |
| |
| Risk of bias | ||
| Bias | Authors' judgement | Support for judgement |
| Random sequence generation (selection bias) | Low risk | "We stratified patients into two strata according to the classification of renal pathology (Class III–IV LN or Class V III/IV LN). Patients were randomly assigned 1:1 to a TAC group or an MMF group." |
| Allocation concealment (selection bias) | Low risk | To preserve the allocation concealment, the generation of blocks of four to six randomisation lists was electronically produced at Ramathibodi Hospital and web‐based randomizations was used. |
| Blinding of participants and personnel (performance bias) | High risk | Open‐label study |
| Blinding of outcome assessment (detection bias) | Unclear risk | Insufficient information to permit judgement |
| Incomplete outcome data (attrition bias) | Low risk | No missing outcome data |
| Selective reporting (reporting bias) | Low risk | Study protocol available and pre‐specified outcomes were reported |
| Other bias | Low risk | "Astellas Pharma (Thailand) Co., Ltd. provided study drug and funded the study but had no role in study design, data collection, data analysis, data interpretation or conclusions." The study appears to be free of other sources of bias |
| Methods |
| |
| Participants |
| |
| Interventions | Induction therapy
| |
| Outcomes |
| |
| Notes |
| |
| Risk of bias | ||
| Bias | Authors' judgement | Support for judgement |
| Random sequence generation (selection bias) | Low risk | Stratified according to clinic by central coordination centre |
| Allocation concealment (selection bias) | Low risk | Generated by Biostatistical Coordinating centre which issued treatment assignments by telephone after confirmation of patient eligibility |
| Blinding of participants and personnel (performance bias) | High risk | Open‐label study |
| Blinding of outcome assessment (detection bias) | Unclear risk | Insufficient information to permit judgement |
| Incomplete outcome data (attrition bias) | Low risk | No missing outcome data; 1 patient lost‐to follow‐up |
| Selective reporting (reporting bias) | Low risk | Study protocol available and pre‐specified outcomes were reported |
| Other bias | High risk | The study was terminated early |
| Methods |
| |
| Participants |
| |
| Interventions | Induction therapy
| |
| Outcomes |
| |
| Notes |
| |
| Risk of bias | ||
| Bias | Authors' judgement | Support for judgement |
| Random sequence generation (selection bias) | Low risk | Randomisation according to a randomisation table kept by a third party |
| Allocation concealment (selection bias) | Low risk | Randomisation table kept by a third party |
| Blinding of participants and personnel (performance bias) | High risk | Open‐label study |
| Blinding of outcome assessment (detection bias) | Unclear risk | Insufficient information to permit judgement |
| Incomplete outcome data (attrition bias) | Low risk | No missing outcome data |
| Selective reporting (reporting bias) | High risk | Not all expected outcomes were reported |
| Other bias | Low risk | "...Roche provided study drug but had no role in study design, data collection, data analysis, data interpretation or writing of the report..." The study appears to be free of other sources of bias |
| Methods |
| |
| Participants |
| |
| Interventions | Induction therapy: duration of treatment was 6 months
| |
| Outcomes |
| |
| Notes |
| |
| Risk of bias | ||
| Bias | Authors' judgement | Support for judgement |
| Random sequence generation (selection bias) | Unclear risk | Study was described as randomised, method of randomisation was not reported |
| Allocation concealment (selection bias) | Unclear risk | Insufficient information to permit judgement |
| Blinding of participants and personnel (performance bias) | High risk | Open‐label study |
| Blinding of outcome assessment (detection bias) | Unclear risk | Insufficient information to permit judgement |
| Incomplete outcome data (attrition bias) | Low risk | No missing outcome data |
| Selective reporting (reporting bias) | Low risk | Study protocol available and pre‐specified outcomes were reported |
| Other bias | Low risk | The study appears to be free of other sources of bias |
| Methods |
| |
| Participants |
| |
| Interventions | Induction and maintenance therapy: 6 months induction therapy and 12 months maintenance therapy
| |
| Outcomes |
| |
| Notes |
| |
| Risk of bias | ||
| Bias | Authors' judgement | Support for judgement |
| Random sequence generation (selection bias) | Unclear risk | Insufficient information to permit judgement |
| Allocation concealment (selection bias) | Unclear risk | Insufficient information to permit judgement |
| Blinding of participants and personnel (performance bias) | High risk | Open‐label study |
| Blinding of outcome assessment (detection bias) | Unclear risk | Insufficient information to permit judgement |
| Incomplete outcome data (attrition bias) | Unclear risk | Insufficient information to permit judgement |
| Selective reporting (reporting bias) | High risk | Not all expected clinical outcomes are reported |
| Other bias | Unclear risk | Abstract‐only publication; insufficient information to permit judgement |
| Methods |
| |
| Participants |
| |
| Interventions | Induction therapy: duration of therapy was 6 months
| |
| Outcomes |
| |
| Notes |
| |
| Risk of bias | ||
| Bias | Authors' judgement | Support for judgement |
| Random sequence generation (selection bias) | Low risk | Randomisation list, stratified by centre was created by Rundo International Pharmaceutical Research & Development (Shanghai) Co. Ltd. by using computer generated random‐number sequences |
| Allocation concealment (selection bias) | Low risk | Sequentially numbered, concealed envelopes containing group assignment were provided to the investigators. After eligible patients provided written informed consent, the envelopes were opened in sequence and patients were randomly assigned, in a 1:1 ratio, to the multi‐target regimen or IV CPA |
| Blinding of participants and personnel (performance bias) | High risk | Open‐label study |
| Blinding of outcome assessment (detection bias) | Low risk | The outcomes were adjudicated by the Clinical Endpoints Committee, blinded to treatment regimen. |
| Incomplete outcome data (attrition bias) | High risk | Unclear why 6 patients (3%) in the IV CPA group were not given therapy and not included in the analysis and why patients in the IV CPA group were seen at twice the follow‐up rate then patients in the multi‐target therapy group |
| Selective reporting (reporting bias) | High risk | Not all prespecified outcomes were reported |
| Other bias | Low risk | This study appears to be free of other sources of bias |
| Methods |
| |
| Participants |
| |
| Interventions | Induction therapy: duration of therapy was 6 months
| |
| Outcomes |
| |
| Notes |
| |
| Risk of bias | ||
| Bias | Authors' judgement | Support for judgement |
| Random sequence generation (selection bias) | High risk | Consecutive enrolment |
| Allocation concealment (selection bias) | Unclear risk | Insufficient information to permit judgement |
| Blinding of participants and personnel (performance bias) | High risk | Open‐label study |
| Blinding of outcome assessment (detection bias) | Unclear risk | Insufficient information to permit judgement |
| Incomplete outcome data (attrition bias) | Unclear risk | Insufficient information to permit judgement |
| Selective reporting (reporting bias) | High risk | Not all expected outcomes were reported |
| Other bias | High risk | Marked differences (demographics and clinical characteristics) between groups at baseline |
| Methods |
| |
| Participants |
| |
| Interventions | Induction therapy
| |
| Outcomes |
| |
| Notes |
| |
| Risk of bias | ||
| Bias | Authors' judgement | Support for judgement |
| Random sequence generation (selection bias) | Unclear risk | Insufficient information to permit judgement |
| Allocation concealment (selection bias) | Unclear risk | Insufficient information to permit judgement |
| Blinding of participants and personnel (performance bias) | High risk | Open‐label study |
| Blinding of outcome assessment (detection bias) | Unclear risk | Insufficient information to permit judgement |
| Incomplete outcome data (attrition bias) | Unclear risk | Insufficient information to permit judgement |
| Selective reporting (reporting bias) | Unclear risk | Insufficient information to permit judgement |
| Other bias | Unclear risk | Abstract‐only publication; insufficient information to permit judgement |
| Methods |
| |
| Participants |
| |
| Interventions | Induction therapy: duration of therapy was 12 months
| |
| Outcomes |
| |
| Notes |
| |
| Risk of bias | ||
| Bias | Authors' judgement | Support for judgement |
| Random sequence generation (selection bias) | Unclear risk | Study was described as randomised, method of randomisation was not reported |
| Allocation concealment (selection bias) | Unclear risk | Insufficient information to permit judgement |
| Blinding of participants and personnel (performance bias) | Low risk | Double‐blind, double‐dummy placebo study |
| Blinding of outcome assessment (detection bias) | Unclear risk | Insufficient information to permit judgement |
| Incomplete outcome data (attrition bias) | Low risk | No missing outcome data |
| Selective reporting (reporting bias) | Low risk | Study protocol available and pre‐specified outcomes were reported |
| Other bias | High risk | Some authors declared grants/research support from Genentech and Aspreva, and sponsor included in data analysis and authorship |
| Methods |
| |
| Participants |
| |
| Interventions | Maintenance therapy
| |
| Outcomes |
| |
| Notes |
| |
| Risk of bias | ||
| Bias | Authors' judgement | Support for judgement |
| Random sequence generation (selection bias) | Unclear risk | Randomisation by minimisation |
| Allocation concealment (selection bias) | Unclear risk | Insufficient information to permit judgement |
| Blinding of participants and personnel (performance bias) | High risk | Open‐label study |
| Blinding of outcome assessment (detection bias) | Unclear risk | Insufficient information to permit judgement |
| Incomplete outcome data (attrition bias) | Low risk | No missing outcome data |
| Selective reporting (reporting bias) | Low risk | Study protocol available and pre‐specified outcomes were reported |
| Other bias | Low risk | No competing interests declared. The study appears to be free of other sources of bias |
| Methods |
| |
| Participants |
| |
| Interventions | Induction therapy
| |
| Outcomes |
| |
| Notes |
| |
| Risk of bias | ||
| Bias | Authors' judgement | Support for judgement |
| Random sequence generation (selection bias) | Low risk | "Patients were randomised, using block randomization, eight blocks of 10 patients each with 1:1 random allocation was performed using a computer generated random number table." |
| Allocation concealment (selection bias) | Low risk | "Fellow researcher had given random block and number to patients sequentially, who was unaware of treatment allocation and had no other role in the study." |
| Blinding of participants and personnel (performance bias) | High risk | Open‐label study |
| Blinding of outcome assessment (detection bias) | Unclear risk | Insufficient information to permit judgement |
| Incomplete outcome data (attrition bias) | Low risk | No missing outcome data |
| Selective reporting (reporting bias) | High risk | Not all expected outcomes were reported and partial remission listed in protocol not reported. |
| Other bias | Low risk | The study appears to be free of other sources of bias |
| Methods |
| |
| Participants |
| |
| Interventions | Induction therapy
| |
| Outcomes |
| |
| Notes |
| |
| Risk of bias | ||
| Bias | Authors' judgement | Support for judgement |
| Random sequence generation (selection bias) | Unclear risk | Study was described as randomised, method of randomisation was not reported |
| Allocation concealment (selection bias) | Unclear risk | Insufficient information to permit judgement |
| Blinding of participants and personnel (performance bias) | High risk | Open‐label study |
| Blinding of outcome assessment (detection bias) | Unclear risk | Insufficient information to permit judgement |
| Incomplete outcome data (attrition bias) | Low risk | No missing outcome data |
| Selective reporting (reporting bias) | High risk | No protocol available, some expected outcomes not reported |
| Other bias | Low risk | The study appears to be free of other sources of bias |
| Methods |
| |
| Participants |
| |
| Interventions | Induction therapy
Maintenance therapy both (groups)
| |
| Outcomes |
| |
| Notes |
| |
| Risk of bias | ||
| Bias | Authors' judgement | Support for judgement |
| Random sequence generation (selection bias) | Unclear risk | Study was described as randomised, method of randomisation was not reported |
| Allocation concealment (selection bias) | Unclear risk | Insufficient information to permit judgement |
| Blinding of participants and personnel (performance bias) | Low risk | Double‐blind study |
| Blinding of outcome assessment (detection bias) | Low risk | Outcome assessor was blinded according to the protocol |
| Incomplete outcome data (attrition bias) | Low risk | No missing outcome data |
| Selective reporting (reporting bias) | Low risk | All outcomes on clinicaltrials.gov are reported |
| Other bias | High risk | Marked differences in clinical characteristics between the groups ‐ median cumulative dose of CPA between the groups, high rates of leucopenia in the low dose compared to the high dose CPA group at baseline |
| Methods |
| |
| Participants |
| |
| Interventions | Induction therapy and maintenance therapy
| |
| Outcomes |
| |
| Notes |
| |
| Risk of bias | ||
| Bias | Authors' judgement | Support for judgement |
| Random sequence generation (selection bias) | Low risk | Participants were randomised by computer‐generated blocks of four in a 1:1 ratio |
| Allocation concealment (selection bias) | Unclear risk | Central research assistant was responsible for treatment allocation |
| Blinding of participants and personnel (performance bias) | High risk | Open‐label study |
| Blinding of outcome assessment (detection bias) | Unclear risk | Insufficient information to permit judgement |
| Incomplete outcome data (attrition bias) | Low risk | No missing outcome data |
| Selective reporting (reporting bias) | Low risk | Study protocol available and pre‐specified outcomes were reported |
| Other bias | Low risk | The study appears to be free of other sources of bias |
| Methods |
| |
| Participants |
| |
| Interventions | Maintenance therapy: duration of therapy was 24 months
| |
| Outcomes |
| |
| Notes |
| |
| Risk of bias | ||
| Bias | Authors' judgement | Support for judgement |
| Random sequence generation (selection bias) | Low risk | Randomisation according to a coin‐based design |
| Allocation concealment (selection bias) | Low risk | Stratified by centre and performed centrally. Phone calls to randomisation centre‐computer program assigned participants |
| Blinding of participants and personnel (performance bias) | High risk | Open‐label study |
| Blinding of outcome assessment (detection bias) | Low risk | Blinded endpoint study |
| Incomplete outcome data (attrition bias) | Low risk | No missing outcome data |
| Selective reporting (reporting bias) | Low risk | Study protocol available and pre‐specified outcomes were reported |
| Other bias | High risk | Sponsor included in data management and analysis: Novartis Pharma and authorship |
| Methods |
| |
| Participants |
| |
| Interventions | Induction therapy: duration of therapy was 24 months
| |
| Outcomes |
| |
| Notes |
| |
| Risk of bias | ||
| Bias | Authors' judgement | Support for judgement |
| Random sequence generation (selection bias) | Unclear risk | Study was described as randomised, method of randomisation was not reported |
| Allocation concealment (selection bias) | Unclear risk | Insufficient information to permit judgement |
| Blinding of participants and personnel (performance bias) | High risk | Open‐label study |
| Blinding of outcome assessment (detection bias) | Unclear risk | Insufficient information to permit judgement |
| Incomplete outcome data (attrition bias) | Low risk | No missing outcome data |
| Selective reporting (reporting bias) | High risk | Not all expected clinical outcomes reported and no protocol available; abstract‐only publication |
| Other bias | Unclear risk | Abstract‐only publication; insufficient information to permit judgement |
| Methods |
| |
| Participants |
| |
| Interventions | Induction therapy: duration of therapy was 6 months
| |
| Outcomes |
| |
| Notes |
| |
| Risk of bias | ||
| Bias | Authors' judgement | Support for judgement |
| Random sequence generation (selection bias) | Unclear risk | Study was described as randomised, method of randomisation was not reported |
| Allocation concealment (selection bias) | High risk | Insufficient information to permit judgement |
| Blinding of participants and personnel (performance bias) | High risk | Open‐label study |
| Blinding of outcome assessment (detection bias) | Unclear risk | Insufficient information to permit judgement |
| Incomplete outcome data (attrition bias) | Low risk | No missing outcome data |
| Selective reporting (reporting bias) | High risk | Not all expected outcomes were reported |
| Other bias | High risk | Novartis Pharma AG funded. Sponsor involved in authorship, Disclosure of consulting fees from Novartis Pharma, Amgen, BMS and Roche |
| Methods |
| |
| Participants |
| |
| Interventions | Induction therapy: duration of therapy was 6 months
| |
| Outcomes |
| |
| Notes |
| |
| Risk of bias | ||
| Bias | Authors' judgement | Support for judgement |
| Random sequence generation (selection bias) | Unclear risk | Study was described as randomised, method of randomisation was not reported |
| Allocation concealment (selection bias) | Unclear risk | Insufficient information to permit judgement |
| Blinding of participants and personnel (performance bias) | High risk | Open‐label study |
| Blinding of outcome assessment (detection bias) | Unclear risk | Insufficient information to permit judgement |
| Incomplete outcome data (attrition bias) | Unclear risk | Insufficient information to permit judgement |
| Selective reporting (reporting bias) | High risk | Not all expected outcomes were reported |
| Other bias | Low risk | The study appears to be free of other sources of bias |
| Methods |
| |
| Participants |
| |
| Interventions | Induction therapy: duration of therapy was 6 months
| |
| Outcomes |
| |
| Notes |
| |
| Risk of bias | ||
| Bias | Authors' judgement | Support for judgement |
| Random sequence generation (selection bias) | Low risk | Randomisation code generated separately for each centre using random permutated block method with randomly varying block size (1:1) |
| Allocation concealment (selection bias) | Low risk | Randomisation performed centrally |
| Blinding of participants and personnel (performance bias) | High risk | Open‐label study |
| Blinding of outcome assessment (detection bias) | Unclear risk | Insufficient information to permit judgement |
| Incomplete outcome data (attrition bias) | Low risk | No missing outcome data |
| Selective reporting (reporting bias) | Low risk | Study protocol available and pre‐specified outcomes were reported |
| Other bias | Low risk | The study appears to be free of other sources of bias |
| Methods |
| |
| Participants |
| |
| Interventions | Induction therapy: duration of therapy not reported
| |
| Outcomes |
| |
| Notes |
| |
| Risk of bias | ||
| Bias | Authors' judgement | Support for judgement |
| Random sequence generation (selection bias) | Unclear risk | Study was described as randomised, method of randomisation was not reported |
| Allocation concealment (selection bias) | Unclear risk | Insufficient information to permit judgement |
| Blinding of participants and personnel (performance bias) | High risk | Likely to be an open‐label study |
| Blinding of outcome assessment (detection bias) | Unclear risk | Insufficient information to permit judgement |
| Incomplete outcome data (attrition bias) | Unclear risk | Insufficient information to permit judgement |
| Selective reporting (reporting bias) | High risk | Not all expected outcomes have been reported |
| Other bias | Unclear risk | Abstract‐only publication; insufficient information to permit judgement |
| Methods |
| |
| Participants |
| |
| Interventions | Induction therapy
Maintenance therapy
| |
| Outcomes |
| |
| Notes |
| |
| Risk of bias | ||
| Bias | Authors' judgement | Support for judgement |
| Random sequence generation (selection bias) | Unclear risk | Study was described as randomised, method of randomisation was not reported |
| Allocation concealment (selection bias) | Unclear risk | Insufficient information to permit judgement |
| Blinding of participants and personnel (performance bias) | High risk | Open‐label study |
| Blinding of outcome assessment (detection bias) | Unclear risk | Insufficient information to permit judgement |
| Incomplete outcome data (attrition bias) | Unclear risk | Insufficient information to permit judgement |
| Selective reporting (reporting bias) | Low risk | Study protocol available from Indian clinical trials registry and pre‐specified outcomes were reported |
| Other bias | High risk | High dropout rate; baseline characteristics different between the two groups with UPCR significantly higher in the CPA group |
| Methods |
| |
| Participants |
| |
| Interventions | Induction therapy: duration of therapy was 6 months
| |
| Outcomes |
| |
| Notes |
| |
| Risk of bias | ||
| Bias | Authors' judgement | Support for judgement |
| Random sequence generation (selection bias) | Unclear risk | Study was described as randomised, method of randomisation was not reported |
| Allocation concealment (selection bias) | Unclear risk | Insufficient information to permit judgement |
| Blinding of participants and personnel (performance bias) | Low risk | Double‐blind, placebo‐controlled study |
| Blinding of outcome assessment (detection bias) | Unclear risk | Insufficient information to permit judgement |
| Incomplete outcome data (attrition bias) | Low risk | No missing outcome data |
| Selective reporting (reporting bias) | High risk | Not all pre‐specified outcomes were reported |
| Other bias | High risk | Marked differences (demographics and clinical characteristics) between groups at baseline. Sponsor involved in authorship |
| Methods |
| |
| Participants |
| |
| Interventions | Induction therapy: duration of therapy was 12 months
| |
| Outcomes |
| |
| Notes |
| |
| Risk of bias | ||
| Bias | Authors' judgement | Support for judgement |
| Random sequence generation (selection bias) | High risk | All participants meeting inclusion criteria randomised. Manual randomisation to allocate every other patient to either group and then assigned to one of 2 regimens. Six participants with most severe form of lupus nephritis allocated to high dose arm |
| Allocation concealment (selection bias) | High risk | Use of alternation to allocate |
| Blinding of participants and personnel (performance bias) | Unclear risk | Insufficient information to permit judgement |
| Blinding of outcome assessment (detection bias) | Unclear risk | Insufficient information to permit judgement |
| Incomplete outcome data (attrition bias) | Low risk | No missing outcome data |
| Selective reporting (reporting bias) | Unclear risk | No study protocol available, all expected outcomes were reported |
| Other bias | Unclear risk | Differences in baseline characteristics between the groups (more severe proteinuria and lower serum albumin in high dose CPA |
| Methods |
| |
| Participants |
| |
| Interventions | Induction therapy: duration of therapy was 6 months
| |
| Outcomes |
| |
| Notes |
| |
| Risk of bias | ||
| Bias | Authors' judgement | Support for judgement |
| Random sequence generation (selection bias) | Unclear risk | Study was described as randomised, method of randomisation was not reported |
| Allocation concealment (selection bias) | Unclear risk | Insufficient information to permit judgement |
| Blinding of participants and personnel (performance bias) | High risk | Open‐label study |
| Blinding of outcome assessment (detection bias) | Unclear risk | Insufficient information to permit judgement |
| Incomplete outcome data (attrition bias) | Unclear risk | Insufficient information to provide judgement |
| Selective reporting (reporting bias) | Unclear risk | Insufficient information to provide judgement |
| Other bias | High risk | Characteristics of the six patients unable to complete the study period are not provided and these patients were not included in the analysis; abstract‐only publication |
| Methods |
| |
| Participants |
| |
| Interventions | Induction therapy: duration of therapy was 10 months
| |
| Outcomes |
| |
| Notes |
| |
| Risk of bias | ||
| Bias | Authors' judgement | Support for judgement |
| Random sequence generation (selection bias) | Unclear risk | Study was described as randomised, method of randomisation was not reported |
| Allocation concealment (selection bias) | Unclear risk | Insufficient information to permit judgement |
| Blinding of participants and personnel (performance bias) | Unclear risk | Insufficient information to permit judgement |
| Blinding of outcome assessment (detection bias) | Unclear risk | Insufficient information to permit judgement |
| Incomplete outcome data (attrition bias) | Low risk | No missing outcome data |
| Selective reporting (reporting bias) | Low risk | All expected outcomes were reported |
| Other bias | High risk | Proteinuria between groups at baseline was different |
| Methods |
| |
| Participants |
| |
| Interventions | Maintenance therapy: duration of therapy was 36 months
| |
| Outcomes |
| |
| Notes |
| |
| Risk of bias | ||
| Bias | Authors' judgement | Support for judgement |
| Random sequence generation (selection bias) | Low risk | "Patients were randomly allocated to either the prednisone or placebo group using a random number list generated by an independent statistician. Randomization was blocked and stratified according to the duration of steroid treatment at the time of enrollment (≤12 months or >12 months) and remission status (partial or complete)." |
| Allocation concealment (selection bias) | Low risk | "Allocation was concealed using sealed, opaque, sequentially numbered envelopes maintained by an independent physician. When a participant was randomised, the independent physician faxed the study number and assigned treatment to the study pharmacy." |
| Blinding of participants and personnel (performance bias) | Low risk | Double‐blind study "Patients, investigators, care providers and data analysts remained blinded to study treatment throughout the trial." |
| Blinding of outcome assessment (detection bias) | Low risk | "Patients, investigators, care providers and data analysts remained blinded to study treatment throughout the trial." |
| Incomplete outcome data (attrition bias) | Low risk | No missing outcome data |
| Selective reporting (reporting bias) | High risk | All prespecified outcomes are reported, but not all expected outcomes are reported |
| Other bias | High risk | Pilot study ‐ underpowered |
| Methods |
| |
| Participants |
| |
| Interventions | Induction therapy: duration of treatment was 10 weeks
| |
| Outcomes |
| |
| Notes |
| |
| Risk of bias | ||
| Bias | Authors' judgement | Support for judgement |
| Random sequence generation (selection bias) | Low risk | Used consecutively numbered envelopes, each containing a randomly assigned prescription for placebo or CPA |
| Allocation concealment (selection bias) | Low risk | As each patient entered the study, the next sequential envelope was opened in the pharmacy |
| Blinding of participants and personnel (performance bias) | Low risk | Double‐blind study |
| Blinding of outcome assessment (detection bias) | Unclear risk | Insufficient information to permit judgement |
| Incomplete outcome data (attrition bias) | Low risk | No missing outcome data |
| Selective reporting (reporting bias) | Low risk | Study protocol available and pre‐specified outcomes were reported |
| Other bias | High risk | Cross‐over of two participants from the placebo to CPA arm were included in the analysis |
| Methods |
| |
| Participants |
| |
| Interventions | Induction therapy: duration of therapy was 6 months
| |
| Outcomes |
| |
| Notes |
| |
| Risk of bias | ||
| Bias | Authors' judgement | Support for judgement |
| Random sequence generation (selection bias) | Unclear risk | Study was described as randomised, method of randomisation was not reported |
| Allocation concealment (selection bias) | Unclear risk | Insufficient information to permit judgement |
| Blinding of participants and personnel (performance bias) | High risk | Open‐label study |
| Blinding of outcome assessment (detection bias) | Unclear risk | Insufficient information to permit judgement |
| Incomplete outcome data (attrition bias) | Low risk | No missing outcome data |
| Selective reporting (reporting bias) | Low risk | No study protocol available but expected outcomes are reported |
| Other bias | Low risk | The study appears to be free of other sources of bias |
| Methods |
| |
| Participants |
| |
| Interventions | Induction therapy: duration of treatment was 8 months
| |
| Outcomes |
| |
| Notes |
| |
| Risk of bias | ||
| Bias | Authors' judgement | Support for judgement |
| Random sequence generation (selection bias) | Unclear risk | Study was described as randomised, method of randomisation was not reported |
| Allocation concealment (selection bias) | Unclear risk | Insufficient information to permit judgement |
| Blinding of participants and personnel (performance bias) | High risk | Open‐label study |
| Blinding of outcome assessment (detection bias) | Unclear risk | Insufficient information to permit judgement |
| Incomplete outcome data (attrition bias) | Low risk | No missing outcome data |
| Selective reporting (reporting bias) | High risk | Not all expected outcomes were reported |
| Other bias | Low risk | The study appears to be free of other sources of bias |
| Methods |
| |
| Participants |
| |
| Interventions | Induction therapy: duration of treatment was 6 months
| |
| Outcomes |
| |
| Notes |
| |
| Risk of bias | ||
| Bias | Authors' judgement | Support for judgement |
| Random sequence generation (selection bias) | Unclear risk | Study was described as randomised, method of randomisation was not reported |
| Allocation concealment (selection bias) | Unclear risk | Insufficient information to permit judgement |
| Blinding of participants and personnel (performance bias) | Unclear risk | Insufficient information to permit judgement |
| Blinding of outcome assessment (detection bias) | Unclear risk | Insufficient information to permit judgement |
| Incomplete outcome data (attrition bias) | Unclear risk | Insufficient information to permit judgement |
| Selective reporting (reporting bias) | High risk | Not all relevant clinical outcomes reported |
| Other bias | Unclear risk | Insufficient information to permit judgement; abstract‐only publication |
| Methods |
| |
| Participants |
| |
| Interventions | Induction therapy: duration of treatment was 24 months
| |
| Outcomes |
| |
| Notes |
| |
| Risk of bias | ||
| Bias | Authors' judgement | Support for judgement |
| Random sequence generation (selection bias) | Low risk | Participants were stratified according to the presence of kidney failure and underwent block randomisation to either therapy |
| Allocation concealment (selection bias) | Unclear risk | Insufficient information to permit judgement |
| Blinding of participants and personnel (performance bias) | High risk | Open‐label study |
| Blinding of outcome assessment (detection bias) | Unclear risk | Insufficient information to permit judgement |
| Incomplete outcome data (attrition bias) | Low risk | No missing outcome data |
| Selective reporting (reporting bias) | High risk | Not all pre‐specified outcomes reported: alopecia |
| Other bias | High risk | Study was terminated after four years as patient recruitment was disappointing and many patients had been withdrawn; Many physicians became reluctant to enter patients because of concerns that the oral regimen was slower to work and more toxic than the pulse regimen, following development of severe neutropenia in the continuous group; This led to the premature termination of the study |
| Methods |
| |
| Participants |
| |
| Interventions | Induction therapy
| |
| Outcomes |
| |
| Notes |
| |
| Risk of bias | ||
| Bias | Authors' judgement | Support for judgement |
| Random sequence generation (selection bias) | Unclear risk | Study was described as randomised, method of randomisation was not reported |
| Allocation concealment (selection bias) | Unclear risk | Insufficient information to permit judgement |
| Blinding of participants and personnel (performance bias) | High risk | Open‐label study |
| Blinding of outcome assessment (detection bias) | Unclear risk | Insufficient information to permit judgement |
| Incomplete outcome data (attrition bias) | Unclear risk | Insufficient information to permit judgement |
| Selective reporting (reporting bias) | High risk | Data unable to be meta‐analysed |
| Other bias | Unclear risk | Abstract‐only publication; insufficient information to permit judgement |
ACEi ‐ angiotensin‐converting enzyme inhibitor; ACR ‐ American College of Rheumatology; ANA ‐ antinuclear antibody; ARA ‐ American Rheumatology Association; ARB ‐ angiotensin receptor blocker; AZA ‐ azathioprine; BILAG ‐ British Isles Lupus Assessment Group; CKD ‐ chronic kidney disease; CMV ‐ cytomegalovirus; CNI ‐ calcineurin; CNS ‐ central nervous system; CPA ‐ cyclophosphamide; CrCl ‐ creatinine clearance; CSA ‐ cyclosporin A; DM ‐ diabetes mellitus; EC‐MPS ‐ enteric‐coated mycophenolate sodium; eGFR ‐ estimated glomerular filtration rate; ELNT ‐ Euro‐lupus nephritis treatment; ESKD ‐ end‐stage kidney disease; GI ‐ gastrointestinal: GN ‐ glomerulonephritis; Hb ‐ haemoglobin; HBV ‐ hepatitis B virus; HCV ‐ hepatitis C virus; HIV ‐ human immunodeficiency virus; HPF ‐ high power field; IA ‐ immunoadsorption; ISN/RPS ‐ International Society of Nephrology/Renal Pathology Society; IV ‐ intravenous; IVIG ‐ intravenous immunoglobulin; M/F ‐ male/female; MMF ‐ mycophenolate mofetil; MP ‐ methylprednisolone; NSAID/s ‐ nonsteroidal anti‐inflammatory drug/s; PEX ‐ plasma exchange or plasmapheresis; PALGA ‐ Dutch Pathology Registry; RBC ‐ red blood cell/s; RCC ‐ red cell count; RCT ‐ randomised controlled trial; RTX ‐ rituximab; SC ‐ subcutaneous; SCr ‐ serum creatinine; SD ‐ standard deviation; SDS ‐ standard deviation score; SLE ‐ systemic lupus erythematosus; SLEDAI ‐ SLE Disease Activity Index; SLICC ‐ Systemic Lupus Collaborating Clinics; TAC ‐ tacrolimus; TB ‐ tuberculosis; WHO ‐ World Health Organization; ISN/RPS ‐ International Society of Nephrology/ Renal Pathology Society; UPCR ‐ urine protein‐to‐creatinine ratio; WBC ‐ white blood cell/s; WCC ‐ white cell count
Characteristics of excluded studies [ordered by study ID]
| Study | Reason for exclusion |
| Wrong population: not biopsy‐proven lupus nephritis | |
| Wrong intervention: not comparing immunosuppression | |
| Wrong population: not biopsy‐proven lupus nephritis | |
| Wrong population: diagnosis of biopsy‐proven proliferative lupus nephritis at randomisation unclear | |
| Wrong population: not biopsy‐proven lupus nephritis but membranous | |
| Wrong population: not biopsy‐proven lupus nephritis | |
| No relevant outcomes | |
| Wrong intervention: not immunosuppressive intervention | |
| No relevant clinical outcomes | |
| Wrong population: not biopsy‐proven lupus nephritis | |
| Wrong population: not biopsy‐proven lupus nephritis | |
| Wrong population: diagnosis of biopsy‐proven proliferative lupus nephritis at randomisation was unclear | |
| Wrong population and intervention: not biopsy‐proven lupus nephritis or comparing immunosuppression | |
| Wrong intervention: not comparing immunosuppression | |
| Wrong intervention: not comparing immunosuppression | |
| Wrong population: not biopsy‐proven lupus nephritis | |
| Insufficient information to determine if the study is randomised | |
| Wrong population: not biopsy‐proven lupus nephritis | |
| Wrong intervention: not immunosuppressive intervention | |
| Wrong intervention: not comparing immunosuppression | |
| Insufficient information to determine if the study is randomised | |
| Wrong intervention: not immunosuppressive intervention | |
| Wrong population: not biopsy‐proven lupus nephritis | |
| Wrong population: not biopsy‐proven lupus nephritis | |
| Wrong population: not biopsy‐proven lupus nephritis | |
| Wrong population: included class II and class V lupus nephritis | |
| Wrong population: membranous lupus nephritis | |
| The study has been terminated | |
| The recruitment status of this study is unknown (registered 2007). The completion date of this study has passed and the status has not been verified in more than two years. | |
| Study terminated early for administrative reasons | |
| This study was withdrawn prior to enrolment, as the local pharmacy were unwilling to comply with the study protocol | |
| The recruitment status of this study is unknown (registered 2008). The completion date of this study has passed and the status has not been verified in more than two years | |
| This study was withdrawn prior to recruitment | |
| This study has been terminated due to safety concerns of active control drug | |
| Study was terminated because results from previous studies did not demonstrate sufficient efficacy | |
| Study was terminated, insufficient enrolment | |
| Wrong population: not comparing immunosuppression | |
| Unclear if biopsy‐proven lupus nephritis | |
| Wrong population: not biopsy‐proven lupus nephritis | |
| Wrong population: not biopsy‐proven lupus nephritis | |
| Wrong population: not biopsy‐proven lupus nephritis | |
| Wrong population: non‐invasive necrotising vasculopathy‐severe variant not usually responsive to standard therapy | |
| Unclear if biopsy‐proven lupus nephritis | |
| Wrong population: not biopsy‐proven lupus nephritis | |
| Wrong population: not biopsy‐proven lupus nephritis | |
| Wrong intervention: not comparing immunosuppression | |
| Wrong population: biopsy‐proven proliferative lupus nephritis were excluded | |
| Unclear if biopsy‐proven lupus nephritis |
Characteristics of ongoing studies [ordered by study ID]
| Trial name or title | Comparison of short course cyclophosphamide followed by mycophenolate mofetil versus long course cyclophosphamide in the treatment of proliferative lupus nephritis |
| Methods | Multicentre RCT |
| Participants | Adult, proliferative lupus nephritis, biopsy‐proven, active urinary sediment, proteinuria |
| Interventions | 6 months IV CPA induction followed by either 3 monthly IV CPA or MMF for 18 months, then 2 years AZA in both arms |
| Outcomes | Renal relapse |
| Starting date | January 2003 |
| Contact information | Marc Bijl, University Medical Centre Groningen |
| Notes |
| Trial name or title | The intensive therapy of severe lupus nephritis: a multicenter, randomised, controlled prospective clinical trial |
| Methods | Multicentre, randomised controlled |
| Participants | Adult, SLE according to ACR criteria, renal biopsy‐proven lupus nephritis: 24 hours proteinuria (≥ 3.0g/d or +++), erythrocyturia > 5/HPF, leucocyturia or cast (RBC, Hb, tubuli or mixed); SLEDAI score ≥10 |
| Interventions |
|
| Outcomes | Serum albumin, SCr, SLEDAI, liver function, adverse events |
| Starting date | September 2009 |
| Contact information | Zhanguo Li, The department of rheumatology and immunology, People's Hospital, Peking university, Beijing, China |
| Notes |
| Trial name or title | Treatment of severe lupus nephritis with tacrolimus (FK 506) based immunosuppression |
| Methods | Multicentre RCT |
| Participants | Adult; SLE (ACR criteria); SLEDAI > 10 points; biopsy‐proven lupus nephritis severe type III, IV type, V+III type and V+IV‐type lupus nephritis (WHO2004 criteria), heavy‐III, with severe segmental lesions that have loop necrosis or crescent formation of the III‐type lupus nephritis); significant renal disease, proteinuria ≥ 2 g/24 h, with active urine sediment (urine RBC > 400,000/mL, tube urine, leukocytes in urine), SCr < 3mg/dL (265 µmol/L) |
| Interventions | Tacrolimus (0.5 mg and 1 mg) |
| Outcomes | Serum albumin, SCr, proteinuria, immunological function, renal biopsy, adverse events |
| Starting date | 2009 |
| Contact information | Changlin Mei, Shanghai Changzheng Hospital, Beijing China |
| Notes | Sponsor ‐ Astellas Pharma China Inc. |
| Trial name or title | Comparison of two steroid dose regimen in lupus nephritis: a randomised controlled trial |
| Methods | RCT |
| Participants | 12 to 70 years of age, SLE (ACR criteria); biopsy‐proven lupus nephritis (ISN/RPS class III, IV, III+V or IV+V) |
| Interventions |
Patients in both groups will receive IV MP (750 mg) for 3 days, followed by oral prednisolone for a period of 8 weeks followed by a taper. All patients will receive MMF |
| Outcomes | Complete remission, partial remission, SELENA‐SLEDAI, quality of life, immunological function, adverse events |
| Starting date | January 2016 |
| Contact information | Krishan Lal Gupta, Department of nephrology, Postgraduate Institute of Medical Education and Research, Chandigarh, India |
| Notes |
| Trial name or title | Randomised controlled trial of multi‐targetted therapy versus low‐dose intravenous cyclophosphamide in the treatment of lupus nephritis |
| Methods | Parallel RCT |
| Participants | Adults, SLE ACR criteria; lupus nephritis class III, IV, V, a combination of III+V or IV+V; SCr < 3.0 mg/dL |
| Interventions |
|
| Outcomes |
|
| Starting date | July 2016 |
| Contact information | Krishan Lal Gupta, Department of Nephrology, Nehru Hospital, Post Graduate Institute of Medical Education and Research, Chandigarh, India |
| Notes | Follow‐up: 6 months |
| Trial name or title | Enteric coat mycophenolate sodium versus intravenous cyclophosphamide for severe paediatric lupus nephritis |
| Methods | Multicentre RCT |
| Participants | Paediatric lupus nephritis |
| Interventions |
|
| Outcomes |
|
| Starting date | July 2009 |
| Contact information | Wattana Chartapisak, Department of Pediatrics, Chiang Mai, Thailand |
| Notes |
| Trial name or title | To compare the efficacy and safety of FK506 vs IVC in the treatment of class III‐IV lupus nephritis |
| Methods | Multicentre RCT |
| Participants | Adult (18 to 65 years) female patients with SLE according to ACR criteria, SLEDAI > 10; biopsy‐proven class III or IV lupus nephritis according to the WHO classification criteria within 3 month and have significant active pathological lesion; proteinuria ≥ 2 g/24 h, and an active urine sediment (haematuria with white cells and casts in urine) |
| Interventions |
|
| Outcomes | Safety and efficacy |
| Starting date | May 2004 |
| Contact information | Lei‐shi Li, Research Institute of Nephrology, Jinling Hospital, Nanjing University School of Medicine, Nanjing, Jiangsu, China |
| Notes | Study was registered over 10 years ago and it is unlikely the study will be published |
| Trial name or title | A single centre, randomised, placebo‐controlled, double blind, parallel group study to evaluate the tolerability of a single dose of Abatacept 30 mg/kg via intravenous infusion in Chinese SLE subjects with lupus nephritis |
| Methods | Single‐centre, double blind and open‐label extension RCT |
| Participants | Adult; ≥ 18 years of age; SLE and with lupus nephritis currently stable for the last 3 months without change in treatment for lupus nephritis; stable renal disease; no flaring of other organ systems in a minimum of the last 3 months |
| Interventions |
|
| Outcomes |
|
| Starting date | August 2008 |
| Contact information | Bristol‐Myers Squibb |
| Notes | Study includes short‐term follow‐up period and long‐term extension period |
| Trial name or title | To compare the efficacy and safety of tripterygium vs azathioprine in the maintenance therapy for lupus nephritis |
| Methods | RCT |
| Participants | Adults, class III‐V lupus nephritis (biopsy‐proven) |
| Interventions | Induction with MMF, CPA, TAC or multi‐target therapy followed by randomisation to either AZA maintenance therapy or tripterygium 90 mg once/d |
| Outcomes | Complete remission |
| Starting date | March 2009 |
| Contact information | Weixin Hu, Nanjing University School of Medicine, China |
| Notes |
| Trial name or title | Long‐term study of multi‐target therapy as maintenance treatment for lupus nephritis |
| Methods | Open‐label RCT |
| Participants | Adults (18 to 65 years); SLE; diagnosed class Ⅲ, Ⅳ,Ⅳ+Ⅴ, Ⅲ+Ⅴ or Ⅴ lupus nephritis (ISN/RPS 2003 criteria) by renal biopsy; all patients had received induction therapy for 6 months with multi‐therapy (FK506 + MMF) or IV CPA pulses. Patients were recruited when received partial remission or complete remission after 6 months induction therapy |
| Interventions |
|
| Outcomes | Safety and efficacy |
| Starting date | February 2010 |
| Contact information | Zhi‐Hong Liu, Nanjing University School of Medicine |
| Notes | 18 month duration |
| Trial name or title | Leflunomide versus AZA for maintenance therapy of lupus nephritis |
| Methods | Open‐label RCT |
| Participants | Adults, biopsy‐proven proliferative lupus nephritis |
| Interventions | Leflunomide versus AZA (maintenance therapy) |
| Outcomes | Lupus nephritis flare |
| Starting date | March 2010 |
| Contact information | Bao Chun De, Renji Hospital |
| Notes |
| Trial name or title | Weaning of Immunosuppression in Nephritis of Lupus |
| Methods | Open‐label RCT |
| Participants | Adult, biopsy‐proven proliferative lupus nephritis |
| Interventions | Immunosuppressive treatment discontinuation versus continuation of MMF or AZA |
| Outcomes | Discontinuation of maintenance immunosuppressive therapy |
| Starting date | January 2011 |
| Contact information | Noemie Jourde Chiche, Assistance Publique hôpitaux de Marseille |
| Notes |
| Trial name or title | A phase 3, randomised, double‐blind, placebo‐controlled study to evaluate the efficacy and safety of Belimumab plus standard of care versus placebo plus standard of care in adult subjects with active lupus nephritis |
| Methods | Double‐blind, placebo controlled RCT |
| Participants | Adult, diagnosis of SLE (ACR criteria), biopsy‐proven lupus nephritis, clinically active lupus nephritis, autoantibody positive |
| Interventions | Belimumab versus placebo and standard therapy |
| Outcomes | Renal response, complete renal response, adverse events |
| Starting date | July 2012 |
| Contact information | GlaxoSmithKline |
| Notes |
| Trial name or title | A phase 3 randomised, double‐blind, placebo‐controlled study to evaluate the efficacy and safety of BMS‐188667 (Abatacept) or placebo on a background of mycophenolate mofetil and corticosteroids in the treatment of subjects with active class III or IV lupus nephritis |
| Methods | Double‐blind RCT |
| Participants | Age > 16 years; biopsy‐proven class III or IV lupus nephritis within 12 months; UPCR ≥ 1; SCr ≤ 3 mg/dL (i.e., ≤ 265 µmol/L); active disease within 3 months ‐ based on one of the following (1) worsening of lupus nephritis ‐ UPCR ≥ 3 (2) active urine sediment (3) biopsy within 3 months indicating active class III or IV Inclusion criteria for the long‐term extension period: achieved complete or partial renal response after completing 2 years of double‐blind treatment |
| Interventions |
|
| Outcomes | Renal response |
| Starting date | January 2013 |
| Contact information | Bristol‐Myers Squibb |
| Notes |
| Trial name or title | A phase Ib study of milatuzumab administered subcutaneously in patients with active systemic lupus Erythematosus |
| Methods | Double‐blind RCT |
| Participants | Adult ≥ 18 years; SLE (ACR criteria); positive ANA (titre ≥ 1:80); at least 1 BILAG A or 2 BILAG B scores in any organ/body system and ≥ 6 SELENA‐SLEDAI score; receiving at least 5.0 mg/d oral prednisone (or equivalent) at stable doses for at least 4 weeks prior to study entry If receiving immunosuppressives or antimalarial agents, at stable doses for at least 4 weeks prior to study entry |
| Interventions |
|
| Outcomes | Safety and efficacy |
| Starting date | January 2015 |
| Contact information | Heather Horne, Cedars Sinai Medical Center‐Wallace Rheumatic Study centre, California, United States of America |
| Notes |
| Trial name or title | Efficacy and infectious complications of induction therapy with low‐dose versus high‐dose intravenous cyclophosphamide for proliferative lupus nephritis in children |
| Methods | Open‐label RCT |
| Participants | Children (≤ 15 years), diagnosis of SLE (ACR 1997 criteria), biopsy‐proven class III or IV lupus nephritis (ISN/RPS 2003 classification criteria) |
| Interventions | High‐dose IV CPA versus low‐dose IV CPA (induction therapy) |
| Outcomes | Complete renal response, partial renal response, infection, quality of life, disease activity |
| Starting date | May 2013 |
| Contact information | Nuntawan Piyaphanee, Siriraj Hospital, Thailand |
| Notes |
| Trial name or title | Open‐label prospective randomised study to determine the efficacy and safety of two dosing regimens of ACTHar in the treatment of proliferative lupus nephritis |
| Methods | Open‐label RCT |
| Participants | ≥ 16 years, diagnosis of SLE (ACR/SLICC criteria), biopsy‐proven class III or IV ±V lupus nephritis (ISN/RPS 2003 classification criteria) |
| Interventions | CellCept daily & ACTHar gel biweekly versus CellCept daily & ACTHar gel every other day |
| Outcomes | Complete response, partial response, renal flares, adverse events, cortisol levels, urinary lymphocytes |
| Starting date | October 2014 |
| Contact information | Anca D Askanase, Columbia University, USA |
| Notes |
| Trial name or title | A multi‐center, randomised, controlled, open‐label clinical study to evaluate the efficacy and safety of mizoribine in comparison with cyclophosphamide in the treatment of lupus nephritis |
| Methods | Open‐label RCT |
| Participants | Adult, diagnosis of SLE (ACR 1997 criteria), biopsy‐proven class III, III+V, IV, IV+V or V (ISN/RPS 2003 classification criteria), proteinuria > 1 g/d, SLEDAI > 8, patient body weight 40‐80kg at screening |
| Interventions | Mizoribine versus CPA |
| Outcomes | Complete remission, partial remission, treatment failure, ESKD, doubling of SCr, SCr, eGFR, C3, anti‐dsDNA, anti‐phospholipid, anti‐Sm, SLEDAI |
| Starting date | November 2014 |
| Contact information | Asahi Kasei Pharma Corporation |
| Notes |
| Trial name or title | Rituximab plus cyclophosphamide followed by belimumab for the treatment of lupus nephritis (ITN055AI) |
| Methods | Open‐label RCT |
| Participants | Adult, diagnosis of SLE (ACR criteria), biopsy‐proven proliferative lupus nephritis (ISN/RPS classification criteria), > 5 RBC/HPF in absence of menses and infection, > WBC/HPF in absence of infection or cellular casts, UPCR > 1 |
| Interventions | RTX, CPA and belimumab versus RTX and CPA |
| Outcomes | Major infection, hypogammaglobulinaemia, complete response, partial response, treatment failure, relapse anti‐dsDNA, C3 and C4, death, leucopenia, ovarian failure, malignancy, thrombocytopenia, adverse advents |
| Starting date | October 2014 |
| Contact information | Betty Diamond, Feinstein Institute for Medical Research: centre for Autoimmune and Musculoskeletal Diseases, USA |
| Notes |
| Trial name or title | A phase III, randomised, open, parallel‐controlled, multi‐center study to compare the efficacy and safety of tacrolimus capsules and cyclophosphamide injection in treatment of lupus nephritis |
| Methods | Open‐label RCT |
| Participants | 18‐60 years, 18.5 ≤ BMI < 27, diagnosis of SLE (ACR 1997 criteria), biopsy‐proven class III, IV, V, III+V, IV+V lupus nephritis (ISN/RPS 2003 classification criteria) within 24 weeks of study entry, proteinuria > 1.5 g/d, SCr < 3 mg/dL |
| Interventions | TAC versus CPA (induction therapy) |
| Outcomes | Complete remission, partial remission, proteinuria, serum albumin, SCr, eGFR, anti‐dsDNA and ANA, SLEDAI, C3 and C4, renal biopsy active index and chronic index |
| Starting date | March 2015 |
| Contact information | Astellas Pharma China, Inc. |
| Notes |
| Trial name or title | A multicentre, randomised, double‐blind, placebo‐controlled, phase 2 study evaluating the efficacy and safety of Anifrolumab in adult subjects with active proliferative lupus nephritis |
| Methods | Double‐blind RCT |
| Participants | 18 to 70 years, fulfil four or more of the ACR 1982 criteria which must include positive ANA, elevated anti‐dsDNA, anti‐Smith; biopsy‐proven class III±V, IV±V, UPCR 1g/d, eGFR ≥ 35 mL/min/1.73 m2, women of childbearing potential must have negative serum beta‐hCG |
| Interventions | High‐dose anifrolumab, low‐dose anifrolumab versus placebo |
| Outcomes | Complete renal response, partial renal response, eGFR, proteinuria, urine sediment, adverse events |
| Starting date | November 2015 |
| Contact information | AstraZeneca Clinical Study Information centre |
| Notes |
| Trial name or title | A randomised, double‐blind, placebo‐controlled, multi‐center study to evaluate the safety and efficacy of Obinutuzumab in patients with ISN/RPS 2003 Class III or IV lupus nephritis |
| Methods | Double‐blind, placebo‐controlled RCT |
| Participants | Age 18‐75 years, diagnosis of SLE (ACR criteria), biopsy‐proven class III or IV lupus nephritis (ISN/RPS 2003 classification criteria), proteinuria UPCR > 1.0 g, premenopausal female participants agree to refraining from getting pregnant 18 months, male participants agree to use contraception for 12 month |
| Interventions | Obinutuzumab versus placebo |
| Outcomes | Complete renal response, partial renal response, anti‐dsDNA, C3 and C4, disease activity, immune cells (CD‐19 B‐cells, T‐cells, neutrophil), adverse events |
| Starting date | November, 2015 |
| Contact information | Hoffmann‐La Roche |
| Notes |
| Trial name or title | A randomised open‐label study to evaluate the efficacy and safety of tacrolimus and corticosteroids in comparison with mycophenolate mofetil and corticosteroids in subjects with class III/IV±V Lupus nephritis |
| Methods | Open‐label RCT |
| Participants | Adult, biopsy‐proven lupus nephritis Class III/IV±V (ISN/RPS 2003 classification criteria), positive anti‐dsDNA, UPCR > 1.0 g or 24 h urine protein > 1.0 g/d at baseline), with or without haematuria, new or flaring patients |
| Interventions | TAC versus MMF |
| Outcomes | Renal response |
| Starting date | September 2015 |
| Contact information | Tak‐Mao Daniel Chan, The University of Hong Kong |
| Notes |
| Trial name or title | A double‐blind, randomised, placebo‐controlled trial evaluating the effect of BI 655064 administered as sub‐cutaneous injections, on renal response after one year treatment in patients with lupus nephritis |
| Methods | Double‐blind, placebo‐controlled RCT |
| Participants | 18‐70 years, diagnosis of SLE (ACR criteria), biopsy‐proven class III or IV lupus nephritis (ISN/RPS 2003 classification criteria), proteinuria ≥ 1.0 g/d (UPCR ≥ 100 mg/mmol) |
| Interventions | BI 655064 (anti‐CD‐40 antibody) versus placebo |
| Outcomes | Complete renal response, partial response |
| Starting date | January 2016 |
| Contact information | Boehringer Ingelheim |
| Notes |
| Trial name or title | Iguratimod as treatment for active lupus nephritis |
| Methods | Open‐label RCT |
| Participants | Diagnosis of SLE (ACR criteria), biopsy‐proven class III, IV, V, III+IV or IV+V active lupus nephritis, proteinuria 1g/d, body weight ≥ 40 kg, SLEDAI‐2K ≥ 8, agreement of contraception |
| Interventions | Iguratimod versus CPA and AZA |
| Outcomes | Renal remission, renal flare, adverse events, disease activity (SLEDAI‐2K, BILAG), patient general assessment |
| Starting date | March 2017 |
| Contact information | Chunde Bao, RenJi Hospital |
| Notes |
| Trial name or title | The effect of mycophenolate mofetil and cyclophosphamide on the lymphocyte subsets in patients With proliferative Lupus nephritis |
| Methods | Open‐label RCT |
| Participants | 18 to 80 years , biopsy‐proven class III or IV±V lupus nephritis lupus nephritis (ISN/RPS 2003 classification criteria), active lupus nephritis indicated by proteinuria >1 g/d and/or rise in SCr by 15% |
| Interventions | MMF (induction and maintenance therapy) versus CPA (induction therapy) and AZA (maintenance therapy) |
| Outcomes | Lymphocyte subset profile (CD8+ T cells, CD4+ Th1, Th2, Th17 & Treg), Naïve & memory B cells, plasma cells, serum cytokine profile (IL‐2, IL‐5, IL‐6, IL‐7, IL‐10, IL‐17, IL‐21, IL‐23, IFN‐alpha, IFN‐gamma, TGF‐beta) |
| Starting date | March 2012 |
| Contact information | Desmond Yap, Queen Mary Hospital, Hong Kong |
| Notes |
| Trial name or title | A randomised, controlled double‐blind study comparing the efficacy and safety of voclosporin (23.7 mg twice daily) with placebo in achieving renal response in subjects with active lupus nephritis |
| Methods | Double‐blind RCT |
| Participants | Subjects with evidence of active nephritis, defined as follows: Kidney biopsy result within 2 years prior to screening indicating Class III, IV‐S, IV‐G (alone or in combination with Class V), or Class V lupus nephritis with a doubling or greater increase of UPCR within the last 6 months to a minimum of ≥ 1.5 mg/mg for Class III/IV or to a minimum of ≥ 2 mg/mg for Class V at screening. Biopsy results over 6 months prior to screening must be reviewed with a medical monitor to confirm eligibility. Or kidney biopsy result within 6 months prior to screening indicating Class III, IV‐S or IV‐G (alone or in combination with Class V) lupus nephritis with a UPCR of ≥ 1.5 mg/mg at screening. Or kidney biopsy result within 6 months prior to screening indicating Class V lupus nephritis and a UPCR of ≥ 2 mg/mg at screening. Women of childbearing potential must have a negative serum pregnancy test at screening and a negative urine pregnancy test at baseline. |
| Interventions |
|
| Outcomes |
|
| Starting date | May 2017 |
| Contact information | Mary Anne Dooley, University of North Carolina |
| Notes | Sponsor ‐ Aurinia Pharmaceuticals Inc. |
| Trial name or title | Efficacy and safety of artesunate plus standard of care in active lupus nephritis (AURORA) |
| Methods | Multicentre, double‐blind RCT |
| Participants | 14 to 65 years; SLE (ACR criteria); renal biopsy within 6 months prior to randomisation with a histological diagnosis (ISN/RPS 2003 classification of lupus nephritis) ‐ class III, IV, V, III+V and IV+V (excluding Class III(C), IV‐S(C), and IV‐G(C)); class IV or IV+V lupus nephritis: proteinuria ≥ 1 g/24 h (or UPCR ≥ 1.0) or SCr > 1.3 mg/dL, with active urinary sediment (> 5 RBC/HPF or > 5 WBC/HPF (or within the reference range of the laboratory) in absence of menses and genitourinary tract infection, or presence of cellular casts (RBC or WBC casts)); Class III, III+V or V lupus nephritis: proteinuria ≥ 2 g/24 h (or UPCR ≥ 2.0) or SCr > 1.3 mg/dL; Provision of written informed consent by subject or guardian |
| Interventions |
|
| Outcomes |
|
| Starting date | September 2017 |
| Contact information | Xue Qing Yu, The 1st Affiliated Hospital, Sun Yet‐sen University, Guangzhou, Guangdong, China |
| Notes |
| Trial name or title | A multicentre, randomised, double‐blind, placebo‐controlled, phase 3 study evaluating the efficacy and safety of two doses of anifrolumab in adult subjects with active systemic lupus erythematosus |
| Methods | Multicentre, double‐blind RCT |
| Participants | Aged 18 ‐ 70 years; weight ≥ 40.0 kg; adequate peripheral venous access; SLE (ACR criteria); currently receiving at least 1 of the following: (a) a dose of oral prednisone (≤ 40 mg/d) for a minimum of 2 weeks, the dose of oral prednisone the subject is taking must be stable for a minimum of 2 weeks prior to Week 0 (Day 1) (b) Any of the following medications administered for a minimum of 12 weeks prior to signing the informed consent, and at a stable dose for a minimum of 8 weeks prior to Day 1. |
| Interventions |
|
| Outcomes |
|
| Starting date | May 2015 |
| Contact information | Luis Fernando Bellatin Vargas, Hogar Clínica, San Juan De Dios‐Arequipa |
| Notes |
| Trial name or title | RING, an investigator‐initiated trial aimed at testing the efficacy of rituximab in refractory lupus nephritis: Rationale, trial design and call for participation (abstract) |
| Methods | RCT |
| Participants | SLE, age > 15 years old, ISN/RPS Class III, IV or V lupus nephritis (biopsy within 24 months), refractory lupus nephritis with previous treatment with Euro‐lupus/NIH CPA or AZA or MMF, maximum 10 mg prednisolone/d, UPCR > 1 (mg/mg), and female patients on contraception |
| Interventions | 1. RTX 2. Standard of care |
| Outcomes | Complete response (UPCR ≤ 0.5 (expressed in mg/mg) measured in a 24 h urine collection; and eGFR ≥ 60 mL/min or, if < 60 mL/min at screening, not fallen by > 20% compared to screening; and no increase of glucocorticoids throughout the study (except for two limited courses as per protocol; vide infra); and no introduction of another immunosuppressant.) |
| Starting date | August 2012 |
| Contact information | Frédéric A. Houssiau, Université Catholique de Louvain, Belgium |
| Notes |
| Trial name or title | Phase 3 open label randomised multicentre controlled trial of rituximab and mycophenolate mofetil without oral steroids for the treatment of lupus nephritis |
| Methods | Open‐label RCT |
| Participants | 12 to 75 years, biopsy‐proven lupus nephritis (ISN/RPS 2003 classification criteria), active lupus nephritis UPCR > 1000 mg/mmol, not planning pregnancy during study period |
| Interventions | RTX versus prednisolone |
| Outcomes | Complete renal response, major infections, serious adverse and adverse events, disease activity scores, renal flare, serum C3, C4, anti‐dsDNA, quality of life |
| Starting date | April 2015 |
| Contact information | Liz Lightstone, Hammersmith Hospital, Imperial College Healthcare NHS Trust, United Kingdom |
| Notes |
ACEi ‐ angiotensin‐converting enzyme inhibitor; ACR ‐ American College of Rheumatology; ARA ‐ American Rheumatology Association; ARB ‐ angiotensin receptor blocker; AZA ‐ azathioprine; BILAG ‐ British Isles Lupus Assessment Group; CKD ‐ chronic kidney disease; CMV ‐ cytomegalovirus; CNI ‐ calcineurin; CNS ‐ central nervous system; CPA ‐ cyclophosphamide; CrCl ‐ creatinine clearance; CSA ‐ cyclosporin A; DM ‐ diabetes mellitus; EC‐MPS ‐ enteric‐coated mycophenolate sodium; eGFR ‐ estimated glomerular filtration rate; ELNT ‐ Euro‐lupus nephritis treatment; ESKD ‐ end‐stage kidney disease; ESR ‐ erythrocyte sedimentation rate; GI ‐ gastrointestinal: GN ‐ glomerulonephritis; HBV ‐ hepatitis B virus; HCV ‐ hepatitis C virus; HIV ‐ human immunodeficiency virus; HPF ‐ high power field; IA ‐ immunoadsorption; ISN/RPS ‐ International Society of Nephrology/Renal Pathology Society; IV ‐ intravenous; IVIG ‐ intravenous immunoglobulin; M/F ‐ male/female; MMF ‐ mycophenolate mofetil; MP ‐ methylprednisolone; NSAID/s ‐ nonsteroidal anti‐inflammatory drug/s; PEX ‐ plasma exchange or plasmapheresis; PLAGA ‐ Dutch Pathology Registry; RBC ‐ red blood cell/s; RCC ‐ red cell count; RCT ‐ randomised controlled trial; RTX ‐ rituximab; SC ‐ subcutaneous; SCr ‐ serum creatinine; SD ‐ standard deviation; SELENA ‐ Safety of Estrogens in Lupus Erythematosus National Assessment; SLE ‐ systemic lupus erythematosus; SLEDAI ‐ SLE Disease Activity Index; SLICC ‐ Systemic Lupus Collaborating Clinics; TAC ‐ tacrolimus; TB ‐ tuberculosis; WHO ‐ World Health Organization; ISN/RPS ‐ International Society of Nephrology/ Renal Pathology Society; UPCR ‐ urine protein‐to‐creatinine ratio; WBC ‐ white blood cell/s; WCC ‐ white cell count
Data and analyses
| Outcome or subgroup title | No. of studies | No. of participants | Statistical method | Effect size |
| 1 Death Show forest plot | 8 | 826 | Risk Ratio (M‐H, Random, 95% CI) | 1.12 [0.61, 2.06] |
| Analysis 1.1 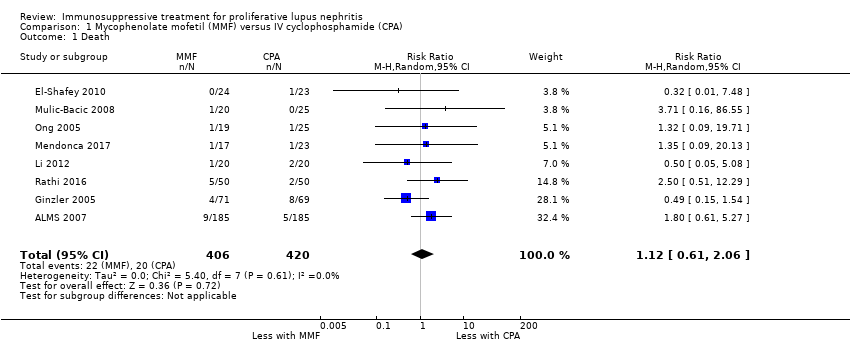 Comparison 1 Mycophenolate mofetil (MMF) versus IV cyclophosphamide (CPA), Outcome 1 Death. | ||||
| 2 Remission Show forest plot | 9 | Risk Ratio (M‐H, Random, 95% CI) | Subtotals only | |
| Analysis 1.2  Comparison 1 Mycophenolate mofetil (MMF) versus IV cyclophosphamide (CPA), Outcome 2 Remission. | ||||
| 2.1 Complete renal remission: MMF versus IV CPA | 9 | 868 | Risk Ratio (M‐H, Random, 95% CI) | 1.17 [0.97, 1.42] |
| 2.2 Partial renal remission: MMF versus IV CPA | 9 | 868 | Risk Ratio (M‐H, Random, 95% CI) | 1.02 [0.89, 1.18] |
| 2.3 Complete remission in proteinuria: MMF versus IV CPA | 6 | 686 | Risk Ratio (M‐H, Random, 95% CI) | 1.16 [0.85, 1.58] |
| 2.4 Partial remission in proteinuria: MMF versus IV CPA | 6 | 744 | Risk Ratio (M‐H, Random, 95% CI) | 1.03 [0.91, 1.18] |
| 3 Adverse renal outcomes Show forest plot | 4 | Risk Ratio (M‐H, Random, 95% CI) | Subtotals only | |
| Analysis 1.3 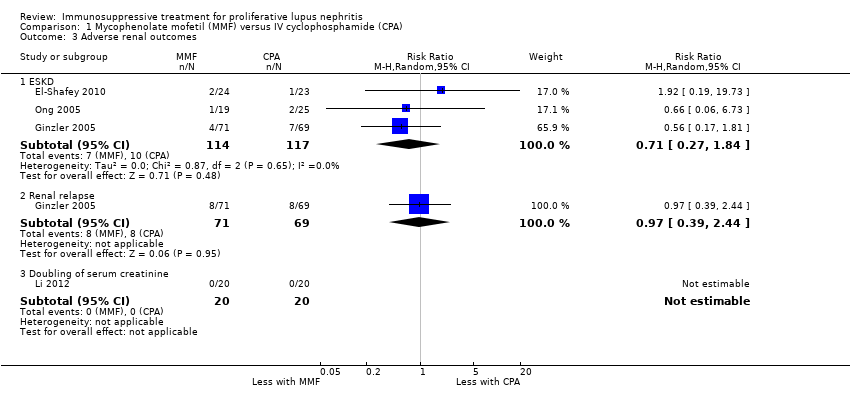 Comparison 1 Mycophenolate mofetil (MMF) versus IV cyclophosphamide (CPA), Outcome 3 Adverse renal outcomes. | ||||
| 3.1 ESKD | 3 | 231 | Risk Ratio (M‐H, Random, 95% CI) | 0.71 [0.27, 1.84] |
| 3.2 Renal relapse | 1 | 140 | Risk Ratio (M‐H, Random, 95% CI) | 0.97 [0.39, 2.44] |
| 3.3 Doubling of serum creatinine | 1 | 40 | Risk Ratio (M‐H, Random, 95% CI) | 0.0 [0.0, 0.0] |
| 4 Stable kidney function Show forest plot | 6 | 641 | Risk Ratio (M‐H, Random, 95% CI) | 1.05 [0.94, 1.17] |
| Analysis 1.4  Comparison 1 Mycophenolate mofetil (MMF) versus IV cyclophosphamide (CPA), Outcome 4 Stable kidney function. | ||||
| 5 Ovarian failure Show forest plot | 3 | 539 | Risk Ratio (M‐H, Random, 95% CI) | 0.36 [0.06, 2.18] |
| Analysis 1.5  Comparison 1 Mycophenolate mofetil (MMF) versus IV cyclophosphamide (CPA), Outcome 5 Ovarian failure. | ||||
| 6 Menstrual irregularities Show forest plot | 2 | 87 | Risk Ratio (M‐H, Random, 95% CI) | 0.33 [0.07, 1.59] |
| Analysis 1.6  Comparison 1 Mycophenolate mofetil (MMF) versus IV cyclophosphamide (CPA), Outcome 6 Menstrual irregularities. | ||||
| 7 Infection Show forest plot | 7 | 1452 | Risk Ratio (M‐H, Random, 95% CI) | 1.13 [0.81, 1.58] |
| Analysis 1.7  Comparison 1 Mycophenolate mofetil (MMF) versus IV cyclophosphamide (CPA), Outcome 7 Infection. | ||||
| 7.1 Major infection | 6 | 699 | Risk Ratio (M‐H, Random, 95% CI) | 1.02 [0.67, 1.54] |
| 7.2 Herpes zoster virus | 6 | 753 | Risk Ratio (M‐H, Random, 95% CI) | 1.39 [0.78, 2.46] |
| 8 Malignancy Show forest plot | 1 | 364 | Risk Ratio (M‐H, Random, 95% CI) | 0.65 [0.11, 3.86] |
| Analysis 1.8 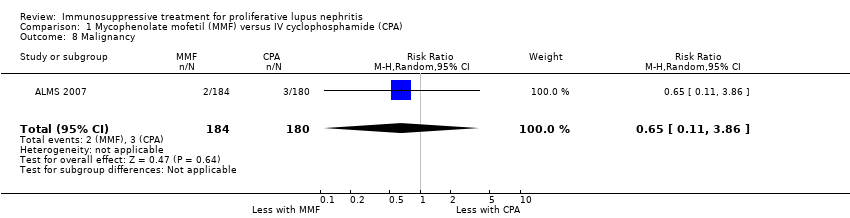 Comparison 1 Mycophenolate mofetil (MMF) versus IV cyclophosphamide (CPA), Outcome 8 Malignancy. | ||||
| 9 Leucopenia Show forest plot | 6 | 753 | Risk Ratio (M‐H, Random, 95% CI) | 0.59 [0.33, 1.08] |
| Analysis 1.9 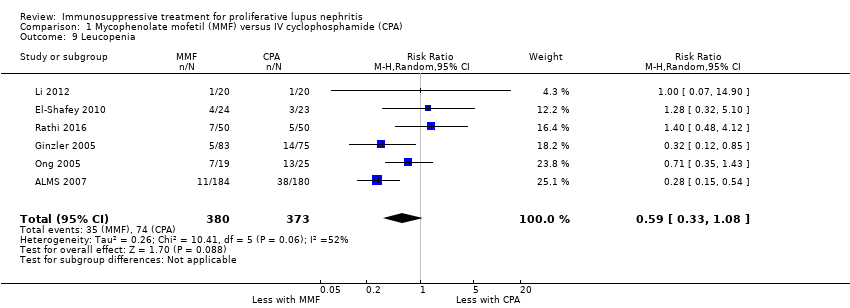 Comparison 1 Mycophenolate mofetil (MMF) versus IV cyclophosphamide (CPA), Outcome 9 Leucopenia. | ||||
| 10 Bladder toxicity Show forest plot | 1 | 364 | Risk Ratio (M‐H, Random, 95% CI) | 0.33 [0.01, 7.95] |
| Analysis 1.10  Comparison 1 Mycophenolate mofetil (MMF) versus IV cyclophosphamide (CPA), Outcome 10 Bladder toxicity. | ||||
| 11 Alopecia Show forest plot | 3 | 622 | Risk Ratio (M‐H, Random, 95% CI) | 0.29 [0.19, 0.46] |
| Analysis 1.11  Comparison 1 Mycophenolate mofetil (MMF) versus IV cyclophosphamide (CPA), Outcome 11 Alopecia. | ||||
| 12 Gastrointestinal (GI) adverse events Show forest plot | 4 | Risk Ratio (M‐H, Random, 95% CI) | Subtotals only | |
| Analysis 1.12 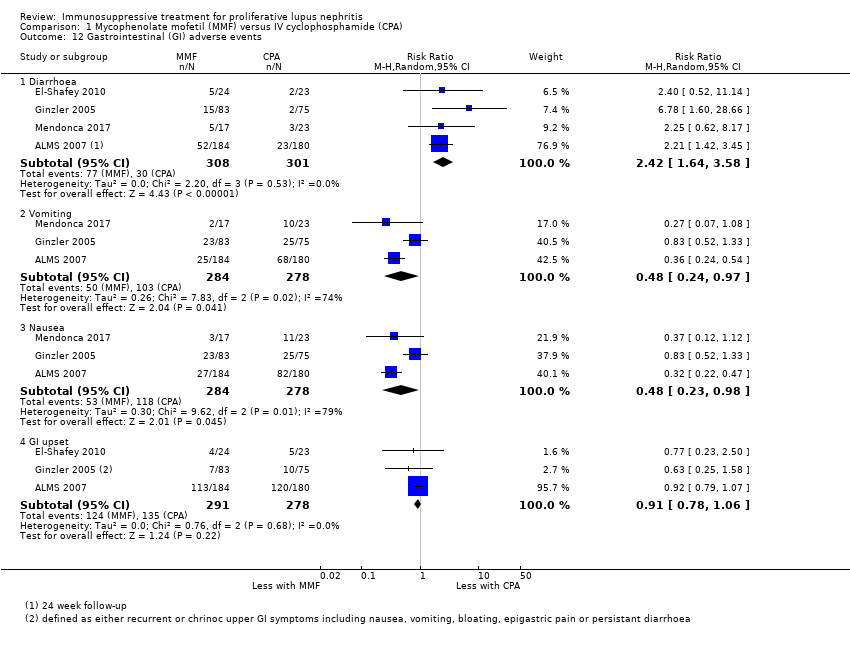 Comparison 1 Mycophenolate mofetil (MMF) versus IV cyclophosphamide (CPA), Outcome 12 Gastrointestinal (GI) adverse events. | ||||
| 12.1 Diarrhoea | 4 | 609 | Risk Ratio (M‐H, Random, 95% CI) | 2.42 [1.64, 3.58] |
| 12.2 Vomiting | 3 | 562 | Risk Ratio (M‐H, Random, 95% CI) | 0.48 [0.24, 0.97] |
| 12.3 Nausea | 3 | 562 | Risk Ratio (M‐H, Random, 95% CI) | 0.48 [0.23, 0.98] |
| 12.4 GI upset | 3 | 569 | Risk Ratio (M‐H, Random, 95% CI) | 0.91 [0.78, 1.06] |
| 13 Daily proteinuria Show forest plot | 4 | 271 | Mean Difference (IV, Random, 95% CI) | ‐0.08 [‐0.43, 0.26] |
| Analysis 1.13  Comparison 1 Mycophenolate mofetil (MMF) versus IV cyclophosphamide (CPA), Outcome 13 Daily proteinuria. | ||||
| 14 Serum creatinine Show forest plot | 6 | 759 | Mean Difference (IV, Random, 95% CI) | 2.14 [‐3.09, 7.37] |
| Analysis 1.14  Comparison 1 Mycophenolate mofetil (MMF) versus IV cyclophosphamide (CPA), Outcome 14 Serum creatinine. | ||||
| Outcome or subgroup title | No. of studies | No. of participants | Statistical method | Effect size |
| 1 Death Show forest plot | 1 | 62 | Risk Ratio (M‐H, Random, 95% CI) | 0.19 [0.01, 3.76] |
| Analysis 2.1  Comparison 2 Mycophenolate mofetil (MMF) versus oral cyclophosphamide (CPA), Outcome 1 Death. | ||||
| 2 Remission Show forest plot | 1 | Risk Ratio (M‐H, Random, 95% CI) | Subtotals only | |
| Analysis 2.2  Comparison 2 Mycophenolate mofetil (MMF) versus oral cyclophosphamide (CPA), Outcome 2 Remission. | ||||
| 2.1 Complete remission in proteinuria | 1 | 62 | Risk Ratio (M‐H, Random, 95% CI) | 0.98 [0.74, 1.30] |
| 2.2 Partial remission in proteinuria | 1 | 62 | Risk Ratio (M‐H, Random, 95% CI) | 1.07 [0.44, 2.59] |
| 3 Adverse renal outcomes Show forest plot | 1 | Risk Ratio (M‐H, Random, 95% CI) | Subtotals only | |
| Analysis 2.3 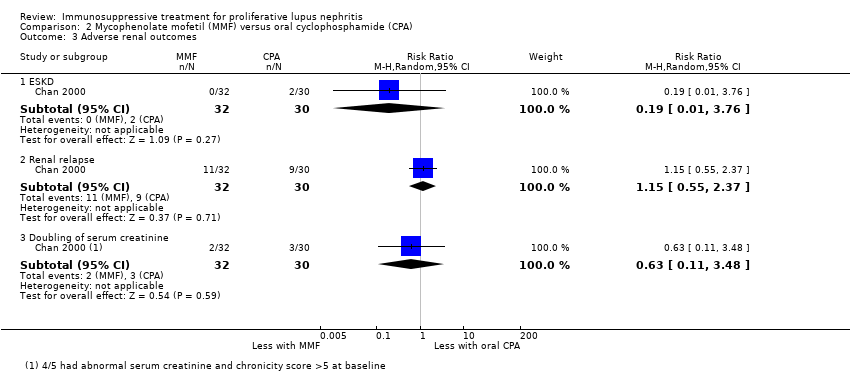 Comparison 2 Mycophenolate mofetil (MMF) versus oral cyclophosphamide (CPA), Outcome 3 Adverse renal outcomes. | ||||
| 3.1 ESKD | 1 | 62 | Risk Ratio (M‐H, Random, 95% CI) | 0.19 [0.01, 3.76] |
| 3.2 Renal relapse | 1 | 62 | Risk Ratio (M‐H, Random, 95% CI) | 1.15 [0.55, 2.37] |
| 3.3 Doubling of serum creatinine | 1 | 62 | Risk Ratio (M‐H, Random, 95% CI) | 0.63 [0.11, 3.48] |
| 4 Ovarian failure Show forest plot | 1 | 53 | Risk Ratio (M‐H, Random, 95% CI) | 0.10 [0.01, 0.73] |
| Analysis 2.4  Comparison 2 Mycophenolate mofetil (MMF) versus oral cyclophosphamide (CPA), Outcome 4 Ovarian failure. | ||||
| 5 Infection Show forest plot | 1 | Risk Ratio (M‐H, Random, 95% CI) | Subtotals only | |
| Analysis 2.5  Comparison 2 Mycophenolate mofetil (MMF) versus oral cyclophosphamide (CPA), Outcome 5 Infection. | ||||
| 5.1 Major infection | 1 | 62 | Risk Ratio (M‐H, Random, 95% CI) | 0.21 [0.05, 0.89] |
| 5.2 Herpes zoster virus | 1 | 62 | Risk Ratio (M‐H, Random, 95% CI) | 0.38 [0.08, 1.79] |
| 6 Leucopenia Show forest plot | 1 | 62 | Risk Ratio (M‐H, Random, 95% CI) | 0.06 [0.00, 0.92] |
| Analysis 2.6  Comparison 2 Mycophenolate mofetil (MMF) versus oral cyclophosphamide (CPA), Outcome 6 Leucopenia. | ||||
| 7 Bone toxicity Show forest plot | 1 | 62 | Risk Ratio (M‐H, Random, 95% CI) | 0.0 [0.0, 0.0] |
| Analysis 2.7  Comparison 2 Mycophenolate mofetil (MMF) versus oral cyclophosphamide (CPA), Outcome 7 Bone toxicity. | ||||
| 8 Alopecia Show forest plot | 1 | 62 | Risk Ratio (M‐H, Random, 95% CI) | 0.05 [0.00, 0.81] |
| Analysis 2.8 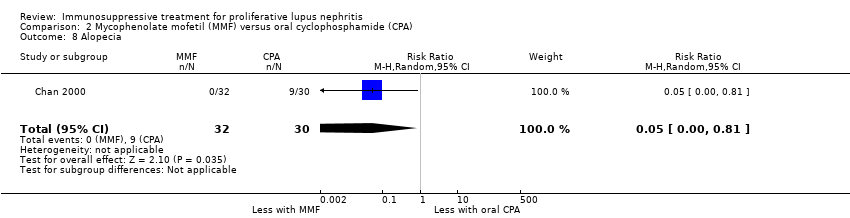 Comparison 2 Mycophenolate mofetil (MMF) versus oral cyclophosphamide (CPA), Outcome 8 Alopecia. | ||||
| 9 Gastrointestinal (GI) adverse events Show forest plot | 1 | Risk Ratio (M‐H, Random, 95% CI) | Subtotals only | |
| Analysis 2.9 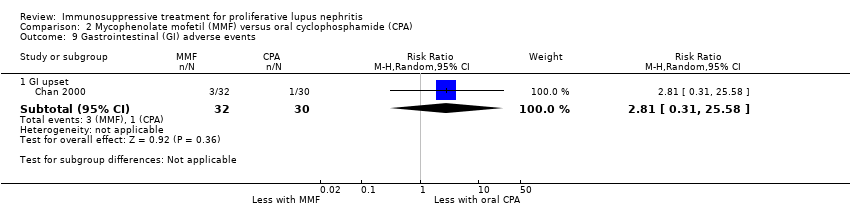 Comparison 2 Mycophenolate mofetil (MMF) versus oral cyclophosphamide (CPA), Outcome 9 Gastrointestinal (GI) adverse events. | ||||
| 9.1 GI upset | 1 | 62 | Risk Ratio (M‐H, Random, 95% CI) | 2.81 [0.31, 25.58] |
| 10 Daily proteinuria Show forest plot | 1 | 42 | Mean Difference (IV, Random, 95% CI) | 0.3 [‐0.19, 0.79] |
| Analysis 2.10  Comparison 2 Mycophenolate mofetil (MMF) versus oral cyclophosphamide (CPA), Outcome 10 Daily proteinuria. | ||||
| Outcome or subgroup title | No. of studies | No. of participants | Statistical method | Effect size |
| 1 Death Show forest plot | 2 | 402 | Risk Ratio (M‐H, Random, 95% CI) | 0.0 [0.0, 0.0] |
| Analysis 3.1 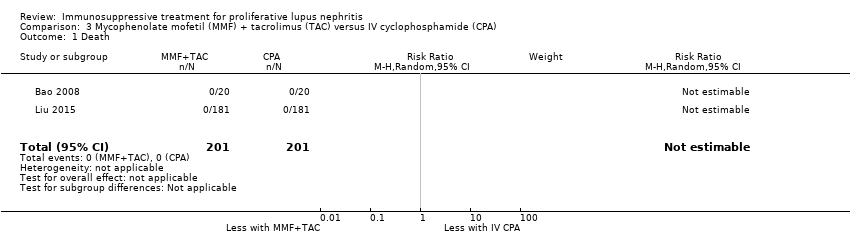 Comparison 3 Mycophenolate mofetil (MMF) + tacrolimus (TAC) versus IV cyclophosphamide (CPA), Outcome 1 Death. | ||||
| 2 Remission Show forest plot | 2 | Risk Ratio (M‐H, Random, 95% CI) | Subtotals only | |
| Analysis 3.2 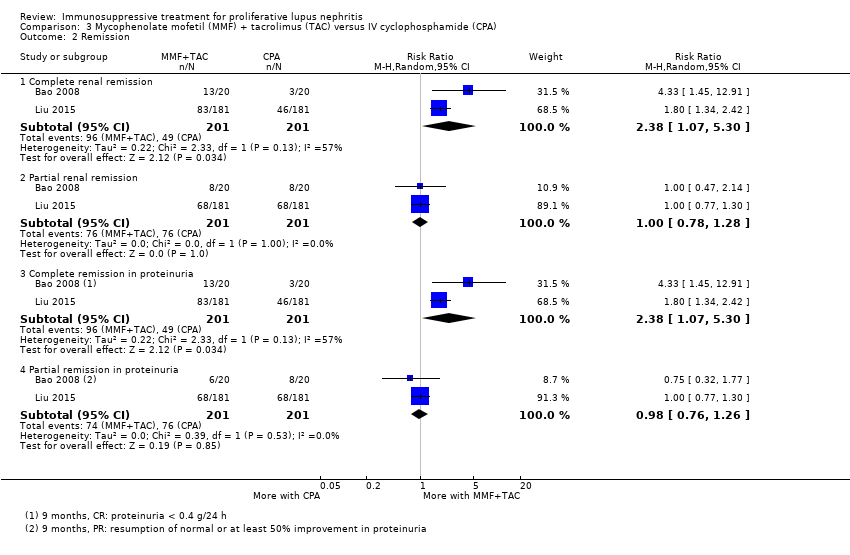 Comparison 3 Mycophenolate mofetil (MMF) + tacrolimus (TAC) versus IV cyclophosphamide (CPA), Outcome 2 Remission. | ||||
| 2.1 Complete renal remission | 2 | 402 | Risk Ratio (M‐H, Random, 95% CI) | 2.38 [1.07, 5.30] |
| 2.2 Partial renal remission | 2 | 402 | Risk Ratio (M‐H, Random, 95% CI) | 1.0 [0.78, 1.28] |
| 2.3 Complete remission in proteinuria | 2 | 402 | Risk Ratio (M‐H, Random, 95% CI) | 2.38 [1.07, 5.30] |
| 2.4 Partial remission in proteinuria | 2 | 402 | Risk Ratio (M‐H, Random, 95% CI) | 0.98 [0.76, 1.26] |
| 3 Adverse renal outcomes Show forest plot | 2 | Risk Ratio (M‐H, Random, 95% CI) | Subtotals only | |
| Analysis 3.3  Comparison 3 Mycophenolate mofetil (MMF) + tacrolimus (TAC) versus IV cyclophosphamide (CPA), Outcome 3 Adverse renal outcomes. | ||||
| 3.1 Doubling of serum creatinine | 2 | 402 | Risk Ratio (M‐H, Random, 95% CI) | 0.98 [0.10, 9.23] |
| 4 Stable kidney function Show forest plot | 2 | 402 | Risk Ratio (M‐H, Random, 95% CI) | 1.78 [1.40, 2.26] |
| Analysis 3.4 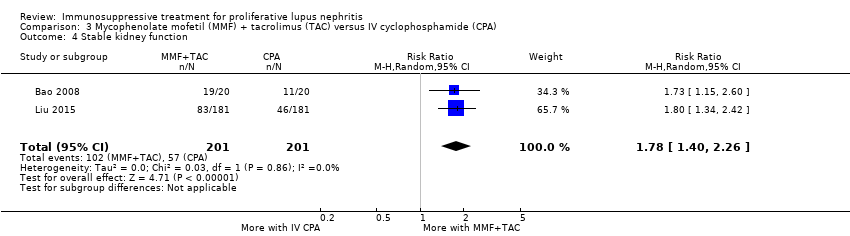 Comparison 3 Mycophenolate mofetil (MMF) + tacrolimus (TAC) versus IV cyclophosphamide (CPA), Outcome 4 Stable kidney function. | ||||
| 5 Ovarian failure Show forest plot | 1 | 34 | Risk Ratio (M‐H, Random, 95% CI) | 0.0 [0.0, 0.0] |
| Analysis 3.5  Comparison 3 Mycophenolate mofetil (MMF) + tacrolimus (TAC) versus IV cyclophosphamide (CPA), Outcome 5 Ovarian failure. | ||||
| 6 Menstrual irregularities Show forest plot | 1 | 323 | Risk Ratio (M‐H, Random, 95% CI) | 0.28 [0.06, 1.35] |
| Analysis 3.6 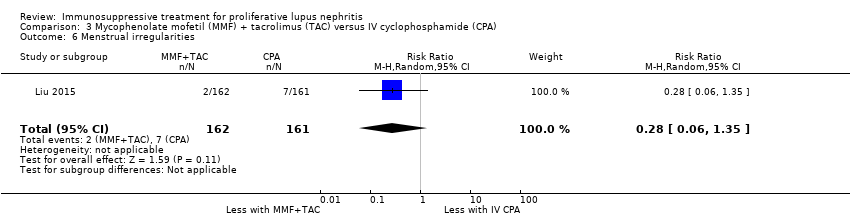 Comparison 3 Mycophenolate mofetil (MMF) + tacrolimus (TAC) versus IV cyclophosphamide (CPA), Outcome 6 Menstrual irregularities. | ||||
| 7 Infection Show forest plot | 2 | Risk Ratio (M‐H, Random, 95% CI) | Subtotals only | |
| Analysis 3.7  Comparison 3 Mycophenolate mofetil (MMF) + tacrolimus (TAC) versus IV cyclophosphamide (CPA), Outcome 7 Infection. | ||||
| 7.1 Major infection | 2 | 402 | Risk Ratio (M‐H, Random, 95% CI) | 1.65 [0.11, 24.44] |
| 7.2 Herpes zoster virus | 2 | 402 | Risk Ratio (M‐H, Random, 95% CI) | 0.80 [0.22, 2.94] |
| 8 Leucopenia Show forest plot | 2 | 402 | Risk Ratio (M‐H, Random, 95% CI) | 0.23 [0.04, 1.44] |
| Analysis 3.8 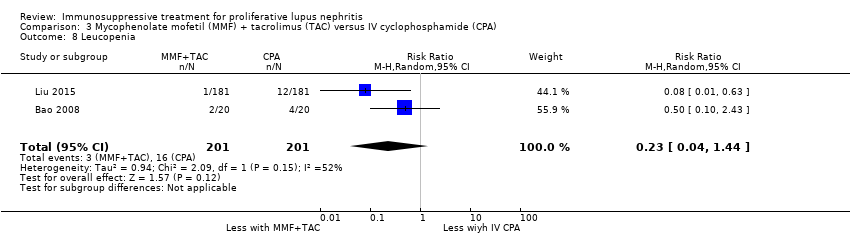 Comparison 3 Mycophenolate mofetil (MMF) + tacrolimus (TAC) versus IV cyclophosphamide (CPA), Outcome 8 Leucopenia. | ||||
| 9 Bone toxicity Show forest plot | 1 | 362 | Risk Ratio (M‐H, Random, 95% CI) | 3.0 [0.12, 73.16] |
| Analysis 3.9 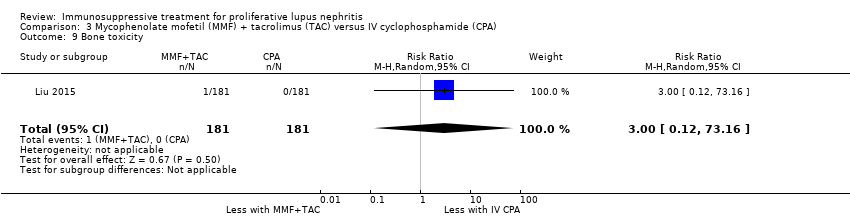 Comparison 3 Mycophenolate mofetil (MMF) + tacrolimus (TAC) versus IV cyclophosphamide (CPA), Outcome 9 Bone toxicity. | ||||
| 10 Alopecia Show forest plot | 2 | 402 | Risk Ratio (M‐H, Random, 95% CI) | 0.78 [0.36, 1.72] |
| Analysis 3.10 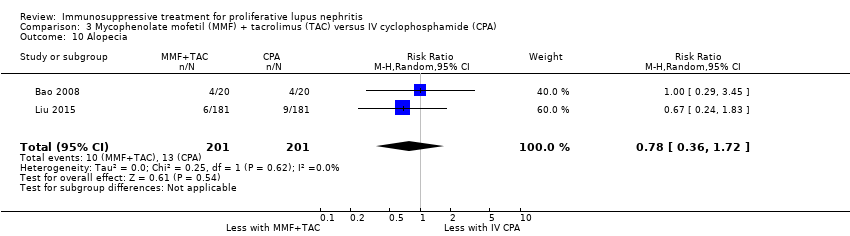 Comparison 3 Mycophenolate mofetil (MMF) + tacrolimus (TAC) versus IV cyclophosphamide (CPA), Outcome 10 Alopecia. | ||||
| 11 Gastrointestinal (GI) adverse events Show forest plot | 2 | Risk Ratio (M‐H, Random, 95% CI) | Subtotals only | |
| Analysis 3.11  Comparison 3 Mycophenolate mofetil (MMF) + tacrolimus (TAC) versus IV cyclophosphamide (CPA), Outcome 11 Gastrointestinal (GI) adverse events. | ||||
| 11.1 Diarrhoea | 1 | 362 | Risk Ratio (M‐H, Random, 95% CI) | 2.33 [0.92, 5.94] |
| 11.2 GI upset | 2 | 402 | Risk Ratio (M‐H, Random, 95% CI) | 0.21 [0.10, 0.41] |
| 12 Daily proteinuria Show forest plot | 1 | 40 | Mean Difference (IV, Random, 95% CI) | ‐1.69 [‐2.81, ‐0.57] |
| Analysis 3.12 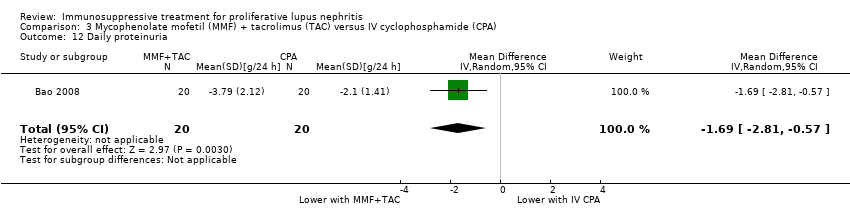 Comparison 3 Mycophenolate mofetil (MMF) + tacrolimus (TAC) versus IV cyclophosphamide (CPA), Outcome 12 Daily proteinuria. | ||||
| Outcome or subgroup title | No. of studies | No. of participants | Statistical method | Effect size |
| 1 Death Show forest plot | 1 | 82 | Risk Ratio (M‐H, Random, 95% CI) | 0.95 [0.06, 14.72] |
| Analysis 4.1 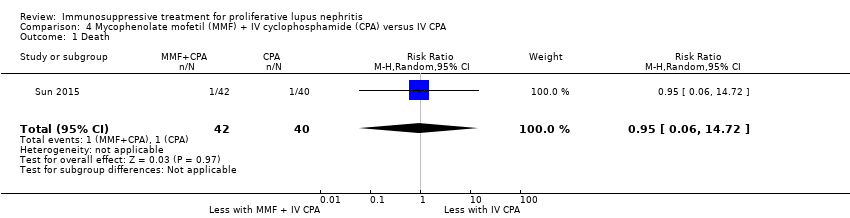 Comparison 4 Mycophenolate mofetil (MMF) + IV cyclophosphamide (CPA) versus IV CPA, Outcome 1 Death. | ||||
| 2 Remission Show forest plot | 1 | Risk Ratio (M‐H, Random, 95% CI) | Subtotals only | |
| Analysis 4.2  Comparison 4 Mycophenolate mofetil (MMF) + IV cyclophosphamide (CPA) versus IV CPA, Outcome 2 Remission. | ||||
| 2.1 Complete renal remission | 1 | 82 | Risk Ratio (M‐H, Random, 95% CI) | 1.22 [0.78, 1.89] |
| 2.2 Partial renal remission | 1 | 82 | Risk Ratio (M‐H, Random, 95% CI) | 1.03 [0.55, 1.90] |
| 3 Menstrual irregularities Show forest plot | 1 | 75 | Risk Ratio (M‐H, Random, 95% CI) | 0.49 [0.16, 1.48] |
| Analysis 4.3  Comparison 4 Mycophenolate mofetil (MMF) + IV cyclophosphamide (CPA) versus IV CPA, Outcome 3 Menstrual irregularities. | ||||
| 4 Infection Show forest plot | 1 | 82 | Risk Ratio (M‐H, Random, 95% CI) | 0.37 [0.14, 0.93] |
| Analysis 4.4  Comparison 4 Mycophenolate mofetil (MMF) + IV cyclophosphamide (CPA) versus IV CPA, Outcome 4 Infection. | ||||
| 4.1 Major infection | 1 | 82 | Risk Ratio (M‐H, Random, 95% CI) | 0.37 [0.14, 0.93] |
| 5 Leucopenia Show forest plot | 1 | 82 | Risk Ratio (M‐H, Random, 95% CI) | 0.63 [0.11, 3.60] |
| Analysis 4.5  Comparison 4 Mycophenolate mofetil (MMF) + IV cyclophosphamide (CPA) versus IV CPA, Outcome 5 Leucopenia. | ||||
| 6 Daily proteinuria Show forest plot | 1 | 77 | Mean Difference (IV, Random, 95% CI) | ‐0.54 [‐1.12, 0.04] |
| Analysis 4.6  Comparison 4 Mycophenolate mofetil (MMF) + IV cyclophosphamide (CPA) versus IV CPA, Outcome 6 Daily proteinuria. | ||||
| Outcome or subgroup title | No. of studies | No. of participants | Statistical method | Effect size |
| 1 Death Show forest plot | 3 | 273 | Risk Ratio (M‐H, Random, 95% CI) | 1.10 [0.44, 2.77] |
| Analysis 5.1  Comparison 5 Mycophenolate mofetil (MMF) versus tacrolimus (TAC), Outcome 1 Death. | ||||
| 2 Remission Show forest plot | 3 | Risk Ratio (M‐H, Random, 95% CI) | Subtotals only | |
| Analysis 5.2  Comparison 5 Mycophenolate mofetil (MMF) versus tacrolimus (TAC), Outcome 2 Remission. | ||||
| 2.1 Complete renal remission | 3 | 273 | Risk Ratio (M‐H, Random, 95% CI) | 1.02 [0.83, 1.26] |
| 2.2 Partial renal remission | 2 | 190 | Risk Ratio (M‐H, Random, 95% CI) | 0.83 [0.51, 1.36] |
| 2.3 Complete remission in proteinuria | 1 | 40 | Risk Ratio (M‐H, Random, 95% CI) | 1.0 [0.50, 1.98] |
| 2.4 Partial remission in proteinuria | 2 | 190 | Risk Ratio (M‐H, Random, 95% CI) | 0.90 [0.79, 1.03] |
| 3 Adverse renal outcomes Show forest plot | 1 | Risk Ratio (M‐H, Random, 95% CI) | Subtotals only | |
| Analysis 5.3  Comparison 5 Mycophenolate mofetil (MMF) versus tacrolimus (TAC), Outcome 3 Adverse renal outcomes. | ||||
| 3.1 ESKD | 1 | 150 | Risk Ratio (M‐H, Random, 95% CI) | 1.22 [0.51, 2.91] |
| 3.2 Renal relapse | 1 | 150 | Risk Ratio (M‐H, Random, 95% CI) | 0.67 [0.48, 0.93] |
| 3.3 Renal relapse (nephritic flare) | 1 | 152 | Risk Ratio (M‐H, Random, 95% CI) | 0.68 [0.36, 1.28] |
| 3.4 Renal relapse (proteinuric flare) | 1 | 150 | Risk Ratio (M‐H, Random, 95% CI) | 0.67 [0.41, 1.12] |
| 3.5 Deterioration in kidney function | 1 | 150 | Risk Ratio (M‐H, Random, 95% CI) | 0.54 [0.27, 1.09] |
| 4 Stable kidney function Show forest plot | 1 | 40 | Risk Ratio (M‐H, Random, 95% CI) | 1.0 [0.50, 1.98] |
| Analysis 5.4  Comparison 5 Mycophenolate mofetil (MMF) versus tacrolimus (TAC), Outcome 4 Stable kidney function. | ||||
| 5 Menstrual irregularities Show forest plot | 1 | 40 | Risk Ratio (M‐H, Random, 95% CI) | 3.0 [0.13, 69.52] |
| Analysis 5.5  Comparison 5 Mycophenolate mofetil (MMF) versus tacrolimus (TAC), Outcome 5 Menstrual irregularities. | ||||
| 6 Infection Show forest plot | 2 | Risk Ratio (M‐H, Random, 95% CI) | Subtotals only | |
| Analysis 5.6  Comparison 5 Mycophenolate mofetil (MMF) versus tacrolimus (TAC), Outcome 6 Infection. | ||||
| 6.1 Major infection | 2 | 190 | Risk Ratio (M‐H, Random, 95% CI) | 2.14 [0.93, 4.92] |
| 6.2 Herpes zoster virus | 1 | 150 | Risk Ratio (M‐H, Random, 95% CI) | 6.82 [1.60, 28.96] |
| 7 Leucopenia Show forest plot | 1 | 40 | Risk Ratio (M‐H, Random, 95% CI) | 1.0 [0.07, 14.90] |
| Analysis 5.7  Comparison 5 Mycophenolate mofetil (MMF) versus tacrolimus (TAC), Outcome 7 Leucopenia. | ||||
| 8 Alopecia Show forest plot | 1 | 150 | Risk Ratio (M‐H, Random, 95% CI) | 0.07 [0.00, 1.31] |
| Analysis 5.8  Comparison 5 Mycophenolate mofetil (MMF) versus tacrolimus (TAC), Outcome 8 Alopecia. | ||||
| 9 Daily proteinuria (at 24 weeks) Show forest plot | 1 | 150 | Mean Difference (IV, Random, 95% CI) | 0.18 [‐0.25, 0.61] |
| Analysis 5.9 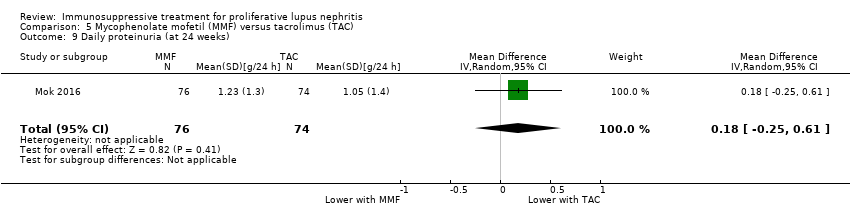 Comparison 5 Mycophenolate mofetil (MMF) versus tacrolimus (TAC), Outcome 9 Daily proteinuria (at 24 weeks). | ||||
| 10 Disease activity Show forest plot | 2 | Mean Difference (IV, Random, 95% CI) | Subtotals only | |
| Analysis 5.10 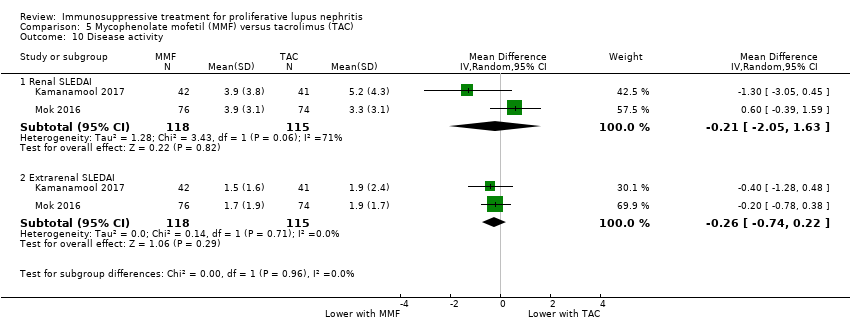 Comparison 5 Mycophenolate mofetil (MMF) versus tacrolimus (TAC), Outcome 10 Disease activity. | ||||
| 10.1 Renal SLEDAI | 2 | 233 | Mean Difference (IV, Random, 95% CI) | ‐0.21 [‐2.05, 1.63] |
| 10.2 Extrarenal SLEDAI | 2 | 233 | Mean Difference (IV, Random, 95% CI) | ‐0.26 [‐0.74, 0.22] |
| 11 Serum creatinine Show forest plot | 1 | 83 | Mean Difference (IV, Random, 95% CI) | ‐0.01 [‐0.16, 0.14] |
| Analysis 5.11 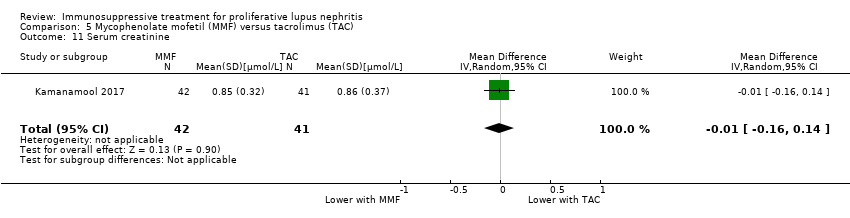 Comparison 5 Mycophenolate mofetil (MMF) versus tacrolimus (TAC), Outcome 11 Serum creatinine. | ||||
| 12 Creatinine clearance Show forest plot | 1 | 40 | Mean Difference (IV, Random, 95% CI) | ‐1.93 [‐7.77, 3.91] |
| Analysis 5.12  Comparison 5 Mycophenolate mofetil (MMF) versus tacrolimus (TAC), Outcome 12 Creatinine clearance. | ||||
| Outcome or subgroup title | No. of studies | No. of participants | Statistical method | Effect size |
| 1 Death Show forest plot | 3 | Risk Ratio (M‐H, Random, 95% CI) | Subtotals only | |
| Analysis 6.1 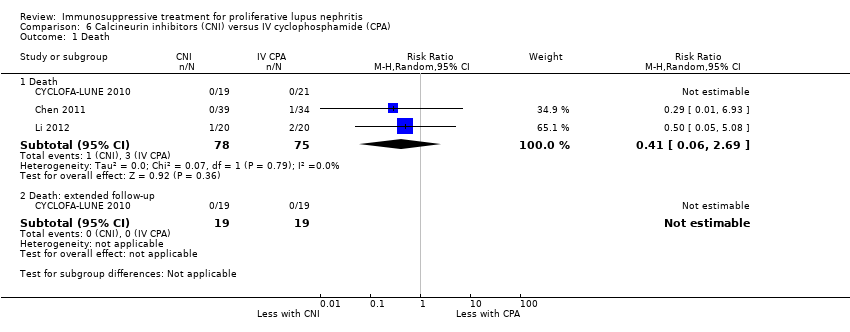 Comparison 6 Calcineurin inhibitors (CNI) versus IV cyclophosphamide (CPA), Outcome 1 Death. | ||||
| 1.1 Death | 3 | 153 | Risk Ratio (M‐H, Random, 95% CI) | 0.41 [0.06, 2.69] |
| 1.2 Death: extended follow‐up | 1 | 38 | Risk Ratio (M‐H, Random, 95% CI) | 0.0 [0.0, 0.0] |
| 2 Remission Show forest plot | 4 | Risk Ratio (M‐H, Random, 95% CI) | Subtotals only | |
| Analysis 6.2  Comparison 6 Calcineurin inhibitors (CNI) versus IV cyclophosphamide (CPA), Outcome 2 Remission. | ||||
| 2.1 Complete renal remission | 4 | 178 | Risk Ratio (M‐H, Random, 95% CI) | 1.35 [0.94, 1.93] |
| 2.2 Partial renal remission | 4 | 178 | Risk Ratio (M‐H, Random, 95% CI) | 0.88 [0.61, 1.26] |
| 2.3 Complete remission in proteinuria | 3 | 105 | Risk Ratio (M‐H, Random, 95% CI) | 1.71 [1.08, 2.70] |
| 3 Adverse renal outcomes Show forest plot | 2 | Risk Ratio (M‐H, Random, 95% CI) | Subtotals only | |
| Analysis 6.3  Comparison 6 Calcineurin inhibitors (CNI) versus IV cyclophosphamide (CPA), Outcome 3 Adverse renal outcomes. | ||||
| 3.1 ESKD: extended follow‐up | 1 | 38 | Risk Ratio (M‐H, Random, 95% CI) | 1.0 [0.07, 14.85] |
| 3.2 Doubling of serum creatinine | 1 | 40 | Risk Ratio (M‐H, Random, 95% CI) | 0.33 [0.01, 7.72] |
| 3.3 Doubling of serum creatinine: extended follow‐up | 1 | 38 | Risk Ratio (M‐H, Random, 95% CI) | 1.0 [0.16, 6.38] |
| 4 Stable kidney function Show forest plot | 4 | 186 | Risk Ratio (M‐H, Random, 95% CI) | 1.11 [0.61, 2.00] |
| Analysis 6.4  Comparison 6 Calcineurin inhibitors (CNI) versus IV cyclophosphamide (CPA), Outcome 4 Stable kidney function. | ||||
| 5 Ovarian failure Show forest plot | 2 | Risk Ratio (M‐H, Random, 95% CI) | Subtotals only | |
| Analysis 6.5 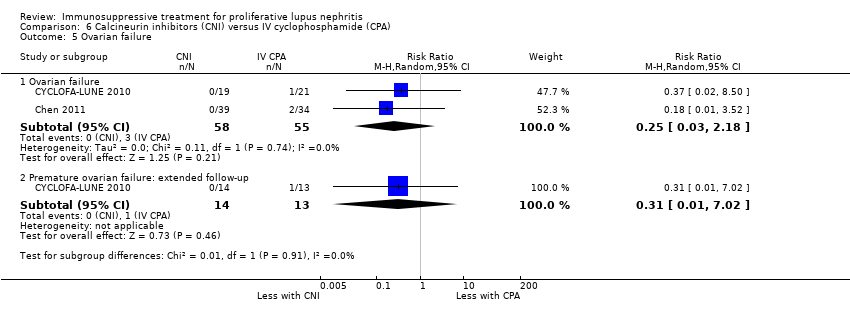 Comparison 6 Calcineurin inhibitors (CNI) versus IV cyclophosphamide (CPA), Outcome 5 Ovarian failure. | ||||
| 5.1 Ovarian failure | 2 | 113 | Risk Ratio (M‐H, Random, 95% CI) | 0.25 [0.03, 2.18] |
| 5.2 Premature ovarian failure: extended follow‐up | 1 | 27 | Risk Ratio (M‐H, Random, 95% CI) | 0.31 [0.01, 7.02] |
| 6 Menstrual irregularities Show forest plot | 2 | 54 | Risk Ratio (M‐H, Random, 95% CI) | 0.41 [0.04, 4.05] |
| Analysis 6.6  Comparison 6 Calcineurin inhibitors (CNI) versus IV cyclophosphamide (CPA), Outcome 6 Menstrual irregularities. | ||||
| 7 Infection Show forest plot | 4 | Risk Ratio (M‐H, Random, 95% CI) | Subtotals only | |
| Analysis 6.7  Comparison 6 Calcineurin inhibitors (CNI) versus IV cyclophosphamide (CPA), Outcome 7 Infection. | ||||
| 7.1 Major infection | 3 | 138 | Risk Ratio (M‐H, Random, 95% CI) | 0.73 [0.33, 1.63] |
| 7.2 Herpes zoster virus | 2 | 113 | Risk Ratio (M‐H, Random, 95% CI) | 1.41 [0.38, 5.20] |
| 8 Malignancy: extended follow‐up Show forest plot | 1 | 38 | Risk Ratio (M‐H, Random, 95% CI) | 5.0 [0.26, 97.70] |
| Analysis 6.8  Comparison 6 Calcineurin inhibitors (CNI) versus IV cyclophosphamide (CPA), Outcome 8 Malignancy: extended follow‐up. | ||||
| 9 Leucopenia Show forest plot | 3 | 153 | Risk Ratio (M‐H, Random, 95% CI) | 0.44 [0.13, 1.49] |
| Analysis 6.9  Comparison 6 Calcineurin inhibitors (CNI) versus IV cyclophosphamide (CPA), Outcome 9 Leucopenia. | ||||
| 10 Alopecia Show forest plot | 2 | 113 | Risk Ratio (M‐H, Random, 95% CI) | 0.21 [0.02, 1.76] |
| Analysis 6.10 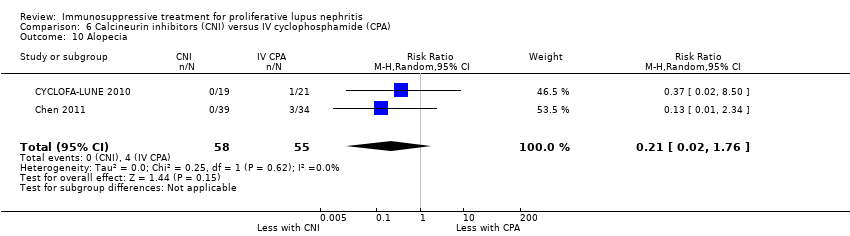 Comparison 6 Calcineurin inhibitors (CNI) versus IV cyclophosphamide (CPA), Outcome 10 Alopecia. | ||||
| 11 Gastrointestinal (GI) adverse events Show forest plot | 1 | 73 | Risk Ratio (M‐H, Random, 95% CI) | 0.35 [0.12, 1.01] |
| Analysis 6.11  Comparison 6 Calcineurin inhibitors (CNI) versus IV cyclophosphamide (CPA), Outcome 11 Gastrointestinal (GI) adverse events. | ||||
| 12 Daily proteinuria Show forest plot | 2 | 156 | Mean Difference (IV, Random, 95% CI) | ‐0.37 [‐0.67, ‐0.07] |
| Analysis 6.12  Comparison 6 Calcineurin inhibitors (CNI) versus IV cyclophosphamide (CPA), Outcome 12 Daily proteinuria. | ||||
| 12.1 At 9 months | 1 | 40 | Mean Difference (IV, Random, 95% CI) | ‐0.83 [‐1.37, ‐0.29] |
| 12.2 At 12 months | 1 | 38 | Mean Difference (IV, Random, 95% CI) | ‐0.27 [‐0.43, ‐0.11] |
| 12.3 At 18 months | 1 | 40 | Mean Difference (IV, Random, 95% CI) | ‐1.0 [‐2.26, 0.26] |
| 12.4 Extended follow‐up | 1 | 38 | Mean Difference (IV, Random, 95% CI) | ‐0.10 [‐0.49, 0.29] |
| 13 Creatinine clearance Show forest plot | 3 | Mean Difference (IV, Random, 95% CI) | Subtotals only | |
| Analysis 6.13  Comparison 6 Calcineurin inhibitors (CNI) versus IV cyclophosphamide (CPA), Outcome 13 Creatinine clearance. | ||||
| 13.1 At 6 months | 1 | 150 | Mean Difference (IV, Random, 95% CI) | 11.70 [1.61, 21.79] |
| 13.2 At 9 months | 1 | 40 | Mean Difference (IV, Random, 95% CI) | 14.90 [1.35, 28.45] |
| 13.3 At 12 months | 1 | 38 | Mean Difference (IV, Random, 95% CI) | ‐15.70 [‐23.71, ‐7.69] |
| 13.4 At 18 months | 1 | 40 | Mean Difference (IV, Random, 95% CI) | ‐1.40 [‐17.25, 14.45] |
| 14 Serum creatinine Show forest plot | 1 | Mean Difference (IV, Random, 95% CI) | Subtotals only | |
| Analysis 6.14  Comparison 6 Calcineurin inhibitors (CNI) versus IV cyclophosphamide (CPA), Outcome 14 Serum creatinine. | ||||
| 14.1 At 9 months | 1 | 40 | Mean Difference (IV, Random, 95% CI) | 12.70 [1.88, 23.52] |
| 14.2 At 18 months | 1 | 40 | Mean Difference (IV, Random, 95% CI) | 2.70 [‐11.50, 16.90] |
| 14.3 Extended follow‐up | 1 | 38 | Mean Difference (IV, Random, 95% CI) | ‐8.0 [‐20.35, 4.35] |
| Outcome or subgroup title | No. of studies | No. of participants | Statistical method | Effect size |
| 1 Death Show forest plot | 2 | Risk Ratio (M‐H, Random, 95% CI) | Subtotals only | |
| Analysis 7.1 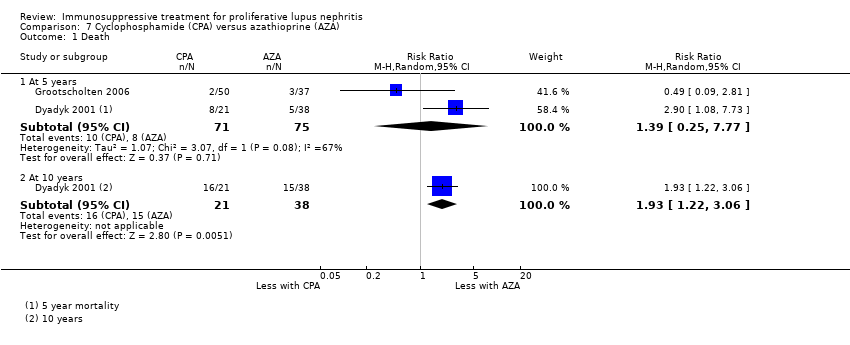 Comparison 7 Cyclophosphamide (CPA) versus azathioprine (AZA), Outcome 1 Death. | ||||
| 1.1 At 5 years | 2 | 146 | Risk Ratio (M‐H, Random, 95% CI) | 1.39 [0.25, 7.77] |
| 1.2 At 10 years | 1 | 59 | Risk Ratio (M‐H, Random, 95% CI) | 1.93 [1.22, 3.06] |
| 2 Remission in proteinuria Show forest plot | 1 | Risk Ratio (M‐H, Random, 95% CI) | Subtotals only | |
| Analysis 7.2 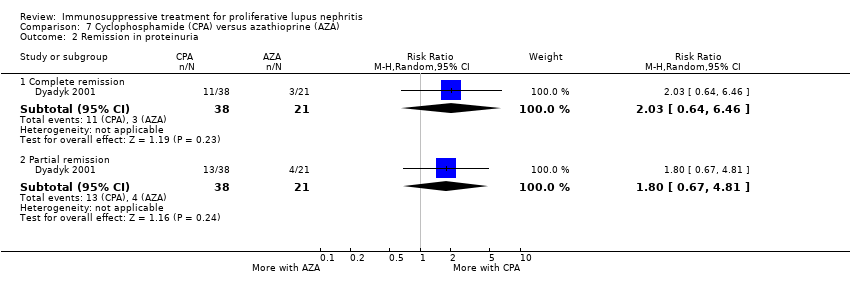 Comparison 7 Cyclophosphamide (CPA) versus azathioprine (AZA), Outcome 2 Remission in proteinuria. | ||||
| 2.1 Complete remission | 1 | 59 | Risk Ratio (M‐H, Random, 95% CI) | 2.03 [0.64, 6.46] |
| 2.2 Partial remission | 1 | 59 | Risk Ratio (M‐H, Random, 95% CI) | 1.80 [0.67, 4.81] |
| 3 Adverse renal outcomes Show forest plot | 2 | Risk Ratio (M‐H, Random, 95% CI) | Subtotals only | |
| Analysis 7.3  Comparison 7 Cyclophosphamide (CPA) versus azathioprine (AZA), Outcome 3 Adverse renal outcomes. | ||||
| 3.1 ESKD | 2 | 144 | Risk Ratio (M‐H, Random, 95% CI) | 0.40 [0.15, 1.07] |
| 3.2 ESKD at 9.6 years (median) | 1 | 100 | Risk Ratio (M‐H, Random, 95% CI) | 1.0 [0.15, 6.82] |
| 3.3 Renal relapse | 1 | 87 | Risk Ratio (M‐H, Random, 95% CI) | 0.15 [0.03, 0.64] |
| 3.4 Renal relapse at 9.6 years (median) | 1 | 87 | Risk Ratio (M‐H, Random, 95% CI) | 0.26 [0.10, 0.67] |
| 3.5 Doubling of serum creatinine | 2 | 144 | Risk Ratio (M‐H, Random, 95% CI) | 0.48 [0.24, 0.95] |
| 3.6 Deterioration of kidney function | 1 | 30 | Risk Ratio (M‐H, Random, 95% CI) | 0.67 [0.18, 2.42] |
| 4 Stable kidney function Show forest plot | 1 | 57 | Risk Ratio (M‐H, Random, 95% CI) | 1.32 [0.86, 2.01] |
| Analysis 7.4  Comparison 7 Cyclophosphamide (CPA) versus azathioprine (AZA), Outcome 4 Stable kidney function. | ||||
| 5 Ovarian failure Show forest plot | 2 | 126 | Risk Ratio (M‐H, Random, 95% CI) | 2.11 [0.59, 7.53] |
| Analysis 7.5  Comparison 7 Cyclophosphamide (CPA) versus azathioprine (AZA), Outcome 5 Ovarian failure. | ||||
| 6 Menstrual irregularities Show forest plot | 1 | 15 | Risk Ratio (M‐H, Random, 95% CI) | 1.90 [0.69, 5.23] |
| Analysis 7.6 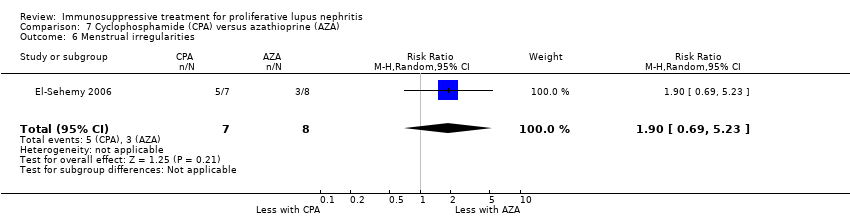 Comparison 7 Cyclophosphamide (CPA) versus azathioprine (AZA), Outcome 6 Menstrual irregularities. | ||||
| 7 Infection Show forest plot | 1 | Risk Ratio (M‐H, Random, 95% CI) | Subtotals only | |
| Analysis 7.7 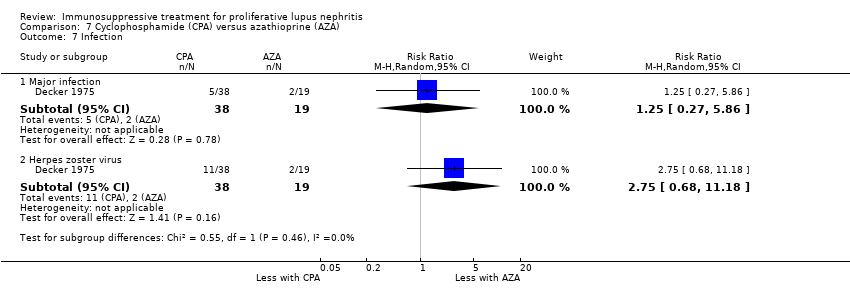 Comparison 7 Cyclophosphamide (CPA) versus azathioprine (AZA), Outcome 7 Infection. | ||||
| 7.1 Major infection | 1 | 57 | Risk Ratio (M‐H, Random, 95% CI) | 1.25 [0.27, 5.86] |
| 7.2 Herpes zoster virus | 1 | 57 | Risk Ratio (M‐H, Random, 95% CI) | 2.75 [0.68, 11.18] |
| 8 Malignancy Show forest plot | 2 | Risk Ratio (M‐H, Random, 95% CI) | Subtotals only | |
| Analysis 7.8 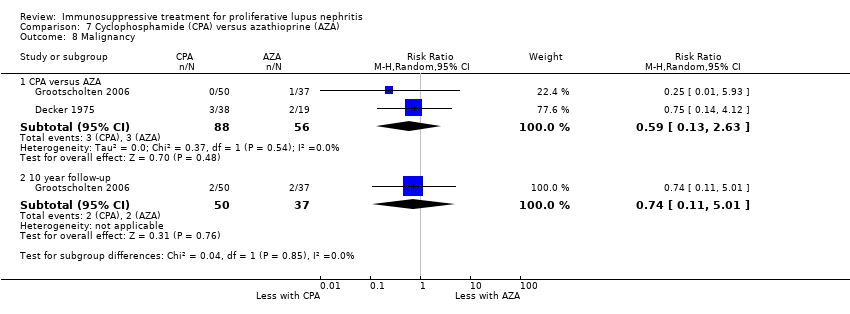 Comparison 7 Cyclophosphamide (CPA) versus azathioprine (AZA), Outcome 8 Malignancy. | ||||
| 8.1 CPA versus AZA | 2 | 144 | Risk Ratio (M‐H, Random, 95% CI) | 0.59 [0.13, 2.63] |
| 8.2 10 year follow‐up | 1 | 87 | Risk Ratio (M‐H, Random, 95% CI) | 0.74 [0.11, 5.01] |
| 9 Bone toxicity Show forest plot | 1 | 87 | Risk Ratio (M‐H, Random, 95% CI) | 0.0 [0.0, 0.0] |
| Analysis 7.9  Comparison 7 Cyclophosphamide (CPA) versus azathioprine (AZA), Outcome 9 Bone toxicity. | ||||
| 10 Bladder toxicity Show forest plot | 2 | 144 | Risk Ratio (M‐H, Random, 95% CI) | 3.59 [0.19, 66.14] |
| Analysis 7.10  Comparison 7 Cyclophosphamide (CPA) versus azathioprine (AZA), Outcome 10 Bladder toxicity. | ||||
| Outcome or subgroup title | No. of studies | No. of participants | Statistical method | Effect size |
| 1 Death Show forest plot | 1 | 144 | Risk Ratio (M‐H, Random, 95% CI) | 5.0 [0.24, 102.35] |
| Analysis 8.1 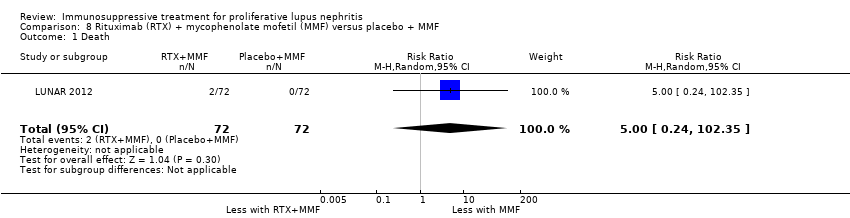 Comparison 8 Rituximab (RTX) + mycophenolate mofetil (MMF) versus placebo + MMF, Outcome 1 Death. | ||||
| 2 Remission Show forest plot | 1 | Risk Ratio (M‐H, Random, 95% CI) | Subtotals only | |
| Analysis 8.2  Comparison 8 Rituximab (RTX) + mycophenolate mofetil (MMF) versus placebo + MMF, Outcome 2 Remission. | ||||
| 2.1 Complete renal response | 1 | 144 | Risk Ratio (M‐H, Random, 95% CI) | 0.86 [0.51, 1.45] |
| 2.2 Partial renal response | 1 | 144 | Risk Ratio (M‐H, Random, 95% CI) | 2.0 [1.05, 3.82] |
| 2.3 Complete remission in proteinuria | 1 | 144 | Risk Ratio (M‐H, Random, 95% CI) | 0.87 [0.63, 1.21] |
| 3 Stable kidney function Show forest plot | 1 | 144 | Risk Ratio (M‐H, Random, 95% CI) | 1.24 [0.90, 1.71] |
| Analysis 8.3  Comparison 8 Rituximab (RTX) + mycophenolate mofetil (MMF) versus placebo + MMF, Outcome 3 Stable kidney function. | ||||
| 4 Infection Show forest plot | 1 | Risk Ratio (M‐H, Random, 95% CI) | Subtotals only | |
| Analysis 8.4 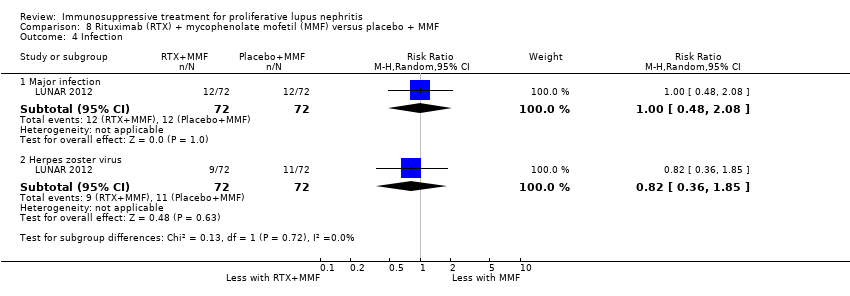 Comparison 8 Rituximab (RTX) + mycophenolate mofetil (MMF) versus placebo + MMF, Outcome 4 Infection. | ||||
| 4.1 Major infection | 1 | 144 | Risk Ratio (M‐H, Random, 95% CI) | 1.0 [0.48, 2.08] |
| 4.2 Herpes zoster virus | 1 | 144 | Risk Ratio (M‐H, Random, 95% CI) | 0.82 [0.36, 1.85] |
| 5 Leucopenia Show forest plot | 1 | 144 | Risk Ratio (M‐H, Random, 95% CI) | 3.0 [0.85, 10.63] |
| Analysis 8.5 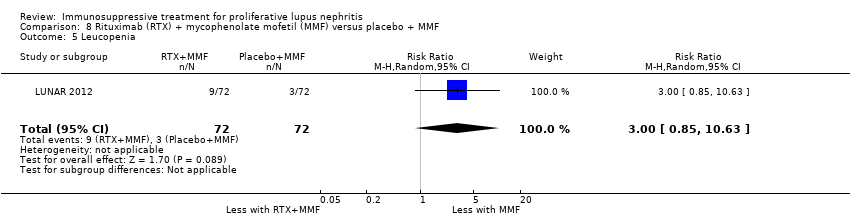 Comparison 8 Rituximab (RTX) + mycophenolate mofetil (MMF) versus placebo + MMF, Outcome 5 Leucopenia. | ||||
| Outcome or subgroup title | No. of studies | No. of participants | Statistical method | Effect size |
| 1 Remission Show forest plot | 1 | Risk Ratio (M‐H, Random, 95% CI) | Subtotals only | |
| Analysis 9.1  Comparison 9 Rituximab (RTX) + cyclophosphamide (CPA) versus RTX, Outcome 1 Remission. | ||||
| 1.1 Complete renal response | 1 | 19 | Risk Ratio (M‐H, Random, 95% CI) | 0.9 [0.16, 5.13] |
| 1.2 Partial renal response | 1 | 19 | Risk Ratio (M‐H, Random, 95% CI) | 0.75 [0.35, 1.62] |
| 2 Infection Show forest plot | 1 | 38 | Risk Ratio (M‐H, Random, 95% CI) | 0.57 [0.08, 4.20] |
| Analysis 9.2  Comparison 9 Rituximab (RTX) + cyclophosphamide (CPA) versus RTX, Outcome 2 Infection. | ||||
| 2.1 Major infection | 1 | 19 | Risk Ratio (M‐H, Random, 95% CI) | 0.9 [0.07, 12.38] |
| 2.2 Herpes zoster virus | 1 | 19 | Risk Ratio (M‐H, Random, 95% CI) | 0.30 [0.01, 6.62] |
| 3 Daily proteinuria Show forest plot | 1 | 19 | Mean Difference (IV, Random, 95% CI) | ‐0.30 [‐2.29, 1.69] |
| Analysis 9.3  Comparison 9 Rituximab (RTX) + cyclophosphamide (CPA) versus RTX, Outcome 3 Daily proteinuria. | ||||
| 4 Creatinine clearance Show forest plot | 1 | 19 | Mean Difference (IV, Random, 95% CI) | ‐17.20 [‐50.66, 16.26] |
| Analysis 9.4  Comparison 9 Rituximab (RTX) + cyclophosphamide (CPA) versus RTX, Outcome 4 Creatinine clearance. | ||||
| 5 Serum creatinine Show forest plot | 1 | 19 | Mean Difference (IV, Random, 95% CI) | 35.00 [‐27.14, 97.14] |
| Analysis 9.5  Comparison 9 Rituximab (RTX) + cyclophosphamide (CPA) versus RTX, Outcome 5 Serum creatinine. | ||||
| Outcome or subgroup title | No. of studies | No. of participants | Statistical method | Effect size |
| 1 Death Show forest plot | 2 | Risk Ratio (M‐H, Random, 95% CI) | Subtotals only | |
| Analysis 10.1  Comparison 10 Abatacept + other immunosuppressive agent (IS) + versus placebo + other IS, Outcome 1 Death. | ||||
| 1.1 Abatacept versus placebo | 2 | 432 | Risk Ratio (M‐H, Random, 95% CI) | 0.29 [0.10, 0.91] |
| 1.2 High dose abatacept versus placebo | 1 | 199 | Risk Ratio (M‐H, Random, 95% CI) | 0.29 [0.06, 1.36] |
| 1.3 Low dose abatacept versus placebo | 1 | 199 | Risk Ratio (M‐H, Random, 95% CI) | 0.29 [0.06, 1.36] |
| 2 Remission Show forest plot | 2 | Risk Ratio (M‐H, Random, 95% CI) | Subtotals only | |
| Analysis 10.2  Comparison 10 Abatacept + other immunosuppressive agent (IS) + versus placebo + other IS, Outcome 2 Remission. | ||||
| 2.1 Complete remission: abatacept versus placebo | 2 | 432 | Risk Ratio (M‐H, Random, 95% CI) | 1.13 [0.74, 1.71] |
| 2.2 Complete remission: high dose abatacept versus placebo | 1 | 199 | Risk Ratio (M‐H, Random, 95% CI) | 1.14 [0.46, 2.83] |
| 2.3 Complete remission: low dose abatacept versus placebo | 1 | 199 | Risk Ratio (M‐H, Random, 95% CI) | 1.39 [0.58, 3.31] |
| 2.4 Partial remission: abatacept versus placebo | 2 | 432 | Risk Ratio (M‐H, Random, 95% CI) | 0.88 [0.58, 1.33] |
| 2.5 Partial remission: high dose abatacept versus placebo | 1 | 199 | Risk Ratio (M‐H, Random, 95% CI) | 1.01 [0.51, 2.01] |
| 2.6 Partial remission: low dose abatacept versus placebo | 1 | 199 | Risk Ratio (M‐H, Random, 95% CI) | 0.65 [0.29, 1.43] |
| 3 Adverse renal outcomes Show forest plot | 2 | Risk Ratio (M‐H, Random, 95% CI) | Subtotals only | |
| Analysis 10.3  Comparison 10 Abatacept + other immunosuppressive agent (IS) + versus placebo + other IS, Outcome 3 Adverse renal outcomes. | ||||
| 3.1 ESKD: Abatacept versus placebo | 1 | 298 | Risk Ratio (M‐H, Random, 95% CI) | 0.84 [0.21, 3.45] |
| 3.2 ESKD: high dose abatacept versus placebo | 1 | 199 | Risk Ratio (M‐H, Random, 95% CI) | 1.01 [0.21, 4.88] |
| 3.3 ESKD: low dose abatacept versus placebo | 1 | 199 | Risk Ratio (M‐H, Random, 95% CI) | 0.67 [0.11, 3.94] |
| 3.4 Renal relapse: abatacept versus placebo | 1 | 134 | Risk Ratio (M‐H, Random, 95% CI) | 1.03 [0.22, 4.92] |
| 4 Major Infection Show forest plot | 2 | Risk Ratio (M‐H, Random, 95% CI) | Subtotals only | |
| Analysis 10.4 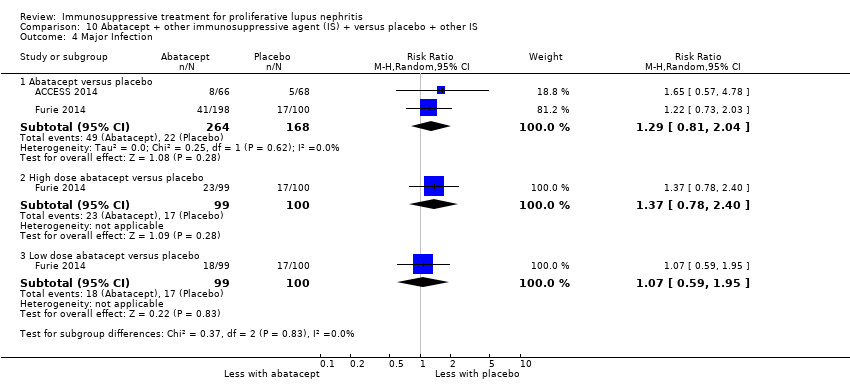 Comparison 10 Abatacept + other immunosuppressive agent (IS) + versus placebo + other IS, Outcome 4 Major Infection. | ||||
| 4.1 Abatacept versus placebo | 2 | 432 | Risk Ratio (M‐H, Random, 95% CI) | 1.29 [0.81, 2.04] |
| 4.2 High dose abatacept versus placebo | 1 | 199 | Risk Ratio (M‐H, Random, 95% CI) | 1.37 [0.78, 2.40] |
| 4.3 Low dose abatacept versus placebo | 1 | 199 | Risk Ratio (M‐H, Random, 95% CI) | 1.07 [0.59, 1.95] |
| 5 Herpes zoster virus Show forest plot | 1 | Risk Ratio (M‐H, Random, 95% CI) | Subtotals only | |
| Analysis 10.5  Comparison 10 Abatacept + other immunosuppressive agent (IS) + versus placebo + other IS, Outcome 5 Herpes zoster virus. | ||||
| 5.1 Abatacept versus placebo | 1 | 298 | Risk Ratio (M‐H, Random, 95% CI) | 9.64 [0.57, 164.02] |
| 5.2 High dose abatacept versus placebo | 1 | 199 | Risk Ratio (M‐H, Random, 95% CI) | 7.07 [0.37, 135.11] |
| 5.3 Low dose abatacept versus placebo | 1 | 199 | Risk Ratio (M‐H, Random, 95% CI) | 13.13 [0.75, 229.99] |
| 6 Health‐related quality of life Show forest plot | 1 | Mean Difference (IV, Random, 95% CI) | Subtotals only | |
| Analysis 10.6  Comparison 10 Abatacept + other immunosuppressive agent (IS) + versus placebo + other IS, Outcome 6 Health‐related quality of life. | ||||
| 6.1 Physical component | 1 | 134 | Mean Difference (IV, Random, 95% CI) | 0.0 [‐3.73, 3.73] |
| 6.2 Mental component | 1 | 134 | Mean Difference (IV, Random, 95% CI) | ‐0.60 [‐4.50, 3.30] |
| 7 Disease activity (BILAG) Show forest plot | 1 | 134 | Mean Difference (IV, Random, 95% CI) | ‐0.40 [‐1.23, 0.43] |
| Analysis 10.7  Comparison 10 Abatacept + other immunosuppressive agent (IS) + versus placebo + other IS, Outcome 7 Disease activity (BILAG). | ||||
| Outcome or subgroup title | No. of studies | No. of participants | Statistical method | Effect size |
| 1 Death Show forest plot | 1 | Risk Ratio (M‐H, Random, 95% CI) | Subtotals only | |
| Analysis 11.1  Comparison 11 Laquinimod + other immunosuppressive agent (IS) versus placebo + other IS, Outcome 1 Death. | ||||
| 1.1 Laquinimod versus placebo | 1 | 46 | Risk Ratio (M‐H, Random, 95% CI) | 1.5 [0.06, 34.79] |
| 1.2 High dose laquinimod versus placebo | 1 | 30 | Risk Ratio (M‐H, Random, 95% CI) | 3.0 [0.13, 68.26] |
| 1.3 Low dose laquinimod versus placebo | 1 | 31 | Risk Ratio (M‐H, Random, 95% CI) | 0.0 [0.0, 0.0] |
| 2 Complete remission Show forest plot | 1 | Risk Ratio (M‐H, Random, 95% CI) | Subtotals only | |
| Analysis 11.2 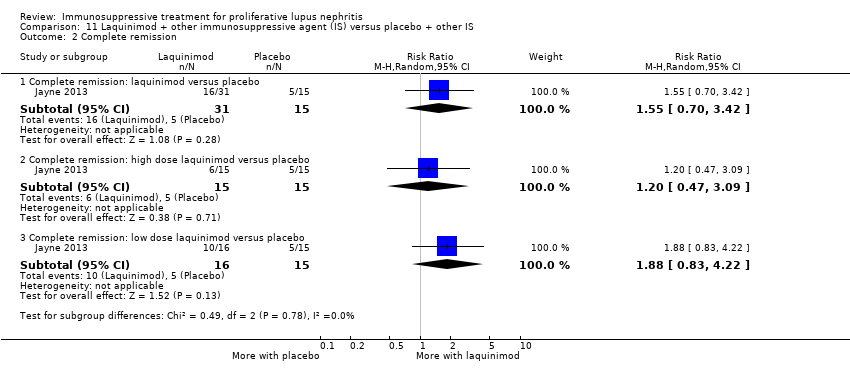 Comparison 11 Laquinimod + other immunosuppressive agent (IS) versus placebo + other IS, Outcome 2 Complete remission. | ||||
| 2.1 Complete remission: laquinimod versus placebo | 1 | 46 | Risk Ratio (M‐H, Random, 95% CI) | 1.55 [0.70, 3.42] |
| 2.2 Complete remission: high dose laquinimod versus placebo | 1 | 30 | Risk Ratio (M‐H, Random, 95% CI) | 1.2 [0.47, 3.09] |
| 2.3 Complete remission: low dose laquinimod versus placebo | 1 | 31 | Risk Ratio (M‐H, Random, 95% CI) | 1.88 [0.83, 4.22] |
| Outcome or subgroup title | No. of studies | No. of participants | Statistical method | Effect size |
| 1 Death Show forest plot | 1 | Risk Ratio (M‐H, Random, 95% CI) | Subtotals only | |
| Analysis 12.1  Comparison 12 Ocrelizumab + other immunosuppressive agent (IS) versus placebo + other IS, Outcome 1 Death. | ||||
| 1.1 Ocrelizumab versus placebo | 1 | 379 | Risk Ratio (M‐H, Random, 95% CI) | 0.66 [0.23, 1.85] |
| 1.2 High dose ocrelizumab versus placebo | 1 | 253 | Risk Ratio (M‐H, Random, 95% CI) | 0.81 [0.25, 2.60] |
| 1.3 Low dose ocrelizumab versus placebo | 1 | 251 | Risk Ratio (M‐H, Random, 95% CI) | 0.50 [0.13, 1.94] |
| 2 Remission Show forest plot | 1 | Risk Ratio (M‐H, Random, 95% CI) | Subtotals only | |
| Analysis 12.2  Comparison 12 Ocrelizumab + other immunosuppressive agent (IS) versus placebo + other IS, Outcome 2 Remission. | ||||
| 2.1 Complete remission: ocrelizumab versus placebo | 1 | 223 | Risk Ratio (M‐H, Random, 95% CI) | 1.07 [0.74, 1.56] |
| 2.2 Complete remission: high dose ocrelizumab versus placebo | 1 | 148 | Risk Ratio (M‐H, Random, 95% CI) | 0.91 [0.57, 1.44] |
| 2.3 Complete remission: low dose ocrelizumab versus placebo | 1 | 150 | Risk Ratio (M‐H, Random, 95% CI) | 1.23 [0.82, 1.85] |
| 2.4 Partial remission: ocrelizumab versus placebo | 1 | 223 | Risk Ratio (M‐H, Random, 95% CI) | 1.49 [0.89, 2.49] |
| 2.5 Partial remission: high dose ocrelizumab versus placebo | 1 | 148 | Risk Ratio (M‐H, Random, 95% CI) | 1.78 [1.03, 3.08] |
| 2.6 Partial remission: low dose ocrelizumab versus placebo | 1 | 150 | Risk Ratio (M‐H, Random, 95% CI) | 1.2 [0.65, 2.20] |
| 3 Major Infection Show forest plot | 1 | Risk Ratio (M‐H, Random, 95% CI) | Subtotals only | |
| Analysis 12.3  Comparison 12 Ocrelizumab + other immunosuppressive agent (IS) versus placebo + other IS, Outcome 3 Major Infection. | ||||
| 3.1 Ocrelizumab versus placebo | 1 | 378 | Risk Ratio (M‐H, Random, 95% CI) | 1.14 [0.95, 1.36] |
| 3.2 High dose ocrelizumab versus placebo | 1 | 252 | Risk Ratio (M‐H, Random, 95% CI) | 1.05 [0.85, 1.30] |
| 3.3 Low dose ocrelizumab versus placebo | 1 | 251 | Risk Ratio (M‐H, Random, 95% CI) | 1.22 [1.00, 1.48] |
| Outcome or subgroup title | No. of studies | No. of participants | Statistical method | Effect size |
| 1 Death Show forest plot | 1 | 25 | Risk Ratio (M‐H, Random, 95% CI) | 0.0 [0.0, 0.0] |
| Analysis 13.1  Comparison 13 Sirukumab + other immunosuppressive agent (IS) versus placebo + other IS, Outcome 1 Death. | ||||
| 2 Infection Show forest plot | 1 | 25 | Risk Ratio (M‐H, Random, 95% CI) | 0.93 [0.66, 1.32] |
| Analysis 13.2  Comparison 13 Sirukumab + other immunosuppressive agent (IS) versus placebo + other IS, Outcome 2 Infection. | ||||
| 2.1 Major infection | 1 | 25 | Risk Ratio (M‐H, Random, 95% CI) | 0.93 [0.66, 1.32] |
| 3 Malignancy Show forest plot | 1 | 25 | Risk Ratio (M‐H, Random, 95% CI) | 0.0 [0.0, 0.0] |
| Analysis 13.3  Comparison 13 Sirukumab + other immunosuppressive agent (IS) versus placebo + other IS, Outcome 3 Malignancy. | ||||
| 4 Gastrointestinal (GI) adverse events Show forest plot | 1 | Risk Ratio (M‐H, Random, 95% CI) | Subtotals only | |
| Analysis 13.4  Comparison 13 Sirukumab + other immunosuppressive agent (IS) versus placebo + other IS, Outcome 4 Gastrointestinal (GI) adverse events. | ||||
| 4.1 Diarrhoea | 1 | 25 | Risk Ratio (M‐H, Random, 95% CI) | 1.59 [0.10, 26.15] |
| Outcome or subgroup title | No. of studies | No. of participants | Statistical method | Effect size |
| 1 Death Show forest plot | 2 | 67 | Risk Ratio (M‐H, Random, 95% CI) | 0.80 [0.20, 3.24] |
| Analysis 14.1 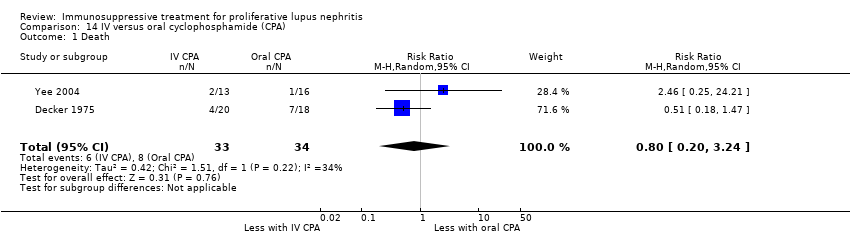 Comparison 14 IV versus oral cyclophosphamide (CPA), Outcome 1 Death. | ||||
| 2 Adverse renal outcomes Show forest plot | 2 | Risk Ratio (M‐H, Random, 95% CI) | Subtotals only | |
| Analysis 14.2  Comparison 14 IV versus oral cyclophosphamide (CPA), Outcome 2 Adverse renal outcomes. | ||||
| 2.1 ESKD | 2 | 67 | Risk Ratio (M‐H, Random, 95% CI) | 0.23 [0.04, 1.28] |
| 2.2 Doubling of serum creatinine | 2 | 67 | Risk Ratio (M‐H, Random, 95% CI) | 0.67 [0.23, 1.98] |
| 2.3 Deterioration of kidney function | 1 | 38 | Risk Ratio (M‐H, Random, 95% CI) | 0.72 [0.23, 2.27] |
| 3 Stable kidney function Show forest plot | 1 | 38 | Risk Ratio (M‐H, Random, 95% CI) | 1.11 [0.77, 1.59] |
| Analysis 14.3 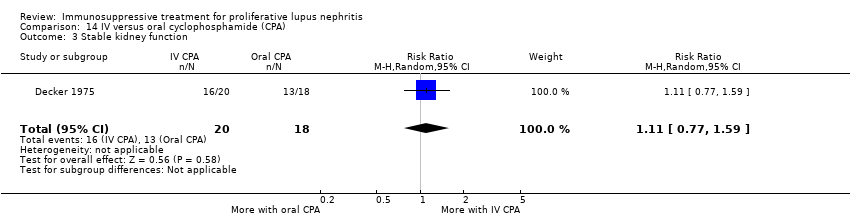 Comparison 14 IV versus oral cyclophosphamide (CPA), Outcome 3 Stable kidney function. | ||||
| 4 Ovarian failure Show forest plot | 2 | 56 | Risk Ratio (M‐H, Random, 95% CI) | 0.70 [0.37, 1.30] |
| Analysis 14.4  Comparison 14 IV versus oral cyclophosphamide (CPA), Outcome 4 Ovarian failure. | ||||
| 5 Infection Show forest plot | 2 | Risk Ratio (M‐H, Random, 95% CI) | Subtotals only | |
| Analysis 14.5  Comparison 14 IV versus oral cyclophosphamide (CPA), Outcome 5 Infection. | ||||
| 5.1 Major infection | 2 | 67 | Risk Ratio (M‐H, Random, 95% CI) | 1.16 [0.47, 2.90] |
| 5.2 Herpes zoster virus | 1 | 38 | Risk Ratio (M‐H, Random, 95% CI) | 0.75 [0.28, 2.04] |
| 6 Malignancy Show forest plot | 2 | 67 | Risk Ratio (M‐H, Random, 95% CI) | 1.43 [0.41, 4.96] |
| Analysis 14.6 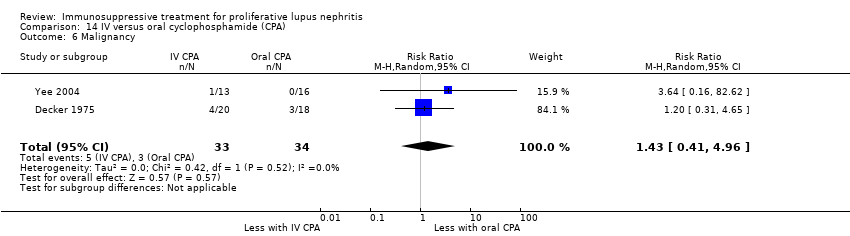 Comparison 14 IV versus oral cyclophosphamide (CPA), Outcome 6 Malignancy. | ||||
| 7 Bladder toxicity Show forest plot | 2 | 67 | Risk Ratio (M‐H, Random, 95% CI) | 0.22 [0.03, 1.83] |
| Analysis 14.7  Comparison 14 IV versus oral cyclophosphamide (CPA), Outcome 7 Bladder toxicity. | ||||
| 8 Gastrointestinal (GI) adverse events Show forest plot | 1 | Risk Ratio (M‐H, Random, 95% CI) | Subtotals only | |
| Analysis 14.8 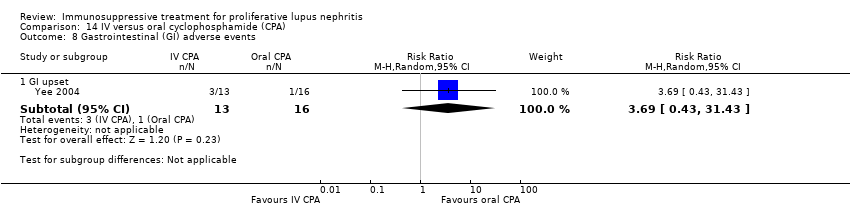 Comparison 14 IV versus oral cyclophosphamide (CPA), Outcome 8 Gastrointestinal (GI) adverse events. | ||||
| 8.1 GI upset | 1 | 29 | Risk Ratio (M‐H, Random, 95% CI) | 3.69 [0.43, 31.43] |
| Outcome or subgroup title | No. of studies | No. of participants | Statistical method | Effect size |
| 1 Death Show forest plot | 4 | Risk Ratio (M‐H, Random, 95% CI) | Subtotals only | |
| Analysis 15.1 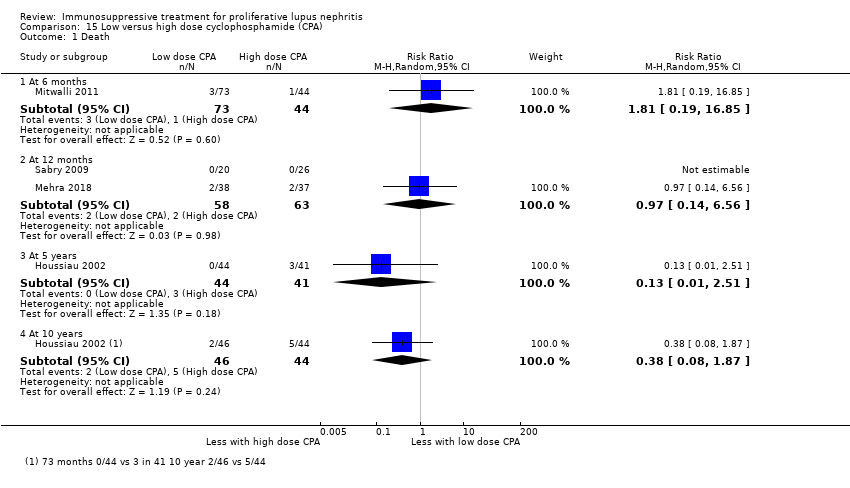 Comparison 15 Low versus high dose cyclophosphamide (CPA), Outcome 1 Death. | ||||
| 1.1 At 6 months | 1 | 117 | Risk Ratio (M‐H, Random, 95% CI) | 1.81 [0.19, 16.85] |
| 1.2 At 12 months | 2 | 121 | Risk Ratio (M‐H, Random, 95% CI) | 0.97 [0.14, 6.56] |
| 1.3 At 5 years | 1 | 85 | Risk Ratio (M‐H, Random, 95% CI) | 0.13 [0.01, 2.51] |
| 1.4 At 10 years | 1 | 90 | Risk Ratio (M‐H, Random, 95% CI) | 0.38 [0.08, 1.87] |
| 2 Remission Show forest plot | 3 | Risk Ratio (M‐H, Random, 95% CI) | Subtotals only | |
| Analysis 15.2  Comparison 15 Low versus high dose cyclophosphamide (CPA), Outcome 2 Remission. | ||||
| 2.1 Complete renal remission | 3 | 267 | Risk Ratio (M‐H, Random, 95% CI) | 1.09 [0.63, 1.86] |
| 2.2 Partial renal remission | 3 | 267 | Risk Ratio (M‐H, Random, 95% CI) | 0.88 [0.69, 1.14] |
| 3 Adverse renal outcomes Show forest plot | 3 | Risk Ratio (M‐H, Random, 95% CI) | Subtotals only | |
| Analysis 15.3  Comparison 15 Low versus high dose cyclophosphamide (CPA), Outcome 3 Adverse renal outcomes. | ||||
| 3.1 ESKD | 2 | 135 | Risk Ratio (M‐H, Random, 95% CI) | 0.49 [0.05, 5.20] |
| 3.2 ESKD at 5 years | 1 | 85 | Risk Ratio (M‐H, Random, 95% CI) | 2.80 [0.30, 25.81] |
| 3.3 ESKD at 10 years | 1 | 90 | Risk Ratio (M‐H, Random, 95% CI) | 1.91 [0.37, 9.92] |
| 3.4 Renal relapse | 3 | 211 | Risk Ratio (M‐H, Random, 95% CI) | 2.75 [0.47, 15.98] |
| 3.5 Doubling of serum creatinine | 2 | 135 | Risk Ratio (M‐H, Random, 95% CI) | 0.33 [0.04, 3.02] |
| 3.6 Doubling of serum creatinine at 5 years | 1 | 85 | Risk Ratio (M‐H, Random, 95% CI) | 0.13 [0.02, 1.04] |
| 3.7 Doubling of serum creatinine at 10 years | 1 | 90 | Risk Ratio (M‐H, Random, 95% CI) | 0.80 [0.26, 2.42] |
| 4 Stable kidney function Show forest plot | 1 | Risk Ratio (M‐H, Random, 95% CI) | Subtotals only | |
| Analysis 15.4  Comparison 15 Low versus high dose cyclophosphamide (CPA), Outcome 4 Stable kidney function. | ||||
| 4.1 At 3 years | 1 | 89 | Risk Ratio (M‐H, Random, 95% CI) | 0.72 [0.50, 1.03] |
| 4.2 At 5 years | 1 | 85 | Risk Ratio (M‐H, Random, 95% CI) | 0.96 [0.77, 1.20] |
| 5 Ovarian failure Show forest plot | 4 | 299 | Risk Ratio (M‐H, Random, 95% CI) | 1.73 [0.70, 4.31] |
| Analysis 15.5  Comparison 15 Low versus high dose cyclophosphamide (CPA), Outcome 5 Ovarian failure. | ||||
| 6 Infection Show forest plot | 4 | Risk Ratio (M‐H, Random, 95% CI) | Subtotals only | |
| Analysis 15.6  Comparison 15 Low versus high dose cyclophosphamide (CPA), Outcome 6 Infection. | ||||
| 6.1 Major infection | 4 | 327 | Risk Ratio (M‐H, Random, 95% CI) | 1.44 [0.83, 2.49] |
| 6.2 Herpes zoster virus | 3 | 281 | Risk Ratio (M‐H, Random, 95% CI) | 1.58 [0.41, 6.05] |
| 7 Malignancy Show forest plot | 2 | 206 | Risk Ratio (M‐H, Random, 95% CI) | 1.44 [0.09, 23.31] |
| Analysis 15.7  Comparison 15 Low versus high dose cyclophosphamide (CPA), Outcome 7 Malignancy. | ||||
| 8 Leucopenia Show forest plot | 3 | 281 | Risk Ratio (M‐H, Random, 95% CI) | 0.82 [0.13, 5.15] |
| Analysis 15.8  Comparison 15 Low versus high dose cyclophosphamide (CPA), Outcome 8 Leucopenia. | ||||
| 9 Bone toxicity Show forest plot | 2 | 164 | Risk Ratio (M‐H, Random, 95% CI) | 2.93 [0.48, 18.02] |
| Analysis 15.9 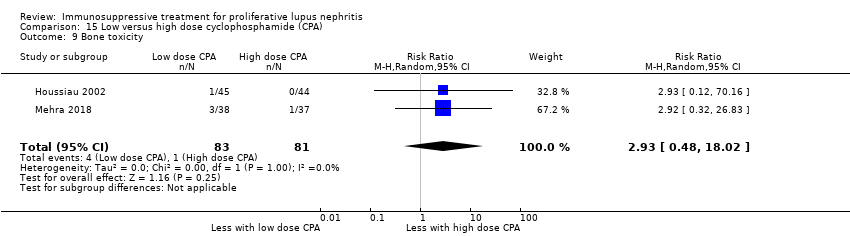 Comparison 15 Low versus high dose cyclophosphamide (CPA), Outcome 9 Bone toxicity. | ||||
| 10 Alopecia Show forest plot | 1 | 75 | Risk Ratio (M‐H, Random, 95% CI) | 0.28 [0.06, 1.25] |
| Analysis 15.10  Comparison 15 Low versus high dose cyclophosphamide (CPA), Outcome 10 Alopecia. | ||||
| 11 Gastrointestinal (GI) adverse events Show forest plot | 1 | Risk Ratio (M‐H, Random, 95% CI) | Subtotals only | |
| Analysis 15.11  Comparison 15 Low versus high dose cyclophosphamide (CPA), Outcome 11 Gastrointestinal (GI) adverse events. | ||||
| 11.1 GI disturbance | 1 | 75 | Risk Ratio (M‐H, Random, 95% CI) | 0.11 [0.01, 1.94] |
| 12 Daily proteinuria Show forest plot | 3 | 242 | Mean Difference (IV, Random, 95% CI) | ‐0.10 [‐0.65, 0.46] |
| Analysis 15.12  Comparison 15 Low versus high dose cyclophosphamide (CPA), Outcome 12 Daily proteinuria. | ||||
| 13 Creatinine clearance Show forest plot | 1 | 117 | Mean Difference (IV, Random, 95% CI) | ‐12.60 [‐23.63, ‐1.57] |
| Analysis 15.13 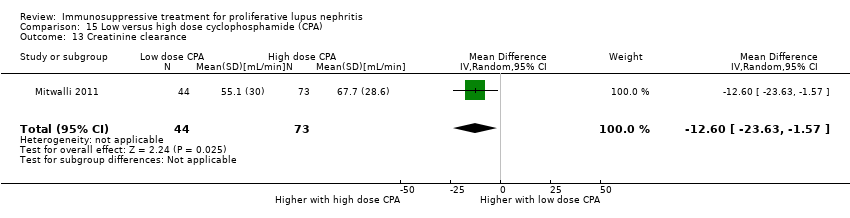 Comparison 15 Low versus high dose cyclophosphamide (CPA), Outcome 13 Creatinine clearance. | ||||
| 14 Serum creatinine Show forest plot | 3 | 247 | Mean Difference (IV, Random, 95% CI) | 2.85 [‐7.61, 13.31] |
| Analysis 15.14  Comparison 15 Low versus high dose cyclophosphamide (CPA), Outcome 14 Serum creatinine. | ||||
| 15 Disease activity (SLEDAI) Show forest plot | 1 | 75 | Mean Difference (IV, Random, 95% CI) | ‐1.50 [‐3.04, 0.04] |
| Analysis 15.15  Comparison 15 Low versus high dose cyclophosphamide (CPA), Outcome 15 Disease activity (SLEDAI). | ||||
| Outcome or subgroup title | No. of studies | No. of participants | Statistical method | Effect size |
| 1 Death Show forest plot | 1 | 81 | Risk Ratio (M‐H, Random, 95% CI) | 4.65 [0.23, 93.95] |
| Analysis 16.1 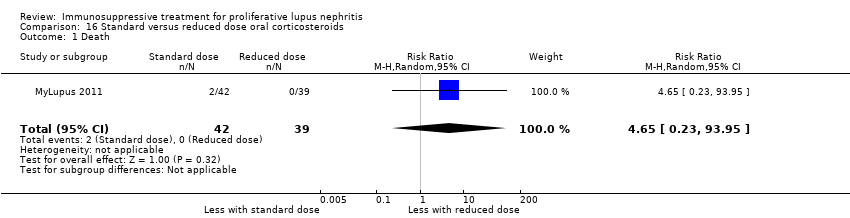 Comparison 16 Standard versus reduced dose oral corticosteroids, Outcome 1 Death. | ||||
| 2 Remission Show forest plot | 1 | Risk Ratio (M‐H, Random, 95% CI) | Subtotals only | |
| Analysis 16.2 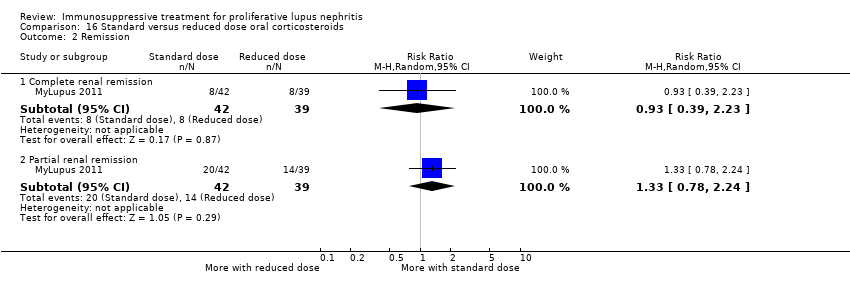 Comparison 16 Standard versus reduced dose oral corticosteroids, Outcome 2 Remission. | ||||
| 2.1 Complete renal remission | 1 | 81 | Risk Ratio (M‐H, Random, 95% CI) | 0.93 [0.39, 2.23] |
| 2.2 Partial renal remission | 1 | 81 | Risk Ratio (M‐H, Random, 95% CI) | 1.33 [0.78, 2.24] |
| 3 Relapse Show forest plot | 1 | 50 | Risk Ratio (M‐H, Random, 95% CI) | 2.38 [0.10, 55.72] |
| Analysis 16.3  Comparison 16 Standard versus reduced dose oral corticosteroids, Outcome 3 Relapse. | ||||
| 4 Infection Show forest plot | 1 | Risk Ratio (M‐H, Random, 95% CI) | Subtotals only | |
| Analysis 16.4  Comparison 16 Standard versus reduced dose oral corticosteroids, Outcome 4 Infection. | ||||
| 4.1 Major infection | 1 | 81 | Risk Ratio (M‐H, Random, 95% CI) | 4.64 [0.57, 38.00] |
| 4.2 Herpes zoster virus | 1 | 81 | Risk Ratio (M‐H, Random, 95% CI) | 13.95 [0.82, 236.48] |
| 5 Gastrointestinal (GI) adverse events Show forest plot | 1 | Risk Ratio (M‐H, Random, 95% CI) | Subtotals only | |
| Analysis 16.5 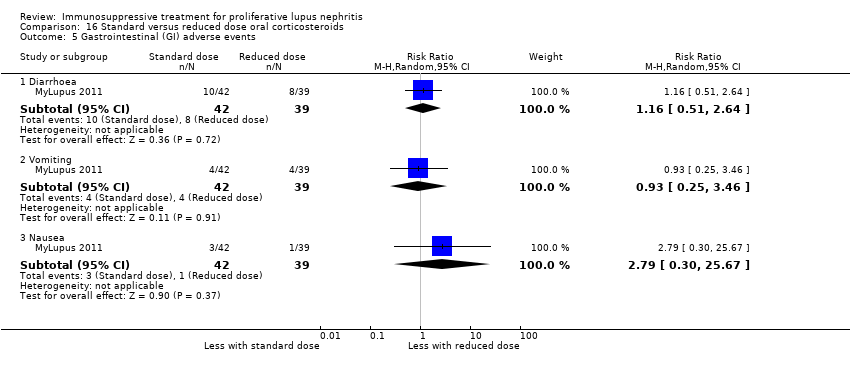 Comparison 16 Standard versus reduced dose oral corticosteroids, Outcome 5 Gastrointestinal (GI) adverse events. | ||||
| 5.1 Diarrhoea | 1 | 81 | Risk Ratio (M‐H, Random, 95% CI) | 1.16 [0.51, 2.64] |
| 5.2 Vomiting | 1 | 81 | Risk Ratio (M‐H, Random, 95% CI) | 0.93 [0.25, 3.46] |
| 5.3 Nausea | 1 | 81 | Risk Ratio (M‐H, Random, 95% CI) | 2.79 [0.30, 25.67] |
| 6 Creatinine clearance Show forest plot | 1 | 74 | Mean Difference (IV, Random, 95% CI) | ‐5.80 [‐21.08, 9.48] |
| Analysis 16.6  Comparison 16 Standard versus reduced dose oral corticosteroids, Outcome 6 Creatinine clearance. | ||||
| 7 Serum creatinine Show forest plot | 1 | 81 | Mean Difference (IV, Random, 95% CI) | ‐2.40 [‐15.98, 11.18] |
| Analysis 16.7 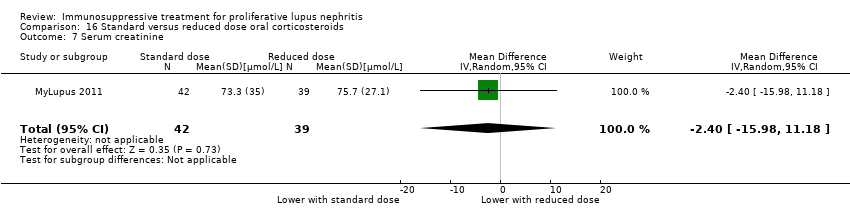 Comparison 16 Standard versus reduced dose oral corticosteroids, Outcome 7 Serum creatinine. | ||||
| Outcome or subgroup title | No. of studies | No. of participants | Statistical method | Effect size |
| 1 Death Show forest plot | 1 | 22 | Risk Ratio (M‐H, Random, 95% CI) | 0.0 [0.0, 0.0] |
| Analysis 17.1  Comparison 17 IV versus oral corticosteroids, Outcome 1 Death. | ||||
| 2 Adverse renal outcomes Show forest plot | 1 | Risk Ratio (M‐H, Random, 95% CI) | Subtotals only | |
| Analysis 17.2  Comparison 17 IV versus oral corticosteroids, Outcome 2 Adverse renal outcomes. | ||||
| 2.1 Renal relapse | 1 | 22 | Risk Ratio (M‐H, Random, 95% CI) | 0.95 [0.44, 2.04] |
| Outcome or subgroup title | No. of studies | No. of participants | Statistical method | Effect size |
| 1 Death Show forest plot | 5 | 226 | Risk Ratio (M‐H, Random, 95% CI) | 0.98 [0.53, 1.82] |
| Analysis 18.1  Comparison 18 Cyclophosphamide (CPA) + corticosteroids versus corticosteroids, Outcome 1 Death. | ||||
| 2 Complete remission of proteinuria Show forest plot | 1 | 13 | Risk Ratio (M‐H, Random, 95% CI) | 2.63 [0.13, 54.64] |
| Analysis 18.2  Comparison 18 Cyclophosphamide (CPA) + corticosteroids versus corticosteroids, Outcome 2 Complete remission of proteinuria. | ||||
| 3 Adverse renal outcomes Show forest plot | 5 | Risk Ratio (M‐H, Random, 95% CI) | Subtotals only | |
| Analysis 18.3 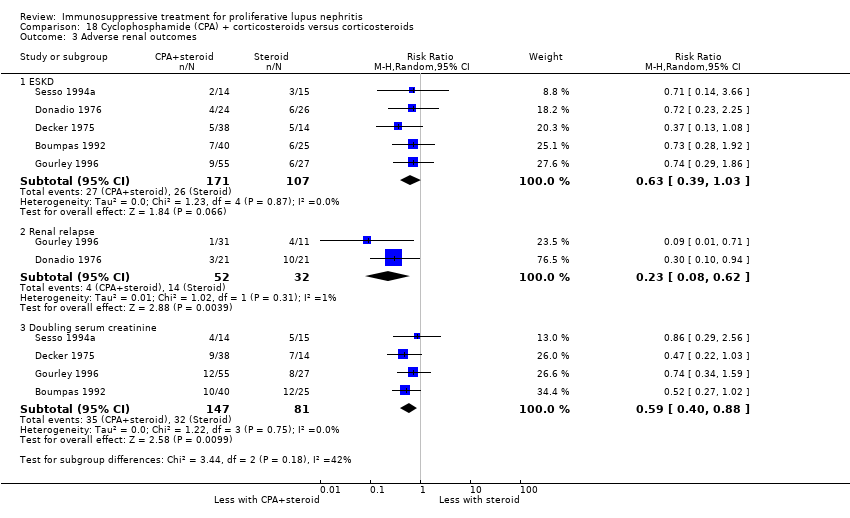 Comparison 18 Cyclophosphamide (CPA) + corticosteroids versus corticosteroids, Outcome 3 Adverse renal outcomes. | ||||
| 3.1 ESKD | 5 | 278 | Risk Ratio (M‐H, Random, 95% CI) | 0.63 [0.39, 1.03] |
| 3.2 Renal relapse | 2 | 84 | Risk Ratio (M‐H, Random, 95% CI) | 0.23 [0.08, 0.62] |
| 3.3 Doubling serum creatinine | 4 | 228 | Risk Ratio (M‐H, Random, 95% CI) | 0.59 [0.40, 0.88] |
| 4 Deterioration of kidney function Show forest plot | 5 | 179 | Risk Ratio (M‐H, Random, 95% CI) | 0.78 [0.52, 1.18] |
| Analysis 18.4  Comparison 18 Cyclophosphamide (CPA) + corticosteroids versus corticosteroids, Outcome 4 Deterioration of kidney function. | ||||
| 5 Stable kidney function Show forest plot | 5 | 278 | Risk Ratio (M‐H, Random, 95% CI) | 1.20 [1.00, 1.45] |
| Analysis 18.5 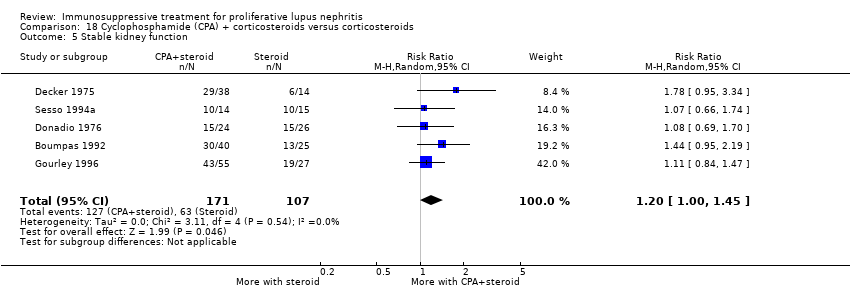 Comparison 18 Cyclophosphamide (CPA) + corticosteroids versus corticosteroids, Outcome 5 Stable kidney function. | ||||
| 6 Ovarian failure Show forest plot | 3 | 147 | Risk Ratio (M‐H, Random, 95% CI) | 2.18 [1.10, 4.34] |
| Analysis 18.6  Comparison 18 Cyclophosphamide (CPA) + corticosteroids versus corticosteroids, Outcome 6 Ovarian failure. | ||||
| 7 Infection Show forest plot | 6 | Risk Ratio (M‐H, Random, 95% CI) | Subtotals only | |
| Analysis 18.7  Comparison 18 Cyclophosphamide (CPA) + corticosteroids versus corticosteroids, Outcome 7 Infection. | ||||
| 7.1 Major infection | 6 | 291 | Risk Ratio (M‐H, Random, 95% CI) | 0.87 [0.50, 1.51] |
| 7.2 Herpes zoster virus | 3 | 199 | Risk Ratio (M‐H, Random, 95% CI) | 1.77 [0.63, 4.99] |
| 8 Malignancy Show forest plot | 2 | 117 | Risk Ratio (M‐H, Random, 95% CI) | 0.82 [0.07, 9.90] |
| Analysis 18.8  Comparison 18 Cyclophosphamide (CPA) + corticosteroids versus corticosteroids, Outcome 8 Malignancy. | ||||
| 9 Bone toxicity Show forest plot | 3 | 197 | Risk Ratio (M‐H, Random, 95% CI) | 0.84 [0.40, 1.75] |
| Analysis 18.9  Comparison 18 Cyclophosphamide (CPA) + corticosteroids versus corticosteroids, Outcome 9 Bone toxicity. | ||||
| 10 Bladder toxicity Show forest plot | 2 | 65 | Risk Ratio (M‐H, Random, 95% CI) | 2.66 [0.33, 21.68] |
| Analysis 18.10  Comparison 18 Cyclophosphamide (CPA) + corticosteroids versus corticosteroids, Outcome 10 Bladder toxicity. | ||||
| 11 Daily proteinuria Show forest plot | 3 | 92 | Mean Difference (IV, Random, 95% CI) | 0.15 [‐0.23, 0.54] |
| Analysis 18.11 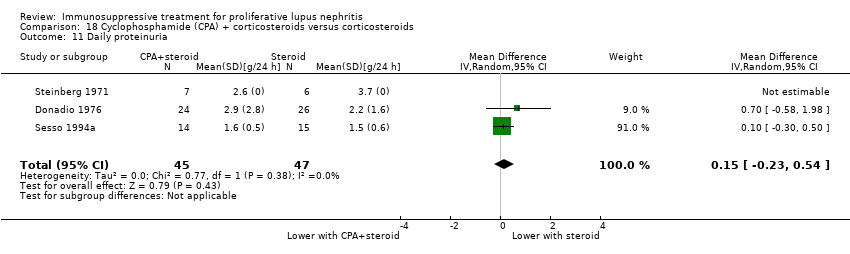 Comparison 18 Cyclophosphamide (CPA) + corticosteroids versus corticosteroids, Outcome 11 Daily proteinuria. | ||||
| 12 Serum creatinine Show forest plot | 1 | 29 | Mean Difference (IV, Random, 95% CI) | ‐52.0 [‐111.39, 7.39] |
| Analysis 18.12  Comparison 18 Cyclophosphamide (CPA) + corticosteroids versus corticosteroids, Outcome 12 Serum creatinine. | ||||
| 13 Creatinine clearance Show forest plot | 2 | 63 | Mean Difference (IV, Random, 95% CI) | 12.23 [‐0.13, 24.58] |
| Analysis 18.13  Comparison 18 Cyclophosphamide (CPA) + corticosteroids versus corticosteroids, Outcome 13 Creatinine clearance. | ||||
| Outcome or subgroup title | No. of studies | No. of participants | Statistical method | Effect size |
| 1 Death Show forest plot | 1 | 29 | Risk Ratio (M‐H, Random, 95% CI) | 0.53 [0.17, 1.68] |
| Analysis 19.1 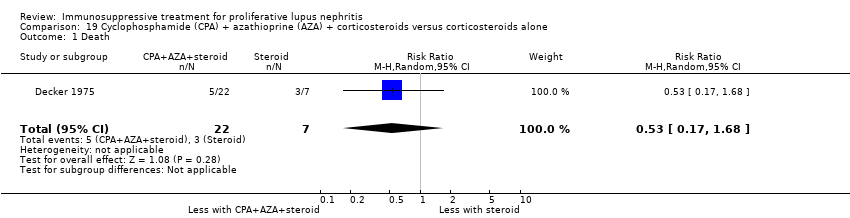 Comparison 19 Cyclophosphamide (CPA) + azathioprine (AZA) + corticosteroids versus corticosteroids alone, Outcome 1 Death. | ||||
| 2 Adverse renal outcomes Show forest plot | 1 | Risk Ratio (M‐H, Random, 95% CI) | Subtotals only | |
| Analysis 19.2  Comparison 19 Cyclophosphamide (CPA) + azathioprine (AZA) + corticosteroids versus corticosteroids alone, Outcome 2 Adverse renal outcomes. | ||||
| 2.1 ESKD | 1 | 29 | Risk Ratio (M‐H, Random, 95% CI) | 0.21 [0.04, 1.02] |
| 2.2 Doubling of serum creatinine | 1 | 29 | Risk Ratio (M‐H, Random, 95% CI) | 0.16 [0.04, 0.69] |
| 3 Stable kidney function Show forest plot | 1 | 29 | Risk Ratio (M‐H, Random, 95% CI) | 1.59 [0.83, 3.06] |
| Analysis 19.3  Comparison 19 Cyclophosphamide (CPA) + azathioprine (AZA) + corticosteroids versus corticosteroids alone, Outcome 3 Stable kidney function. | ||||
| 4 Ovarian failure Show forest plot | 1 | 27 | Risk Ratio (M‐H, Random, 95% CI) | 7.32 [0.49, 108.96] |
| Analysis 19.4  Comparison 19 Cyclophosphamide (CPA) + azathioprine (AZA) + corticosteroids versus corticosteroids alone, Outcome 4 Ovarian failure. | ||||
| 5 Infection Show forest plot | 1 | Risk Ratio (M‐H, Random, 95% CI) | Subtotals only | |
| Analysis 19.5  Comparison 19 Cyclophosphamide (CPA) + azathioprine (AZA) + corticosteroids versus corticosteroids alone, Outcome 5 Infection. | ||||
| 5.1 Major infection | 1 | 29 | Risk Ratio (M‐H, Random, 95% CI) | 0.48 [0.10, 2.30] |
| 5.2 Herpes zoster virus | 1 | 29 | Risk Ratio (M‐H, Random, 95% CI) | 5.22 [0.33, 81.40] |
| 6 Bladder toxicity Show forest plot | 1 | 29 | Risk Ratio (M‐H, Random, 95% CI) | 2.43 [0.14, 42.17] |
| Analysis 19.6  Comparison 19 Cyclophosphamide (CPA) + azathioprine (AZA) + corticosteroids versus corticosteroids alone, Outcome 6 Bladder toxicity. | ||||
| Outcome or subgroup title | No. of studies | No. of participants | Statistical method | Effect size |
| 1 Death Show forest plot | 3 | 78 | Risk Ratio (M‐H, Random, 95% CI) | 0.60 [0.36, 0.99] |
| Analysis 20.1  Comparison 20 Azathioprine (AZA) + corticosteroids versus corticosteroids alone, Outcome 1 Death. | ||||
| 2 Complete remission of proteinuria Show forest plot | 2 | 37 | Risk Ratio (M‐H, Random, 95% CI) | 0.95 [0.54, 1.69] |
| Analysis 20.2  Comparison 20 Azathioprine (AZA) + corticosteroids versus corticosteroids alone, Outcome 2 Complete remission of proteinuria. | ||||
| 3 Adverse renal outcomes Show forest plot | 3 | Risk Ratio (M‐H, Random, 95% CI) | Subtotals only | |
| Analysis 20.3  Comparison 20 Azathioprine (AZA) + corticosteroids versus corticosteroids alone, Outcome 3 Adverse renal outcomes. | ||||
| 3.1 ESKD | 2 | 54 | Risk Ratio (M‐H, Random, 95% CI) | 0.66 [0.17, 2.55] |
| 3.2 Renal relapse | 1 | 16 | Risk Ratio (M‐H, Random, 95% CI) | 0.78 [0.22, 2.74] |
| 3.3 Doubling of serum creatinine | 1 | 26 | Risk Ratio (M‐H, Random, 95% CI) | 0.98 [0.36, 2.68] |
| 4 Stable kidney function Show forest plot | 1 | 26 | Risk Ratio (M‐H, Random, 95% CI) | 1.01 [0.48, 2.14] |
| Analysis 20.4 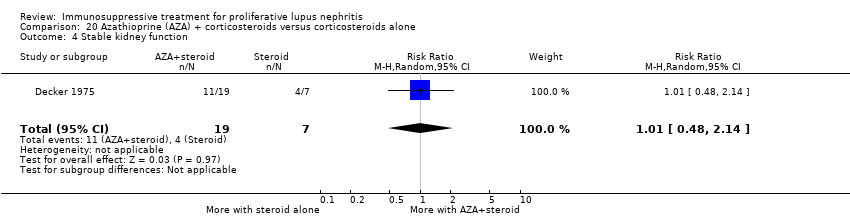 Comparison 20 Azathioprine (AZA) + corticosteroids versus corticosteroids alone, Outcome 4 Stable kidney function. | ||||
| 5 Ovarian failure Show forest plot | 1 | 24 | Risk Ratio (M‐H, Random, 95% CI) | 2.58 [0.15, 43.86] |
| Analysis 20.5  Comparison 20 Azathioprine (AZA) + corticosteroids versus corticosteroids alone, Outcome 5 Ovarian failure. | ||||
| 6 Infection Show forest plot | 2 | Risk Ratio (M‐H, Random, 95% CI) | Subtotals only | |
| Analysis 20.6 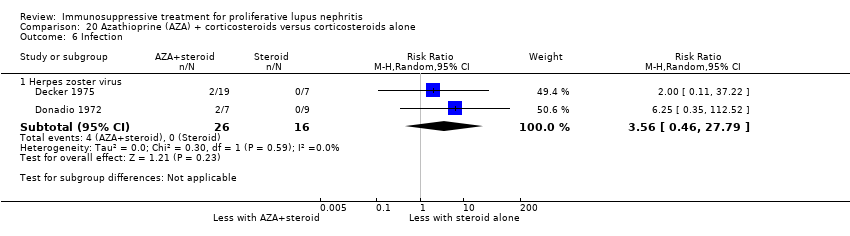 Comparison 20 Azathioprine (AZA) + corticosteroids versus corticosteroids alone, Outcome 6 Infection. | ||||
| 6.1 Herpes zoster virus | 2 | 42 | Risk Ratio (M‐H, Random, 95% CI) | 3.56 [0.46, 27.79] |
| 7 Malignancy Show forest plot | 1 | 26 | Risk Ratio (M‐H, Random, 95% CI) | 2.0 [0.11, 37.22] |
| Analysis 20.7  Comparison 20 Azathioprine (AZA) + corticosteroids versus corticosteroids alone, Outcome 7 Malignancy. | ||||
| 8 Bone toxicity Show forest plot | 1 | 24 | Risk Ratio (M‐H, Random, 95% CI) | 3.55 [0.43, 29.42] |
| Analysis 20.8  Comparison 20 Azathioprine (AZA) + corticosteroids versus corticosteroids alone, Outcome 8 Bone toxicity. | ||||
| 9 Creatinine clearance Show forest plot | 1 | 24 | Mean Difference (IV, Random, 95% CI) | 5.0 [‐3.14, 13.14] |
| Analysis 20.9 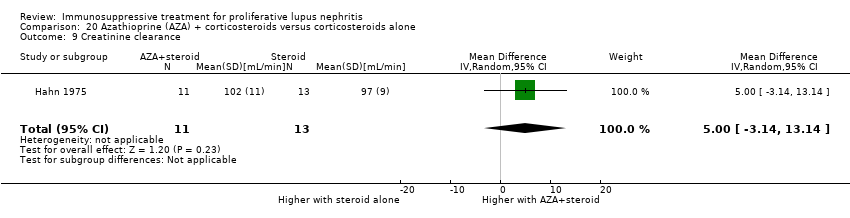 Comparison 20 Azathioprine (AZA) + corticosteroids versus corticosteroids alone, Outcome 9 Creatinine clearance. | ||||
| Outcome or subgroup title | No. of studies | No. of participants | Statistical method | Effect size |
| 1 Daily proteinuria Show forest plot | 1 | 10 | Mean Difference (IV, Random, 95% CI) | ‐1.8 [‐2.59, ‐1.01] |
| Analysis 21.1  Comparison 21 Cyclosporin (CSA) + corticosteroids versus corticosteroids alone, Outcome 1 Daily proteinuria. | ||||
| 2 Serum creatinine Show forest plot | 1 | 10 | Mean Difference (IV, Random, 95% CI) | ‐31.90 [‐73.63, 9.83] |
| Analysis 21.2 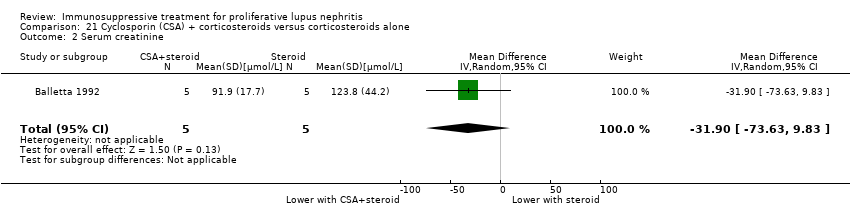 Comparison 21 Cyclosporin (CSA) + corticosteroids versus corticosteroids alone, Outcome 2 Serum creatinine. | ||||
| 3 Creatinine clearance Show forest plot | 1 | 10 | Mean Difference (IV, Random, 95% CI) | ‐42.5 [‐85.02, 0.02] |
| Analysis 21.3  Comparison 21 Cyclosporin (CSA) + corticosteroids versus corticosteroids alone, Outcome 3 Creatinine clearance. | ||||
| Outcome or subgroup title | No. of studies | No. of participants | Statistical method | Effect size |
| 1 Adverse renal outcomes Show forest plot | 1 | Risk Ratio (M‐H, Random, 95% CI) | Subtotals only | |
| Analysis 22.1  Comparison 22 Misoprostol + corticosteroids versus corticosteroids alone, Outcome 1 Adverse renal outcomes. | ||||
| 1.1 Doubling of serum creatinine | 1 | 14 | Risk Ratio (M‐H, Random, 95% CI) | 0.0 [0.0, 0.0] |
| Outcome or subgroup title | No. of studies | No. of participants | Statistical method | Effect size |
| 1 Death Show forest plot | 2 | 125 | Risk Ratio (M‐H, Random, 95% CI) | 1.62 [0.64, 4.09] |
| Analysis 23.1  Comparison 23 Plasma exchange (PE) + immunosuppression (IS) versus IS alone, Outcome 1 Death. | ||||
| 2 Adverse renal outcomes Show forest plot | 4 | 251 | Risk Ratio (M‐H, Random, 95% CI) | 0.89 [0.51, 1.55] |
| Analysis 23.2  Comparison 23 Plasma exchange (PE) + immunosuppression (IS) versus IS alone, Outcome 2 Adverse renal outcomes. | ||||
| 2.1 ESKD | 3 | 143 | Risk Ratio (M‐H, Random, 95% CI) | 1.24 [0.60, 2.57] |
| 2.2 Doubling of serum creatinine | 2 | 51 | Risk Ratio (M‐H, Random, 95% CI) | 0.17 [0.02, 1.26] |
| 2.3 Deterioration of kidney function | 2 | 57 | Risk Ratio (M‐H, Random, 95% CI) | 0.53 [0.06, 4.83] |
| 3 Stable kidney function Show forest plot | 3 | 75 | Risk Ratio (M‐H, Random, 95% CI) | 1.10 [0.94, 1.30] |
| Analysis 23.3  Comparison 23 Plasma exchange (PE) + immunosuppression (IS) versus IS alone, Outcome 3 Stable kidney function. | ||||
| 4 Infection Show forest plot | 3 | Risk Ratio (M‐H, Random, 95% CI) | Subtotals only | |
| Analysis 23.4  Comparison 23 Plasma exchange (PE) + immunosuppression (IS) versus IS alone, Outcome 4 Infection. | ||||
| 4.1 Major infection | 2 | 125 | Risk Ratio (M‐H, Random, 95% CI) | 0.69 [0.35, 1.37] |
| 4.2 Herpes zoster virus | 2 | 104 | Risk Ratio (M‐H, Random, 95% CI) | 1.69 [0.10, 29.42] |
| 5 Leucopenia Show forest plot | 1 | 18 | Risk Ratio (M‐H, Random, 95% CI) | 2.60 [0.20, 34.07] |
| Analysis 23.5  Comparison 23 Plasma exchange (PE) + immunosuppression (IS) versus IS alone, Outcome 5 Leucopenia. | ||||
| 6 Daily proteinuria Show forest plot | 2 | 30 | Mean Difference (IV, Random, 95% CI) | ‐0.56 [‐5.23, 4.11] |
| Analysis 23.6  Comparison 23 Plasma exchange (PE) + immunosuppression (IS) versus IS alone, Outcome 6 Daily proteinuria. | ||||
| 7 Serum creatinine Show forest plot | 3 | 69 | Mean Difference (IV, Random, 95% CI) | ‐17.90 [‐23.41, ‐12.39] |
| Analysis 23.7 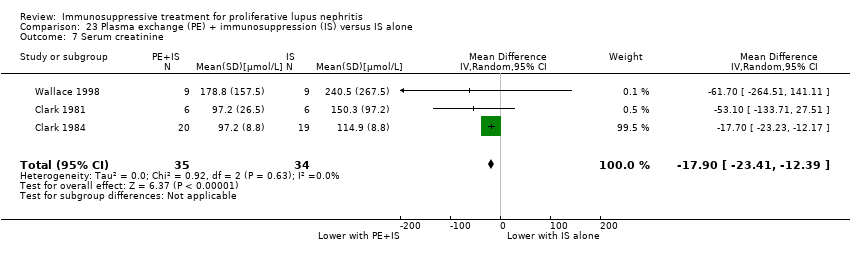 Comparison 23 Plasma exchange (PE) + immunosuppression (IS) versus IS alone, Outcome 7 Serum creatinine. | ||||
| 8 Creatinine clearance Show forest plot | 1 | 12 | Mean Difference (IV, Random, 95% CI) | 26.0 [‐17.60, 69.60] |
| Analysis 23.8 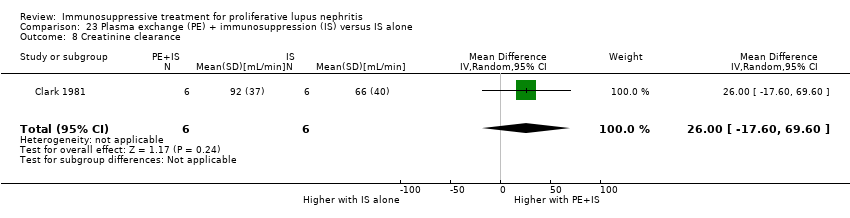 Comparison 23 Plasma exchange (PE) + immunosuppression (IS) versus IS alone, Outcome 8 Creatinine clearance. | ||||
| 9 Disease activity (SLAM) Show forest plot | 1 | 18 | Mean Difference (IV, Random, 95% CI) | 0.67 [‐3.47, 4.81] |
| Analysis 23.9  Comparison 23 Plasma exchange (PE) + immunosuppression (IS) versus IS alone, Outcome 9 Disease activity (SLAM). | ||||
| Outcome or subgroup title | No. of studies | No. of participants | Statistical method | Effect size |
| 1 Adverse renal outcomes Show forest plot | 1 | Risk Ratio (M‐H, Random, 95% CI) | Subtotals only | |
| Analysis 24.1  Comparison 24 Plasma exchange (PE) versus immunosuppression (IS), Outcome 1 Adverse renal outcomes. | ||||
| 1.1 ESKD | 1 | 20 | Risk Ratio (M‐H, Random, 95% CI) | 0.24 [0.01, 4.44] |
| 2 Infection Show forest plot | 1 | Risk Ratio (M‐H, Random, 95% CI) | Subtotals only | |
| Analysis 24.2  Comparison 24 Plasma exchange (PE) versus immunosuppression (IS), Outcome 2 Infection. | ||||
| 2.1 Major infection | 1 | 20 | Risk Ratio (M‐H, Random, 95% CI) | 0.4 [0.02, 8.78] |
| 2.2 Herpes zoster virus | 1 | 20 | Risk Ratio (M‐H, Random, 95% CI) | 0.24 [0.01, 4.44] |
| 3 Leucopenia Show forest plot | 1 | 20 | Risk Ratio (M‐H, Random, 95% CI) | 0.24 [0.01, 4.44] |
| Analysis 24.3 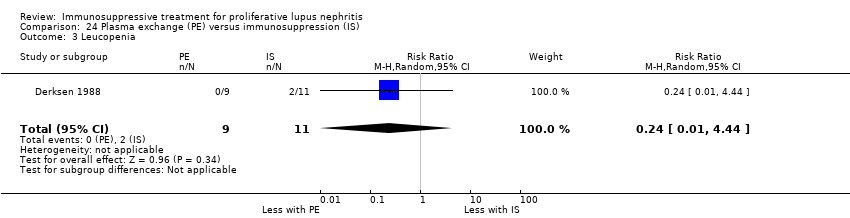 Comparison 24 Plasma exchange (PE) versus immunosuppression (IS), Outcome 3 Leucopenia. | ||||
| 4 Alopecia Show forest plot | 1 | 20 | Risk Ratio (M‐H, Random, 95% CI) | 0.0 [0.0, 0.0] |
| Analysis 24.4  Comparison 24 Plasma exchange (PE) versus immunosuppression (IS), Outcome 4 Alopecia. | ||||
| 5 Daily proteinuria Show forest plot | 1 | 20 | Mean Difference (IV, Random, 95% CI) | ‐0.10 [‐0.45, 0.25] |
| Analysis 24.5  Comparison 24 Plasma exchange (PE) versus immunosuppression (IS), Outcome 5 Daily proteinuria. | ||||
| 6 Creatinine clearance Show forest plot | 1 | 20 | Mean Difference (IV, Random, 95% CI) | 15.30 [‐5.40, 36.00] |
| Analysis 24.6 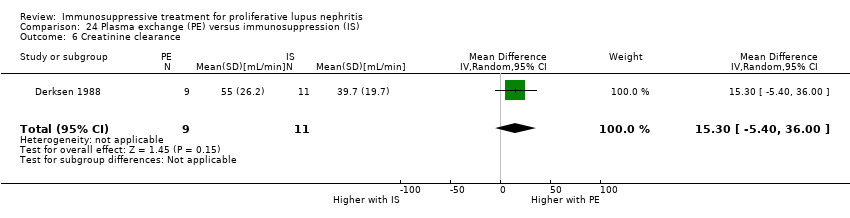 Comparison 24 Plasma exchange (PE) versus immunosuppression (IS), Outcome 6 Creatinine clearance. | ||||
| Outcome or subgroup title | No. of studies | No. of participants | Statistical method | Effect size |
| 1 Adverse renal outcomes Show forest plot | 1 | Risk Ratio (M‐H, Random, 95% CI) | Subtotals only | |
| Analysis 25.1 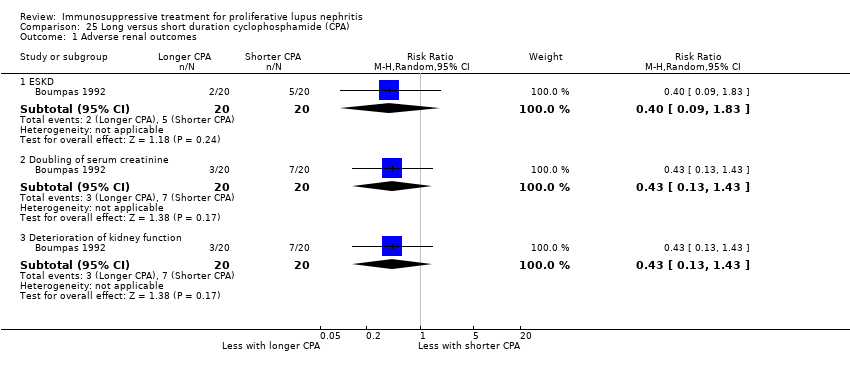 Comparison 25 Long versus short duration cyclophosphamide (CPA), Outcome 1 Adverse renal outcomes. | ||||
| 1.1 ESKD | 1 | 40 | Risk Ratio (M‐H, Random, 95% CI) | 0.4 [0.09, 1.83] |
| 1.2 Doubling of serum creatinine | 1 | 40 | Risk Ratio (M‐H, Random, 95% CI) | 0.43 [0.13, 1.43] |
| 1.3 Deterioration of kidney function | 1 | 40 | Risk Ratio (M‐H, Random, 95% CI) | 0.43 [0.13, 1.43] |
| 2 Stable kidney function Show forest plot | 1 | 40 | Risk Ratio (M‐H, Random, 95% CI) | 1.31 [0.90, 1.89] |
| Analysis 25.2  Comparison 25 Long versus short duration cyclophosphamide (CPA), Outcome 2 Stable kidney function. | ||||
| 3 Ovarian failure Show forest plot | 1 | 29 | Risk Ratio (M‐H, Random, 95% CI) | 2.05 [0.60, 7.02] |
| Analysis 25.3  Comparison 25 Long versus short duration cyclophosphamide (CPA), Outcome 3 Ovarian failure. | ||||
| 4 Infection Show forest plot | 1 | Risk Ratio (M‐H, Random, 95% CI) | Subtotals only | |
| Analysis 25.4 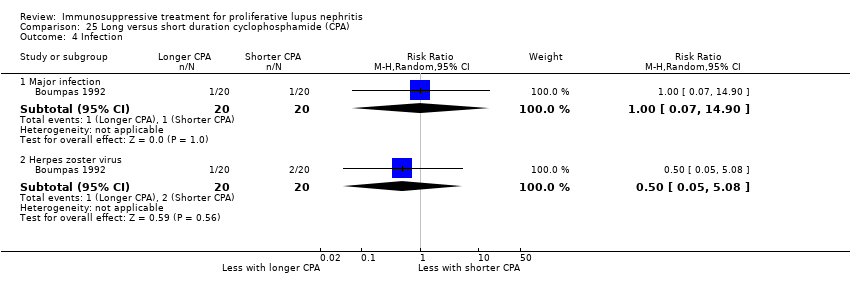 Comparison 25 Long versus short duration cyclophosphamide (CPA), Outcome 4 Infection. | ||||
| 4.1 Major infection | 1 | 40 | Risk Ratio (M‐H, Random, 95% CI) | 1.0 [0.07, 14.90] |
| 4.2 Herpes zoster virus | 1 | 40 | Risk Ratio (M‐H, Random, 95% CI) | 0.5 [0.05, 5.08] |
| 5 Malignancy Show forest plot | 1 | 40 | Risk Ratio (M‐H, Random, 95% CI) | 3.0 [0.13, 69.52] |
| Analysis 25.5  Comparison 25 Long versus short duration cyclophosphamide (CPA), Outcome 5 Malignancy. | ||||
| 6 Bone toxicity Show forest plot | 1 | 40 | Risk Ratio (M‐H, Random, 95% CI) | 1.33 [0.34, 5.21] |
| Analysis 25.6  Comparison 25 Long versus short duration cyclophosphamide (CPA), Outcome 6 Bone toxicity. | ||||
| 7 Bladder toxicity Show forest plot | 1 | 40 | Risk Ratio (M‐H, Random, 95% CI) | 0.0 [0.0, 0.0] |
| Analysis 25.7  Comparison 25 Long versus short duration cyclophosphamide (CPA), Outcome 7 Bladder toxicity. | ||||
| Outcome or subgroup title | No. of studies | No. of participants | Statistical method | Effect size |
| 1 Death Show forest plot | 4 | Risk Ratio (M‐H, Random, 95% CI) | Subtotals only | |
| Analysis 26.1  Comparison 26 Maintenance: azathioprine (AZA) versus mycophenolate mofetil (MMF), Outcome 1 Death. | ||||
| 1.1 At end of treatment duration or follow‐up | 4 | 451 | Risk Ratio (M‐H, Random, 95% CI) | 1.15 [0.34, 3.87] |
| 1.2 At 10 years | 1 | 87 | Risk Ratio (M‐H, Random, 95% CI) | 0.62 [0.11, 3.54] |
| 2 Renal relapse Show forest plot | 4 | Risk Ratio (M‐H, Random, 95% CI) | Subtotals only | |
| Analysis 26.2  Comparison 26 Maintenance: azathioprine (AZA) versus mycophenolate mofetil (MMF), Outcome 2 Renal relapse. | ||||
| 2.1 At end of treatment duration or follow‐up | 4 | 452 | Risk Ratio (M‐H, Random, 95% CI) | 1.75 [1.20, 2.55] |
| 2.2 At 10 years | 1 | 87 | Risk Ratio (M‐H, Random, 95% CI) | 1.08 [0.69, 1.69] |
| 3 End‐stage kidney disease Show forest plot | 4 | Risk Ratio (M‐H, Random, 95% CI) | Subtotals only | |
| Analysis 26.3  Comparison 26 Maintenance: azathioprine (AZA) versus mycophenolate mofetil (MMF), Outcome 3 End‐stage kidney disease. | ||||
| 3.1 At end of treatment duration or follow‐up | 4 | 452 | Risk Ratio (M‐H, Random, 95% CI) | 1.70 [0.52, 5.54] |
| 3.2 At 10 years | 1 | 87 | Risk Ratio (M‐H, Random, 95% CI) | 0.31 [0.03, 2.88] |
| 4 Doubling of serum creatinine Show forest plot | 4 | 452 | Risk Ratio (M‐H, Random, 95% CI) | 2.19 [1.03, 4.66] |
| Analysis 26.4  Comparison 26 Maintenance: azathioprine (AZA) versus mycophenolate mofetil (MMF), Outcome 4 Doubling of serum creatinine. | ||||
| 5 Ovarian failure Show forest plot | 2 | 177 | Risk Ratio (M‐H, Random, 95% CI) | 0.77 [0.17, 3.42] |
| Analysis 26.5  Comparison 26 Maintenance: azathioprine (AZA) versus mycophenolate mofetil (MMF), Outcome 5 Ovarian failure. | ||||
| 6 Infection Show forest plot | 3 | Risk Ratio (M‐H, Random, 95% CI) | Subtotals only | |
| Analysis 26.6  Comparison 26 Maintenance: azathioprine (AZA) versus mycophenolate mofetil (MMF), Outcome 6 Infection. | ||||
| 6.1 Major infection | 3 | 412 | Risk Ratio (M‐H, Random, 95% CI) | 1.08 [0.60, 1.96] |
| 6.2 Herpes zoster virus | 1 | 105 | Risk Ratio (M‐H, Random, 95% CI) | 1.27 [0.36, 4.48] |
| 7 Malignancy Show forest plot | 3 | Risk Ratio (M‐H, Random, 95% CI) | Subtotals only | |
| Analysis 26.7  Comparison 26 Maintenance: azathioprine (AZA) versus mycophenolate mofetil (MMF), Outcome 7 Malignancy. | ||||
| 7.1 At end of treatment duration or follow‐up | 3 | 370 | Risk Ratio (M‐H, Random, 95% CI) | 4.04 [0.45, 36.07] |
| 7.2 At 10 years | 1 | 87 | Risk Ratio (M‐H, Random, 95% CI) | 1.87 [0.18, 19.84] |
| 8 Leucopenia Show forest plot | 3 | 412 | Risk Ratio (M‐H, Random, 95% CI) | 5.61 [1.68, 18.72] |
| Analysis 26.8  Comparison 26 Maintenance: azathioprine (AZA) versus mycophenolate mofetil (MMF), Outcome 8 Leucopenia. | ||||
| 9 Bone toxicity Show forest plot | 1 | 105 | Risk Ratio (M‐H, Random, 95% CI) | 3.06 [0.13, 73.36] |
| Analysis 26.9 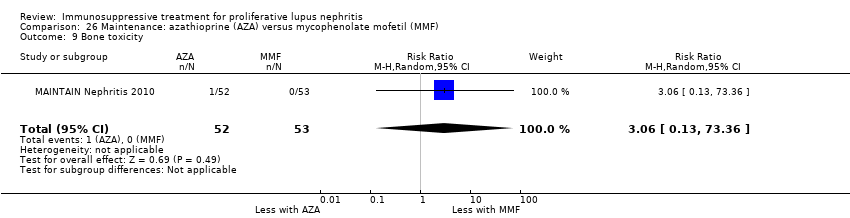 Comparison 26 Maintenance: azathioprine (AZA) versus mycophenolate mofetil (MMF), Outcome 9 Bone toxicity. | ||||
| 10 Alopecia Show forest plot | 3 | 412 | Risk Ratio (M‐H, Random, 95% CI) | 0.95 [0.46, 1.95] |
| Analysis 26.10  Comparison 26 Maintenance: azathioprine (AZA) versus mycophenolate mofetil (MMF), Outcome 10 Alopecia. | ||||
| 11 Gastrointestinal (GI) adverse events Show forest plot | 3 | Risk Ratio (M‐H, Random, 95% CI) | Subtotals only | |
| Analysis 26.11 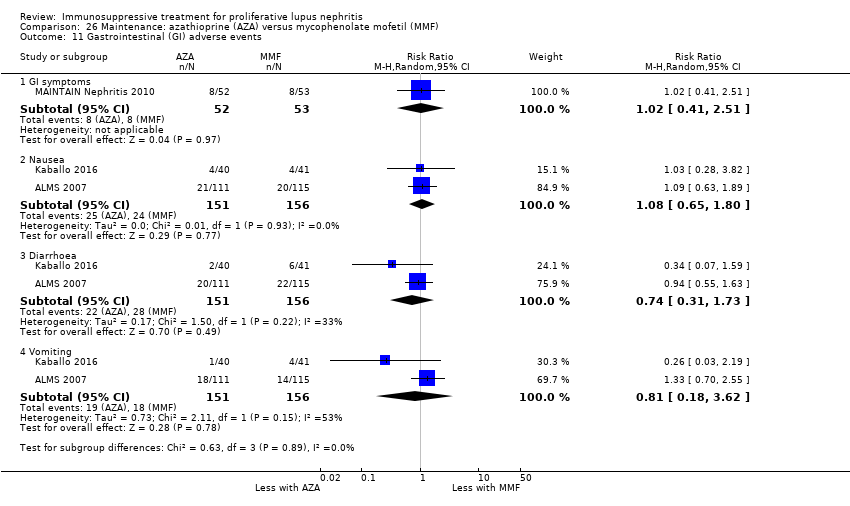 Comparison 26 Maintenance: azathioprine (AZA) versus mycophenolate mofetil (MMF), Outcome 11 Gastrointestinal (GI) adverse events. | ||||
| 11.1 GI symptoms | 1 | 105 | Risk Ratio (M‐H, Random, 95% CI) | 1.02 [0.41, 2.51] |
| 11.2 Nausea | 2 | 307 | Risk Ratio (M‐H, Random, 95% CI) | 1.08 [0.65, 1.80] |
| 11.3 Diarrhoea | 2 | 307 | Risk Ratio (M‐H, Random, 95% CI) | 0.74 [0.31, 1.73] |
| 11.4 Vomiting | 2 | 307 | Risk Ratio (M‐H, Random, 95% CI) | 0.81 [0.18, 3.62] |
| 12 Daily proteinuria Show forest plot | 1 | 81 | Mean Difference (IV, Random, 95% CI) | 0.40 [‐0.53, 1.33] |
| Analysis 26.12  Comparison 26 Maintenance: azathioprine (AZA) versus mycophenolate mofetil (MMF), Outcome 12 Daily proteinuria. | ||||
| Outcome or subgroup title | No. of studies | No. of participants | Statistical method | Effect size |
| 1 Death Show forest plot | 1 | 69 | Risk Ratio (M‐H, Random, 95% CI) | 0.0 [0.0, 0.0] |
| Analysis 27.1 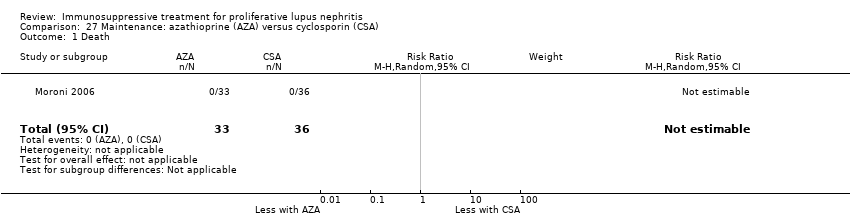 Comparison 27 Maintenance: azathioprine (AZA) versus cyclosporin (CSA), Outcome 1 Death. | ||||
| 2 Adverse renal outcomes Show forest plot | 1 | Risk Ratio (M‐H, Random, 95% CI) | Subtotals only | |
| Analysis 27.2  Comparison 27 Maintenance: azathioprine (AZA) versus cyclosporin (CSA), Outcome 2 Adverse renal outcomes. | ||||
| 2.1 ESKD | 1 | 69 | Risk Ratio (M‐H, Random, 95% CI) | 0.0 [0.0, 0.0] |
| 2.2 Renal relapse | 1 | 69 | Risk Ratio (M‐H, Random, 95% CI) | 1.25 [0.51, 3.06] |
| 3 Infection Show forest plot | 1 | Risk Ratio (M‐H, Random, 95% CI) | Subtotals only | |
| Analysis 27.3 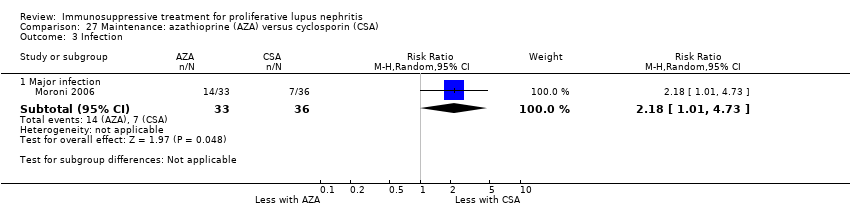 Comparison 27 Maintenance: azathioprine (AZA) versus cyclosporin (CSA), Outcome 3 Infection. | ||||
| 3.1 Major infection | 1 | 69 | Risk Ratio (M‐H, Random, 95% CI) | 2.18 [1.01, 4.73] |
| 4 Leucopenia Show forest plot | 1 | 69 | Risk Ratio (M‐H, Random, 95% CI) | 2.73 [0.95, 7.86] |
| Analysis 27.4  Comparison 27 Maintenance: azathioprine (AZA) versus cyclosporin (CSA), Outcome 4 Leucopenia. | ||||
| 5 Gastrointestinal (GI) adverse events Show forest plot | 1 | Risk Ratio (M‐H, Random, 95% CI) | Subtotals only | |
| Analysis 27.5  Comparison 27 Maintenance: azathioprine (AZA) versus cyclosporin (CSA), Outcome 5 Gastrointestinal (GI) adverse events. | ||||
| 5.1 GI disturbance | 1 | 69 | Risk Ratio (M‐H, Random, 95% CI) | 0.30 [0.09, 0.97] |
| 6 Daily proteinuria Show forest plot | 1 | 69 | Mean Difference (IV, Random, 95% CI) | 0.15 [‐0.23, 0.53] |
| Analysis 27.6 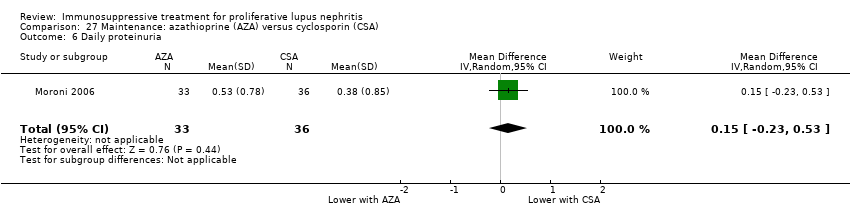 Comparison 27 Maintenance: azathioprine (AZA) versus cyclosporin (CSA), Outcome 6 Daily proteinuria. | ||||
| 7 Disease activity (SLEDAI) Show forest plot | 1 | 69 | Mean Difference (IV, Random, 95% CI) | ‐3.20 [‐5.77, ‐0.63] |
| Analysis 27.7  Comparison 27 Maintenance: azathioprine (AZA) versus cyclosporin (CSA), Outcome 7 Disease activity (SLEDAI). | ||||
| Outcome or subgroup title | No. of studies | No. of participants | Statistical method | Effect size |
| 1 Death Show forest plot | 1 | 39 | Risk Ratio (M‐H, Random, 95% CI) | 0.12 [0.01, 2.03] |
| Analysis 28.1  Comparison 28 Maintenance: azathioprine (AZA) versus cyclophosphamide (CPA), Outcome 1 Death. | ||||
| 2 Adverse renal outcomes Show forest plot | 1 | Risk Ratio (M‐H, Random, 95% CI) | Subtotals only | |
| Analysis 28.2  Comparison 28 Maintenance: azathioprine (AZA) versus cyclophosphamide (CPA), Outcome 2 Adverse renal outcomes. | ||||
| 2.1 ESKD | 1 | 39 | Risk Ratio (M‐H, Random, 95% CI) | 0.35 [0.04, 3.09] |
| 2.2 Renal relapse | 1 | 39 | Risk Ratio (M‐H, Random, 95% CI) | 0.79 [0.34, 1.85] |
| 2.3 Doubling of serum creatinine | 1 | 39 | Risk Ratio (M‐H, Random, 95% CI) | 0.79 [0.34, 1.85] |
| 3 Bladder toxicity Show forest plot | 1 | 39 | Risk Ratio (M‐H, Random, 95% CI) | 0.0 [0.0, 0.0] |
| Analysis 28.3 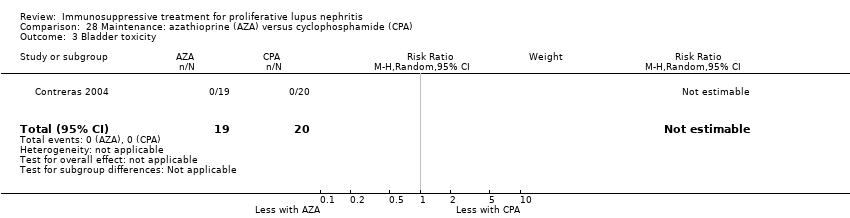 Comparison 28 Maintenance: azathioprine (AZA) versus cyclophosphamide (CPA), Outcome 3 Bladder toxicity. | ||||
| 4 Creatinine clearance Show forest plot | 1 | 38 | Mean Difference (IV, Random, 95% CI) | ‐15.70 [‐23.71, ‐7.69] |
| Analysis 28.4 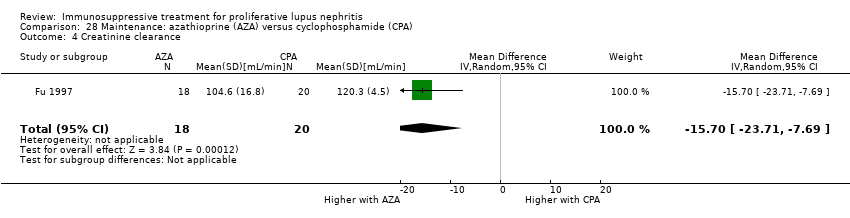 Comparison 28 Maintenance: azathioprine (AZA) versus cyclophosphamide (CPA), Outcome 4 Creatinine clearance. | ||||
| Outcome or subgroup title | No. of studies | No. of participants | Statistical method | Effect size |
| 1 Adverse renal outcomes Show forest plot | 1 | Risk Ratio (M‐H, Random, 95% CI) | Subtotals only | |
| Analysis 29.1 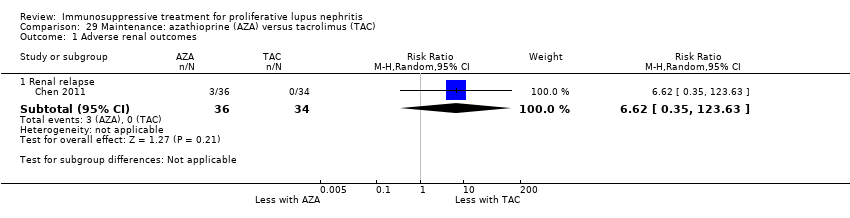 Comparison 29 Maintenance: azathioprine (AZA) versus tacrolimus (TAC), Outcome 1 Adverse renal outcomes. | ||||
| 1.1 Renal relapse | 1 | 70 | Risk Ratio (M‐H, Random, 95% CI) | 6.62 [0.35, 123.63] |
| 2 Infection Show forest plot | 1 | Risk Ratio (M‐H, Random, 95% CI) | Subtotals only | |
| Analysis 29.2  Comparison 29 Maintenance: azathioprine (AZA) versus tacrolimus (TAC), Outcome 2 Infection. | ||||
| 2.1 Major infection | 1 | 70 | Risk Ratio (M‐H, Random, 95% CI) | 1.26 [0.30, 5.22] |
| 3 Gastrointestinal (GI) adverse events Show forest plot | 1 | Risk Ratio (M‐H, Random, 95% CI) | Subtotals only | |
| Analysis 29.3 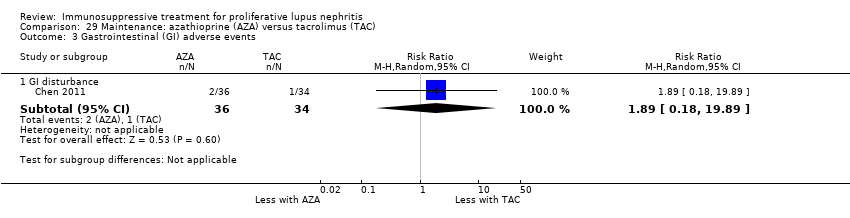 Comparison 29 Maintenance: azathioprine (AZA) versus tacrolimus (TAC), Outcome 3 Gastrointestinal (GI) adverse events. | ||||
| 3.1 GI disturbance | 1 | 70 | Risk Ratio (M‐H, Random, 95% CI) | 1.89 [0.18, 19.89] |
| Outcome or subgroup title | No. of studies | No. of participants | Statistical method | Effect size |
| 1 Relapse Show forest plot | 1 | Risk Ratio (M‐H, Random, 95% CI) | Subtotals only | |
| Analysis 30.1  Comparison 30 Maintenance: prednisone withdrawal versus prednisone continuation, Outcome 1 Relapse. | ||||
| 1.1 Renal relapse | 1 | 15 | Risk Ratio (M‐H, Random, 95% CI) | 0.38 [0.05, 2.88] |
| 1.2 Non‐renal relapse | 1 | 15 | Risk Ratio (M‐H, Random, 95% CI) | 0.38 [0.02, 7.96] |
| 2 Major infection Show forest plot | 1 | 15 | Risk Ratio (M‐H, Random, 95% CI) | 0.57 [0.06, 5.03] |
| Analysis 30.2  Comparison 30 Maintenance: prednisone withdrawal versus prednisone continuation, Outcome 2 Major infection. | ||||
| Outcome or subgroup title | No. of studies | No. of participants | Statistical method | Effect size |
| 1 Creatinine clearance Show forest plot | 1 | 13 | Mean Difference (IV, Random, 95% CI) | 2.20 [‐37.85, 42.25] |
| Analysis 31.1  Comparison 31 Maintenance: intravenous immunoglobulin (IVIG) versus intravenous cyclophosphamide (IV CPA), Outcome 1 Creatinine clearance. | ||||
| 2 Daily proteinuria Show forest plot | 1 | 13 | Mean Difference (IV, Random, 95% CI) | ‐0.08 [‐0.95, 0.79] |
| Analysis 31.2  Comparison 31 Maintenance: intravenous immunoglobulin (IVIG) versus intravenous cyclophosphamide (IV CPA), Outcome 2 Daily proteinuria. | ||||
| 3 Serum creatinine Show forest plot | 1 | 14 | Mean Difference (IV, Random, 95% CI) | ‐35.40 [‐128.90, 58.10] |
| Analysis 31.3 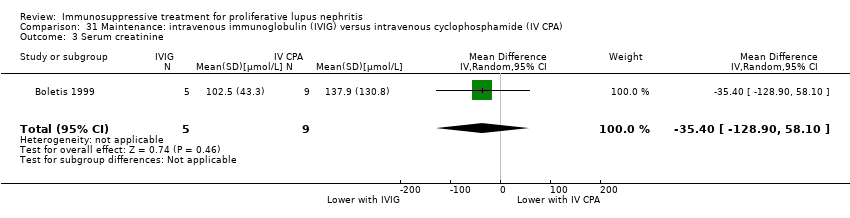 Comparison 31 Maintenance: intravenous immunoglobulin (IVIG) versus intravenous cyclophosphamide (IV CPA), Outcome 3 Serum creatinine. | ||||

Study flow diagram.
*Non‐RCTs have been deleted from this update
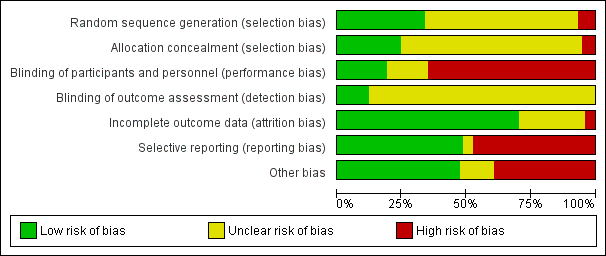
Risk of bias graph: review authors' judgements about each risk of bias item presented as percentages across all included studies.

Comparison 1 Mycophenolate mofetil (MMF) versus IV cyclophosphamide (CPA), Outcome 1 Death.

Comparison 1 Mycophenolate mofetil (MMF) versus IV cyclophosphamide (CPA), Outcome 2 Remission.

Comparison 1 Mycophenolate mofetil (MMF) versus IV cyclophosphamide (CPA), Outcome 3 Adverse renal outcomes.
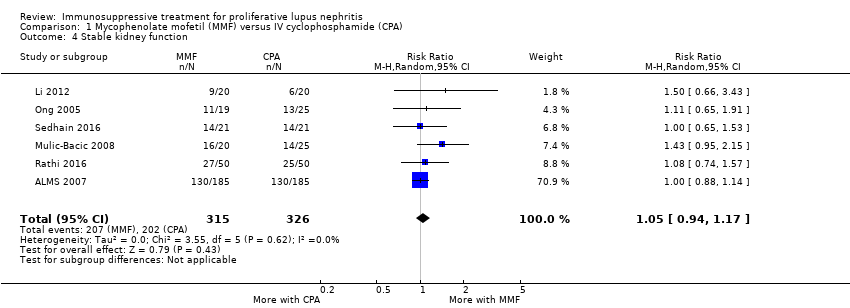
Comparison 1 Mycophenolate mofetil (MMF) versus IV cyclophosphamide (CPA), Outcome 4 Stable kidney function.
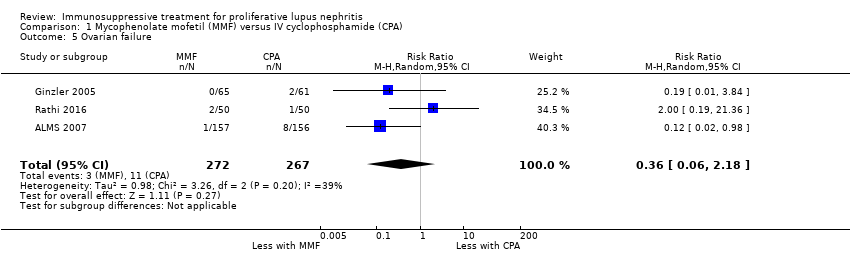
Comparison 1 Mycophenolate mofetil (MMF) versus IV cyclophosphamide (CPA), Outcome 5 Ovarian failure.
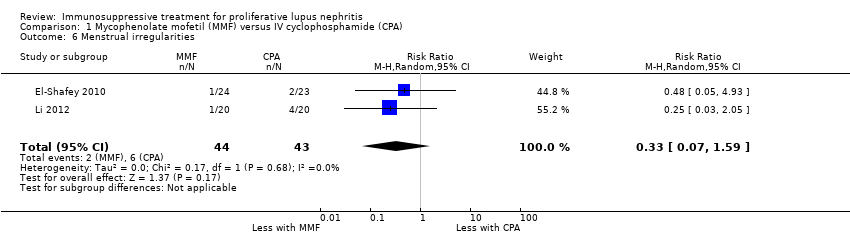
Comparison 1 Mycophenolate mofetil (MMF) versus IV cyclophosphamide (CPA), Outcome 6 Menstrual irregularities.

Comparison 1 Mycophenolate mofetil (MMF) versus IV cyclophosphamide (CPA), Outcome 7 Infection.

Comparison 1 Mycophenolate mofetil (MMF) versus IV cyclophosphamide (CPA), Outcome 8 Malignancy.

Comparison 1 Mycophenolate mofetil (MMF) versus IV cyclophosphamide (CPA), Outcome 9 Leucopenia.

Comparison 1 Mycophenolate mofetil (MMF) versus IV cyclophosphamide (CPA), Outcome 10 Bladder toxicity.
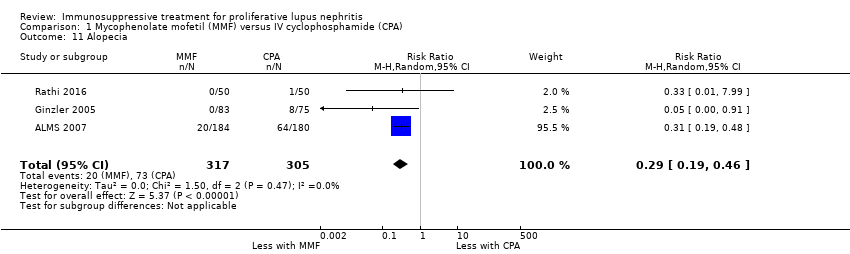
Comparison 1 Mycophenolate mofetil (MMF) versus IV cyclophosphamide (CPA), Outcome 11 Alopecia.

Comparison 1 Mycophenolate mofetil (MMF) versus IV cyclophosphamide (CPA), Outcome 12 Gastrointestinal (GI) adverse events.
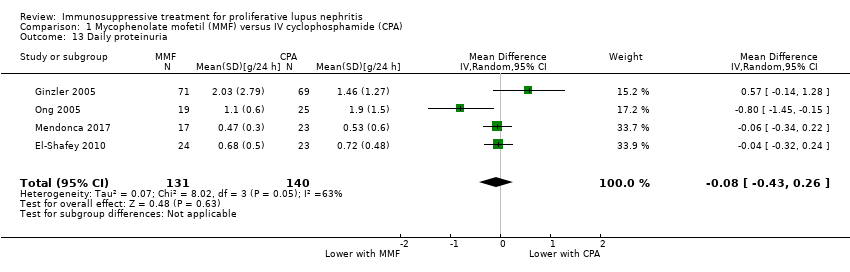
Comparison 1 Mycophenolate mofetil (MMF) versus IV cyclophosphamide (CPA), Outcome 13 Daily proteinuria.

Comparison 1 Mycophenolate mofetil (MMF) versus IV cyclophosphamide (CPA), Outcome 14 Serum creatinine.
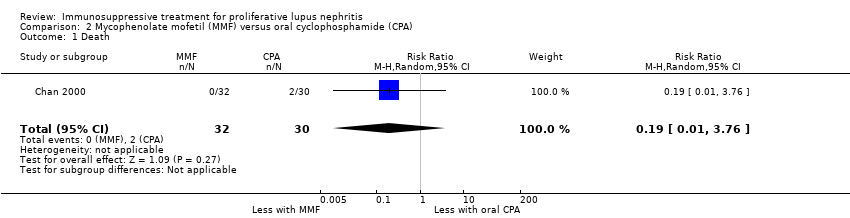
Comparison 2 Mycophenolate mofetil (MMF) versus oral cyclophosphamide (CPA), Outcome 1 Death.

Comparison 2 Mycophenolate mofetil (MMF) versus oral cyclophosphamide (CPA), Outcome 2 Remission.

Comparison 2 Mycophenolate mofetil (MMF) versus oral cyclophosphamide (CPA), Outcome 3 Adverse renal outcomes.
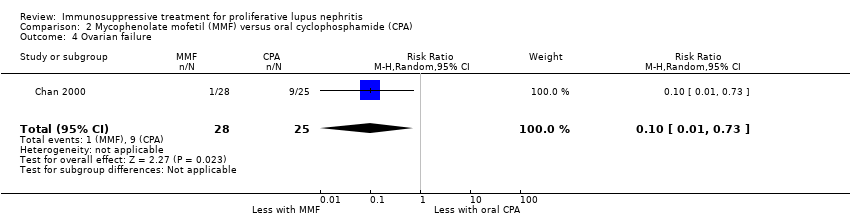
Comparison 2 Mycophenolate mofetil (MMF) versus oral cyclophosphamide (CPA), Outcome 4 Ovarian failure.
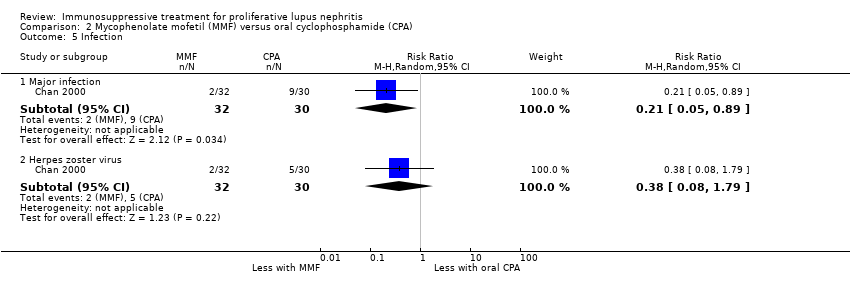
Comparison 2 Mycophenolate mofetil (MMF) versus oral cyclophosphamide (CPA), Outcome 5 Infection.

Comparison 2 Mycophenolate mofetil (MMF) versus oral cyclophosphamide (CPA), Outcome 6 Leucopenia.
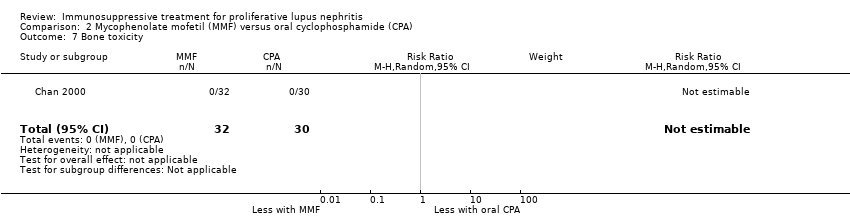
Comparison 2 Mycophenolate mofetil (MMF) versus oral cyclophosphamide (CPA), Outcome 7 Bone toxicity.

Comparison 2 Mycophenolate mofetil (MMF) versus oral cyclophosphamide (CPA), Outcome 8 Alopecia.

Comparison 2 Mycophenolate mofetil (MMF) versus oral cyclophosphamide (CPA), Outcome 9 Gastrointestinal (GI) adverse events.

Comparison 2 Mycophenolate mofetil (MMF) versus oral cyclophosphamide (CPA), Outcome 10 Daily proteinuria.

Comparison 3 Mycophenolate mofetil (MMF) + tacrolimus (TAC) versus IV cyclophosphamide (CPA), Outcome 1 Death.

Comparison 3 Mycophenolate mofetil (MMF) + tacrolimus (TAC) versus IV cyclophosphamide (CPA), Outcome 2 Remission.
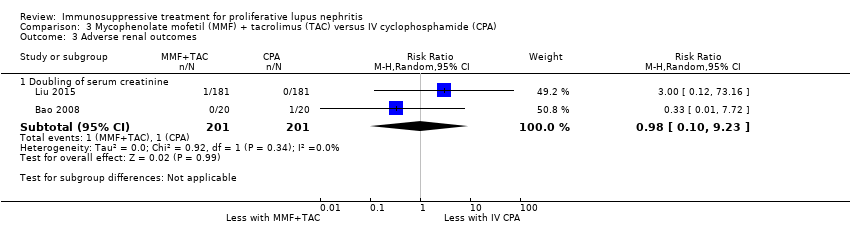
Comparison 3 Mycophenolate mofetil (MMF) + tacrolimus (TAC) versus IV cyclophosphamide (CPA), Outcome 3 Adverse renal outcomes.

Comparison 3 Mycophenolate mofetil (MMF) + tacrolimus (TAC) versus IV cyclophosphamide (CPA), Outcome 4 Stable kidney function.
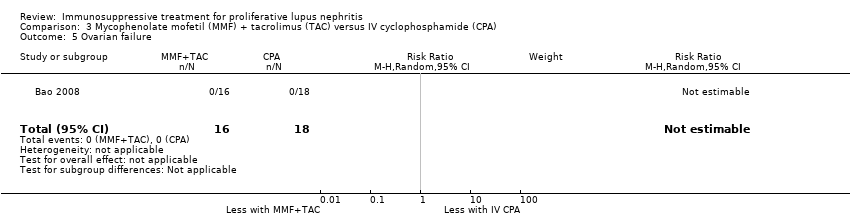
Comparison 3 Mycophenolate mofetil (MMF) + tacrolimus (TAC) versus IV cyclophosphamide (CPA), Outcome 5 Ovarian failure.

Comparison 3 Mycophenolate mofetil (MMF) + tacrolimus (TAC) versus IV cyclophosphamide (CPA), Outcome 6 Menstrual irregularities.

Comparison 3 Mycophenolate mofetil (MMF) + tacrolimus (TAC) versus IV cyclophosphamide (CPA), Outcome 7 Infection.

Comparison 3 Mycophenolate mofetil (MMF) + tacrolimus (TAC) versus IV cyclophosphamide (CPA), Outcome 8 Leucopenia.

Comparison 3 Mycophenolate mofetil (MMF) + tacrolimus (TAC) versus IV cyclophosphamide (CPA), Outcome 9 Bone toxicity.

Comparison 3 Mycophenolate mofetil (MMF) + tacrolimus (TAC) versus IV cyclophosphamide (CPA), Outcome 10 Alopecia.

Comparison 3 Mycophenolate mofetil (MMF) + tacrolimus (TAC) versus IV cyclophosphamide (CPA), Outcome 11 Gastrointestinal (GI) adverse events.

Comparison 3 Mycophenolate mofetil (MMF) + tacrolimus (TAC) versus IV cyclophosphamide (CPA), Outcome 12 Daily proteinuria.

Comparison 4 Mycophenolate mofetil (MMF) + IV cyclophosphamide (CPA) versus IV CPA, Outcome 1 Death.
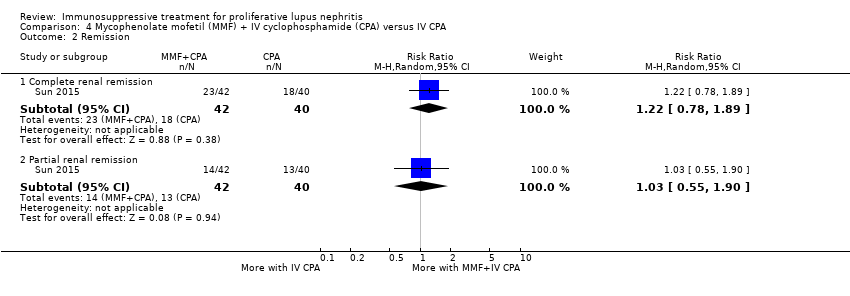
Comparison 4 Mycophenolate mofetil (MMF) + IV cyclophosphamide (CPA) versus IV CPA, Outcome 2 Remission.

Comparison 4 Mycophenolate mofetil (MMF) + IV cyclophosphamide (CPA) versus IV CPA, Outcome 3 Menstrual irregularities.

Comparison 4 Mycophenolate mofetil (MMF) + IV cyclophosphamide (CPA) versus IV CPA, Outcome 4 Infection.

Comparison 4 Mycophenolate mofetil (MMF) + IV cyclophosphamide (CPA) versus IV CPA, Outcome 5 Leucopenia.

Comparison 4 Mycophenolate mofetil (MMF) + IV cyclophosphamide (CPA) versus IV CPA, Outcome 6 Daily proteinuria.
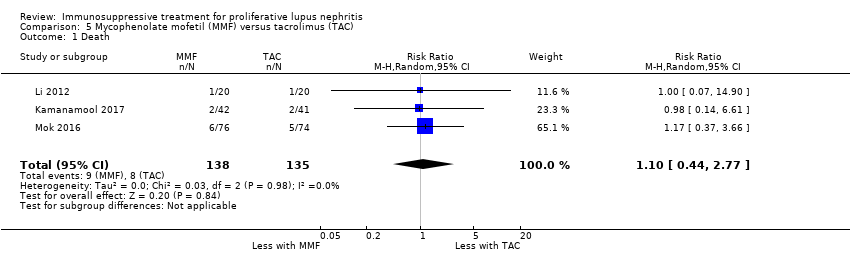
Comparison 5 Mycophenolate mofetil (MMF) versus tacrolimus (TAC), Outcome 1 Death.

Comparison 5 Mycophenolate mofetil (MMF) versus tacrolimus (TAC), Outcome 2 Remission.

Comparison 5 Mycophenolate mofetil (MMF) versus tacrolimus (TAC), Outcome 3 Adverse renal outcomes.
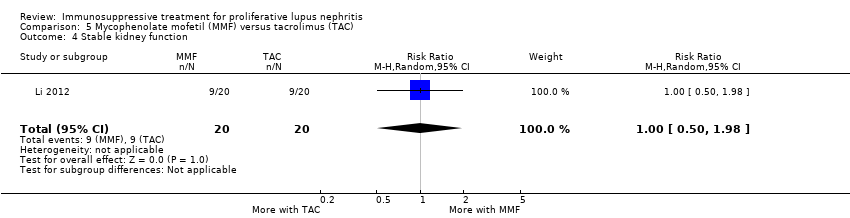
Comparison 5 Mycophenolate mofetil (MMF) versus tacrolimus (TAC), Outcome 4 Stable kidney function.

Comparison 5 Mycophenolate mofetil (MMF) versus tacrolimus (TAC), Outcome 5 Menstrual irregularities.

Comparison 5 Mycophenolate mofetil (MMF) versus tacrolimus (TAC), Outcome 6 Infection.
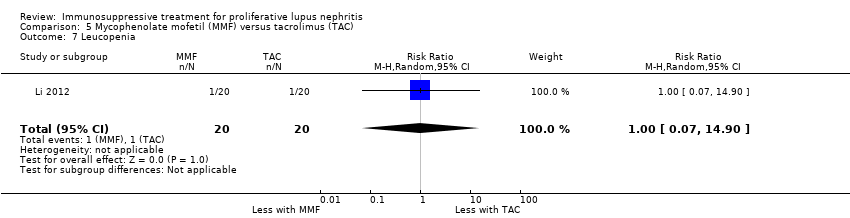
Comparison 5 Mycophenolate mofetil (MMF) versus tacrolimus (TAC), Outcome 7 Leucopenia.

Comparison 5 Mycophenolate mofetil (MMF) versus tacrolimus (TAC), Outcome 8 Alopecia.

Comparison 5 Mycophenolate mofetil (MMF) versus tacrolimus (TAC), Outcome 9 Daily proteinuria (at 24 weeks).

Comparison 5 Mycophenolate mofetil (MMF) versus tacrolimus (TAC), Outcome 10 Disease activity.

Comparison 5 Mycophenolate mofetil (MMF) versus tacrolimus (TAC), Outcome 11 Serum creatinine.

Comparison 5 Mycophenolate mofetil (MMF) versus tacrolimus (TAC), Outcome 12 Creatinine clearance.

Comparison 6 Calcineurin inhibitors (CNI) versus IV cyclophosphamide (CPA), Outcome 1 Death.

Comparison 6 Calcineurin inhibitors (CNI) versus IV cyclophosphamide (CPA), Outcome 2 Remission.

Comparison 6 Calcineurin inhibitors (CNI) versus IV cyclophosphamide (CPA), Outcome 3 Adverse renal outcomes.
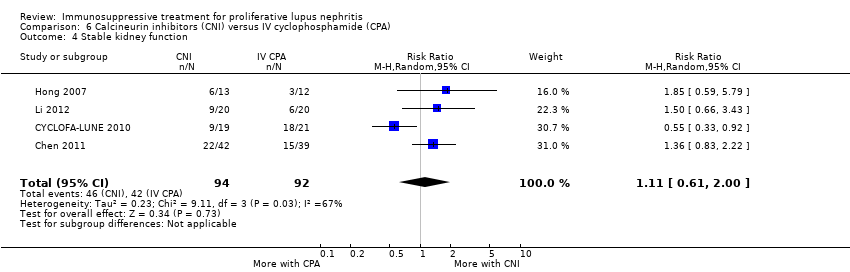
Comparison 6 Calcineurin inhibitors (CNI) versus IV cyclophosphamide (CPA), Outcome 4 Stable kidney function.

Comparison 6 Calcineurin inhibitors (CNI) versus IV cyclophosphamide (CPA), Outcome 5 Ovarian failure.
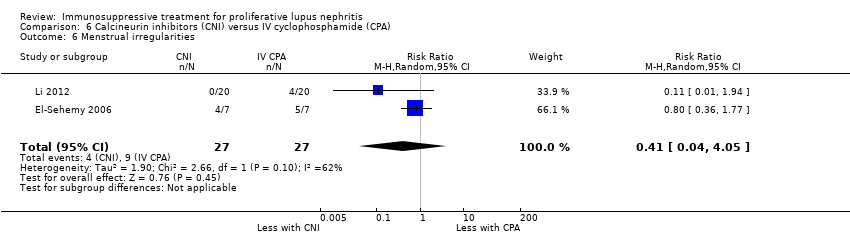
Comparison 6 Calcineurin inhibitors (CNI) versus IV cyclophosphamide (CPA), Outcome 6 Menstrual irregularities.
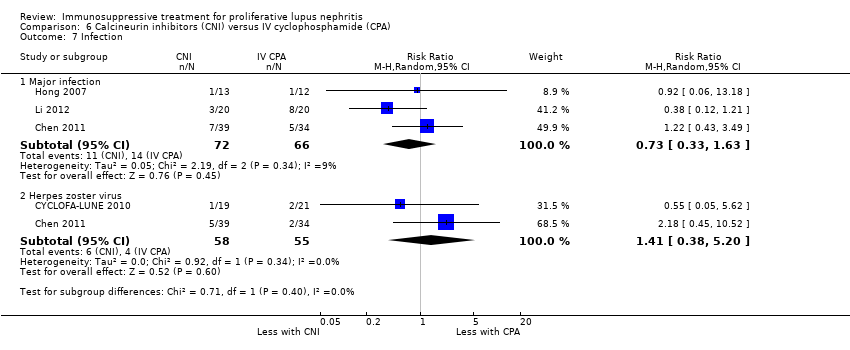
Comparison 6 Calcineurin inhibitors (CNI) versus IV cyclophosphamide (CPA), Outcome 7 Infection.
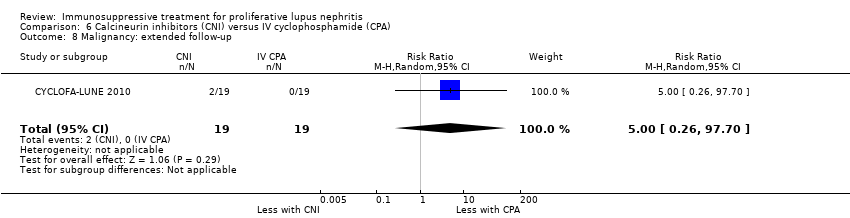
Comparison 6 Calcineurin inhibitors (CNI) versus IV cyclophosphamide (CPA), Outcome 8 Malignancy: extended follow‐up.
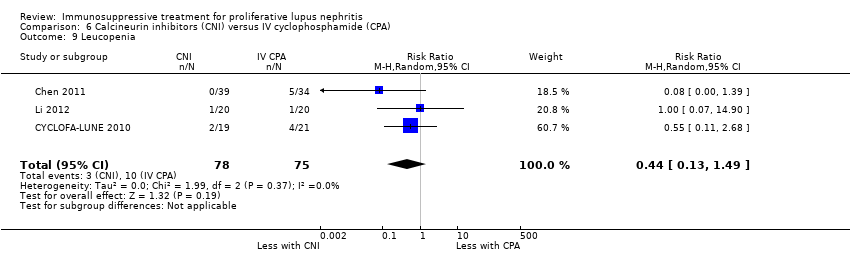
Comparison 6 Calcineurin inhibitors (CNI) versus IV cyclophosphamide (CPA), Outcome 9 Leucopenia.

Comparison 6 Calcineurin inhibitors (CNI) versus IV cyclophosphamide (CPA), Outcome 10 Alopecia.

Comparison 6 Calcineurin inhibitors (CNI) versus IV cyclophosphamide (CPA), Outcome 11 Gastrointestinal (GI) adverse events.
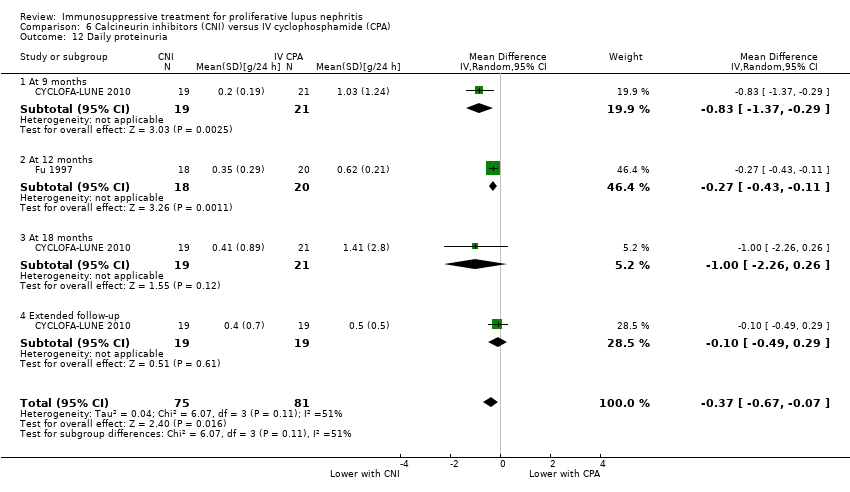
Comparison 6 Calcineurin inhibitors (CNI) versus IV cyclophosphamide (CPA), Outcome 12 Daily proteinuria.

Comparison 6 Calcineurin inhibitors (CNI) versus IV cyclophosphamide (CPA), Outcome 13 Creatinine clearance.

Comparison 6 Calcineurin inhibitors (CNI) versus IV cyclophosphamide (CPA), Outcome 14 Serum creatinine.

Comparison 7 Cyclophosphamide (CPA) versus azathioprine (AZA), Outcome 1 Death.

Comparison 7 Cyclophosphamide (CPA) versus azathioprine (AZA), Outcome 2 Remission in proteinuria.
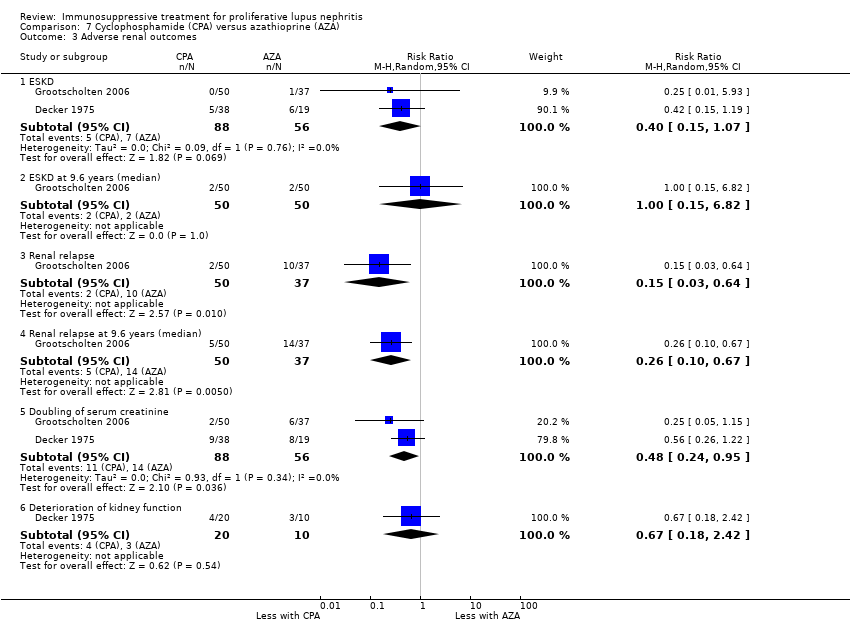
Comparison 7 Cyclophosphamide (CPA) versus azathioprine (AZA), Outcome 3 Adverse renal outcomes.

Comparison 7 Cyclophosphamide (CPA) versus azathioprine (AZA), Outcome 4 Stable kidney function.

Comparison 7 Cyclophosphamide (CPA) versus azathioprine (AZA), Outcome 5 Ovarian failure.

Comparison 7 Cyclophosphamide (CPA) versus azathioprine (AZA), Outcome 6 Menstrual irregularities.

Comparison 7 Cyclophosphamide (CPA) versus azathioprine (AZA), Outcome 7 Infection.

Comparison 7 Cyclophosphamide (CPA) versus azathioprine (AZA), Outcome 8 Malignancy.

Comparison 7 Cyclophosphamide (CPA) versus azathioprine (AZA), Outcome 9 Bone toxicity.

Comparison 7 Cyclophosphamide (CPA) versus azathioprine (AZA), Outcome 10 Bladder toxicity.

Comparison 8 Rituximab (RTX) + mycophenolate mofetil (MMF) versus placebo + MMF, Outcome 1 Death.
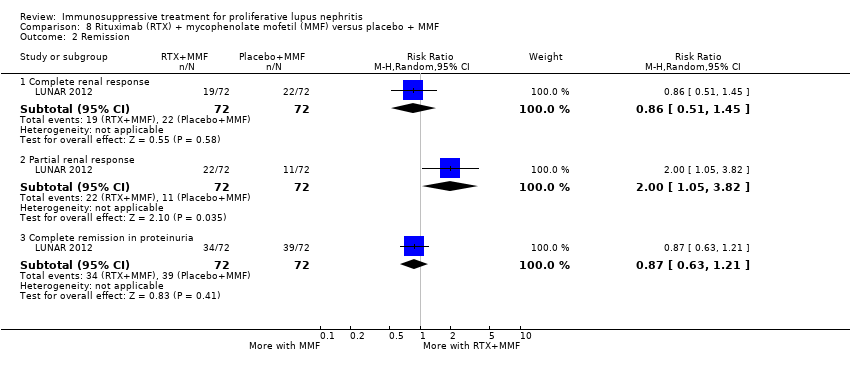
Comparison 8 Rituximab (RTX) + mycophenolate mofetil (MMF) versus placebo + MMF, Outcome 2 Remission.
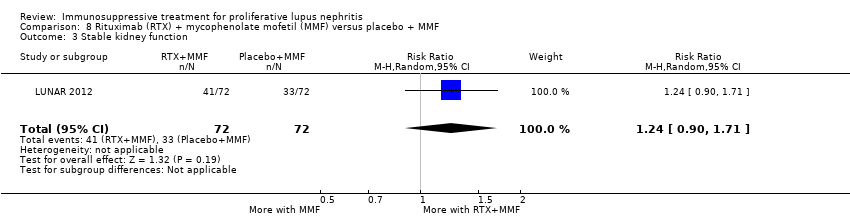
Comparison 8 Rituximab (RTX) + mycophenolate mofetil (MMF) versus placebo + MMF, Outcome 3 Stable kidney function.

Comparison 8 Rituximab (RTX) + mycophenolate mofetil (MMF) versus placebo + MMF, Outcome 4 Infection.

Comparison 8 Rituximab (RTX) + mycophenolate mofetil (MMF) versus placebo + MMF, Outcome 5 Leucopenia.

Comparison 9 Rituximab (RTX) + cyclophosphamide (CPA) versus RTX, Outcome 1 Remission.

Comparison 9 Rituximab (RTX) + cyclophosphamide (CPA) versus RTX, Outcome 2 Infection.

Comparison 9 Rituximab (RTX) + cyclophosphamide (CPA) versus RTX, Outcome 3 Daily proteinuria.
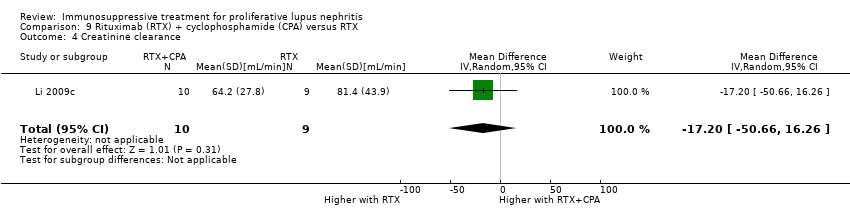
Comparison 9 Rituximab (RTX) + cyclophosphamide (CPA) versus RTX, Outcome 4 Creatinine clearance.

Comparison 9 Rituximab (RTX) + cyclophosphamide (CPA) versus RTX, Outcome 5 Serum creatinine.

Comparison 10 Abatacept + other immunosuppressive agent (IS) + versus placebo + other IS, Outcome 1 Death.

Comparison 10 Abatacept + other immunosuppressive agent (IS) + versus placebo + other IS, Outcome 2 Remission.

Comparison 10 Abatacept + other immunosuppressive agent (IS) + versus placebo + other IS, Outcome 3 Adverse renal outcomes.

Comparison 10 Abatacept + other immunosuppressive agent (IS) + versus placebo + other IS, Outcome 4 Major Infection.
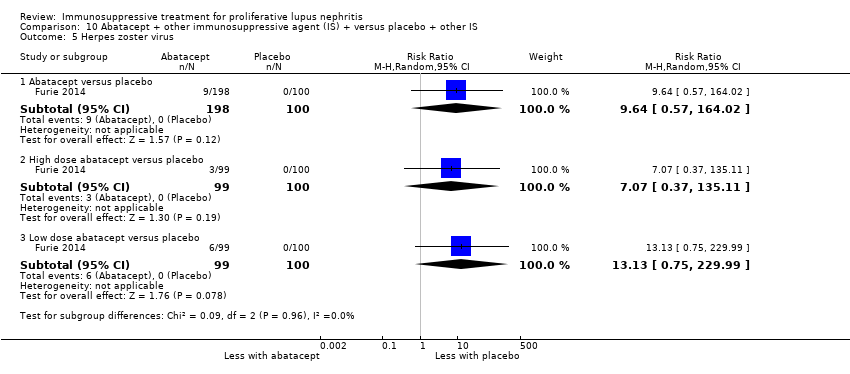
Comparison 10 Abatacept + other immunosuppressive agent (IS) + versus placebo + other IS, Outcome 5 Herpes zoster virus.

Comparison 10 Abatacept + other immunosuppressive agent (IS) + versus placebo + other IS, Outcome 6 Health‐related quality of life.

Comparison 10 Abatacept + other immunosuppressive agent (IS) + versus placebo + other IS, Outcome 7 Disease activity (BILAG).

Comparison 11 Laquinimod + other immunosuppressive agent (IS) versus placebo + other IS, Outcome 1 Death.

Comparison 11 Laquinimod + other immunosuppressive agent (IS) versus placebo + other IS, Outcome 2 Complete remission.

Comparison 12 Ocrelizumab + other immunosuppressive agent (IS) versus placebo + other IS, Outcome 1 Death.
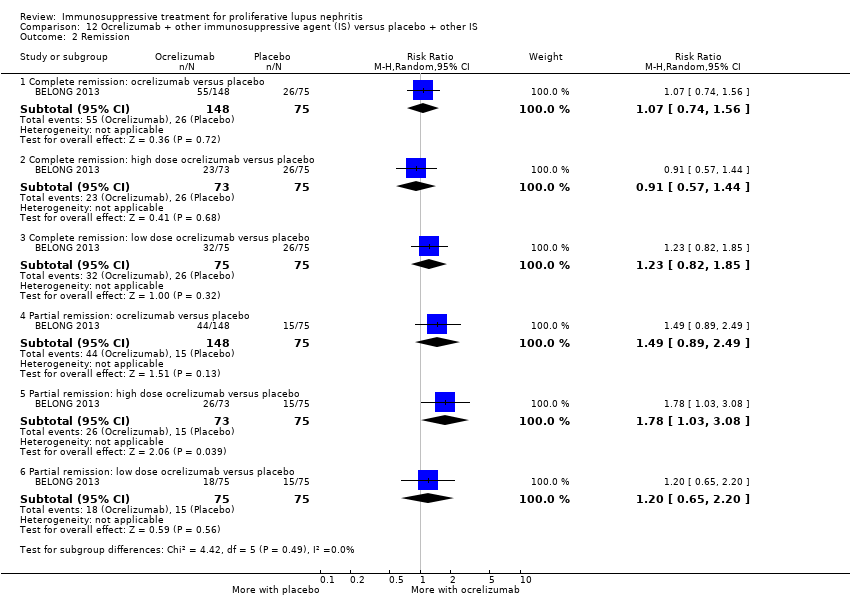
Comparison 12 Ocrelizumab + other immunosuppressive agent (IS) versus placebo + other IS, Outcome 2 Remission.
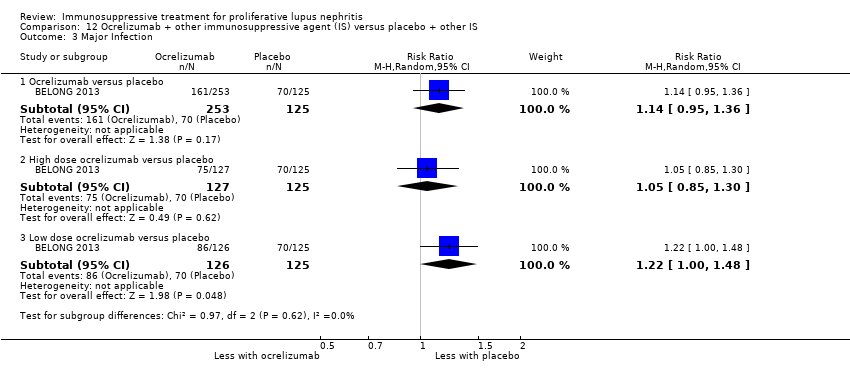
Comparison 12 Ocrelizumab + other immunosuppressive agent (IS) versus placebo + other IS, Outcome 3 Major Infection.

Comparison 13 Sirukumab + other immunosuppressive agent (IS) versus placebo + other IS, Outcome 1 Death.

Comparison 13 Sirukumab + other immunosuppressive agent (IS) versus placebo + other IS, Outcome 2 Infection.

Comparison 13 Sirukumab + other immunosuppressive agent (IS) versus placebo + other IS, Outcome 3 Malignancy.
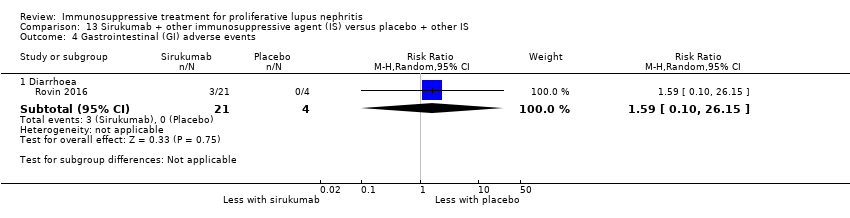
Comparison 13 Sirukumab + other immunosuppressive agent (IS) versus placebo + other IS, Outcome 4 Gastrointestinal (GI) adverse events.

Comparison 14 IV versus oral cyclophosphamide (CPA), Outcome 1 Death.
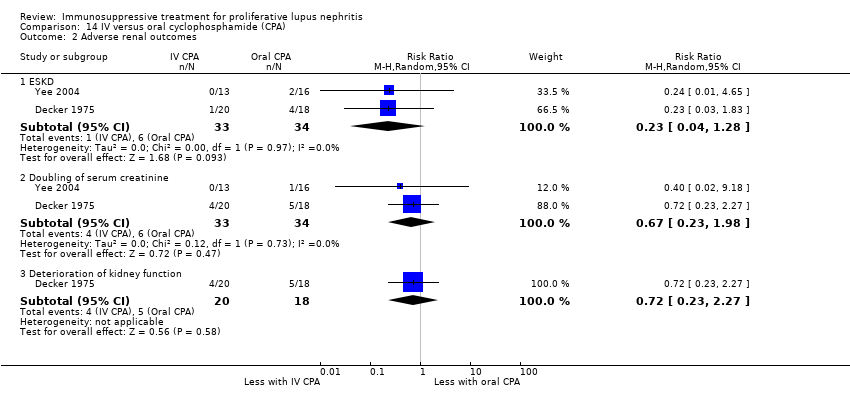
Comparison 14 IV versus oral cyclophosphamide (CPA), Outcome 2 Adverse renal outcomes.

Comparison 14 IV versus oral cyclophosphamide (CPA), Outcome 3 Stable kidney function.

Comparison 14 IV versus oral cyclophosphamide (CPA), Outcome 4 Ovarian failure.

Comparison 14 IV versus oral cyclophosphamide (CPA), Outcome 5 Infection.

Comparison 14 IV versus oral cyclophosphamide (CPA), Outcome 6 Malignancy.

Comparison 14 IV versus oral cyclophosphamide (CPA), Outcome 7 Bladder toxicity.

Comparison 14 IV versus oral cyclophosphamide (CPA), Outcome 8 Gastrointestinal (GI) adverse events.

Comparison 15 Low versus high dose cyclophosphamide (CPA), Outcome 1 Death.

Comparison 15 Low versus high dose cyclophosphamide (CPA), Outcome 2 Remission.

Comparison 15 Low versus high dose cyclophosphamide (CPA), Outcome 3 Adverse renal outcomes.
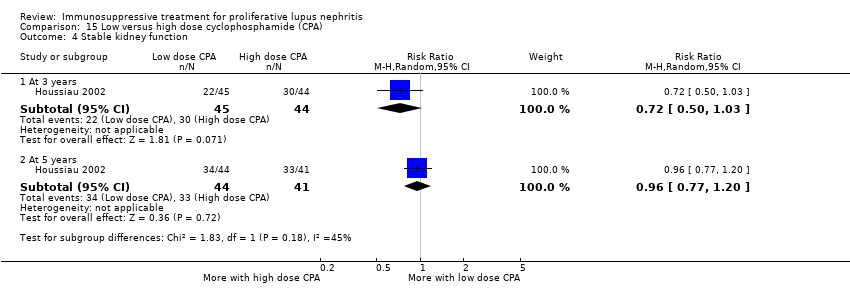
Comparison 15 Low versus high dose cyclophosphamide (CPA), Outcome 4 Stable kidney function.

Comparison 15 Low versus high dose cyclophosphamide (CPA), Outcome 5 Ovarian failure.

Comparison 15 Low versus high dose cyclophosphamide (CPA), Outcome 6 Infection.

Comparison 15 Low versus high dose cyclophosphamide (CPA), Outcome 7 Malignancy.
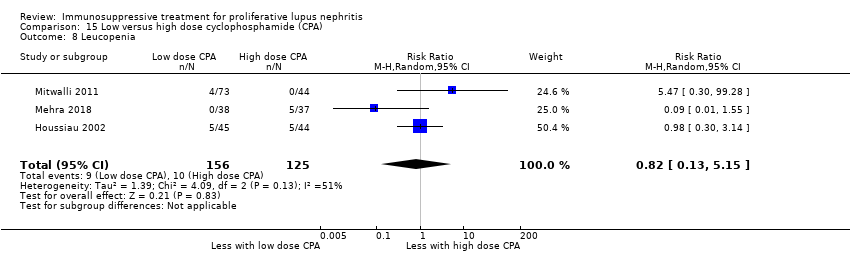
Comparison 15 Low versus high dose cyclophosphamide (CPA), Outcome 8 Leucopenia.

Comparison 15 Low versus high dose cyclophosphamide (CPA), Outcome 9 Bone toxicity.

Comparison 15 Low versus high dose cyclophosphamide (CPA), Outcome 10 Alopecia.

Comparison 15 Low versus high dose cyclophosphamide (CPA), Outcome 11 Gastrointestinal (GI) adverse events.
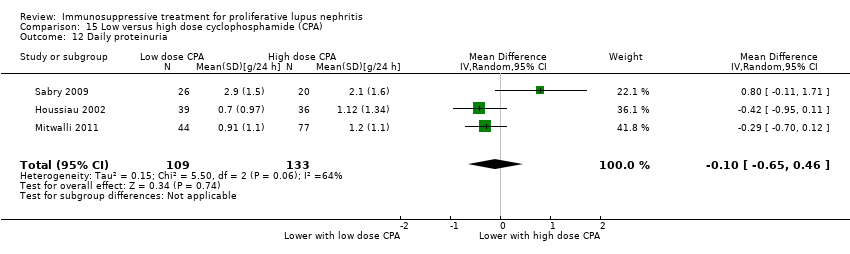
Comparison 15 Low versus high dose cyclophosphamide (CPA), Outcome 12 Daily proteinuria.

Comparison 15 Low versus high dose cyclophosphamide (CPA), Outcome 13 Creatinine clearance.

Comparison 15 Low versus high dose cyclophosphamide (CPA), Outcome 14 Serum creatinine.

Comparison 15 Low versus high dose cyclophosphamide (CPA), Outcome 15 Disease activity (SLEDAI).

Comparison 16 Standard versus reduced dose oral corticosteroids, Outcome 1 Death.

Comparison 16 Standard versus reduced dose oral corticosteroids, Outcome 2 Remission.

Comparison 16 Standard versus reduced dose oral corticosteroids, Outcome 3 Relapse.
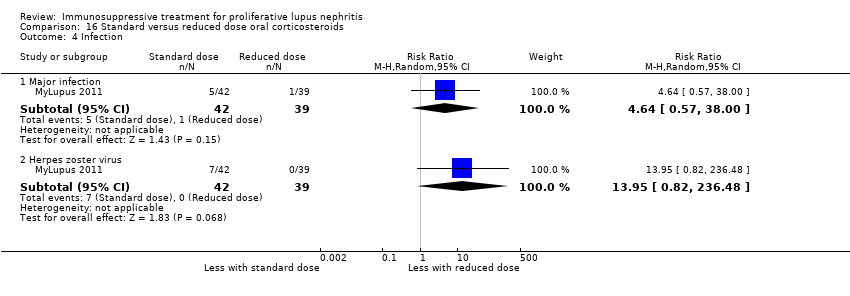
Comparison 16 Standard versus reduced dose oral corticosteroids, Outcome 4 Infection.

Comparison 16 Standard versus reduced dose oral corticosteroids, Outcome 5 Gastrointestinal (GI) adverse events.

Comparison 16 Standard versus reduced dose oral corticosteroids, Outcome 6 Creatinine clearance.

Comparison 16 Standard versus reduced dose oral corticosteroids, Outcome 7 Serum creatinine.

Comparison 17 IV versus oral corticosteroids, Outcome 1 Death.

Comparison 17 IV versus oral corticosteroids, Outcome 2 Adverse renal outcomes.

Comparison 18 Cyclophosphamide (CPA) + corticosteroids versus corticosteroids, Outcome 1 Death.

Comparison 18 Cyclophosphamide (CPA) + corticosteroids versus corticosteroids, Outcome 2 Complete remission of proteinuria.

Comparison 18 Cyclophosphamide (CPA) + corticosteroids versus corticosteroids, Outcome 3 Adverse renal outcomes.

Comparison 18 Cyclophosphamide (CPA) + corticosteroids versus corticosteroids, Outcome 4 Deterioration of kidney function.

Comparison 18 Cyclophosphamide (CPA) + corticosteroids versus corticosteroids, Outcome 5 Stable kidney function.
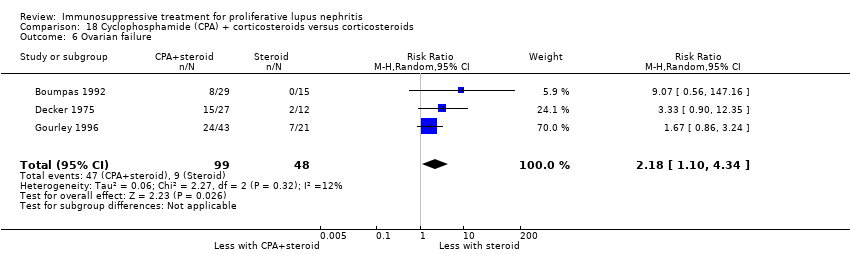
Comparison 18 Cyclophosphamide (CPA) + corticosteroids versus corticosteroids, Outcome 6 Ovarian failure.

Comparison 18 Cyclophosphamide (CPA) + corticosteroids versus corticosteroids, Outcome 7 Infection.

Comparison 18 Cyclophosphamide (CPA) + corticosteroids versus corticosteroids, Outcome 8 Malignancy.
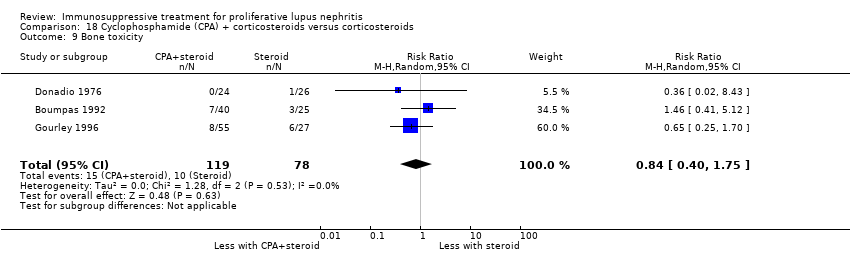
Comparison 18 Cyclophosphamide (CPA) + corticosteroids versus corticosteroids, Outcome 9 Bone toxicity.

Comparison 18 Cyclophosphamide (CPA) + corticosteroids versus corticosteroids, Outcome 10 Bladder toxicity.

Comparison 18 Cyclophosphamide (CPA) + corticosteroids versus corticosteroids, Outcome 11 Daily proteinuria.

Comparison 18 Cyclophosphamide (CPA) + corticosteroids versus corticosteroids, Outcome 12 Serum creatinine.
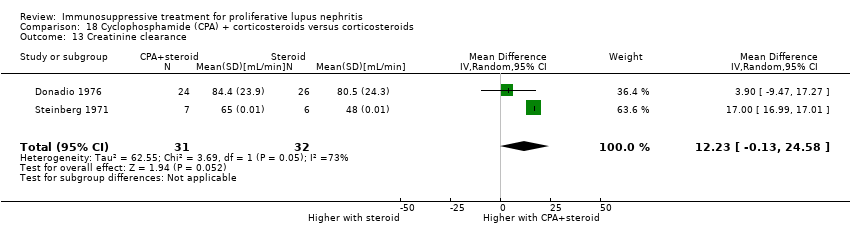
Comparison 18 Cyclophosphamide (CPA) + corticosteroids versus corticosteroids, Outcome 13 Creatinine clearance.

Comparison 19 Cyclophosphamide (CPA) + azathioprine (AZA) + corticosteroids versus corticosteroids alone, Outcome 1 Death.
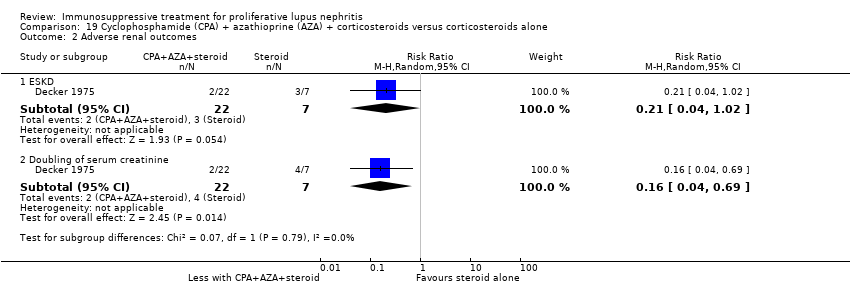
Comparison 19 Cyclophosphamide (CPA) + azathioprine (AZA) + corticosteroids versus corticosteroids alone, Outcome 2 Adverse renal outcomes.

Comparison 19 Cyclophosphamide (CPA) + azathioprine (AZA) + corticosteroids versus corticosteroids alone, Outcome 3 Stable kidney function.
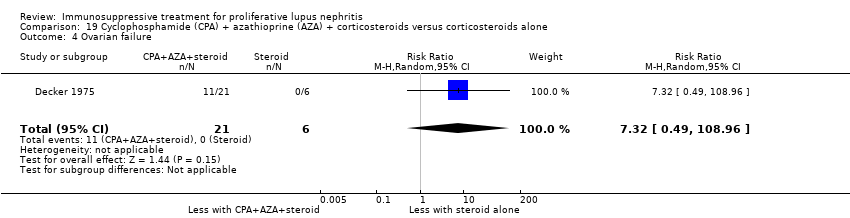
Comparison 19 Cyclophosphamide (CPA) + azathioprine (AZA) + corticosteroids versus corticosteroids alone, Outcome 4 Ovarian failure.

Comparison 19 Cyclophosphamide (CPA) + azathioprine (AZA) + corticosteroids versus corticosteroids alone, Outcome 5 Infection.

Comparison 19 Cyclophosphamide (CPA) + azathioprine (AZA) + corticosteroids versus corticosteroids alone, Outcome 6 Bladder toxicity.

Comparison 20 Azathioprine (AZA) + corticosteroids versus corticosteroids alone, Outcome 1 Death.

Comparison 20 Azathioprine (AZA) + corticosteroids versus corticosteroids alone, Outcome 2 Complete remission of proteinuria.
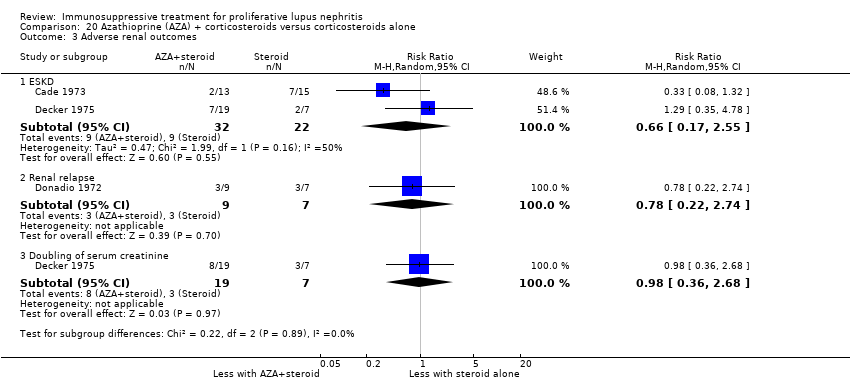
Comparison 20 Azathioprine (AZA) + corticosteroids versus corticosteroids alone, Outcome 3 Adverse renal outcomes.

Comparison 20 Azathioprine (AZA) + corticosteroids versus corticosteroids alone, Outcome 4 Stable kidney function.
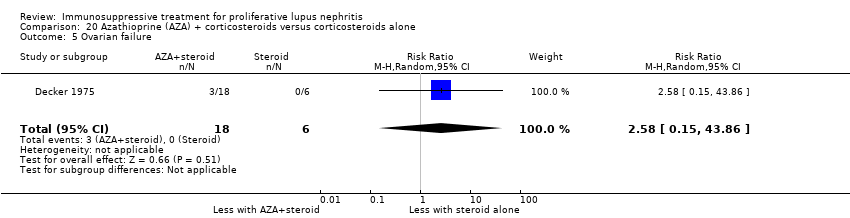
Comparison 20 Azathioprine (AZA) + corticosteroids versus corticosteroids alone, Outcome 5 Ovarian failure.

Comparison 20 Azathioprine (AZA) + corticosteroids versus corticosteroids alone, Outcome 6 Infection.

Comparison 20 Azathioprine (AZA) + corticosteroids versus corticosteroids alone, Outcome 7 Malignancy.
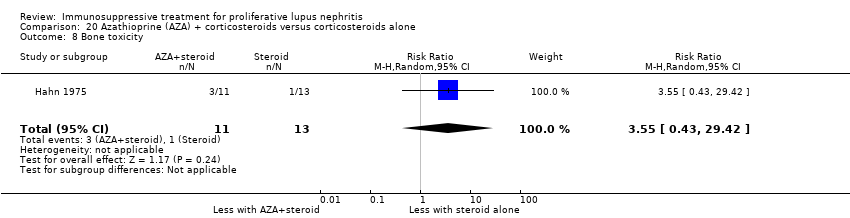
Comparison 20 Azathioprine (AZA) + corticosteroids versus corticosteroids alone, Outcome 8 Bone toxicity.

Comparison 20 Azathioprine (AZA) + corticosteroids versus corticosteroids alone, Outcome 9 Creatinine clearance.
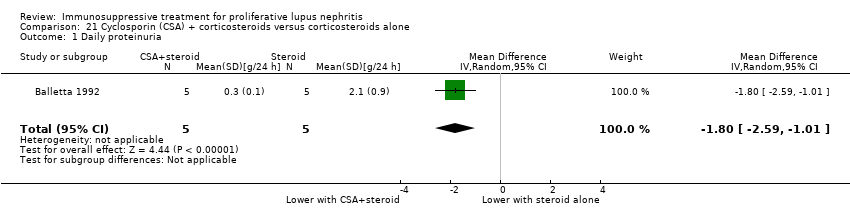
Comparison 21 Cyclosporin (CSA) + corticosteroids versus corticosteroids alone, Outcome 1 Daily proteinuria.

Comparison 21 Cyclosporin (CSA) + corticosteroids versus corticosteroids alone, Outcome 2 Serum creatinine.

Comparison 21 Cyclosporin (CSA) + corticosteroids versus corticosteroids alone, Outcome 3 Creatinine clearance.

Comparison 22 Misoprostol + corticosteroids versus corticosteroids alone, Outcome 1 Adverse renal outcomes.
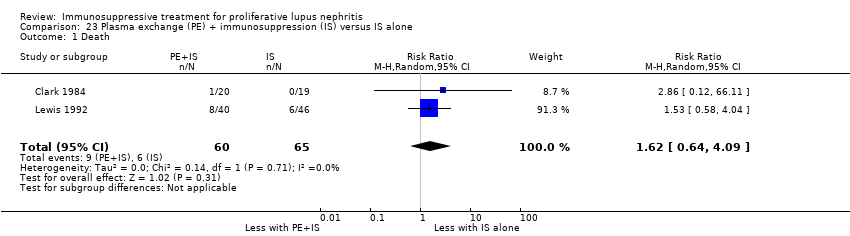
Comparison 23 Plasma exchange (PE) + immunosuppression (IS) versus IS alone, Outcome 1 Death.
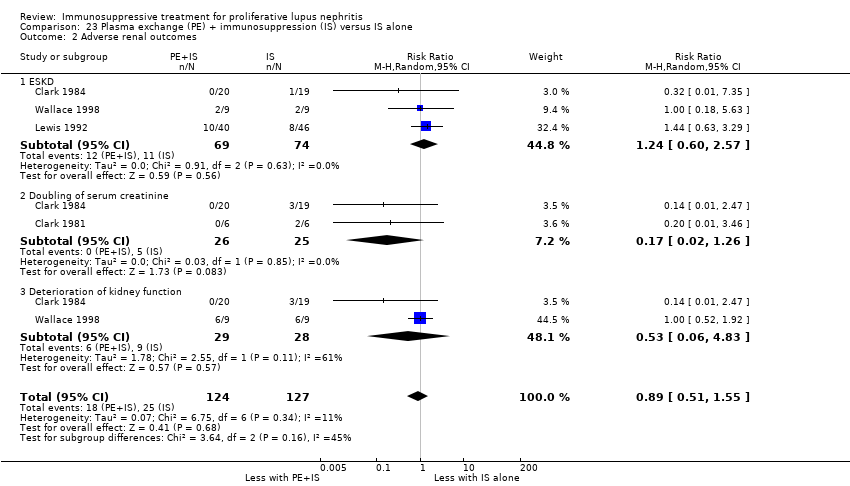
Comparison 23 Plasma exchange (PE) + immunosuppression (IS) versus IS alone, Outcome 2 Adverse renal outcomes.
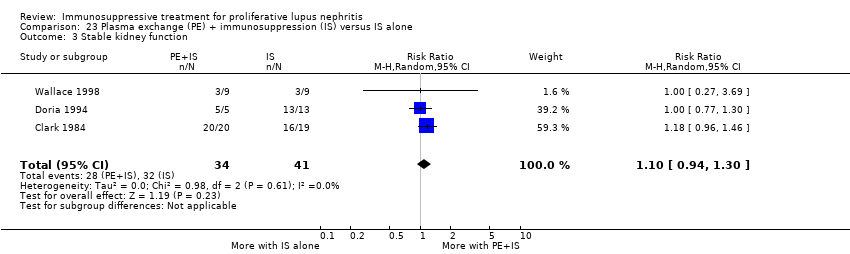
Comparison 23 Plasma exchange (PE) + immunosuppression (IS) versus IS alone, Outcome 3 Stable kidney function.
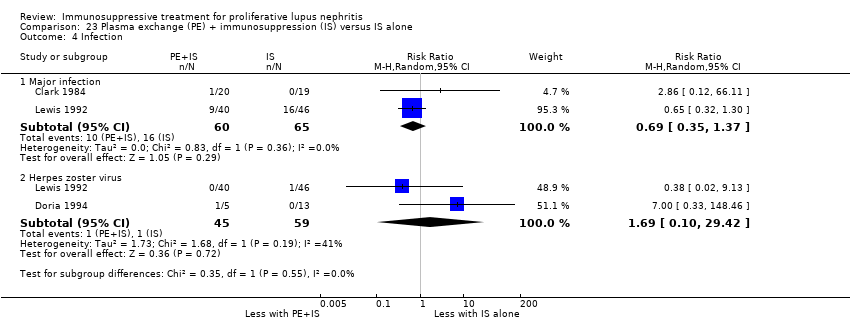
Comparison 23 Plasma exchange (PE) + immunosuppression (IS) versus IS alone, Outcome 4 Infection.
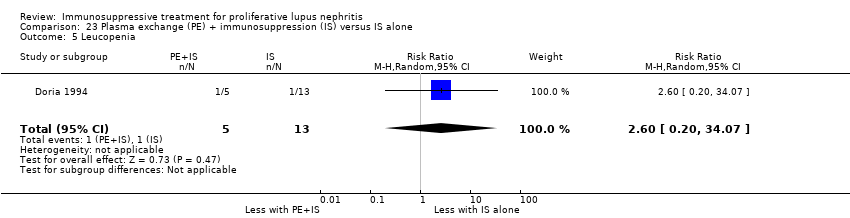
Comparison 23 Plasma exchange (PE) + immunosuppression (IS) versus IS alone, Outcome 5 Leucopenia.

Comparison 23 Plasma exchange (PE) + immunosuppression (IS) versus IS alone, Outcome 6 Daily proteinuria.

Comparison 23 Plasma exchange (PE) + immunosuppression (IS) versus IS alone, Outcome 7 Serum creatinine.

Comparison 23 Plasma exchange (PE) + immunosuppression (IS) versus IS alone, Outcome 8 Creatinine clearance.
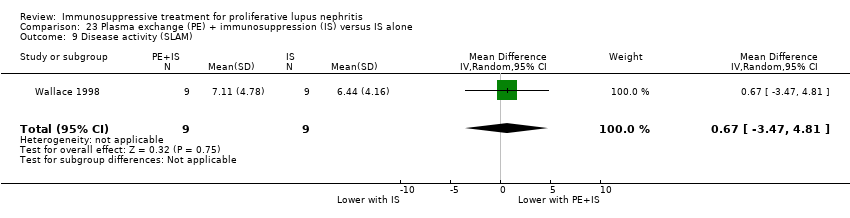
Comparison 23 Plasma exchange (PE) + immunosuppression (IS) versus IS alone, Outcome 9 Disease activity (SLAM).

Comparison 24 Plasma exchange (PE) versus immunosuppression (IS), Outcome 1 Adverse renal outcomes.
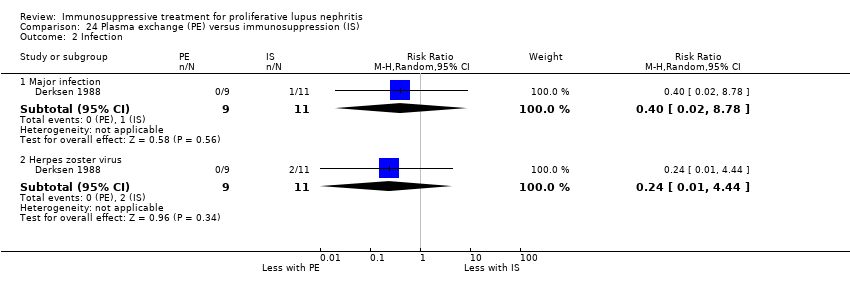
Comparison 24 Plasma exchange (PE) versus immunosuppression (IS), Outcome 2 Infection.

Comparison 24 Plasma exchange (PE) versus immunosuppression (IS), Outcome 3 Leucopenia.

Comparison 24 Plasma exchange (PE) versus immunosuppression (IS), Outcome 4 Alopecia.

Comparison 24 Plasma exchange (PE) versus immunosuppression (IS), Outcome 5 Daily proteinuria.

Comparison 24 Plasma exchange (PE) versus immunosuppression (IS), Outcome 6 Creatinine clearance.

Comparison 25 Long versus short duration cyclophosphamide (CPA), Outcome 1 Adverse renal outcomes.

Comparison 25 Long versus short duration cyclophosphamide (CPA), Outcome 2 Stable kidney function.
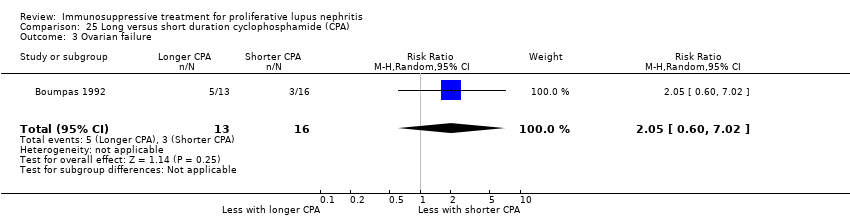
Comparison 25 Long versus short duration cyclophosphamide (CPA), Outcome 3 Ovarian failure.

Comparison 25 Long versus short duration cyclophosphamide (CPA), Outcome 4 Infection.

Comparison 25 Long versus short duration cyclophosphamide (CPA), Outcome 5 Malignancy.
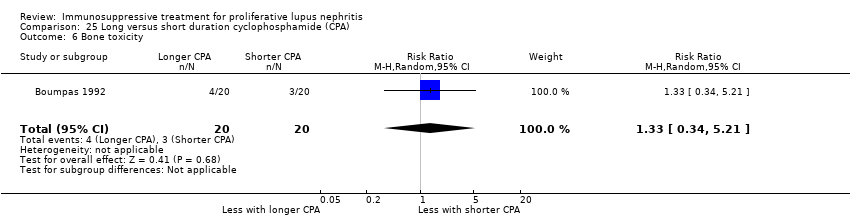
Comparison 25 Long versus short duration cyclophosphamide (CPA), Outcome 6 Bone toxicity.

Comparison 25 Long versus short duration cyclophosphamide (CPA), Outcome 7 Bladder toxicity.
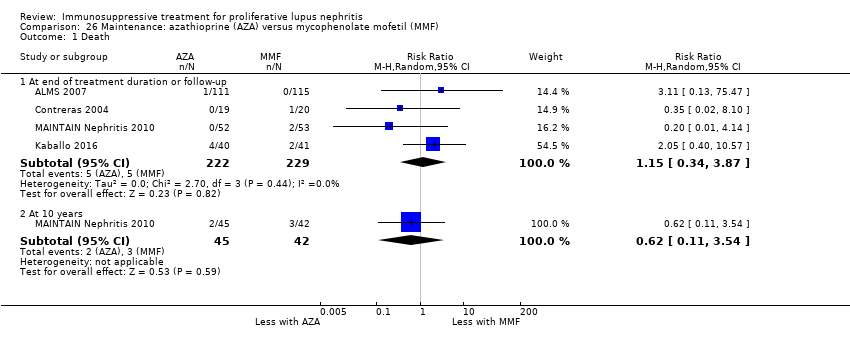
Comparison 26 Maintenance: azathioprine (AZA) versus mycophenolate mofetil (MMF), Outcome 1 Death.
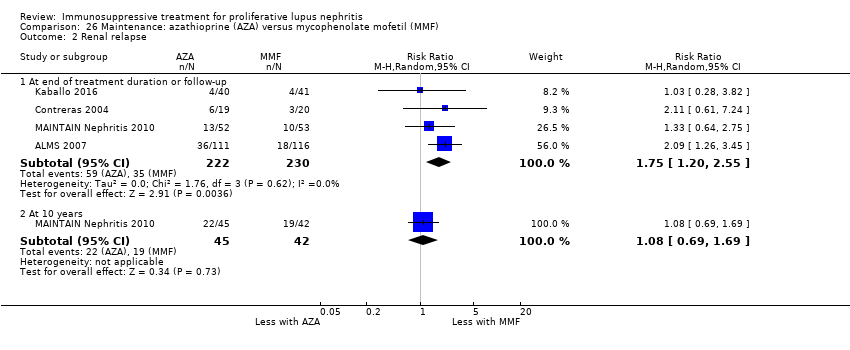
Comparison 26 Maintenance: azathioprine (AZA) versus mycophenolate mofetil (MMF), Outcome 2 Renal relapse.
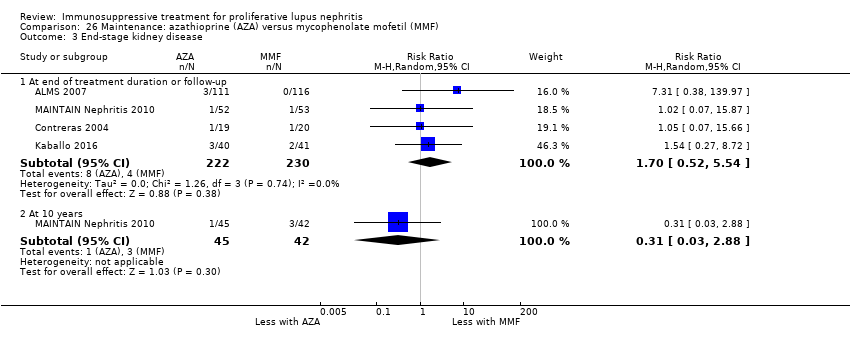
Comparison 26 Maintenance: azathioprine (AZA) versus mycophenolate mofetil (MMF), Outcome 3 End‐stage kidney disease.
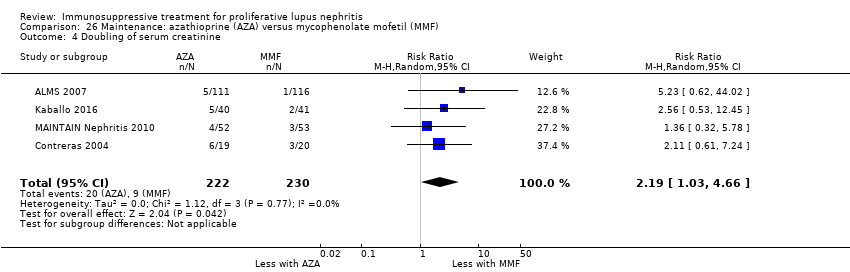
Comparison 26 Maintenance: azathioprine (AZA) versus mycophenolate mofetil (MMF), Outcome 4 Doubling of serum creatinine.

Comparison 26 Maintenance: azathioprine (AZA) versus mycophenolate mofetil (MMF), Outcome 5 Ovarian failure.

Comparison 26 Maintenance: azathioprine (AZA) versus mycophenolate mofetil (MMF), Outcome 6 Infection.
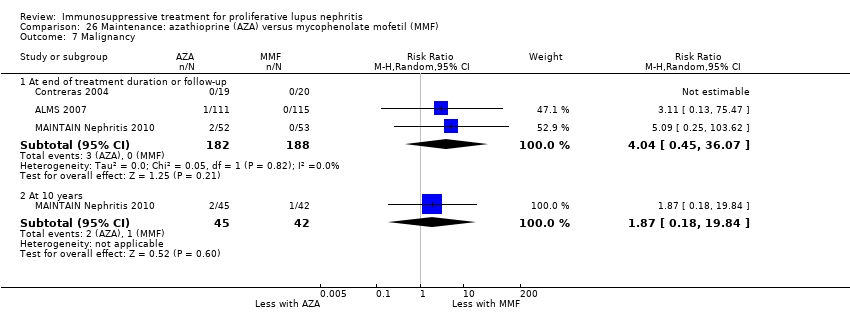
Comparison 26 Maintenance: azathioprine (AZA) versus mycophenolate mofetil (MMF), Outcome 7 Malignancy.
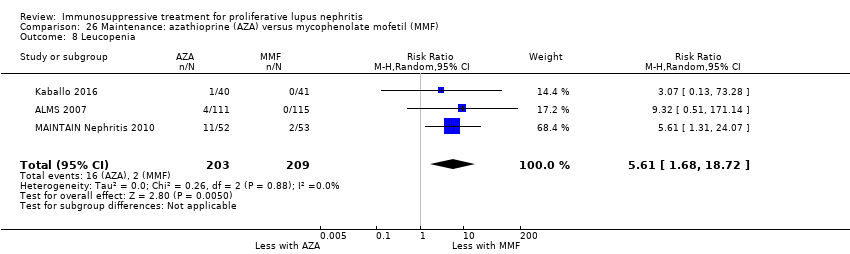
Comparison 26 Maintenance: azathioprine (AZA) versus mycophenolate mofetil (MMF), Outcome 8 Leucopenia.

Comparison 26 Maintenance: azathioprine (AZA) versus mycophenolate mofetil (MMF), Outcome 9 Bone toxicity.

Comparison 26 Maintenance: azathioprine (AZA) versus mycophenolate mofetil (MMF), Outcome 10 Alopecia.

Comparison 26 Maintenance: azathioprine (AZA) versus mycophenolate mofetil (MMF), Outcome 11 Gastrointestinal (GI) adverse events.

Comparison 26 Maintenance: azathioprine (AZA) versus mycophenolate mofetil (MMF), Outcome 12 Daily proteinuria.

Comparison 27 Maintenance: azathioprine (AZA) versus cyclosporin (CSA), Outcome 1 Death.
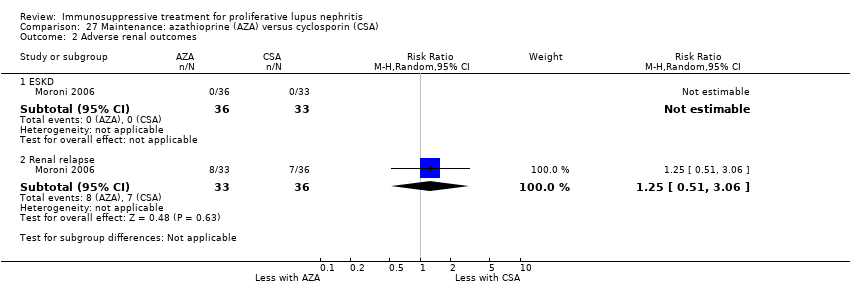
Comparison 27 Maintenance: azathioprine (AZA) versus cyclosporin (CSA), Outcome 2 Adverse renal outcomes.

Comparison 27 Maintenance: azathioprine (AZA) versus cyclosporin (CSA), Outcome 3 Infection.

Comparison 27 Maintenance: azathioprine (AZA) versus cyclosporin (CSA), Outcome 4 Leucopenia.

Comparison 27 Maintenance: azathioprine (AZA) versus cyclosporin (CSA), Outcome 5 Gastrointestinal (GI) adverse events.

Comparison 27 Maintenance: azathioprine (AZA) versus cyclosporin (CSA), Outcome 6 Daily proteinuria.
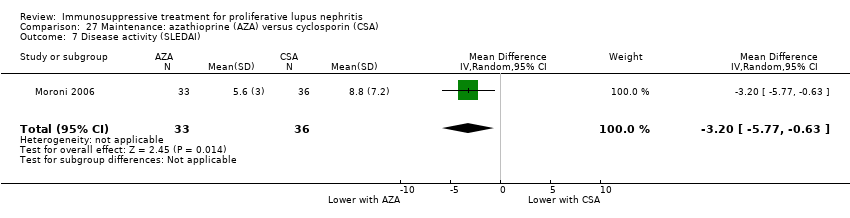
Comparison 27 Maintenance: azathioprine (AZA) versus cyclosporin (CSA), Outcome 7 Disease activity (SLEDAI).

Comparison 28 Maintenance: azathioprine (AZA) versus cyclophosphamide (CPA), Outcome 1 Death.

Comparison 28 Maintenance: azathioprine (AZA) versus cyclophosphamide (CPA), Outcome 2 Adverse renal outcomes.

Comparison 28 Maintenance: azathioprine (AZA) versus cyclophosphamide (CPA), Outcome 3 Bladder toxicity.

Comparison 28 Maintenance: azathioprine (AZA) versus cyclophosphamide (CPA), Outcome 4 Creatinine clearance.

Comparison 29 Maintenance: azathioprine (AZA) versus tacrolimus (TAC), Outcome 1 Adverse renal outcomes.

Comparison 29 Maintenance: azathioprine (AZA) versus tacrolimus (TAC), Outcome 2 Infection.

Comparison 29 Maintenance: azathioprine (AZA) versus tacrolimus (TAC), Outcome 3 Gastrointestinal (GI) adverse events.
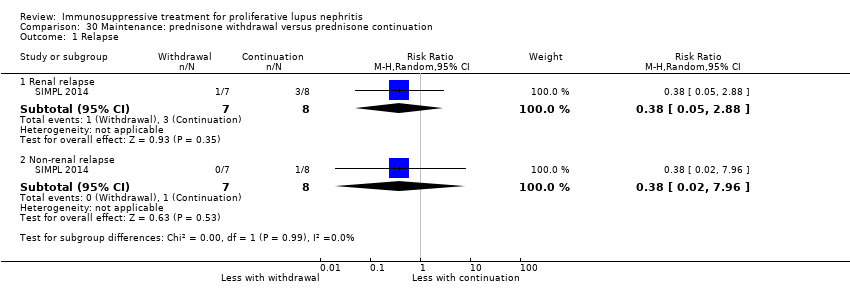
Comparison 30 Maintenance: prednisone withdrawal versus prednisone continuation, Outcome 1 Relapse.

Comparison 30 Maintenance: prednisone withdrawal versus prednisone continuation, Outcome 2 Major infection.

Comparison 31 Maintenance: intravenous immunoglobulin (IVIG) versus intravenous cyclophosphamide (IV CPA), Outcome 1 Creatinine clearance.
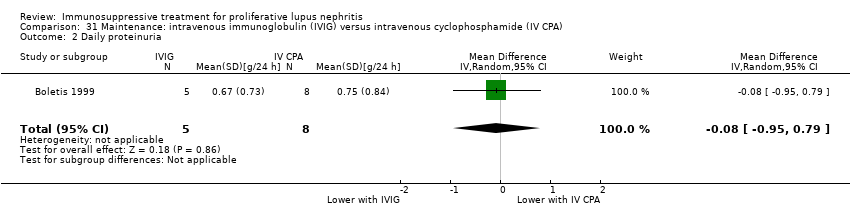
Comparison 31 Maintenance: intravenous immunoglobulin (IVIG) versus intravenous cyclophosphamide (IV CPA), Outcome 2 Daily proteinuria.

Comparison 31 Maintenance: intravenous immunoglobulin (IVIG) versus intravenous cyclophosphamide (IV CPA), Outcome 3 Serum creatinine.
| Patient or population: patients with induction therapy in lupus nephritis | ||||||
| Outcomes | Illustrative comparative risks* (95% CI) | Relative effect | No. of participants | Certainty of evidence | Comments | |
| Assumed risk | Corresponding risk | |||||
| IV CPA | MMF | |||||
| Death | 40 per 1000 | 53 per 1000 | RR 1.12 | 826 (8) | ⊕⊝⊝⊝ | Downgraded as follows: 1 Indirectness: time frame insufficient 2 Total number of events small 3 Severe imprecision (2 |
| ESKD | 85 per 1000 | 61 per 1000 | RR 0.71 (0.27 to 1.84) | 231 (3) | ⊕⊝⊝⊝ | Downgraded as follows: 1 Indirectness: time frame insufficient 2 Total number of events small 3 Severe imprecision (2 |
| Complete renal remission | 222 per 1000 | 260 per 1000 | RR 1.17 (0.97 to 1.42) | 828 (8) | ⊕⊕⊝⊝ | Downgraded as follows: 1 Study limitations 2 Total number of events small 3 Imprecision (2 grades): risk estimate includes null effect and estimate consistent with both appreciable |
| Partial renal remission Follow‐up: mean 24 weeks | 415 per 1000 | 423 per 1000 | RR 1.02 | 868 (9) | ⊕⊕⊝⊝ | Downgraded as follows: 1 Study limitations 2 Serious indirectness: differences in the outcome definition between studies. |
| Ovarian failure | 41 per 1000 | 15 per 1000 | RR 0.36 | 539 (3) | ⊕⊝⊝⊝ | Downgraded as follows: 1 Study limitations 2 Severe heterogeneity: point estimates varied widely 3 Total number of events small 4 Severe imprecision (2 grades): risk estimate includes null effect and estimate consistent |
| Major infection | 114 per 1000 | 116 per 1000 | RR 1.02 | 699 (6) | ⊕⊕⊝⊝ | Downgraded as follows: 1 Study limitations 2 Total number of events small 3 Severe imprecision (2 grades): risk estimate includes null effect and estimate consistent |
| Alopecia | 239 per 1000 | 69 per 1000 | RR 0.29 | 622 (3) | ⊕⊕⊕⊝ | Downgraded as follows: 1 Study limitations 2 Total number of events small Upgraded as follows: 3 Large magnitude of effect |
| Diarrhoea | 100 per 1000 | 241 per 1000 | RR 2.42 | 609 (4) | ⊕⊕⊕⊝ | Downgraded as follows: 1 Study limitations 2 Total number of events small Upgraded as follows 3 Large magnitude of effect |
| *The basis for the assumed risk for partial renal remission was prognostic studies (Fernandes das Neves 2015; Moroni 2007; So 2011; Zakharova 2016); and the assumed risk for other outcomes was calculated using the median control group risk across studies in the meta‐analysis. The corresponding risk (and its 95% confidence interval) is based on the assumed risk in the comparison group and the relative effect of the intervention (and its 95% CI) | ||||||
| GRADE Working Group certainty of evidence | ||||||
| MMF + TAC compared with IV CPA for lupus nephritis | ||||||
| Patient or population: Patients with proliferative lupus nephritis Settings: all settings Intervention: MMF + TAC Comparison: IV CPA | ||||||
| Outcomes | Illustrative comparative risks* (95% CI) | Relative effect | No. of participants | Certainty of evidence | Comments | |
| Assumed risk | Corresponding risk | |||||
| IV CPA | MMF + TAC | |||||
| Complete renal remission follow‐up: mean 24 weeks | 244 per 1000 | 580 per 1000 | RR 2.38 (1.07 to 5.30) | 402 (2) | ⊕⊕⊝⊝ | Downgraded as follows: 1Study limitation: concern regarding the incomplete reporting of IV CPA group 2Heterogeneity: substantial heterogeneity indicated by I2 statistic. Although Chi2 test was satisfied, the small number of studies may make this unreliable. 3Indirectness: Concern regarding the population, as all studies have largely included patients of Asian ethnicity. Upgraded as follows: 4Large effect size |
| Partial renal remission follow‐up: mean 24 weeks | 378 per 1000 | 378 per 1000 | RR 1.00 (0.78 to 1.28) | 402 (2) | ⊕⊕⊝⊝ | Downgraded as follows: 1Study limitation: concern regarding the incomplete reporting of IV CPA group 2 Indirectness: differences in the outcome definition between studies and concern regarding the population, as all studies have largely included patients of Asian ethnicity. |
| Stable kidney function follow‐up: mean 24 weeks | 284 per 1000 | 505 per 1000 | RR 1.78 (1.40 to 2.26) | 402 (2) | ⊕⊕⊝⊝ low1,2,3,4 | Downgraded as follows: 1Study limitation: concern regarding the incomplete reporting of IV CPA group 2 Indirectness (2 grades): differences in the outcome definition between studies and concern regarding the population, as all studies have largely included patients of Asian ethnicity. 3Total number of events small Upgraded as follows: 4Large effect size |
| *The basis for the assumed risk was calculated using the median control group risk across studies in the meta‐analyses. The corresponding risk (and its 95% confidence interval) is based on the assumed risk in the comparison group and the relative effect of the intervention (and its 95% CI). | ||||||
| GRADE Working Group certainty of evidence | ||||||
| Patient or population: patients with maintenance treatment in lupus nephritis | ||||||
| Outcomes | Illustrative comparative risks* (95% CI) | Relative effect | No. of participants | Certainty of evidence | Comments | |
| Assumed risk | Corresponding risk | |||||
| MMF | AZA | |||||
| Death | 22 per 1000 | 25 per 1000 | RR 1.15 (0.34 to 3.87) | 451 (4) | ⊕⊝⊝⊝ | Downgraded as follows: 1Total number of events small 2Severe imprecision (2 grades): risk estimate includes null effect and estimate consistent with both appreciable benefit and harm 3Indirectness: time frame insufficient |
| ESKD | 17 per 1000 | 30 per 1000 (9 to 96) | RR 1.70 (0.52 to 5.54) | 452 (4) | ⊕⊝⊝⊝ | Downgraded as follows: 1Total number of events small 2Severe imprecision (2 grades): risk estimate includes null effect and estimate consistent with both appreciable benefit and harm 3Indirectness: time frame insufficient |
| Renal relapse | 152 per 1000 | 266 per 1000 | RR 1.75 | 452 (4) | ⊕⊕⊕⊝ | Downgraded as follows: 1 Total number of events small |
| Doubling of serum creatinine Follow‐up: 36 to 72 months | 39 per 1000 | 86 per 1000 (40 to 182) | RR 2.19 (1.03 to 4.66) | 452 (4) | ⊕⊕⊝⊝ | Downgraded as follows: 1 Study limitations: (studies generally at unclear or high risk of bias for many domains) 2Total number of events small |
| Major infection | 91 per 1000 | 98 per 1000 | RR 1.08 | 412 (3) | ⊕⊕⊝⊝ | Downgraded as follows: 1 Total number of events small 2 Imprecision: wide risk estimate includes null effect |
| Leucopenia | 10 per 1000 | 54 per 1000 | RR 5.61 | 412 (3) | ⊕⊕⊝⊝ | Downgraded as follows: 1Study limitations: (studies generally at unclear or high risk of bias for many domains) 2 Imprecision: wide risk estimates |
| Alopecia | 67 per 1000 | 64 per 1000 | RR 0.95 | 412 (3) | ⊕⊕⊝⊝ | Downgraded as follows: 1Study limitations: (studies generally at unclear or high risk of bias for many domains) 2 Total number of events small |
| *The basis for the assumed risk for other outcomes was calculated using the median control group risk across studies in the meta‐analysis. The corresponding risk (and its 95% confidence interval) is based on the assumed risk in the comparison group and the relative effect of the intervention (and its 95% CI). | ||||||
| GRADE Working Group certainty of evidence | ||||||
| Study ID | Comparison | Therapy | Measure | Time point | Description of results |
| Abatacept versus placebo | Induction | SF‐36 physical and mental component (mean ± SD) | 6 months |
| |
| Abatacept versus placebo | Induction | SF‐36 (adjusted mean change ± SE) | 12 months |
| |
| Rituximab versus placebo | Induction | SF‐36 ‐ physical functioning (mean change ± SD) | 12 months |
|
| Study ID | Comparison | Therapy | Measure | Time point | Description of results |
| Abatacept versus placebo | Induction | Fatigue VAS (adjusted mean change ± SE) | 6 months |
| |
| Fatigue severity score (adjusted mean change ± SE) |
| ||||
| VAS ‐ visual analogue scale | |||||
| Study ID | Comparison | Measure | Time point | Description of results |
| Induction therapy | ||||
| Abatacept versus placebo | BILAG (mean ± SD) | 6 months |
| |
| MMF versus IV CPA | SLEDAI (mean change ± SD) | 6 months |
| |
| Leflunomide versus CPA | SLEDAI | 6 months | "SLEDAI scores were reduced" | |
| MMF versus IV CPA | SLAM (mean change ± SD) | 6 months |
| |
| IV CPA versus AZA | SLEDAI | 24 months | “SLEDAI and VAS scores did not differ between groups and decreased significantly and paralleled each other (r = 0.673, P<0.01)” | |
| TAC versus IC CPA | SLEDAI | 6 months | “SLEDAI level of FK506 (TAC) group is better than that of CPA group, (P<0.05)” | |
| High CPA versus low CPA | ECLAM | 12 months | “ECLAM score significantly improved in both groups during the first year of follow‐up. No significant difference was noted between patients in the low‐dose and high‐dose IV CYC groups for any of the parameters examined (P>0.05)” | |
| MMF versus TAC | SLEDAI‐2K (mean ± SD) | 12 months |
| |
| Rituximab versus rituximab + CPA | SLEDAI (mean ± SD) | 12 months |
| |
| MMF versus TAC versus IV CPA | SLEDAI (mean ± SD) | 6 months |
| |
| MMF + TAC versus IV CPA | SLEDAI (mean change ± SD) | 6 months |
| |
| PEX versus IA | SLEDAI | 6 months | “The SLEDAI gap between the study groups remained the same throughout the study. The improvements in SLEDAI score of both groups were also significantly demonstrated.” | |
| Rituximab versus placebo | BILAG (Time adjusted area under the curve minus baseline mean ± SD) | 12 months |
| |
| High‐dose CPA versus low‐dose CPA | Renal SLEDAI | 6 months | At 24 weeks, renal SLEDAI were similar between high‐dose and low‐dose cyclophosphamide | |
| MMF versus TAC | Renal SLEDAI (mean ± SD) | 6 months |
| |
| Extrarenal SLEDAI (mean ± SD) |
| |||
| Standard dose PRED versus reduced dose PRED | Global BILAG (mean ± SD) | 6 months | For both groups (reduced dose and standard dose corticosteroids) at the end of 6 months of treatment global BILAG reduced from 14 ± 5.4 to 5.0 ± 3.8 (P < 0.001) | |
| SLEDAI (mean ± SD) | For both groups (reduced dose and standard dose corticosteroids) at the end of 6 months of treatment SLEDAI reduced from16.2 ± 6.9 to 6.2 ± 5.1 (P < 0.001) | |||
| MMF versus IV CPA | SLEDAI (mean change ± SD) | 6 months |
| |
| MMF versus IV CPA | SLEDAI | 6 months | “SLEDAI improved significantly in both the groups over the study period, and there were no differences between the treatment groups.” | |
| Sirukumab versus placebo | SLEDAI‐2K | 6 months | “Eighteen patients (14 in the sirukumab group and 4 in the placebo group) had a SLEDAI‐2K RI‐50 response at any time through week 24.” | |
| Physician's and patients global assessment of disease activity | “Neither the patient’s nor the physician’s global assessment scores of disease activity showed notable improvement over time in either treatment group (data not shown)." | |||
| PE versus standard of care | SLAM (mean ± SD) | 12 months |
| |
| Maintenance therapy | ||||
| AZA versus MMF | SLEDAI | 36 months | "SLEDAI and ECLAM scores decreased similarly in both groups" | |
| ECLAM | ||||
| AZA versus CSA | SLEDAI (mean ± SD) | 24 months |
| |
| AZA ‐ azathioprine; BILAG ‐ British Isles Lupus Assessment Group; CPA ‐ cyclophosphamide; CSA ‐ cyclosporin; ECLAM ‐ European Consensus Lupus Activity Measurement; IA ‐ immunoadsorption; MMF ‐ mycophenolate mofetil; IV ‐ intravenous; PE ‐ plasma exchange; PEX ‐ plasmapheresis; PRED ‐ corticosteroid; SLAM ‐ Systemic Lupus Activity Measure; SLEDAI ‐ Systemic Lupus Erythematosus Disease Activity Index; TAC ‐ tacrolimus | ||||
| Outcome or subgroup title | No. of studies | No. of participants | Statistical method | Effect size |
| 1 Death Show forest plot | 8 | 826 | Risk Ratio (M‐H, Random, 95% CI) | 1.12 [0.61, 2.06] |
| 2 Remission Show forest plot | 9 | Risk Ratio (M‐H, Random, 95% CI) | Subtotals only | |
| 2.1 Complete renal remission: MMF versus IV CPA | 9 | 868 | Risk Ratio (M‐H, Random, 95% CI) | 1.17 [0.97, 1.42] |
| 2.2 Partial renal remission: MMF versus IV CPA | 9 | 868 | Risk Ratio (M‐H, Random, 95% CI) | 1.02 [0.89, 1.18] |
| 2.3 Complete remission in proteinuria: MMF versus IV CPA | 6 | 686 | Risk Ratio (M‐H, Random, 95% CI) | 1.16 [0.85, 1.58] |
| 2.4 Partial remission in proteinuria: MMF versus IV CPA | 6 | 744 | Risk Ratio (M‐H, Random, 95% CI) | 1.03 [0.91, 1.18] |
| 3 Adverse renal outcomes Show forest plot | 4 | Risk Ratio (M‐H, Random, 95% CI) | Subtotals only | |
| 3.1 ESKD | 3 | 231 | Risk Ratio (M‐H, Random, 95% CI) | 0.71 [0.27, 1.84] |
| 3.2 Renal relapse | 1 | 140 | Risk Ratio (M‐H, Random, 95% CI) | 0.97 [0.39, 2.44] |
| 3.3 Doubling of serum creatinine | 1 | 40 | Risk Ratio (M‐H, Random, 95% CI) | 0.0 [0.0, 0.0] |
| 4 Stable kidney function Show forest plot | 6 | 641 | Risk Ratio (M‐H, Random, 95% CI) | 1.05 [0.94, 1.17] |
| 5 Ovarian failure Show forest plot | 3 | 539 | Risk Ratio (M‐H, Random, 95% CI) | 0.36 [0.06, 2.18] |
| 6 Menstrual irregularities Show forest plot | 2 | 87 | Risk Ratio (M‐H, Random, 95% CI) | 0.33 [0.07, 1.59] |
| 7 Infection Show forest plot | 7 | 1452 | Risk Ratio (M‐H, Random, 95% CI) | 1.13 [0.81, 1.58] |
| 7.1 Major infection | 6 | 699 | Risk Ratio (M‐H, Random, 95% CI) | 1.02 [0.67, 1.54] |
| 7.2 Herpes zoster virus | 6 | 753 | Risk Ratio (M‐H, Random, 95% CI) | 1.39 [0.78, 2.46] |
| 8 Malignancy Show forest plot | 1 | 364 | Risk Ratio (M‐H, Random, 95% CI) | 0.65 [0.11, 3.86] |
| 9 Leucopenia Show forest plot | 6 | 753 | Risk Ratio (M‐H, Random, 95% CI) | 0.59 [0.33, 1.08] |
| 10 Bladder toxicity Show forest plot | 1 | 364 | Risk Ratio (M‐H, Random, 95% CI) | 0.33 [0.01, 7.95] |
| 11 Alopecia Show forest plot | 3 | 622 | Risk Ratio (M‐H, Random, 95% CI) | 0.29 [0.19, 0.46] |
| 12 Gastrointestinal (GI) adverse events Show forest plot | 4 | Risk Ratio (M‐H, Random, 95% CI) | Subtotals only | |
| 12.1 Diarrhoea | 4 | 609 | Risk Ratio (M‐H, Random, 95% CI) | 2.42 [1.64, 3.58] |
| 12.2 Vomiting | 3 | 562 | Risk Ratio (M‐H, Random, 95% CI) | 0.48 [0.24, 0.97] |
| 12.3 Nausea | 3 | 562 | Risk Ratio (M‐H, Random, 95% CI) | 0.48 [0.23, 0.98] |
| 12.4 GI upset | 3 | 569 | Risk Ratio (M‐H, Random, 95% CI) | 0.91 [0.78, 1.06] |
| 13 Daily proteinuria Show forest plot | 4 | 271 | Mean Difference (IV, Random, 95% CI) | ‐0.08 [‐0.43, 0.26] |
| 14 Serum creatinine Show forest plot | 6 | 759 | Mean Difference (IV, Random, 95% CI) | 2.14 [‐3.09, 7.37] |
| Outcome or subgroup title | No. of studies | No. of participants | Statistical method | Effect size |
| 1 Death Show forest plot | 1 | 62 | Risk Ratio (M‐H, Random, 95% CI) | 0.19 [0.01, 3.76] |
| 2 Remission Show forest plot | 1 | Risk Ratio (M‐H, Random, 95% CI) | Subtotals only | |
| 2.1 Complete remission in proteinuria | 1 | 62 | Risk Ratio (M‐H, Random, 95% CI) | 0.98 [0.74, 1.30] |
| 2.2 Partial remission in proteinuria | 1 | 62 | Risk Ratio (M‐H, Random, 95% CI) | 1.07 [0.44, 2.59] |
| 3 Adverse renal outcomes Show forest plot | 1 | Risk Ratio (M‐H, Random, 95% CI) | Subtotals only | |
| 3.1 ESKD | 1 | 62 | Risk Ratio (M‐H, Random, 95% CI) | 0.19 [0.01, 3.76] |
| 3.2 Renal relapse | 1 | 62 | Risk Ratio (M‐H, Random, 95% CI) | 1.15 [0.55, 2.37] |
| 3.3 Doubling of serum creatinine | 1 | 62 | Risk Ratio (M‐H, Random, 95% CI) | 0.63 [0.11, 3.48] |
| 4 Ovarian failure Show forest plot | 1 | 53 | Risk Ratio (M‐H, Random, 95% CI) | 0.10 [0.01, 0.73] |
| 5 Infection Show forest plot | 1 | Risk Ratio (M‐H, Random, 95% CI) | Subtotals only | |
| 5.1 Major infection | 1 | 62 | Risk Ratio (M‐H, Random, 95% CI) | 0.21 [0.05, 0.89] |
| 5.2 Herpes zoster virus | 1 | 62 | Risk Ratio (M‐H, Random, 95% CI) | 0.38 [0.08, 1.79] |
| 6 Leucopenia Show forest plot | 1 | 62 | Risk Ratio (M‐H, Random, 95% CI) | 0.06 [0.00, 0.92] |
| 7 Bone toxicity Show forest plot | 1 | 62 | Risk Ratio (M‐H, Random, 95% CI) | 0.0 [0.0, 0.0] |
| 8 Alopecia Show forest plot | 1 | 62 | Risk Ratio (M‐H, Random, 95% CI) | 0.05 [0.00, 0.81] |
| 9 Gastrointestinal (GI) adverse events Show forest plot | 1 | Risk Ratio (M‐H, Random, 95% CI) | Subtotals only | |
| 9.1 GI upset | 1 | 62 | Risk Ratio (M‐H, Random, 95% CI) | 2.81 [0.31, 25.58] |
| 10 Daily proteinuria Show forest plot | 1 | 42 | Mean Difference (IV, Random, 95% CI) | 0.3 [‐0.19, 0.79] |
| Outcome or subgroup title | No. of studies | No. of participants | Statistical method | Effect size |
| 1 Death Show forest plot | 2 | 402 | Risk Ratio (M‐H, Random, 95% CI) | 0.0 [0.0, 0.0] |
| 2 Remission Show forest plot | 2 | Risk Ratio (M‐H, Random, 95% CI) | Subtotals only | |
| 2.1 Complete renal remission | 2 | 402 | Risk Ratio (M‐H, Random, 95% CI) | 2.38 [1.07, 5.30] |
| 2.2 Partial renal remission | 2 | 402 | Risk Ratio (M‐H, Random, 95% CI) | 1.0 [0.78, 1.28] |
| 2.3 Complete remission in proteinuria | 2 | 402 | Risk Ratio (M‐H, Random, 95% CI) | 2.38 [1.07, 5.30] |
| 2.4 Partial remission in proteinuria | 2 | 402 | Risk Ratio (M‐H, Random, 95% CI) | 0.98 [0.76, 1.26] |
| 3 Adverse renal outcomes Show forest plot | 2 | Risk Ratio (M‐H, Random, 95% CI) | Subtotals only | |
| 3.1 Doubling of serum creatinine | 2 | 402 | Risk Ratio (M‐H, Random, 95% CI) | 0.98 [0.10, 9.23] |
| 4 Stable kidney function Show forest plot | 2 | 402 | Risk Ratio (M‐H, Random, 95% CI) | 1.78 [1.40, 2.26] |
| 5 Ovarian failure Show forest plot | 1 | 34 | Risk Ratio (M‐H, Random, 95% CI) | 0.0 [0.0, 0.0] |
| 6 Menstrual irregularities Show forest plot | 1 | 323 | Risk Ratio (M‐H, Random, 95% CI) | 0.28 [0.06, 1.35] |
| 7 Infection Show forest plot | 2 | Risk Ratio (M‐H, Random, 95% CI) | Subtotals only | |
| 7.1 Major infection | 2 | 402 | Risk Ratio (M‐H, Random, 95% CI) | 1.65 [0.11, 24.44] |
| 7.2 Herpes zoster virus | 2 | 402 | Risk Ratio (M‐H, Random, 95% CI) | 0.80 [0.22, 2.94] |
| 8 Leucopenia Show forest plot | 2 | 402 | Risk Ratio (M‐H, Random, 95% CI) | 0.23 [0.04, 1.44] |
| 9 Bone toxicity Show forest plot | 1 | 362 | Risk Ratio (M‐H, Random, 95% CI) | 3.0 [0.12, 73.16] |
| 10 Alopecia Show forest plot | 2 | 402 | Risk Ratio (M‐H, Random, 95% CI) | 0.78 [0.36, 1.72] |
| 11 Gastrointestinal (GI) adverse events Show forest plot | 2 | Risk Ratio (M‐H, Random, 95% CI) | Subtotals only | |
| 11.1 Diarrhoea | 1 | 362 | Risk Ratio (M‐H, Random, 95% CI) | 2.33 [0.92, 5.94] |
| 11.2 GI upset | 2 | 402 | Risk Ratio (M‐H, Random, 95% CI) | 0.21 [0.10, 0.41] |
| 12 Daily proteinuria Show forest plot | 1 | 40 | Mean Difference (IV, Random, 95% CI) | ‐1.69 [‐2.81, ‐0.57] |
| Outcome or subgroup title | No. of studies | No. of participants | Statistical method | Effect size |
| 1 Death Show forest plot | 1 | 82 | Risk Ratio (M‐H, Random, 95% CI) | 0.95 [0.06, 14.72] |
| 2 Remission Show forest plot | 1 | Risk Ratio (M‐H, Random, 95% CI) | Subtotals only | |
| 2.1 Complete renal remission | 1 | 82 | Risk Ratio (M‐H, Random, 95% CI) | 1.22 [0.78, 1.89] |
| 2.2 Partial renal remission | 1 | 82 | Risk Ratio (M‐H, Random, 95% CI) | 1.03 [0.55, 1.90] |
| 3 Menstrual irregularities Show forest plot | 1 | 75 | Risk Ratio (M‐H, Random, 95% CI) | 0.49 [0.16, 1.48] |
| 4 Infection Show forest plot | 1 | 82 | Risk Ratio (M‐H, Random, 95% CI) | 0.37 [0.14, 0.93] |
| 4.1 Major infection | 1 | 82 | Risk Ratio (M‐H, Random, 95% CI) | 0.37 [0.14, 0.93] |
| 5 Leucopenia Show forest plot | 1 | 82 | Risk Ratio (M‐H, Random, 95% CI) | 0.63 [0.11, 3.60] |
| 6 Daily proteinuria Show forest plot | 1 | 77 | Mean Difference (IV, Random, 95% CI) | ‐0.54 [‐1.12, 0.04] |
| Outcome or subgroup title | No. of studies | No. of participants | Statistical method | Effect size |
| 1 Death Show forest plot | 3 | 273 | Risk Ratio (M‐H, Random, 95% CI) | 1.10 [0.44, 2.77] |
| 2 Remission Show forest plot | 3 | Risk Ratio (M‐H, Random, 95% CI) | Subtotals only | |
| 2.1 Complete renal remission | 3 | 273 | Risk Ratio (M‐H, Random, 95% CI) | 1.02 [0.83, 1.26] |
| 2.2 Partial renal remission | 2 | 190 | Risk Ratio (M‐H, Random, 95% CI) | 0.83 [0.51, 1.36] |
| 2.3 Complete remission in proteinuria | 1 | 40 | Risk Ratio (M‐H, Random, 95% CI) | 1.0 [0.50, 1.98] |
| 2.4 Partial remission in proteinuria | 2 | 190 | Risk Ratio (M‐H, Random, 95% CI) | 0.90 [0.79, 1.03] |
| 3 Adverse renal outcomes Show forest plot | 1 | Risk Ratio (M‐H, Random, 95% CI) | Subtotals only | |
| 3.1 ESKD | 1 | 150 | Risk Ratio (M‐H, Random, 95% CI) | 1.22 [0.51, 2.91] |
| 3.2 Renal relapse | 1 | 150 | Risk Ratio (M‐H, Random, 95% CI) | 0.67 [0.48, 0.93] |
| 3.3 Renal relapse (nephritic flare) | 1 | 152 | Risk Ratio (M‐H, Random, 95% CI) | 0.68 [0.36, 1.28] |
| 3.4 Renal relapse (proteinuric flare) | 1 | 150 | Risk Ratio (M‐H, Random, 95% CI) | 0.67 [0.41, 1.12] |
| 3.5 Deterioration in kidney function | 1 | 150 | Risk Ratio (M‐H, Random, 95% CI) | 0.54 [0.27, 1.09] |
| 4 Stable kidney function Show forest plot | 1 | 40 | Risk Ratio (M‐H, Random, 95% CI) | 1.0 [0.50, 1.98] |
| 5 Menstrual irregularities Show forest plot | 1 | 40 | Risk Ratio (M‐H, Random, 95% CI) | 3.0 [0.13, 69.52] |
| 6 Infection Show forest plot | 2 | Risk Ratio (M‐H, Random, 95% CI) | Subtotals only | |
| 6.1 Major infection | 2 | 190 | Risk Ratio (M‐H, Random, 95% CI) | 2.14 [0.93, 4.92] |
| 6.2 Herpes zoster virus | 1 | 150 | Risk Ratio (M‐H, Random, 95% CI) | 6.82 [1.60, 28.96] |
| 7 Leucopenia Show forest plot | 1 | 40 | Risk Ratio (M‐H, Random, 95% CI) | 1.0 [0.07, 14.90] |
| 8 Alopecia Show forest plot | 1 | 150 | Risk Ratio (M‐H, Random, 95% CI) | 0.07 [0.00, 1.31] |
| 9 Daily proteinuria (at 24 weeks) Show forest plot | 1 | 150 | Mean Difference (IV, Random, 95% CI) | 0.18 [‐0.25, 0.61] |
| 10 Disease activity Show forest plot | 2 | Mean Difference (IV, Random, 95% CI) | Subtotals only | |
| 10.1 Renal SLEDAI | 2 | 233 | Mean Difference (IV, Random, 95% CI) | ‐0.21 [‐2.05, 1.63] |
| 10.2 Extrarenal SLEDAI | 2 | 233 | Mean Difference (IV, Random, 95% CI) | ‐0.26 [‐0.74, 0.22] |
| 11 Serum creatinine Show forest plot | 1 | 83 | Mean Difference (IV, Random, 95% CI) | ‐0.01 [‐0.16, 0.14] |
| 12 Creatinine clearance Show forest plot | 1 | 40 | Mean Difference (IV, Random, 95% CI) | ‐1.93 [‐7.77, 3.91] |
| Outcome or subgroup title | No. of studies | No. of participants | Statistical method | Effect size |
| 1 Death Show forest plot | 3 | Risk Ratio (M‐H, Random, 95% CI) | Subtotals only | |
| 1.1 Death | 3 | 153 | Risk Ratio (M‐H, Random, 95% CI) | 0.41 [0.06, 2.69] |
| 1.2 Death: extended follow‐up | 1 | 38 | Risk Ratio (M‐H, Random, 95% CI) | 0.0 [0.0, 0.0] |
| 2 Remission Show forest plot | 4 | Risk Ratio (M‐H, Random, 95% CI) | Subtotals only | |
| 2.1 Complete renal remission | 4 | 178 | Risk Ratio (M‐H, Random, 95% CI) | 1.35 [0.94, 1.93] |
| 2.2 Partial renal remission | 4 | 178 | Risk Ratio (M‐H, Random, 95% CI) | 0.88 [0.61, 1.26] |
| 2.3 Complete remission in proteinuria | 3 | 105 | Risk Ratio (M‐H, Random, 95% CI) | 1.71 [1.08, 2.70] |
| 3 Adverse renal outcomes Show forest plot | 2 | Risk Ratio (M‐H, Random, 95% CI) | Subtotals only | |
| 3.1 ESKD: extended follow‐up | 1 | 38 | Risk Ratio (M‐H, Random, 95% CI) | 1.0 [0.07, 14.85] |
| 3.2 Doubling of serum creatinine | 1 | 40 | Risk Ratio (M‐H, Random, 95% CI) | 0.33 [0.01, 7.72] |
| 3.3 Doubling of serum creatinine: extended follow‐up | 1 | 38 | Risk Ratio (M‐H, Random, 95% CI) | 1.0 [0.16, 6.38] |
| 4 Stable kidney function Show forest plot | 4 | 186 | Risk Ratio (M‐H, Random, 95% CI) | 1.11 [0.61, 2.00] |
| 5 Ovarian failure Show forest plot | 2 | Risk Ratio (M‐H, Random, 95% CI) | Subtotals only | |
| 5.1 Ovarian failure | 2 | 113 | Risk Ratio (M‐H, Random, 95% CI) | 0.25 [0.03, 2.18] |
| 5.2 Premature ovarian failure: extended follow‐up | 1 | 27 | Risk Ratio (M‐H, Random, 95% CI) | 0.31 [0.01, 7.02] |
| 6 Menstrual irregularities Show forest plot | 2 | 54 | Risk Ratio (M‐H, Random, 95% CI) | 0.41 [0.04, 4.05] |
| 7 Infection Show forest plot | 4 | Risk Ratio (M‐H, Random, 95% CI) | Subtotals only | |
| 7.1 Major infection | 3 | 138 | Risk Ratio (M‐H, Random, 95% CI) | 0.73 [0.33, 1.63] |
| 7.2 Herpes zoster virus | 2 | 113 | Risk Ratio (M‐H, Random, 95% CI) | 1.41 [0.38, 5.20] |
| 8 Malignancy: extended follow‐up Show forest plot | 1 | 38 | Risk Ratio (M‐H, Random, 95% CI) | 5.0 [0.26, 97.70] |
| 9 Leucopenia Show forest plot | 3 | 153 | Risk Ratio (M‐H, Random, 95% CI) | 0.44 [0.13, 1.49] |
| 10 Alopecia Show forest plot | 2 | 113 | Risk Ratio (M‐H, Random, 95% CI) | 0.21 [0.02, 1.76] |
| 11 Gastrointestinal (GI) adverse events Show forest plot | 1 | 73 | Risk Ratio (M‐H, Random, 95% CI) | 0.35 [0.12, 1.01] |
| 12 Daily proteinuria Show forest plot | 2 | 156 | Mean Difference (IV, Random, 95% CI) | ‐0.37 [‐0.67, ‐0.07] |
| 12.1 At 9 months | 1 | 40 | Mean Difference (IV, Random, 95% CI) | ‐0.83 [‐1.37, ‐0.29] |
| 12.2 At 12 months | 1 | 38 | Mean Difference (IV, Random, 95% CI) | ‐0.27 [‐0.43, ‐0.11] |
| 12.3 At 18 months | 1 | 40 | Mean Difference (IV, Random, 95% CI) | ‐1.0 [‐2.26, 0.26] |
| 12.4 Extended follow‐up | 1 | 38 | Mean Difference (IV, Random, 95% CI) | ‐0.10 [‐0.49, 0.29] |
| 13 Creatinine clearance Show forest plot | 3 | Mean Difference (IV, Random, 95% CI) | Subtotals only | |
| 13.1 At 6 months | 1 | 150 | Mean Difference (IV, Random, 95% CI) | 11.70 [1.61, 21.79] |
| 13.2 At 9 months | 1 | 40 | Mean Difference (IV, Random, 95% CI) | 14.90 [1.35, 28.45] |
| 13.3 At 12 months | 1 | 38 | Mean Difference (IV, Random, 95% CI) | ‐15.70 [‐23.71, ‐7.69] |
| 13.4 At 18 months | 1 | 40 | Mean Difference (IV, Random, 95% CI) | ‐1.40 [‐17.25, 14.45] |
| 14 Serum creatinine Show forest plot | 1 | Mean Difference (IV, Random, 95% CI) | Subtotals only | |
| 14.1 At 9 months | 1 | 40 | Mean Difference (IV, Random, 95% CI) | 12.70 [1.88, 23.52] |
| 14.2 At 18 months | 1 | 40 | Mean Difference (IV, Random, 95% CI) | 2.70 [‐11.50, 16.90] |
| 14.3 Extended follow‐up | 1 | 38 | Mean Difference (IV, Random, 95% CI) | ‐8.0 [‐20.35, 4.35] |
| Outcome or subgroup title | No. of studies | No. of participants | Statistical method | Effect size |
| 1 Death Show forest plot | 2 | Risk Ratio (M‐H, Random, 95% CI) | Subtotals only | |
| 1.1 At 5 years | 2 | 146 | Risk Ratio (M‐H, Random, 95% CI) | 1.39 [0.25, 7.77] |
| 1.2 At 10 years | 1 | 59 | Risk Ratio (M‐H, Random, 95% CI) | 1.93 [1.22, 3.06] |
| 2 Remission in proteinuria Show forest plot | 1 | Risk Ratio (M‐H, Random, 95% CI) | Subtotals only | |
| 2.1 Complete remission | 1 | 59 | Risk Ratio (M‐H, Random, 95% CI) | 2.03 [0.64, 6.46] |
| 2.2 Partial remission | 1 | 59 | Risk Ratio (M‐H, Random, 95% CI) | 1.80 [0.67, 4.81] |
| 3 Adverse renal outcomes Show forest plot | 2 | Risk Ratio (M‐H, Random, 95% CI) | Subtotals only | |
| 3.1 ESKD | 2 | 144 | Risk Ratio (M‐H, Random, 95% CI) | 0.40 [0.15, 1.07] |
| 3.2 ESKD at 9.6 years (median) | 1 | 100 | Risk Ratio (M‐H, Random, 95% CI) | 1.0 [0.15, 6.82] |
| 3.3 Renal relapse | 1 | 87 | Risk Ratio (M‐H, Random, 95% CI) | 0.15 [0.03, 0.64] |
| 3.4 Renal relapse at 9.6 years (median) | 1 | 87 | Risk Ratio (M‐H, Random, 95% CI) | 0.26 [0.10, 0.67] |
| 3.5 Doubling of serum creatinine | 2 | 144 | Risk Ratio (M‐H, Random, 95% CI) | 0.48 [0.24, 0.95] |
| 3.6 Deterioration of kidney function | 1 | 30 | Risk Ratio (M‐H, Random, 95% CI) | 0.67 [0.18, 2.42] |
| 4 Stable kidney function Show forest plot | 1 | 57 | Risk Ratio (M‐H, Random, 95% CI) | 1.32 [0.86, 2.01] |
| 5 Ovarian failure Show forest plot | 2 | 126 | Risk Ratio (M‐H, Random, 95% CI) | 2.11 [0.59, 7.53] |
| 6 Menstrual irregularities Show forest plot | 1 | 15 | Risk Ratio (M‐H, Random, 95% CI) | 1.90 [0.69, 5.23] |
| 7 Infection Show forest plot | 1 | Risk Ratio (M‐H, Random, 95% CI) | Subtotals only | |
| 7.1 Major infection | 1 | 57 | Risk Ratio (M‐H, Random, 95% CI) | 1.25 [0.27, 5.86] |
| 7.2 Herpes zoster virus | 1 | 57 | Risk Ratio (M‐H, Random, 95% CI) | 2.75 [0.68, 11.18] |
| 8 Malignancy Show forest plot | 2 | Risk Ratio (M‐H, Random, 95% CI) | Subtotals only | |
| 8.1 CPA versus AZA | 2 | 144 | Risk Ratio (M‐H, Random, 95% CI) | 0.59 [0.13, 2.63] |
| 8.2 10 year follow‐up | 1 | 87 | Risk Ratio (M‐H, Random, 95% CI) | 0.74 [0.11, 5.01] |
| 9 Bone toxicity Show forest plot | 1 | 87 | Risk Ratio (M‐H, Random, 95% CI) | 0.0 [0.0, 0.0] |
| 10 Bladder toxicity Show forest plot | 2 | 144 | Risk Ratio (M‐H, Random, 95% CI) | 3.59 [0.19, 66.14] |
| Outcome or subgroup title | No. of studies | No. of participants | Statistical method | Effect size |
| 1 Death Show forest plot | 1 | 144 | Risk Ratio (M‐H, Random, 95% CI) | 5.0 [0.24, 102.35] |
| 2 Remission Show forest plot | 1 | Risk Ratio (M‐H, Random, 95% CI) | Subtotals only | |
| 2.1 Complete renal response | 1 | 144 | Risk Ratio (M‐H, Random, 95% CI) | 0.86 [0.51, 1.45] |
| 2.2 Partial renal response | 1 | 144 | Risk Ratio (M‐H, Random, 95% CI) | 2.0 [1.05, 3.82] |
| 2.3 Complete remission in proteinuria | 1 | 144 | Risk Ratio (M‐H, Random, 95% CI) | 0.87 [0.63, 1.21] |
| 3 Stable kidney function Show forest plot | 1 | 144 | Risk Ratio (M‐H, Random, 95% CI) | 1.24 [0.90, 1.71] |
| 4 Infection Show forest plot | 1 | Risk Ratio (M‐H, Random, 95% CI) | Subtotals only | |
| 4.1 Major infection | 1 | 144 | Risk Ratio (M‐H, Random, 95% CI) | 1.0 [0.48, 2.08] |
| 4.2 Herpes zoster virus | 1 | 144 | Risk Ratio (M‐H, Random, 95% CI) | 0.82 [0.36, 1.85] |
| 5 Leucopenia Show forest plot | 1 | 144 | Risk Ratio (M‐H, Random, 95% CI) | 3.0 [0.85, 10.63] |
| Outcome or subgroup title | No. of studies | No. of participants | Statistical method | Effect size |
| 1 Remission Show forest plot | 1 | Risk Ratio (M‐H, Random, 95% CI) | Subtotals only | |
| 1.1 Complete renal response | 1 | 19 | Risk Ratio (M‐H, Random, 95% CI) | 0.9 [0.16, 5.13] |
| 1.2 Partial renal response | 1 | 19 | Risk Ratio (M‐H, Random, 95% CI) | 0.75 [0.35, 1.62] |
| 2 Infection Show forest plot | 1 | 38 | Risk Ratio (M‐H, Random, 95% CI) | 0.57 [0.08, 4.20] |
| 2.1 Major infection | 1 | 19 | Risk Ratio (M‐H, Random, 95% CI) | 0.9 [0.07, 12.38] |
| 2.2 Herpes zoster virus | 1 | 19 | Risk Ratio (M‐H, Random, 95% CI) | 0.30 [0.01, 6.62] |
| 3 Daily proteinuria Show forest plot | 1 | 19 | Mean Difference (IV, Random, 95% CI) | ‐0.30 [‐2.29, 1.69] |
| 4 Creatinine clearance Show forest plot | 1 | 19 | Mean Difference (IV, Random, 95% CI) | ‐17.20 [‐50.66, 16.26] |
| 5 Serum creatinine Show forest plot | 1 | 19 | Mean Difference (IV, Random, 95% CI) | 35.00 [‐27.14, 97.14] |
| Outcome or subgroup title | No. of studies | No. of participants | Statistical method | Effect size |
| 1 Death Show forest plot | 2 | Risk Ratio (M‐H, Random, 95% CI) | Subtotals only | |
| 1.1 Abatacept versus placebo | 2 | 432 | Risk Ratio (M‐H, Random, 95% CI) | 0.29 [0.10, 0.91] |
| 1.2 High dose abatacept versus placebo | 1 | 199 | Risk Ratio (M‐H, Random, 95% CI) | 0.29 [0.06, 1.36] |
| 1.3 Low dose abatacept versus placebo | 1 | 199 | Risk Ratio (M‐H, Random, 95% CI) | 0.29 [0.06, 1.36] |
| 2 Remission Show forest plot | 2 | Risk Ratio (M‐H, Random, 95% CI) | Subtotals only | |
| 2.1 Complete remission: abatacept versus placebo | 2 | 432 | Risk Ratio (M‐H, Random, 95% CI) | 1.13 [0.74, 1.71] |
| 2.2 Complete remission: high dose abatacept versus placebo | 1 | 199 | Risk Ratio (M‐H, Random, 95% CI) | 1.14 [0.46, 2.83] |
| 2.3 Complete remission: low dose abatacept versus placebo | 1 | 199 | Risk Ratio (M‐H, Random, 95% CI) | 1.39 [0.58, 3.31] |
| 2.4 Partial remission: abatacept versus placebo | 2 | 432 | Risk Ratio (M‐H, Random, 95% CI) | 0.88 [0.58, 1.33] |
| 2.5 Partial remission: high dose abatacept versus placebo | 1 | 199 | Risk Ratio (M‐H, Random, 95% CI) | 1.01 [0.51, 2.01] |
| 2.6 Partial remission: low dose abatacept versus placebo | 1 | 199 | Risk Ratio (M‐H, Random, 95% CI) | 0.65 [0.29, 1.43] |
| 3 Adverse renal outcomes Show forest plot | 2 | Risk Ratio (M‐H, Random, 95% CI) | Subtotals only | |
| 3.1 ESKD: Abatacept versus placebo | 1 | 298 | Risk Ratio (M‐H, Random, 95% CI) | 0.84 [0.21, 3.45] |
| 3.2 ESKD: high dose abatacept versus placebo | 1 | 199 | Risk Ratio (M‐H, Random, 95% CI) | 1.01 [0.21, 4.88] |
| 3.3 ESKD: low dose abatacept versus placebo | 1 | 199 | Risk Ratio (M‐H, Random, 95% CI) | 0.67 [0.11, 3.94] |
| 3.4 Renal relapse: abatacept versus placebo | 1 | 134 | Risk Ratio (M‐H, Random, 95% CI) | 1.03 [0.22, 4.92] |
| 4 Major Infection Show forest plot | 2 | Risk Ratio (M‐H, Random, 95% CI) | Subtotals only | |
| 4.1 Abatacept versus placebo | 2 | 432 | Risk Ratio (M‐H, Random, 95% CI) | 1.29 [0.81, 2.04] |
| 4.2 High dose abatacept versus placebo | 1 | 199 | Risk Ratio (M‐H, Random, 95% CI) | 1.37 [0.78, 2.40] |
| 4.3 Low dose abatacept versus placebo | 1 | 199 | Risk Ratio (M‐H, Random, 95% CI) | 1.07 [0.59, 1.95] |
| 5 Herpes zoster virus Show forest plot | 1 | Risk Ratio (M‐H, Random, 95% CI) | Subtotals only | |
| 5.1 Abatacept versus placebo | 1 | 298 | Risk Ratio (M‐H, Random, 95% CI) | 9.64 [0.57, 164.02] |
| 5.2 High dose abatacept versus placebo | 1 | 199 | Risk Ratio (M‐H, Random, 95% CI) | 7.07 [0.37, 135.11] |
| 5.3 Low dose abatacept versus placebo | 1 | 199 | Risk Ratio (M‐H, Random, 95% CI) | 13.13 [0.75, 229.99] |
| 6 Health‐related quality of life Show forest plot | 1 | Mean Difference (IV, Random, 95% CI) | Subtotals only | |
| 6.1 Physical component | 1 | 134 | Mean Difference (IV, Random, 95% CI) | 0.0 [‐3.73, 3.73] |
| 6.2 Mental component | 1 | 134 | Mean Difference (IV, Random, 95% CI) | ‐0.60 [‐4.50, 3.30] |
| 7 Disease activity (BILAG) Show forest plot | 1 | 134 | Mean Difference (IV, Random, 95% CI) | ‐0.40 [‐1.23, 0.43] |
| Outcome or subgroup title | No. of studies | No. of participants | Statistical method | Effect size |
| 1 Death Show forest plot | 1 | Risk Ratio (M‐H, Random, 95% CI) | Subtotals only | |
| 1.1 Laquinimod versus placebo | 1 | 46 | Risk Ratio (M‐H, Random, 95% CI) | 1.5 [0.06, 34.79] |
| 1.2 High dose laquinimod versus placebo | 1 | 30 | Risk Ratio (M‐H, Random, 95% CI) | 3.0 [0.13, 68.26] |
| 1.3 Low dose laquinimod versus placebo | 1 | 31 | Risk Ratio (M‐H, Random, 95% CI) | 0.0 [0.0, 0.0] |
| 2 Complete remission Show forest plot | 1 | Risk Ratio (M‐H, Random, 95% CI) | Subtotals only | |
| 2.1 Complete remission: laquinimod versus placebo | 1 | 46 | Risk Ratio (M‐H, Random, 95% CI) | 1.55 [0.70, 3.42] |
| 2.2 Complete remission: high dose laquinimod versus placebo | 1 | 30 | Risk Ratio (M‐H, Random, 95% CI) | 1.2 [0.47, 3.09] |
| 2.3 Complete remission: low dose laquinimod versus placebo | 1 | 31 | Risk Ratio (M‐H, Random, 95% CI) | 1.88 [0.83, 4.22] |
| Outcome or subgroup title | No. of studies | No. of participants | Statistical method | Effect size |
| 1 Death Show forest plot | 1 | Risk Ratio (M‐H, Random, 95% CI) | Subtotals only | |
| 1.1 Ocrelizumab versus placebo | 1 | 379 | Risk Ratio (M‐H, Random, 95% CI) | 0.66 [0.23, 1.85] |
| 1.2 High dose ocrelizumab versus placebo | 1 | 253 | Risk Ratio (M‐H, Random, 95% CI) | 0.81 [0.25, 2.60] |
| 1.3 Low dose ocrelizumab versus placebo | 1 | 251 | Risk Ratio (M‐H, Random, 95% CI) | 0.50 [0.13, 1.94] |
| 2 Remission Show forest plot | 1 | Risk Ratio (M‐H, Random, 95% CI) | Subtotals only | |
| 2.1 Complete remission: ocrelizumab versus placebo | 1 | 223 | Risk Ratio (M‐H, Random, 95% CI) | 1.07 [0.74, 1.56] |
| 2.2 Complete remission: high dose ocrelizumab versus placebo | 1 | 148 | Risk Ratio (M‐H, Random, 95% CI) | 0.91 [0.57, 1.44] |
| 2.3 Complete remission: low dose ocrelizumab versus placebo | 1 | 150 | Risk Ratio (M‐H, Random, 95% CI) | 1.23 [0.82, 1.85] |
| 2.4 Partial remission: ocrelizumab versus placebo | 1 | 223 | Risk Ratio (M‐H, Random, 95% CI) | 1.49 [0.89, 2.49] |
| 2.5 Partial remission: high dose ocrelizumab versus placebo | 1 | 148 | Risk Ratio (M‐H, Random, 95% CI) | 1.78 [1.03, 3.08] |
| 2.6 Partial remission: low dose ocrelizumab versus placebo | 1 | 150 | Risk Ratio (M‐H, Random, 95% CI) | 1.2 [0.65, 2.20] |
| 3 Major Infection Show forest plot | 1 | Risk Ratio (M‐H, Random, 95% CI) | Subtotals only | |
| 3.1 Ocrelizumab versus placebo | 1 | 378 | Risk Ratio (M‐H, Random, 95% CI) | 1.14 [0.95, 1.36] |
| 3.2 High dose ocrelizumab versus placebo | 1 | 252 | Risk Ratio (M‐H, Random, 95% CI) | 1.05 [0.85, 1.30] |
| 3.3 Low dose ocrelizumab versus placebo | 1 | 251 | Risk Ratio (M‐H, Random, 95% CI) | 1.22 [1.00, 1.48] |
| Outcome or subgroup title | No. of studies | No. of participants | Statistical method | Effect size |
| 1 Death Show forest plot | 1 | 25 | Risk Ratio (M‐H, Random, 95% CI) | 0.0 [0.0, 0.0] |
| 2 Infection Show forest plot | 1 | 25 | Risk Ratio (M‐H, Random, 95% CI) | 0.93 [0.66, 1.32] |
| 2.1 Major infection | 1 | 25 | Risk Ratio (M‐H, Random, 95% CI) | 0.93 [0.66, 1.32] |
| 3 Malignancy Show forest plot | 1 | 25 | Risk Ratio (M‐H, Random, 95% CI) | 0.0 [0.0, 0.0] |
| 4 Gastrointestinal (GI) adverse events Show forest plot | 1 | Risk Ratio (M‐H, Random, 95% CI) | Subtotals only | |
| 4.1 Diarrhoea | 1 | 25 | Risk Ratio (M‐H, Random, 95% CI) | 1.59 [0.10, 26.15] |
| Outcome or subgroup title | No. of studies | No. of participants | Statistical method | Effect size |
| 1 Death Show forest plot | 2 | 67 | Risk Ratio (M‐H, Random, 95% CI) | 0.80 [0.20, 3.24] |
| 2 Adverse renal outcomes Show forest plot | 2 | Risk Ratio (M‐H, Random, 95% CI) | Subtotals only | |
| 2.1 ESKD | 2 | 67 | Risk Ratio (M‐H, Random, 95% CI) | 0.23 [0.04, 1.28] |
| 2.2 Doubling of serum creatinine | 2 | 67 | Risk Ratio (M‐H, Random, 95% CI) | 0.67 [0.23, 1.98] |
| 2.3 Deterioration of kidney function | 1 | 38 | Risk Ratio (M‐H, Random, 95% CI) | 0.72 [0.23, 2.27] |
| 3 Stable kidney function Show forest plot | 1 | 38 | Risk Ratio (M‐H, Random, 95% CI) | 1.11 [0.77, 1.59] |
| 4 Ovarian failure Show forest plot | 2 | 56 | Risk Ratio (M‐H, Random, 95% CI) | 0.70 [0.37, 1.30] |
| 5 Infection Show forest plot | 2 | Risk Ratio (M‐H, Random, 95% CI) | Subtotals only | |
| 5.1 Major infection | 2 | 67 | Risk Ratio (M‐H, Random, 95% CI) | 1.16 [0.47, 2.90] |
| 5.2 Herpes zoster virus | 1 | 38 | Risk Ratio (M‐H, Random, 95% CI) | 0.75 [0.28, 2.04] |
| 6 Malignancy Show forest plot | 2 | 67 | Risk Ratio (M‐H, Random, 95% CI) | 1.43 [0.41, 4.96] |
| 7 Bladder toxicity Show forest plot | 2 | 67 | Risk Ratio (M‐H, Random, 95% CI) | 0.22 [0.03, 1.83] |
| 8 Gastrointestinal (GI) adverse events Show forest plot | 1 | Risk Ratio (M‐H, Random, 95% CI) | Subtotals only | |
| 8.1 GI upset | 1 | 29 | Risk Ratio (M‐H, Random, 95% CI) | 3.69 [0.43, 31.43] |
| Outcome or subgroup title | No. of studies | No. of participants | Statistical method | Effect size |
| 1 Death Show forest plot | 4 | Risk Ratio (M‐H, Random, 95% CI) | Subtotals only | |
| 1.1 At 6 months | 1 | 117 | Risk Ratio (M‐H, Random, 95% CI) | 1.81 [0.19, 16.85] |
| 1.2 At 12 months | 2 | 121 | Risk Ratio (M‐H, Random, 95% CI) | 0.97 [0.14, 6.56] |
| 1.3 At 5 years | 1 | 85 | Risk Ratio (M‐H, Random, 95% CI) | 0.13 [0.01, 2.51] |
| 1.4 At 10 years | 1 | 90 | Risk Ratio (M‐H, Random, 95% CI) | 0.38 [0.08, 1.87] |
| 2 Remission Show forest plot | 3 | Risk Ratio (M‐H, Random, 95% CI) | Subtotals only | |
| 2.1 Complete renal remission | 3 | 267 | Risk Ratio (M‐H, Random, 95% CI) | 1.09 [0.63, 1.86] |
| 2.2 Partial renal remission | 3 | 267 | Risk Ratio (M‐H, Random, 95% CI) | 0.88 [0.69, 1.14] |
| 3 Adverse renal outcomes Show forest plot | 3 | Risk Ratio (M‐H, Random, 95% CI) | Subtotals only | |
| 3.1 ESKD | 2 | 135 | Risk Ratio (M‐H, Random, 95% CI) | 0.49 [0.05, 5.20] |
| 3.2 ESKD at 5 years | 1 | 85 | Risk Ratio (M‐H, Random, 95% CI) | 2.80 [0.30, 25.81] |
| 3.3 ESKD at 10 years | 1 | 90 | Risk Ratio (M‐H, Random, 95% CI) | 1.91 [0.37, 9.92] |
| 3.4 Renal relapse | 3 | 211 | Risk Ratio (M‐H, Random, 95% CI) | 2.75 [0.47, 15.98] |
| 3.5 Doubling of serum creatinine | 2 | 135 | Risk Ratio (M‐H, Random, 95% CI) | 0.33 [0.04, 3.02] |
| 3.6 Doubling of serum creatinine at 5 years | 1 | 85 | Risk Ratio (M‐H, Random, 95% CI) | 0.13 [0.02, 1.04] |
| 3.7 Doubling of serum creatinine at 10 years | 1 | 90 | Risk Ratio (M‐H, Random, 95% CI) | 0.80 [0.26, 2.42] |
| 4 Stable kidney function Show forest plot | 1 | Risk Ratio (M‐H, Random, 95% CI) | Subtotals only | |
| 4.1 At 3 years | 1 | 89 | Risk Ratio (M‐H, Random, 95% CI) | 0.72 [0.50, 1.03] |
| 4.2 At 5 years | 1 | 85 | Risk Ratio (M‐H, Random, 95% CI) | 0.96 [0.77, 1.20] |
| 5 Ovarian failure Show forest plot | 4 | 299 | Risk Ratio (M‐H, Random, 95% CI) | 1.73 [0.70, 4.31] |
| 6 Infection Show forest plot | 4 | Risk Ratio (M‐H, Random, 95% CI) | Subtotals only | |
| 6.1 Major infection | 4 | 327 | Risk Ratio (M‐H, Random, 95% CI) | 1.44 [0.83, 2.49] |
| 6.2 Herpes zoster virus | 3 | 281 | Risk Ratio (M‐H, Random, 95% CI) | 1.58 [0.41, 6.05] |
| 7 Malignancy Show forest plot | 2 | 206 | Risk Ratio (M‐H, Random, 95% CI) | 1.44 [0.09, 23.31] |
| 8 Leucopenia Show forest plot | 3 | 281 | Risk Ratio (M‐H, Random, 95% CI) | 0.82 [0.13, 5.15] |
| 9 Bone toxicity Show forest plot | 2 | 164 | Risk Ratio (M‐H, Random, 95% CI) | 2.93 [0.48, 18.02] |
| 10 Alopecia Show forest plot | 1 | 75 | Risk Ratio (M‐H, Random, 95% CI) | 0.28 [0.06, 1.25] |
| 11 Gastrointestinal (GI) adverse events Show forest plot | 1 | Risk Ratio (M‐H, Random, 95% CI) | Subtotals only | |
| 11.1 GI disturbance | 1 | 75 | Risk Ratio (M‐H, Random, 95% CI) | 0.11 [0.01, 1.94] |
| 12 Daily proteinuria Show forest plot | 3 | 242 | Mean Difference (IV, Random, 95% CI) | ‐0.10 [‐0.65, 0.46] |
| 13 Creatinine clearance Show forest plot | 1 | 117 | Mean Difference (IV, Random, 95% CI) | ‐12.60 [‐23.63, ‐1.57] |
| 14 Serum creatinine Show forest plot | 3 | 247 | Mean Difference (IV, Random, 95% CI) | 2.85 [‐7.61, 13.31] |
| 15 Disease activity (SLEDAI) Show forest plot | 1 | 75 | Mean Difference (IV, Random, 95% CI) | ‐1.50 [‐3.04, 0.04] |
| Outcome or subgroup title | No. of studies | No. of participants | Statistical method | Effect size |
| 1 Death Show forest plot | 1 | 81 | Risk Ratio (M‐H, Random, 95% CI) | 4.65 [0.23, 93.95] |
| 2 Remission Show forest plot | 1 | Risk Ratio (M‐H, Random, 95% CI) | Subtotals only | |
| 2.1 Complete renal remission | 1 | 81 | Risk Ratio (M‐H, Random, 95% CI) | 0.93 [0.39, 2.23] |
| 2.2 Partial renal remission | 1 | 81 | Risk Ratio (M‐H, Random, 95% CI) | 1.33 [0.78, 2.24] |
| 3 Relapse Show forest plot | 1 | 50 | Risk Ratio (M‐H, Random, 95% CI) | 2.38 [0.10, 55.72] |
| 4 Infection Show forest plot | 1 | Risk Ratio (M‐H, Random, 95% CI) | Subtotals only | |
| 4.1 Major infection | 1 | 81 | Risk Ratio (M‐H, Random, 95% CI) | 4.64 [0.57, 38.00] |
| 4.2 Herpes zoster virus | 1 | 81 | Risk Ratio (M‐H, Random, 95% CI) | 13.95 [0.82, 236.48] |
| 5 Gastrointestinal (GI) adverse events Show forest plot | 1 | Risk Ratio (M‐H, Random, 95% CI) | Subtotals only | |
| 5.1 Diarrhoea | 1 | 81 | Risk Ratio (M‐H, Random, 95% CI) | 1.16 [0.51, 2.64] |
| 5.2 Vomiting | 1 | 81 | Risk Ratio (M‐H, Random, 95% CI) | 0.93 [0.25, 3.46] |
| 5.3 Nausea | 1 | 81 | Risk Ratio (M‐H, Random, 95% CI) | 2.79 [0.30, 25.67] |
| 6 Creatinine clearance Show forest plot | 1 | 74 | Mean Difference (IV, Random, 95% CI) | ‐5.80 [‐21.08, 9.48] |
| 7 Serum creatinine Show forest plot | 1 | 81 | Mean Difference (IV, Random, 95% CI) | ‐2.40 [‐15.98, 11.18] |
| Outcome or subgroup title | No. of studies | No. of participants | Statistical method | Effect size |
| 1 Death Show forest plot | 1 | 22 | Risk Ratio (M‐H, Random, 95% CI) | 0.0 [0.0, 0.0] |
| 2 Adverse renal outcomes Show forest plot | 1 | Risk Ratio (M‐H, Random, 95% CI) | Subtotals only | |
| 2.1 Renal relapse | 1 | 22 | Risk Ratio (M‐H, Random, 95% CI) | 0.95 [0.44, 2.04] |
| Outcome or subgroup title | No. of studies | No. of participants | Statistical method | Effect size |
| 1 Death Show forest plot | 5 | 226 | Risk Ratio (M‐H, Random, 95% CI) | 0.98 [0.53, 1.82] |
| 2 Complete remission of proteinuria Show forest plot | 1 | 13 | Risk Ratio (M‐H, Random, 95% CI) | 2.63 [0.13, 54.64] |
| 3 Adverse renal outcomes Show forest plot | 5 | Risk Ratio (M‐H, Random, 95% CI) | Subtotals only | |
| 3.1 ESKD | 5 | 278 | Risk Ratio (M‐H, Random, 95% CI) | 0.63 [0.39, 1.03] |
| 3.2 Renal relapse | 2 | 84 | Risk Ratio (M‐H, Random, 95% CI) | 0.23 [0.08, 0.62] |
| 3.3 Doubling serum creatinine | 4 | 228 | Risk Ratio (M‐H, Random, 95% CI) | 0.59 [0.40, 0.88] |
| 4 Deterioration of kidney function Show forest plot | 5 | 179 | Risk Ratio (M‐H, Random, 95% CI) | 0.78 [0.52, 1.18] |
| 5 Stable kidney function Show forest plot | 5 | 278 | Risk Ratio (M‐H, Random, 95% CI) | 1.20 [1.00, 1.45] |
| 6 Ovarian failure Show forest plot | 3 | 147 | Risk Ratio (M‐H, Random, 95% CI) | 2.18 [1.10, 4.34] |
| 7 Infection Show forest plot | 6 | Risk Ratio (M‐H, Random, 95% CI) | Subtotals only | |
| 7.1 Major infection | 6 | 291 | Risk Ratio (M‐H, Random, 95% CI) | 0.87 [0.50, 1.51] |
| 7.2 Herpes zoster virus | 3 | 199 | Risk Ratio (M‐H, Random, 95% CI) | 1.77 [0.63, 4.99] |
| 8 Malignancy Show forest plot | 2 | 117 | Risk Ratio (M‐H, Random, 95% CI) | 0.82 [0.07, 9.90] |
| 9 Bone toxicity Show forest plot | 3 | 197 | Risk Ratio (M‐H, Random, 95% CI) | 0.84 [0.40, 1.75] |
| 10 Bladder toxicity Show forest plot | 2 | 65 | Risk Ratio (M‐H, Random, 95% CI) | 2.66 [0.33, 21.68] |
| 11 Daily proteinuria Show forest plot | 3 | 92 | Mean Difference (IV, Random, 95% CI) | 0.15 [‐0.23, 0.54] |
| 12 Serum creatinine Show forest plot | 1 | 29 | Mean Difference (IV, Random, 95% CI) | ‐52.0 [‐111.39, 7.39] |
| 13 Creatinine clearance Show forest plot | 2 | 63 | Mean Difference (IV, Random, 95% CI) | 12.23 [‐0.13, 24.58] |
| Outcome or subgroup title | No. of studies | No. of participants | Statistical method | Effect size |
| 1 Death Show forest plot | 1 | 29 | Risk Ratio (M‐H, Random, 95% CI) | 0.53 [0.17, 1.68] |
| 2 Adverse renal outcomes Show forest plot | 1 | Risk Ratio (M‐H, Random, 95% CI) | Subtotals only | |
| 2.1 ESKD | 1 | 29 | Risk Ratio (M‐H, Random, 95% CI) | 0.21 [0.04, 1.02] |
| 2.2 Doubling of serum creatinine | 1 | 29 | Risk Ratio (M‐H, Random, 95% CI) | 0.16 [0.04, 0.69] |
| 3 Stable kidney function Show forest plot | 1 | 29 | Risk Ratio (M‐H, Random, 95% CI) | 1.59 [0.83, 3.06] |
| 4 Ovarian failure Show forest plot | 1 | 27 | Risk Ratio (M‐H, Random, 95% CI) | 7.32 [0.49, 108.96] |
| 5 Infection Show forest plot | 1 | Risk Ratio (M‐H, Random, 95% CI) | Subtotals only | |
| 5.1 Major infection | 1 | 29 | Risk Ratio (M‐H, Random, 95% CI) | 0.48 [0.10, 2.30] |
| 5.2 Herpes zoster virus | 1 | 29 | Risk Ratio (M‐H, Random, 95% CI) | 5.22 [0.33, 81.40] |
| 6 Bladder toxicity Show forest plot | 1 | 29 | Risk Ratio (M‐H, Random, 95% CI) | 2.43 [0.14, 42.17] |
| Outcome or subgroup title | No. of studies | No. of participants | Statistical method | Effect size |
| 1 Death Show forest plot | 3 | 78 | Risk Ratio (M‐H, Random, 95% CI) | 0.60 [0.36, 0.99] |
| 2 Complete remission of proteinuria Show forest plot | 2 | 37 | Risk Ratio (M‐H, Random, 95% CI) | 0.95 [0.54, 1.69] |
| 3 Adverse renal outcomes Show forest plot | 3 | Risk Ratio (M‐H, Random, 95% CI) | Subtotals only | |
| 3.1 ESKD | 2 | 54 | Risk Ratio (M‐H, Random, 95% CI) | 0.66 [0.17, 2.55] |
| 3.2 Renal relapse | 1 | 16 | Risk Ratio (M‐H, Random, 95% CI) | 0.78 [0.22, 2.74] |
| 3.3 Doubling of serum creatinine | 1 | 26 | Risk Ratio (M‐H, Random, 95% CI) | 0.98 [0.36, 2.68] |
| 4 Stable kidney function Show forest plot | 1 | 26 | Risk Ratio (M‐H, Random, 95% CI) | 1.01 [0.48, 2.14] |
| 5 Ovarian failure Show forest plot | 1 | 24 | Risk Ratio (M‐H, Random, 95% CI) | 2.58 [0.15, 43.86] |
| 6 Infection Show forest plot | 2 | Risk Ratio (M‐H, Random, 95% CI) | Subtotals only | |
| 6.1 Herpes zoster virus | 2 | 42 | Risk Ratio (M‐H, Random, 95% CI) | 3.56 [0.46, 27.79] |
| 7 Malignancy Show forest plot | 1 | 26 | Risk Ratio (M‐H, Random, 95% CI) | 2.0 [0.11, 37.22] |
| 8 Bone toxicity Show forest plot | 1 | 24 | Risk Ratio (M‐H, Random, 95% CI) | 3.55 [0.43, 29.42] |
| 9 Creatinine clearance Show forest plot | 1 | 24 | Mean Difference (IV, Random, 95% CI) | 5.0 [‐3.14, 13.14] |
| Outcome or subgroup title | No. of studies | No. of participants | Statistical method | Effect size |
| 1 Daily proteinuria Show forest plot | 1 | 10 | Mean Difference (IV, Random, 95% CI) | ‐1.8 [‐2.59, ‐1.01] |
| 2 Serum creatinine Show forest plot | 1 | 10 | Mean Difference (IV, Random, 95% CI) | ‐31.90 [‐73.63, 9.83] |
| 3 Creatinine clearance Show forest plot | 1 | 10 | Mean Difference (IV, Random, 95% CI) | ‐42.5 [‐85.02, 0.02] |
| Outcome or subgroup title | No. of studies | No. of participants | Statistical method | Effect size |
| 1 Adverse renal outcomes Show forest plot | 1 | Risk Ratio (M‐H, Random, 95% CI) | Subtotals only | |
| 1.1 Doubling of serum creatinine | 1 | 14 | Risk Ratio (M‐H, Random, 95% CI) | 0.0 [0.0, 0.0] |
| Outcome or subgroup title | No. of studies | No. of participants | Statistical method | Effect size |
| 1 Death Show forest plot | 2 | 125 | Risk Ratio (M‐H, Random, 95% CI) | 1.62 [0.64, 4.09] |
| 2 Adverse renal outcomes Show forest plot | 4 | 251 | Risk Ratio (M‐H, Random, 95% CI) | 0.89 [0.51, 1.55] |
| 2.1 ESKD | 3 | 143 | Risk Ratio (M‐H, Random, 95% CI) | 1.24 [0.60, 2.57] |
| 2.2 Doubling of serum creatinine | 2 | 51 | Risk Ratio (M‐H, Random, 95% CI) | 0.17 [0.02, 1.26] |
| 2.3 Deterioration of kidney function | 2 | 57 | Risk Ratio (M‐H, Random, 95% CI) | 0.53 [0.06, 4.83] |
| 3 Stable kidney function Show forest plot | 3 | 75 | Risk Ratio (M‐H, Random, 95% CI) | 1.10 [0.94, 1.30] |
| 4 Infection Show forest plot | 3 | Risk Ratio (M‐H, Random, 95% CI) | Subtotals only | |
| 4.1 Major infection | 2 | 125 | Risk Ratio (M‐H, Random, 95% CI) | 0.69 [0.35, 1.37] |
| 4.2 Herpes zoster virus | 2 | 104 | Risk Ratio (M‐H, Random, 95% CI) | 1.69 [0.10, 29.42] |
| 5 Leucopenia Show forest plot | 1 | 18 | Risk Ratio (M‐H, Random, 95% CI) | 2.60 [0.20, 34.07] |
| 6 Daily proteinuria Show forest plot | 2 | 30 | Mean Difference (IV, Random, 95% CI) | ‐0.56 [‐5.23, 4.11] |
| 7 Serum creatinine Show forest plot | 3 | 69 | Mean Difference (IV, Random, 95% CI) | ‐17.90 [‐23.41, ‐12.39] |
| 8 Creatinine clearance Show forest plot | 1 | 12 | Mean Difference (IV, Random, 95% CI) | 26.0 [‐17.60, 69.60] |
| 9 Disease activity (SLAM) Show forest plot | 1 | 18 | Mean Difference (IV, Random, 95% CI) | 0.67 [‐3.47, 4.81] |
| Outcome or subgroup title | No. of studies | No. of participants | Statistical method | Effect size |
| 1 Adverse renal outcomes Show forest plot | 1 | Risk Ratio (M‐H, Random, 95% CI) | Subtotals only | |
| 1.1 ESKD | 1 | 20 | Risk Ratio (M‐H, Random, 95% CI) | 0.24 [0.01, 4.44] |
| 2 Infection Show forest plot | 1 | Risk Ratio (M‐H, Random, 95% CI) | Subtotals only | |
| 2.1 Major infection | 1 | 20 | Risk Ratio (M‐H, Random, 95% CI) | 0.4 [0.02, 8.78] |
| 2.2 Herpes zoster virus | 1 | 20 | Risk Ratio (M‐H, Random, 95% CI) | 0.24 [0.01, 4.44] |
| 3 Leucopenia Show forest plot | 1 | 20 | Risk Ratio (M‐H, Random, 95% CI) | 0.24 [0.01, 4.44] |
| 4 Alopecia Show forest plot | 1 | 20 | Risk Ratio (M‐H, Random, 95% CI) | 0.0 [0.0, 0.0] |
| 5 Daily proteinuria Show forest plot | 1 | 20 | Mean Difference (IV, Random, 95% CI) | ‐0.10 [‐0.45, 0.25] |
| 6 Creatinine clearance Show forest plot | 1 | 20 | Mean Difference (IV, Random, 95% CI) | 15.30 [‐5.40, 36.00] |
| Outcome or subgroup title | No. of studies | No. of participants | Statistical method | Effect size |
| 1 Adverse renal outcomes Show forest plot | 1 | Risk Ratio (M‐H, Random, 95% CI) | Subtotals only | |
| 1.1 ESKD | 1 | 40 | Risk Ratio (M‐H, Random, 95% CI) | 0.4 [0.09, 1.83] |
| 1.2 Doubling of serum creatinine | 1 | 40 | Risk Ratio (M‐H, Random, 95% CI) | 0.43 [0.13, 1.43] |
| 1.3 Deterioration of kidney function | 1 | 40 | Risk Ratio (M‐H, Random, 95% CI) | 0.43 [0.13, 1.43] |
| 2 Stable kidney function Show forest plot | 1 | 40 | Risk Ratio (M‐H, Random, 95% CI) | 1.31 [0.90, 1.89] |
| 3 Ovarian failure Show forest plot | 1 | 29 | Risk Ratio (M‐H, Random, 95% CI) | 2.05 [0.60, 7.02] |
| 4 Infection Show forest plot | 1 | Risk Ratio (M‐H, Random, 95% CI) | Subtotals only | |
| 4.1 Major infection | 1 | 40 | Risk Ratio (M‐H, Random, 95% CI) | 1.0 [0.07, 14.90] |
| 4.2 Herpes zoster virus | 1 | 40 | Risk Ratio (M‐H, Random, 95% CI) | 0.5 [0.05, 5.08] |
| 5 Malignancy Show forest plot | 1 | 40 | Risk Ratio (M‐H, Random, 95% CI) | 3.0 [0.13, 69.52] |
| 6 Bone toxicity Show forest plot | 1 | 40 | Risk Ratio (M‐H, Random, 95% CI) | 1.33 [0.34, 5.21] |
| 7 Bladder toxicity Show forest plot | 1 | 40 | Risk Ratio (M‐H, Random, 95% CI) | 0.0 [0.0, 0.0] |
| Outcome or subgroup title | No. of studies | No. of participants | Statistical method | Effect size |
| 1 Death Show forest plot | 4 | Risk Ratio (M‐H, Random, 95% CI) | Subtotals only | |
| 1.1 At end of treatment duration or follow‐up | 4 | 451 | Risk Ratio (M‐H, Random, 95% CI) | 1.15 [0.34, 3.87] |
| 1.2 At 10 years | 1 | 87 | Risk Ratio (M‐H, Random, 95% CI) | 0.62 [0.11, 3.54] |
| 2 Renal relapse Show forest plot | 4 | Risk Ratio (M‐H, Random, 95% CI) | Subtotals only | |
| 2.1 At end of treatment duration or follow‐up | 4 | 452 | Risk Ratio (M‐H, Random, 95% CI) | 1.75 [1.20, 2.55] |
| 2.2 At 10 years | 1 | 87 | Risk Ratio (M‐H, Random, 95% CI) | 1.08 [0.69, 1.69] |
| 3 End‐stage kidney disease Show forest plot | 4 | Risk Ratio (M‐H, Random, 95% CI) | Subtotals only | |
| 3.1 At end of treatment duration or follow‐up | 4 | 452 | Risk Ratio (M‐H, Random, 95% CI) | 1.70 [0.52, 5.54] |
| 3.2 At 10 years | 1 | 87 | Risk Ratio (M‐H, Random, 95% CI) | 0.31 [0.03, 2.88] |
| 4 Doubling of serum creatinine Show forest plot | 4 | 452 | Risk Ratio (M‐H, Random, 95% CI) | 2.19 [1.03, 4.66] |
| 5 Ovarian failure Show forest plot | 2 | 177 | Risk Ratio (M‐H, Random, 95% CI) | 0.77 [0.17, 3.42] |
| 6 Infection Show forest plot | 3 | Risk Ratio (M‐H, Random, 95% CI) | Subtotals only | |
| 6.1 Major infection | 3 | 412 | Risk Ratio (M‐H, Random, 95% CI) | 1.08 [0.60, 1.96] |
| 6.2 Herpes zoster virus | 1 | 105 | Risk Ratio (M‐H, Random, 95% CI) | 1.27 [0.36, 4.48] |
| 7 Malignancy Show forest plot | 3 | Risk Ratio (M‐H, Random, 95% CI) | Subtotals only | |
| 7.1 At end of treatment duration or follow‐up | 3 | 370 | Risk Ratio (M‐H, Random, 95% CI) | 4.04 [0.45, 36.07] |
| 7.2 At 10 years | 1 | 87 | Risk Ratio (M‐H, Random, 95% CI) | 1.87 [0.18, 19.84] |
| 8 Leucopenia Show forest plot | 3 | 412 | Risk Ratio (M‐H, Random, 95% CI) | 5.61 [1.68, 18.72] |
| 9 Bone toxicity Show forest plot | 1 | 105 | Risk Ratio (M‐H, Random, 95% CI) | 3.06 [0.13, 73.36] |
| 10 Alopecia Show forest plot | 3 | 412 | Risk Ratio (M‐H, Random, 95% CI) | 0.95 [0.46, 1.95] |
| 11 Gastrointestinal (GI) adverse events Show forest plot | 3 | Risk Ratio (M‐H, Random, 95% CI) | Subtotals only | |
| 11.1 GI symptoms | 1 | 105 | Risk Ratio (M‐H, Random, 95% CI) | 1.02 [0.41, 2.51] |
| 11.2 Nausea | 2 | 307 | Risk Ratio (M‐H, Random, 95% CI) | 1.08 [0.65, 1.80] |
| 11.3 Diarrhoea | 2 | 307 | Risk Ratio (M‐H, Random, 95% CI) | 0.74 [0.31, 1.73] |
| 11.4 Vomiting | 2 | 307 | Risk Ratio (M‐H, Random, 95% CI) | 0.81 [0.18, 3.62] |
| 12 Daily proteinuria Show forest plot | 1 | 81 | Mean Difference (IV, Random, 95% CI) | 0.40 [‐0.53, 1.33] |
| Outcome or subgroup title | No. of studies | No. of participants | Statistical method | Effect size |
| 1 Death Show forest plot | 1 | 69 | Risk Ratio (M‐H, Random, 95% CI) | 0.0 [0.0, 0.0] |
| 2 Adverse renal outcomes Show forest plot | 1 | Risk Ratio (M‐H, Random, 95% CI) | Subtotals only | |
| 2.1 ESKD | 1 | 69 | Risk Ratio (M‐H, Random, 95% CI) | 0.0 [0.0, 0.0] |
| 2.2 Renal relapse | 1 | 69 | Risk Ratio (M‐H, Random, 95% CI) | 1.25 [0.51, 3.06] |
| 3 Infection Show forest plot | 1 | Risk Ratio (M‐H, Random, 95% CI) | Subtotals only | |
| 3.1 Major infection | 1 | 69 | Risk Ratio (M‐H, Random, 95% CI) | 2.18 [1.01, 4.73] |
| 4 Leucopenia Show forest plot | 1 | 69 | Risk Ratio (M‐H, Random, 95% CI) | 2.73 [0.95, 7.86] |
| 5 Gastrointestinal (GI) adverse events Show forest plot | 1 | Risk Ratio (M‐H, Random, 95% CI) | Subtotals only | |
| 5.1 GI disturbance | 1 | 69 | Risk Ratio (M‐H, Random, 95% CI) | 0.30 [0.09, 0.97] |
| 6 Daily proteinuria Show forest plot | 1 | 69 | Mean Difference (IV, Random, 95% CI) | 0.15 [‐0.23, 0.53] |
| 7 Disease activity (SLEDAI) Show forest plot | 1 | 69 | Mean Difference (IV, Random, 95% CI) | ‐3.20 [‐5.77, ‐0.63] |
| Outcome or subgroup title | No. of studies | No. of participants | Statistical method | Effect size |
| 1 Death Show forest plot | 1 | 39 | Risk Ratio (M‐H, Random, 95% CI) | 0.12 [0.01, 2.03] |
| 2 Adverse renal outcomes Show forest plot | 1 | Risk Ratio (M‐H, Random, 95% CI) | Subtotals only | |
| 2.1 ESKD | 1 | 39 | Risk Ratio (M‐H, Random, 95% CI) | 0.35 [0.04, 3.09] |
| 2.2 Renal relapse | 1 | 39 | Risk Ratio (M‐H, Random, 95% CI) | 0.79 [0.34, 1.85] |
| 2.3 Doubling of serum creatinine | 1 | 39 | Risk Ratio (M‐H, Random, 95% CI) | 0.79 [0.34, 1.85] |
| 3 Bladder toxicity Show forest plot | 1 | 39 | Risk Ratio (M‐H, Random, 95% CI) | 0.0 [0.0, 0.0] |
| 4 Creatinine clearance Show forest plot | 1 | 38 | Mean Difference (IV, Random, 95% CI) | ‐15.70 [‐23.71, ‐7.69] |
| Outcome or subgroup title | No. of studies | No. of participants | Statistical method | Effect size |
| 1 Adverse renal outcomes Show forest plot | 1 | Risk Ratio (M‐H, Random, 95% CI) | Subtotals only | |
| 1.1 Renal relapse | 1 | 70 | Risk Ratio (M‐H, Random, 95% CI) | 6.62 [0.35, 123.63] |
| 2 Infection Show forest plot | 1 | Risk Ratio (M‐H, Random, 95% CI) | Subtotals only | |
| 2.1 Major infection | 1 | 70 | Risk Ratio (M‐H, Random, 95% CI) | 1.26 [0.30, 5.22] |
| 3 Gastrointestinal (GI) adverse events Show forest plot | 1 | Risk Ratio (M‐H, Random, 95% CI) | Subtotals only | |
| 3.1 GI disturbance | 1 | 70 | Risk Ratio (M‐H, Random, 95% CI) | 1.89 [0.18, 19.89] |
| Outcome or subgroup title | No. of studies | No. of participants | Statistical method | Effect size |
| 1 Relapse Show forest plot | 1 | Risk Ratio (M‐H, Random, 95% CI) | Subtotals only | |
| 1.1 Renal relapse | 1 | 15 | Risk Ratio (M‐H, Random, 95% CI) | 0.38 [0.05, 2.88] |
| 1.2 Non‐renal relapse | 1 | 15 | Risk Ratio (M‐H, Random, 95% CI) | 0.38 [0.02, 7.96] |
| 2 Major infection Show forest plot | 1 | 15 | Risk Ratio (M‐H, Random, 95% CI) | 0.57 [0.06, 5.03] |
| Outcome or subgroup title | No. of studies | No. of participants | Statistical method | Effect size |
| 1 Creatinine clearance Show forest plot | 1 | 13 | Mean Difference (IV, Random, 95% CI) | 2.20 [‐37.85, 42.25] |
| 2 Daily proteinuria Show forest plot | 1 | 13 | Mean Difference (IV, Random, 95% CI) | ‐0.08 [‐0.95, 0.79] |
| 3 Serum creatinine Show forest plot | 1 | 14 | Mean Difference (IV, Random, 95% CI) | ‐35.40 [‐128.90, 58.10] |