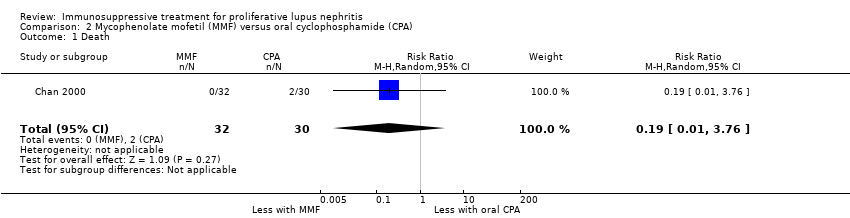
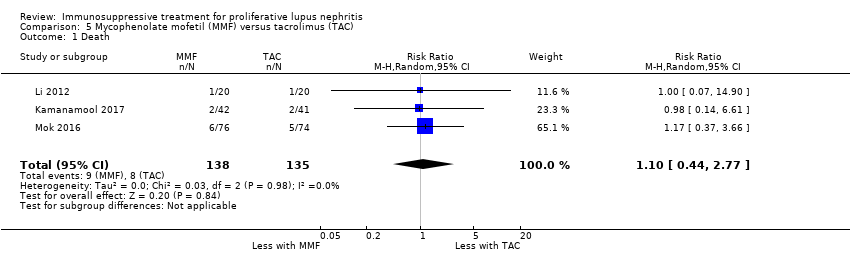
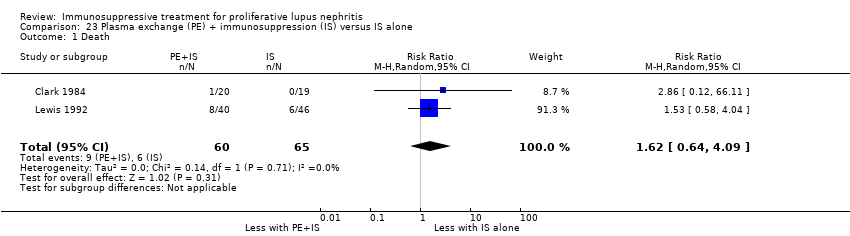
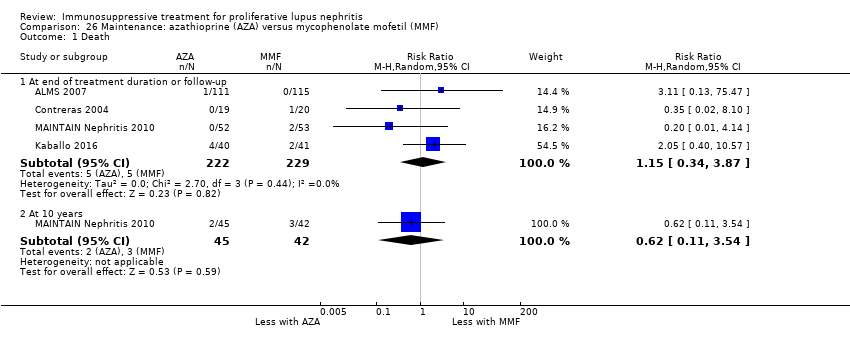
| 1 Death Show forest plot | 3 | | Risk Ratio (M‐H, Random, 95% CI) | Subtotals only |
|
| 1.1 Death | 3 | 153 | Risk Ratio (M‐H, Random, 95% CI) | 0.41 [0.06, 2.69] |
| 1.2 Death: extended follow‐up | 1 | 38 | Risk Ratio (M‐H, Random, 95% CI) | 0.0 [0.0, 0.0] |
| 2 Remission Show forest plot | 4 | | Risk Ratio (M‐H, Random, 95% CI) | Subtotals only |
|
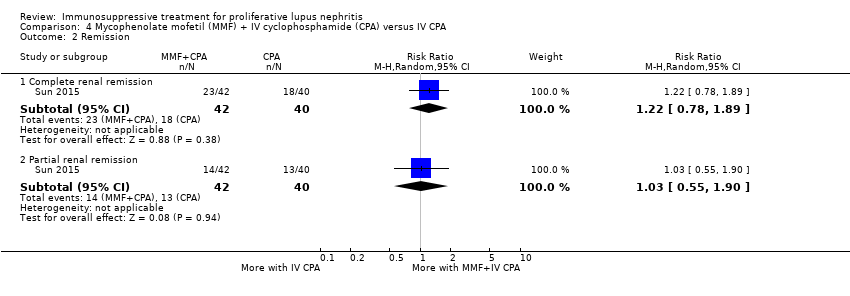
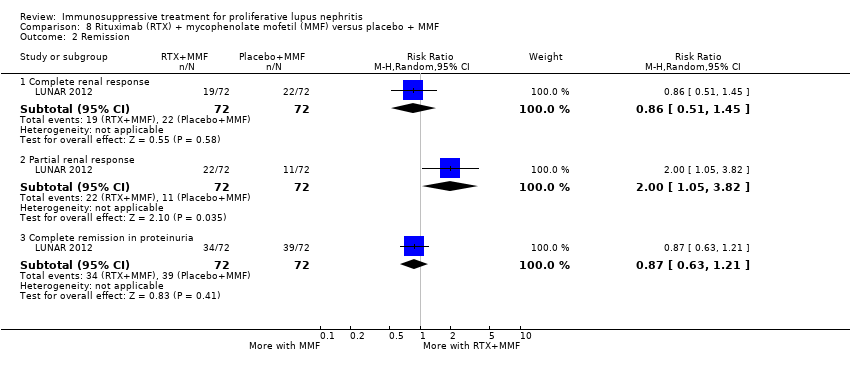
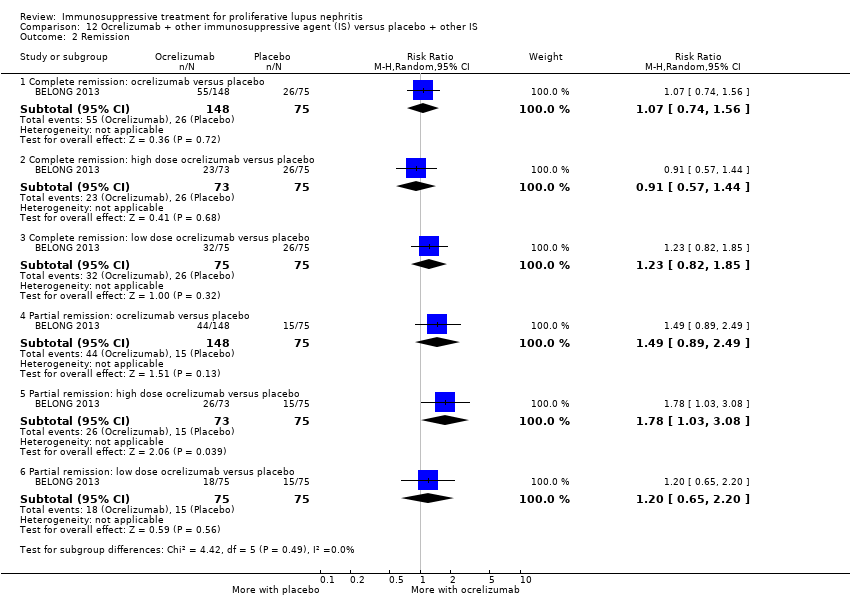
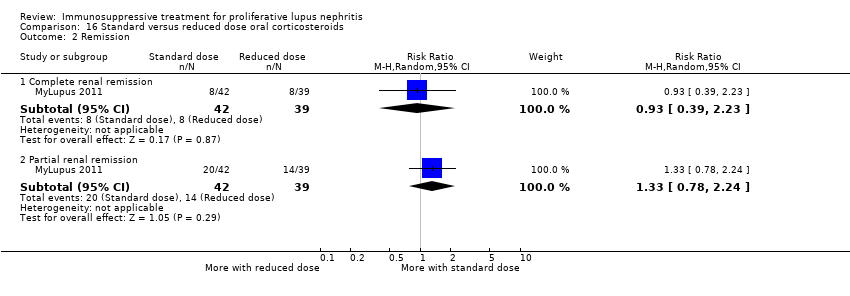
| 2.1 Complete renal remission | 4 | 178 | Risk Ratio (M‐H, Random, 95% CI) | 1.35 [0.94, 1.93] |
| 2.2 Partial renal remission | 4 | 178 | Risk Ratio (M‐H, Random, 95% CI) | 0.88 [0.61, 1.26] |
| 2.3 Complete remission in proteinuria | 3 | 105 | Risk Ratio (M‐H, Random, 95% CI) | 1.71 [1.08, 2.70] |
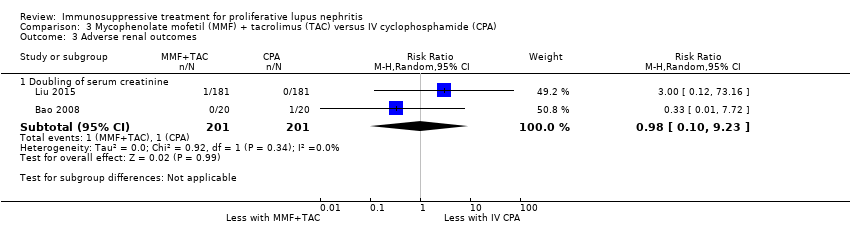
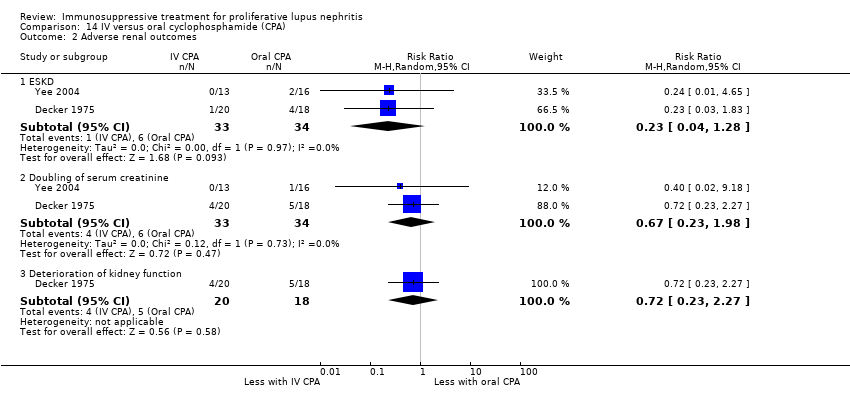
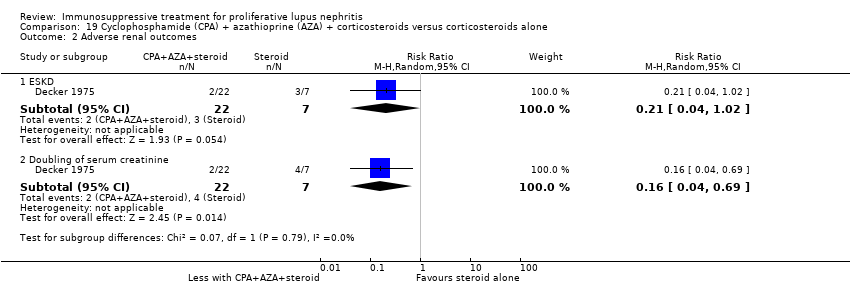
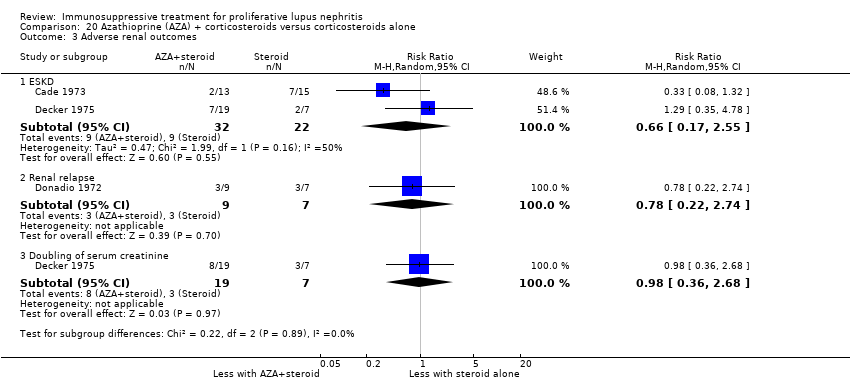
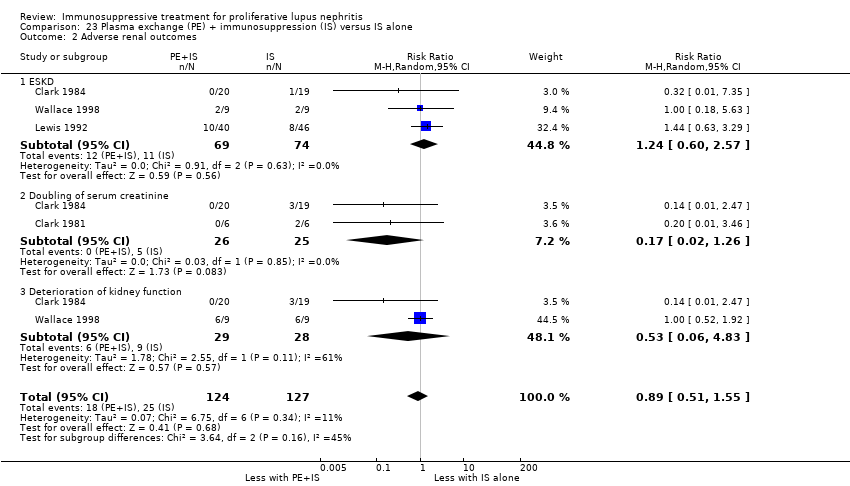
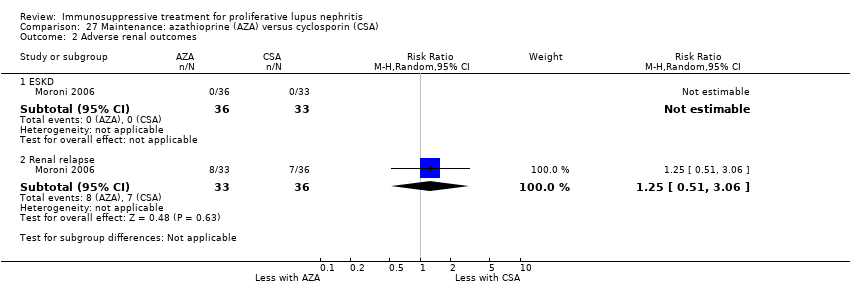
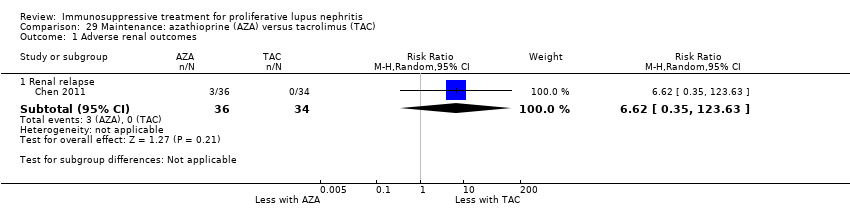
| 3 Adverse renal outcomes Show forest plot | 2 | | Risk Ratio (M‐H, Random, 95% CI) | Subtotals only |
|
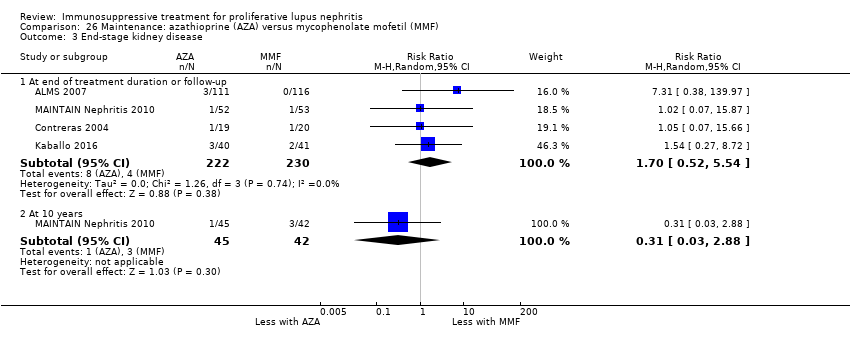
| 3.1 ESKD: extended follow‐up | 1 | 38 | Risk Ratio (M‐H, Random, 95% CI) | 1.0 [0.07, 14.85] |
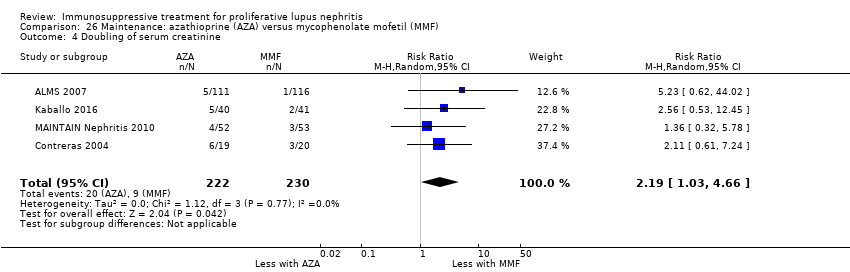
| 3.2 Doubling of serum creatinine | 1 | 40 | Risk Ratio (M‐H, Random, 95% CI) | 0.33 [0.01, 7.72] |
| 3.3 Doubling of serum creatinine: extended follow‐up | 1 | 38 | Risk Ratio (M‐H, Random, 95% CI) | 1.0 [0.16, 6.38] |
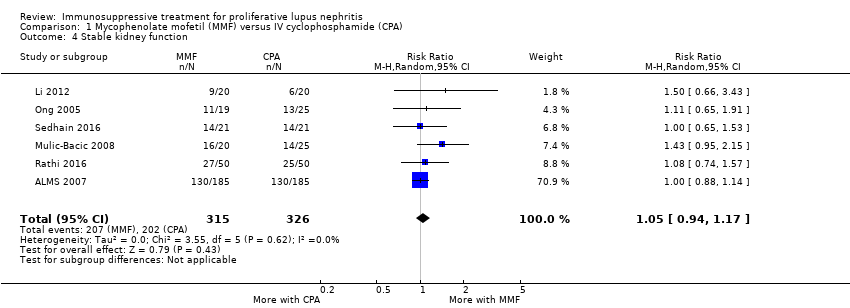
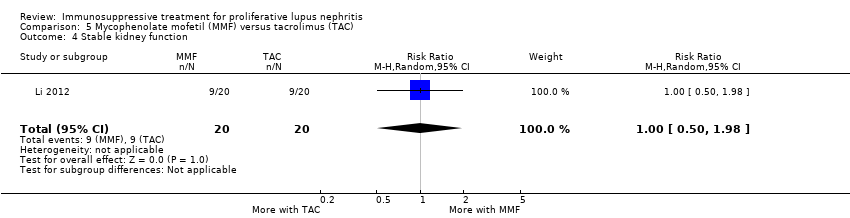
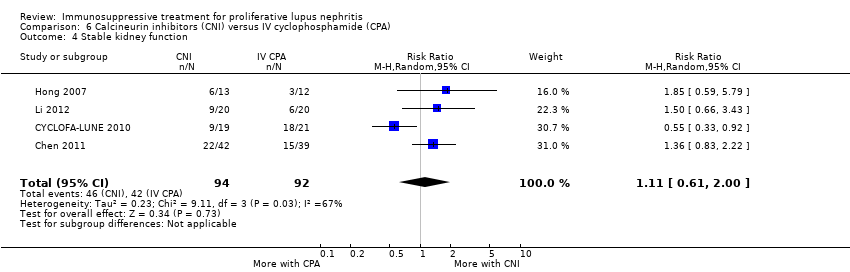
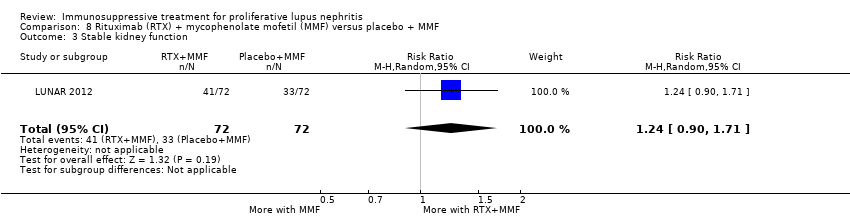
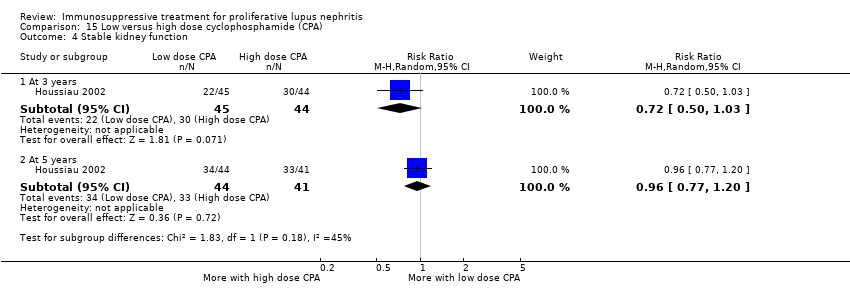
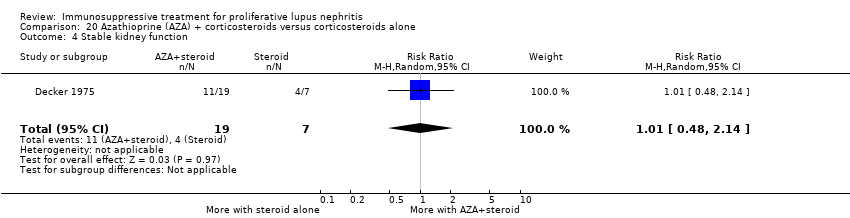
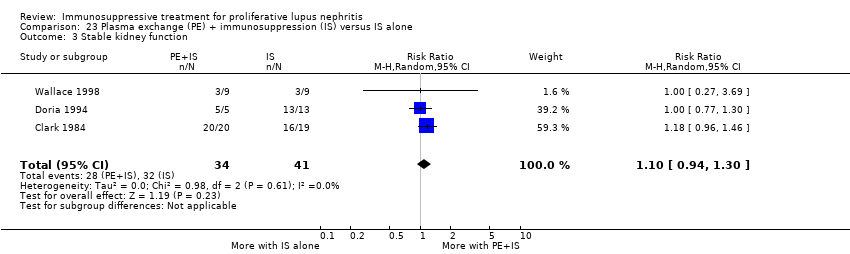
| 4 Stable kidney function Show forest plot | 4 | 186 | Risk Ratio (M‐H, Random, 95% CI) | 1.11 [0.61, 2.00] |
|
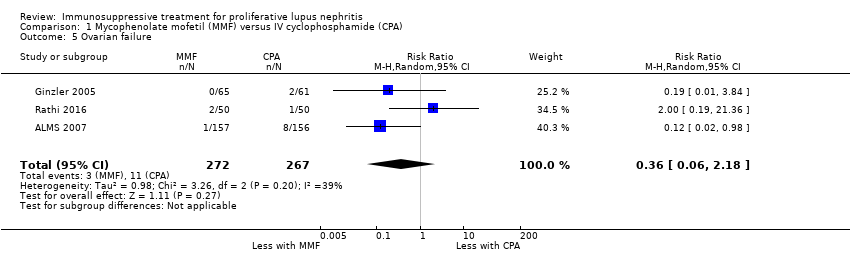
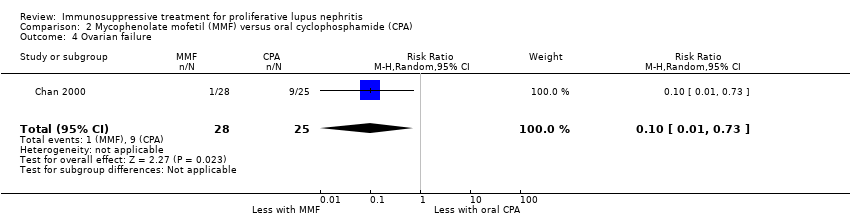
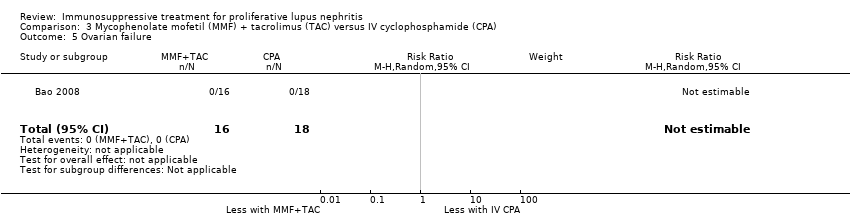
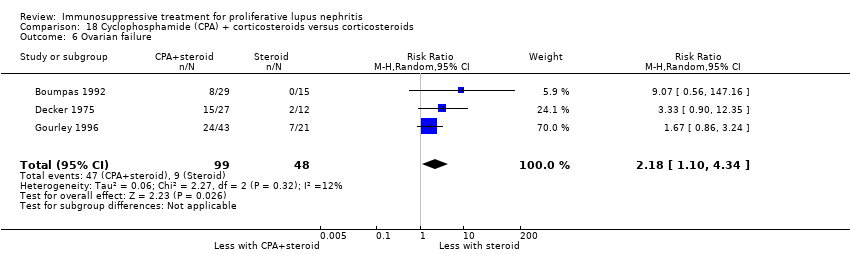
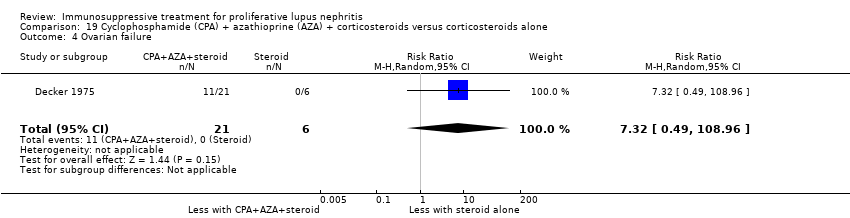
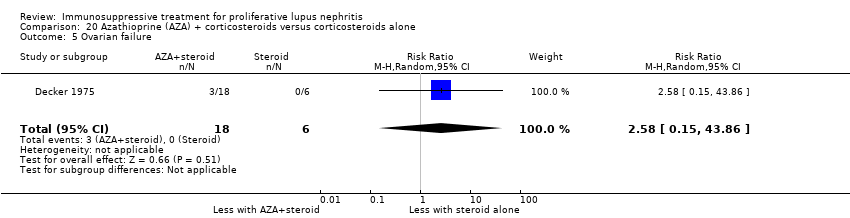
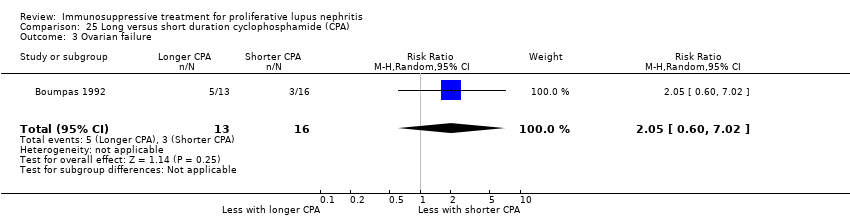
| 5 Ovarian failure Show forest plot | 2 | | Risk Ratio (M‐H, Random, 95% CI) | Subtotals only |
|
| 5.1 Ovarian failure | 2 | 113 | Risk Ratio (M‐H, Random, 95% CI) | 0.25 [0.03, 2.18] |
| 5.2 Premature ovarian failure: extended follow‐up | 1 | 27 | Risk Ratio (M‐H, Random, 95% CI) | 0.31 [0.01, 7.02] |
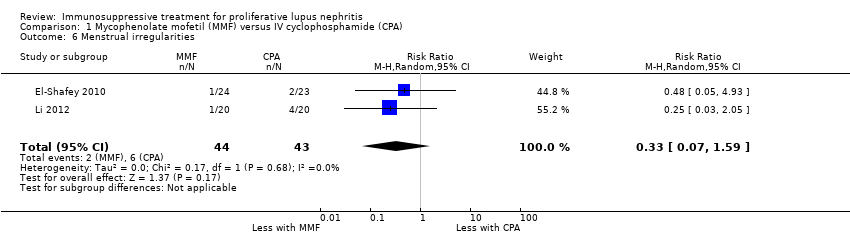
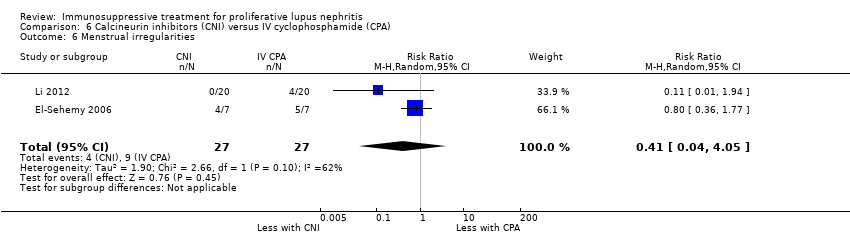
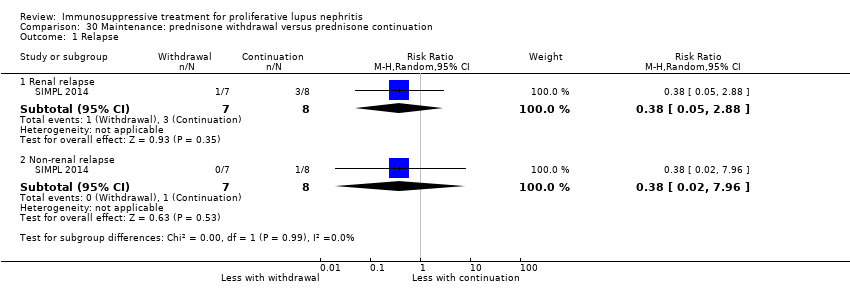
| 6 Menstrual irregularities Show forest plot | 2 | 54 | Risk Ratio (M‐H, Random, 95% CI) | 0.41 [0.04, 4.05] |
|
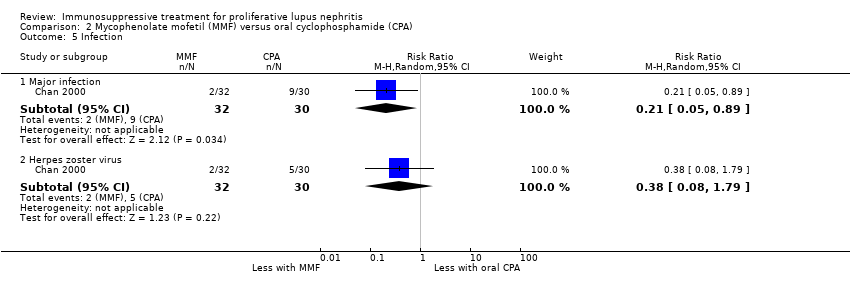
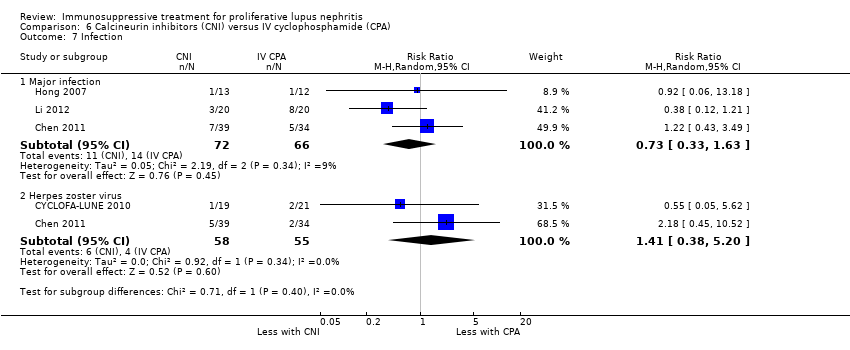
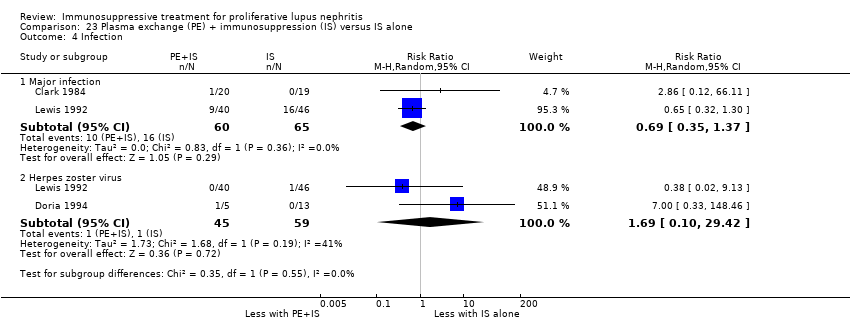
| 7 Infection Show forest plot | 4 | | Risk Ratio (M‐H, Random, 95% CI) | Subtotals only |
|
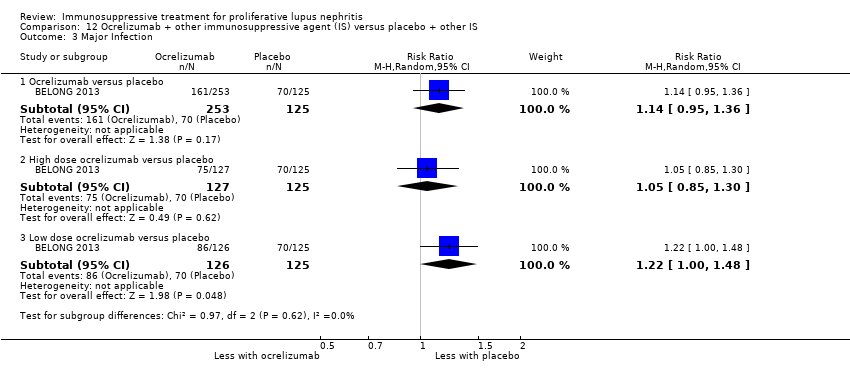
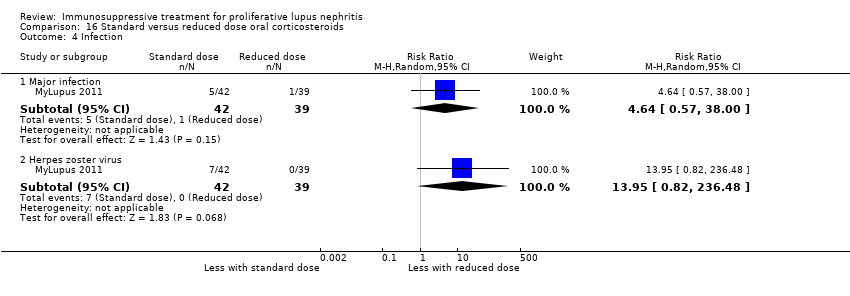
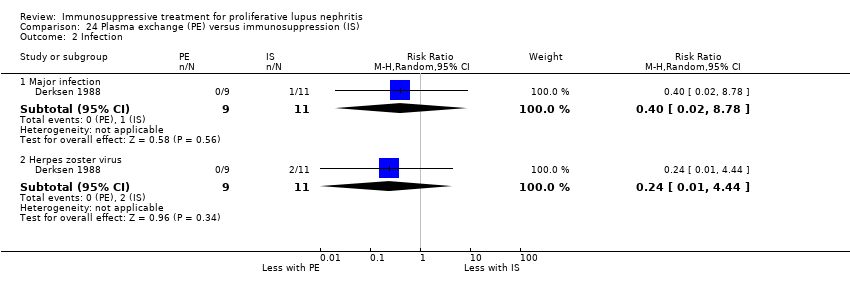
| 7.1 Major infection | 3 | 138 | Risk Ratio (M‐H, Random, 95% CI) | 0.73 [0.33, 1.63] |
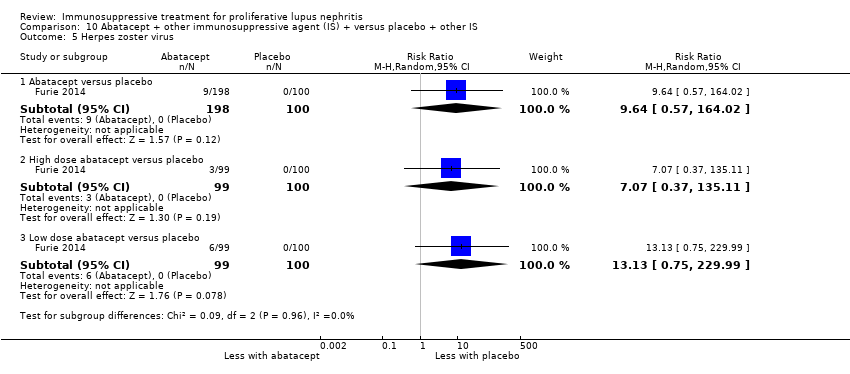
| 7.2 Herpes zoster virus | 2 | 113 | Risk Ratio (M‐H, Random, 95% CI) | 1.41 [0.38, 5.20] |
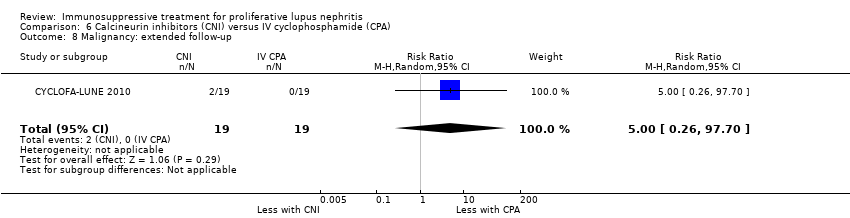
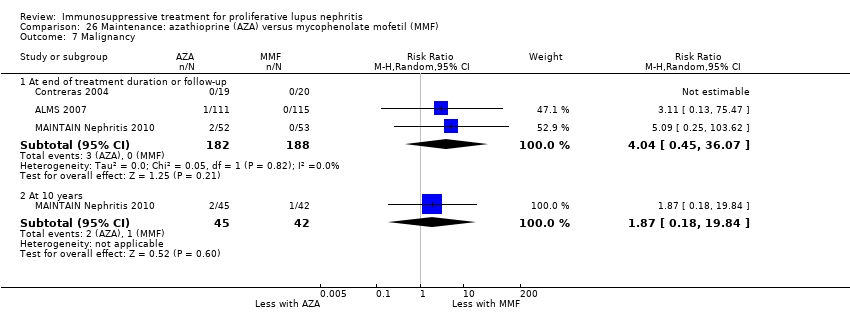
| 8 Malignancy: extended follow‐up Show forest plot | 1 | 38 | Risk Ratio (M‐H, Random, 95% CI) | 5.0 [0.26, 97.70] |
|
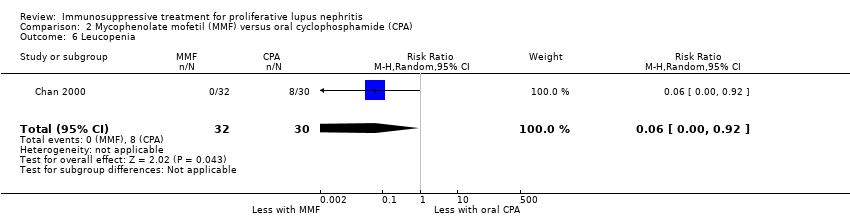
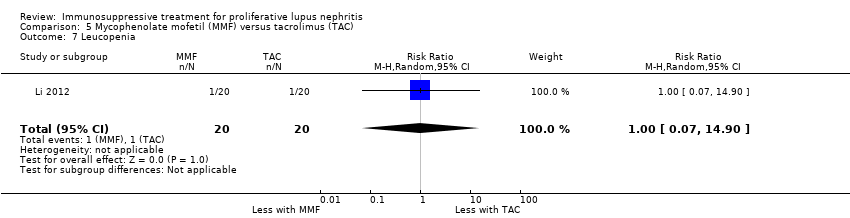
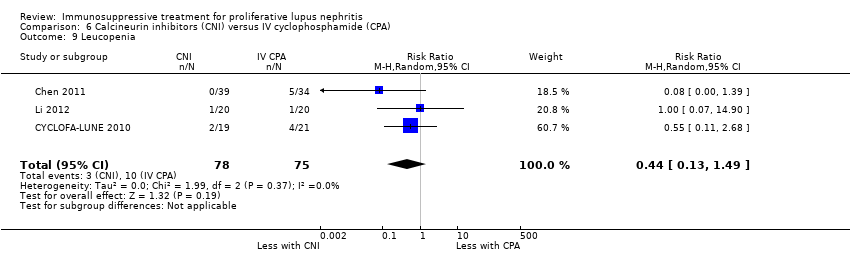
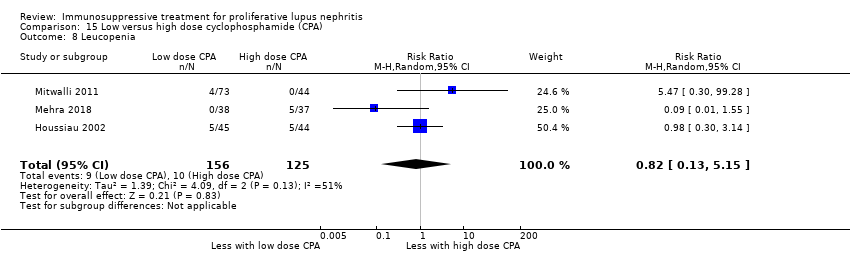
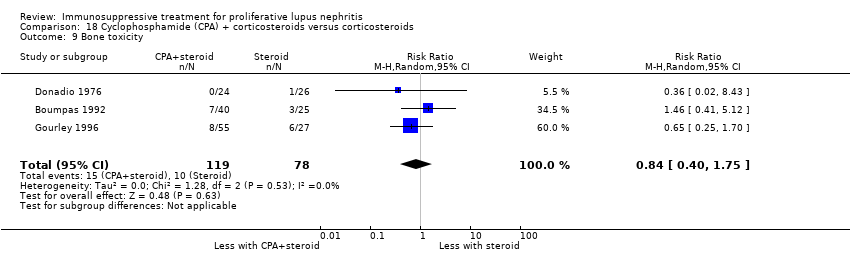
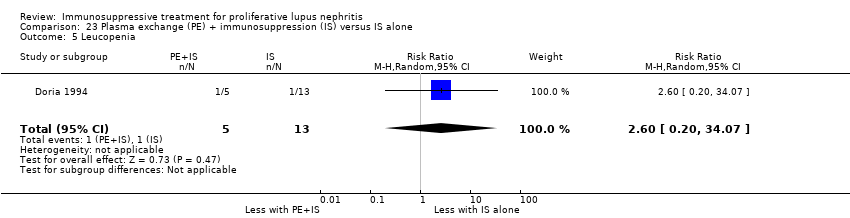
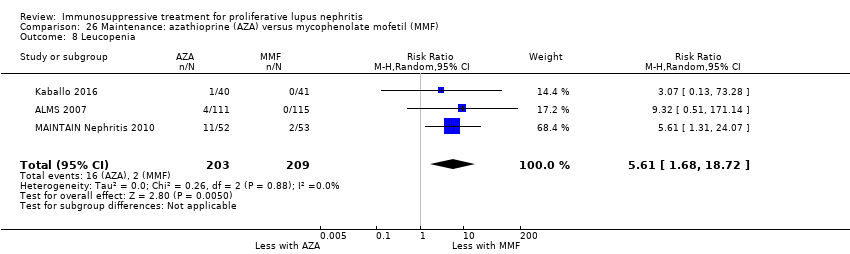
| 9 Leucopenia Show forest plot | 3 | 153 | Risk Ratio (M‐H, Random, 95% CI) | 0.44 [0.13, 1.49] |
|
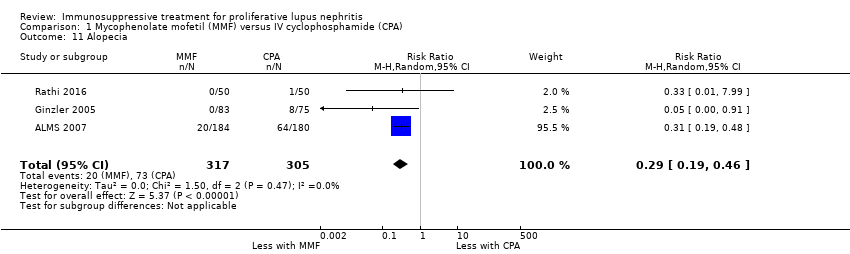
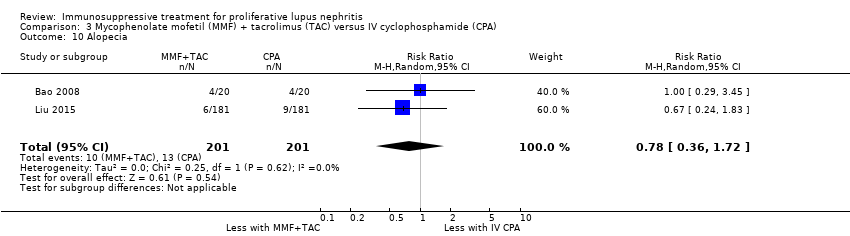
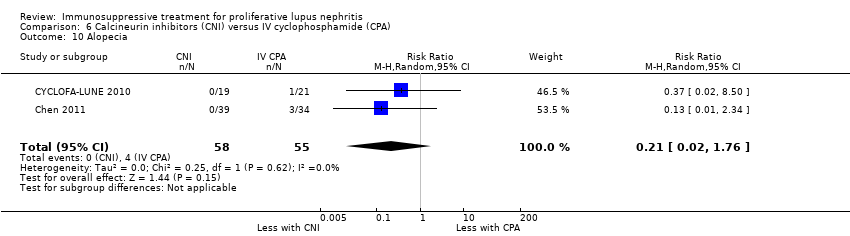
| 10 Alopecia Show forest plot | 2 | 113 | Risk Ratio (M‐H, Random, 95% CI) | 0.21 [0.02, 1.76] |
|
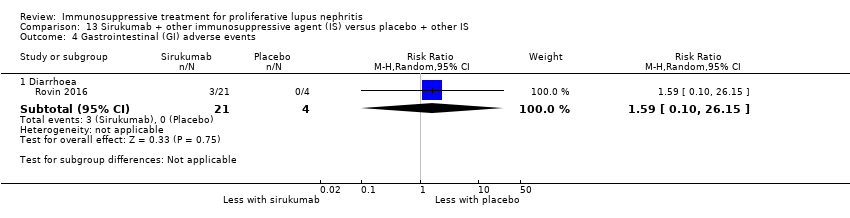
| 11 Gastrointestinal (GI) adverse events Show forest plot | 1 | 73 | Risk Ratio (M‐H, Random, 95% CI) | 0.35 [0.12, 1.01] |
|
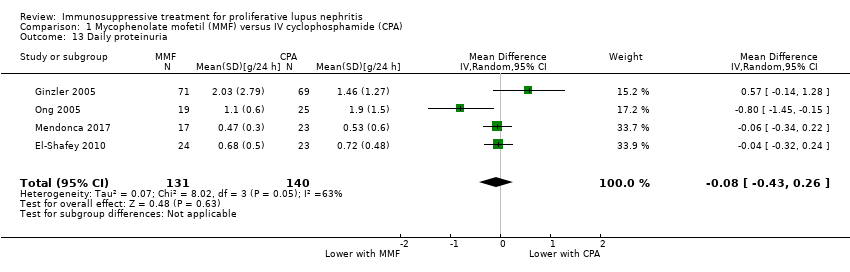
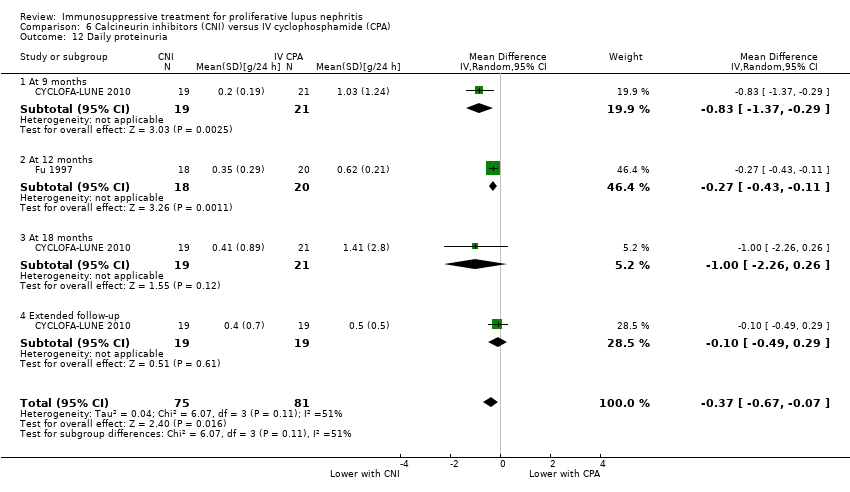
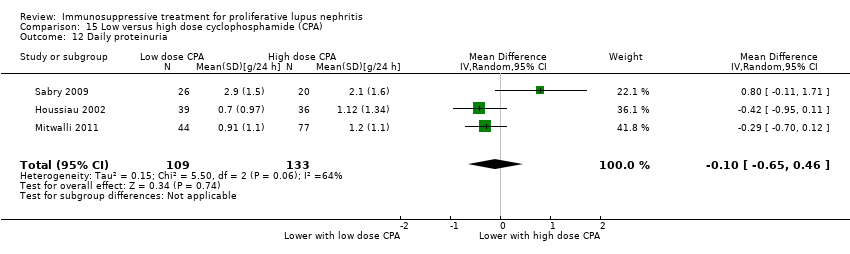
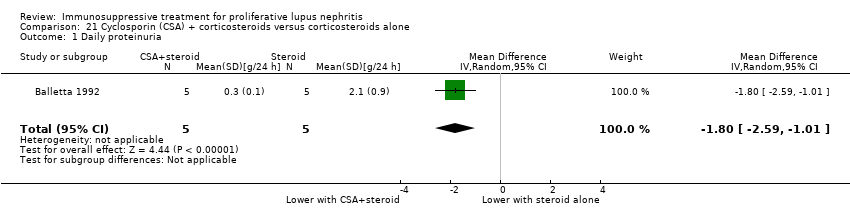
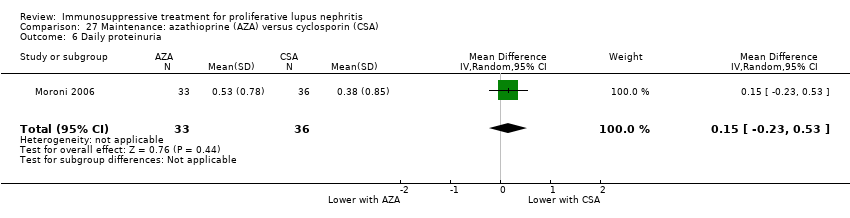
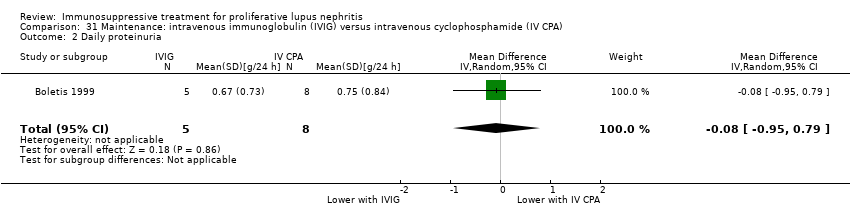
| 12 Daily proteinuria Show forest plot | 2 | 156 | Mean Difference (IV, Random, 95% CI) | ‐0.37 [‐0.67, ‐0.07] |
|
| 12.1 At 9 months | 1 | 40 | Mean Difference (IV, Random, 95% CI) | ‐0.83 [‐1.37, ‐0.29] |
| 12.2 At 12 months | 1 | 38 | Mean Difference (IV, Random, 95% CI) | ‐0.27 [‐0.43, ‐0.11] |
| 12.3 At 18 months | 1 | 40 | Mean Difference (IV, Random, 95% CI) | ‐1.0 [‐2.26, 0.26] |
| 12.4 Extended follow‐up | 1 | 38 | Mean Difference (IV, Random, 95% CI) | ‐0.10 [‐0.49, 0.29] |
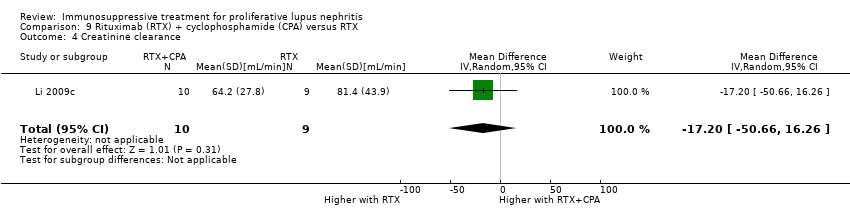
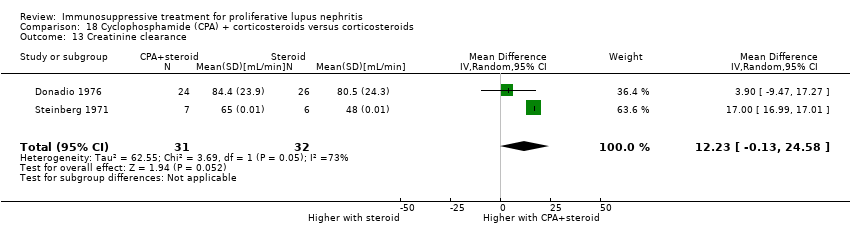
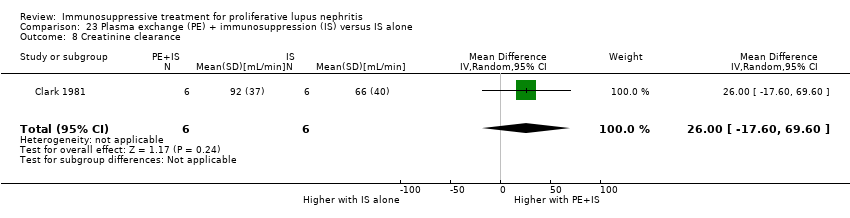
| 13 Creatinine clearance Show forest plot | 3 | | Mean Difference (IV, Random, 95% CI) | Subtotals only |
|
| 13.1 At 6 months | 1 | 150 | Mean Difference (IV, Random, 95% CI) | 11.70 [1.61, 21.79] |
| 13.2 At 9 months | 1 | 40 | Mean Difference (IV, Random, 95% CI) | 14.90 [1.35, 28.45] |
| 13.3 At 12 months | 1 | 38 | Mean Difference (IV, Random, 95% CI) | ‐15.70 [‐23.71, ‐7.69] |
| 13.4 At 18 months | 1 | 40 | Mean Difference (IV, Random, 95% CI) | ‐1.40 [‐17.25, 14.45] |
| 14 Serum creatinine Show forest plot | 1 | | Mean Difference (IV, Random, 95% CI) | Subtotals only |
|
| 14.1 At 9 months | 1 | 40 | Mean Difference (IV, Random, 95% CI) | 12.70 [1.88, 23.52] |
| 14.2 At 18 months | 1 | 40 | Mean Difference (IV, Random, 95% CI) | 2.70 [‐11.50, 16.90] |
| 14.3 Extended follow‐up | 1 | 38 | Mean Difference (IV, Random, 95% CI) | ‐8.0 [‐20.35, 4.35] |