Non‐invasive ventilation for cystic fibrosis
Referencias
References to studies included in this review
References to studies excluded from this review
References to studies awaiting assessment
Additional references
References to other published versions of this review
Characteristics of studies
Characteristics of included studies [ordered by study ID]
| Methods | RCT. Parallel design. Location: 2 hospital sites. | |
| Participants | 40 adults with CF and an acute exacerbation (defined as needing intravenous antibiotics and four or more signs or symptoms from criteria by Fuchs (Fuchs 1994). Moderate to severe disease FEV₁ <60% predicted. NIV group Mean (SD) age: 28 (7) years. Gender n (%): 6 (32) females. BMI mean (SD): 21.4 (3.1) kg/m². FVC mean (SD): 61 (15) % predicted. PImax mean (SD): 87 (32) % predicted. PEmax mean (SD): 70 (22) % predicted. Control group Mean (SD) age: 30 (9) years. Gender n (%): 8 (38) females. BMI mean (SD): 20.4 (3.0) kg/m². FVC mean (SD): 63 (15) % predicted. PImax mean (SD): 93 (30) % predicted. PEmax mean (SD): 92 (41) % predicted. | |
| Interventions | Intervention (n = 19): versus standard airway clearance + NIV delivered by a nasal mask or mouthpiece. Control: standard airway clearance. NIV: mean (SD) IPAP 13 cm H₂0 (2); mean (SD) EPAP: 5 cm H₂0 (1). Standard airway clearance = ACBT+ percussions; vibrations; postural drainage; some other techniques were also used for some treatments. | |
| Outcomes | Primary outcome measure: change in FEV₁ % predicted from admission to discharge. Secondary outcome measures: visual analogue score; modified shuttle walk test; shortness of breath; sputum volume; energy levels; PImax, PEmax; quality of life (CFQ); quantitative sputum microbiology, length of admission; time to next hospital admission. | |
| Notes | ||
| Risk of bias | ||
| Bias | Authors' judgement | Support for judgement |
| Random sequence generation (selection bias) | Low risk | "Computer‐generated block randomisation". |
| Allocation concealment (selection bias) | Low risk | Randomisation schedule was "... stored in sealed sequentially numbered opaque envelopes opened after consent signed". |
| Blinding (performance bias and detection bias) | High risk | It is not possible to blind participants or assessors to the intervention. |
| Incomplete outcome data (attrition bias) | Low risk | All participants accounted for. Three participants withdrew from the study and the data from these participants were used, as available and appropriate, in the analyses of daily rate of improvement, length of stay and time to next hospital admission. |
| Selective reporting (reporting bias) | Low risk | All the outcomes listed in the paper's methodology are the same as those presented in the results section of the full paper. |
| Other bias | Low risk | Methods of statistical analysis were described. |
| Methods | RCT. Cross‐over design. Duration: single session. | |
| Participants | 16 participants with CF. Stable participants. | |
| Interventions | Session 1: CPT (10 to 15 forced expiration manoeuvres separated by rest periods) and inspiratory PSV via nasal mask using pressure support generator. Sessions 20 minutes each but time between sessions unclear ‐ paper states sessions were conducted on 2 different days at the same time of day by same physiotherapist. | |
| Outcomes | Lung function (FVC; FEV₁; PEF; FEF25%; FEF50%; FEF25‐75%), airway resistance, SpO₂; RR; PImax; PEmax; sputum weight; subjective participants impressions of fatigue, ease sputum clearance; participant preference (1 = worse to 3 = marked preference). | |
| Notes | ||
| Risk of bias | ||
| Bias | Authors' judgement | Support for judgement |
| Random sequence generation (selection bias) | Unclear risk | States order of intervention was randomised, but no details given. |
| Allocation concealment (selection bias) | Unclear risk | Not discussed. |
| Blinding (performance bias and detection bias) | Unclear risk | Participants' subjective impressions were evaluated by individuals who were not involved in the trial and were unaware of the treatment regimen; but it was not reported who was responsible for collecting and weighing secretions and lung function testing. |
| Incomplete outcome data (attrition bias) | Low risk | All participants were accounted for. |
| Selective reporting (reporting bias) | Low risk | All outcome measures were reported. |
| Other bias | Low risk | Methods of statistical analysis were described. |
| Methods | RCT. Cross‐over design. Duration: 3 nights within a 15‐day period. | |
| Participants | Six participants with CF and moderate to severe lung disease and significant gas exchange abnormalities during sleep. Stable participants. FEV₁% predicted mean (SD): 29.4% (3.4). | |
| Interventions | Session 1: room air. | |
| Outcomes | TST; sleep latency; NREM; NREM %TST; REM min; REM %TST; undetermined % TST; total arousals; arousal index; SaO₂; TcCO₂. | |
| Notes | ||
| Risk of bias | ||
| Bias | Authors' judgement | Support for judgement |
| Random sequence generation (selection bias) | Unclear risk | Stated as randomised, methods not discussed. |
| Allocation concealment (selection bias) | Unclear risk | Not discussed. |
| Blinding (performance bias and detection bias) | Unclear risk | Participants were obviously aware of the intervention being administered; however, all were reportedly unaware of the purpose of the trial with participants and sleep technicians blinded to the results until completion of the third night. |
| Incomplete outcome data (attrition bias) | Unclear risk | 2 participants dropped out due to non‐tolerance of NIV; it was not explicitly stated that intention‐to‐treat was not used, but results are based on the remaining 6 participants who completed the trial. |
| Selective reporting (reporting bias) | Low risk | All outcome measures were reported. |
| Other bias | Unclear risk | Methods of statistical analysis were described. |
| Methods | RCT (order of intervention was randomised on days 3 and 4 of hospital admission). Cross‐over design. Duration: single intervention of each. | |
| Participants | 26 participants with CF and moderate to severe disease. Acute participants. | |
| Interventions | Session 1: CPT by ACBT i.e. (thoracic expansion x6, breathing control) x2, FET and cough as required. Session 2: ACBT as above with NIV via nasal mask with heated humidification entrained. NIV range: IPAP 10 ‐ 12 cm H₂0; EPAP 4 ‐ 5 cm H₂0. | |
| Outcomes | FVC; FEV₁; FEF25‐75; PImax; PEmax; SpO₂; sputum weight; Borg breathlessness score; participant preference. | |
| Notes | ||
| Risk of bias | ||
| Bias | Authors' judgement | Support for judgement |
| Random sequence generation (selection bias) | Unclear risk | States order of intervention was randomised, but no details given. |
| Allocation concealment (selection bias) | Unclear risk | Not discussed. |
| Blinding (performance bias and detection bias) | Low risk | An independent data collector who was blinded to the treatment order obtained all measurements. |
| Incomplete outcome data (attrition bias) | Low risk | Information provided about 1 drop out at the start of testing. |
| Selective reporting (reporting bias) | Low risk | All outcome measures were reported. |
| Other bias | Unclear risk | Methods of statistical analysis were described. |
| Methods | RCT. Cross‐over design. Duration: single sessions on 2 successive days, time between 2 sessions is 1 day. | |
| Participants | 20 participants with CF. No detail on whether participants are in acute or stable state, but participants have mean (SD) Swachman‐Kowalski score of 80.8 (15.3) indicating that they have mild disease. | |
| Interventions | Session 1: PEP treatment (no details of PEP treatment). | |
| Outcomes | FEV₁; FVC; SaO₂; FEF25‐75; MEF50; FEF25‐75; participant preference. | |
| Notes | ||
| Risk of bias | ||
| Bias | Authors' judgement | Support for judgement |
| Random sequence generation (selection bias) | Unclear risk | States order of intervention was randomised, but no details given. |
| Allocation concealment (selection bias) | Unclear risk | Not discussed. |
| Blinding (performance bias and detection bias) | Unclear risk | Data collection was not described. |
| Incomplete outcome data (attrition bias) | Low risk | All participants were accounted for. |
| Selective reporting (reporting bias) | Unclear risk | Not clear whether all outcomes measured were reported in this abstract. |
| Other bias | Unclear risk | Methods of statistical analysis were not described. |
| Methods | RCT. Cross‐over design. Duration: single session, each 24 to 48 hrs apart. | |
| Participants | 13 participants with CF. Mild, moderate and severe lung disease. Stable state with no history of hospitalisation for respiratory failure in previous 3 months. Mean FEV₁ % predicted: 62%. Mean BMI: 33.78 kg/m². | |
| Interventions | Session 1: 6MWT with (type of interface unclear). Session 2: 6MWT with no NIV. 6MWT speed 2.5 km/h and increased every 30 seconds up to a maximum of 7 km/h. NIV: IPAP 12 cm H₂0; EPAP mean (SD) 6 (2) cm H₂0. | |
| Outcomes | Walking distance, spirometry (FEV₁, FVC, FEF 25‐75), OEP (TV, MV, Vprc, Vab), RR, HR, SpO₂. OEP and spirometry measured before and 5 min after test. RR, HR and SpO₂ measured immediately before, immediately after and 5 min after test. | |
| Notes | ||
| Risk of bias | ||
| Bias | Authors' judgement | Support for judgement |
| Random sequence generation (selection bias) | Low risk | Computer‐generated random permutated blocks. |
| Allocation concealment (selection bias) | Unclear risk | Not discussed. |
| Blinding (performance bias and detection bias) | High risk | Open trial ‐ no evidence so no blinding of assessors, investigators or participants in the published report. |
| Incomplete outcome data (attrition bias) | Low risk | All participants accounted for. |
| Selective reporting (reporting bias) | Low risk | Primary outcomes in protocol were reported. Some indices of secondary outcomes regarding rib cage volume P values reported in the abstract, but not reported within the full text i.e. VRCP, VRCA, and VAB. |
| Other bias | Low risk | Methods of statistical analysis were described. |
| Methods | RCT. Cross‐over design. Duration: 3 nights within a 1‐week period, time between nights unclear. | |
| Participants | 13 participants with CF with severe lung disease. Awake PaO₂ (range): 53 ‐ 77 mmHg. PaCO₂ ≥ 45 mmHg. BMI mean (SD): 20 (3) kg/m². | |
| Interventions | Session 1: room air and low‐level CPAP (4 ‐ 5 cm H₂O). | |
| Outcomes | VI, VT; RR; respiratory disturbance indices; SaO₂ TcCO₂. | |
| Notes | ||
| Risk of bias | ||
| Bias | Authors' judgement | Support for judgement |
| Random sequence generation (selection bias) | Unclear risk | Stated as randomised, methods not discussed. |
| Allocation concealment (selection bias) | Unclear risk | Not discussed. |
| Blinding (performance bias and detection bias) | High risk | No evidence of blinding of assessors, investigators or participants. |
| Incomplete outcome data (attrition bias) | Low risk | No drop outs. |
| Selective reporting (reporting bias) | Low risk | All outcome measures were reported. |
| Other bias | Unclear risk | Methods of statistical analysis were described. |
| Methods | RCT. Cross‐over design. Duration: treatment 2x daily for 70 min for 2 days per intervention. | |
| Participants | 17 participants with CF. Severe lung disease. Acute participants. FEV₁ % predicted mean (SD): 25% (6). BMI mean (SD): 18 (3) kg/m². MIP % predicted mean (SD): 87% (17). Wet weight sputum mean (SD): 5 (5) g. | |
| Interventions | Intervention 1: directed cough; | |
| Outcomes | Sputum wet and dry weight; number spontaneous coughs; FEV₁; FVC; FEF; mean SpO₂; participants subjective impression of the effectiveness and fatigue induced by each treatment. | |
| Notes | ||
| Risk of bias | ||
| Bias | Authors' judgement | Support for judgement |
| Random sequence generation (selection bias) | Low risk | Randomisation of treatment order was done according to the Latin square design which provided a balanced assignment to each treatment and a balance in the sequence of treatments. |
| Allocation concealment (selection bias) | Unclear risk | Not discussed. |
| Blinding (performance bias and detection bias) | Unclear risk | Physiotherapists collected sputum and the technician was blinded to physiotherapy treatment but it is not identified who was responsible for weighing sputum or collating cough information induced by the treatment. |
| Incomplete outcome data (attrition bias) | Unclear risk | All participants were accounted for. |
| Selective reporting (reporting bias) | Low risk | All outcome measures were reported. |
| Other bias | Unclear risk | Methods of statistical analysis were described. |
| Methods | RCT. Parallel design. Duration: both interventions given 2x daily for 60 min for 3 months. | |
| Participants | 32 participants with CF. Mean (SD) age: 31 (10) years. Moderate to severe lung disease. Baseline FEV₁ % predicted mean (SD) (range): 47% (14) (22% to 69%). Baseline FVC % predicted mean (SD): 69% (13).%. | |
| Interventions | Intervention 1: treatment including bronchodilators; AD with HTS for 15 min; then NIV with face mask; FET/huffing from mid to low lung volume. NIV: IPAP 20 cm H₂O minimum; EPAP 10 cm H₂O. PEP: 10 breaths with 10 to 20 cm H₂O resistance. | |
| Outcomes | Lung function (FEV₁; FVC; LCI), 6MWT, PaCO₂, sputum culture, inflammatory blood markers. | |
| Notes | ||
| Risk of bias | ||
| Bias | Authors' judgement | Support for judgement |
| Random sequence generation (selection bias) | Unclear risk | States randomised but no further details given. |
| Allocation concealment (selection bias) | Low risk | States opaque envelopes were used to assign to 1 of 2 groups. |
| Blinding (performance bias and detection bias) | Low risk | Pulmonary lab technicians blinded to physiotherapy treatment took lung function readings; research nurses blinded to treatment took vital signs; 6MWT was performed by the physiotherapist although it is unclear if the physiotherapist conducting the 6MWT is blinded to treatment allocation. |
| Incomplete outcome data (attrition bias) | Low risk | All participants were accounted for. |
| Selective reporting (reporting bias) | Low risk | It is stated that inflammatory blood markers, blood gases and sputum analysis monthly was non‐significant compared to baseline (data not reported); FRC did not change in either group (data not reported). All other outcome measures were reported. |
| Other bias | Low risk | Methods of statistical analysis were reported. |
| Methods | RCT. Cross‐over design. Duration: each intervention for 6 weeks with 2‐week washout period. | |
| Participants | 8 participants with CF. Moderate and severe lung disease. No details on whether participants are in acute or stable state. Mean (SD) FEV₁ % predicted: 35% (8). Mean (SD) BM:I 21.1 (2.6) kg/m². Mean (SD) PaCO₂: 52 (4) mmHg. | |
| Interventions | Intervention 1: nocturnal air (placebo). Intervention 2: oxygen via nasal or full face mask. Intervention 2: NIV via nasal or full face mask. | |
| Outcomes | CF‐specific QoL questionnaire; daytime sleepiness; exertional dyspnoea; awake and asleep gas exchange; sleep architecture; lung function; peak exercise capacity. Post‐treatment assessments were carried out during a period of clinical stability i.e. no current need for hospitalisation or intravenous antibiotics. | |
| Notes | Also measured neurocognitive function (PVT :mean; error; lapse); Stroop Color & Word test; trail‐making test; controlled oral word association and digital span test which were reported in the online supplement. They are not reported in this review as they were not relevant to the aims of this review. | |
| Risk of bias | ||
| Bias | Authors' judgement | Support for judgement |
| Random sequence generation (selection bias) | Low risk | Computer‐generated Latin square design. |
| Allocation concealment (selection bias) | Low risk | Sealed in sequentially numbered opaque envelopes by a person not involved in the trial and opened as each participant was enrolled. |
| Blinding (performance bias and detection bias) | Unclear risk | Participants remained blinded as to whether they were receiving oxygen or room air only. |
| Incomplete outcome data (attrition bias) | Low risk | One withdrawal after randomisation due to a pneumothorax. One withdrawal from NIV group due to mask discomfort (NIV n = 7; O₂ n = 8). |
| Selective reporting (reporting bias) | Low risk | All outcome measures were reported. |
| Other bias | Low risk | Methods of statistical analysis were described. |
Full abbreviations list can be found in "Additional Tables" (Table 1)
Characteristics of excluded studies [ordered by study ID]
| Study | Reason for exclusion |
| This trial did not compare NIV to increase minute ventilation and is not linked to the outcome measures in this review. | |
| This trial did not use NIV. | |
| This trial did not compare NIV with other management for acute or chronic respiratory failure. | |
| This trial is not comparing NIV with other management strategies for acute or chronic respiratory failure. | |
| This is not a randomised controlled trial of NIV versus no NIV. | |
| This trial did not compare NIV with other management for acute or chronic respiratory failure. | |
| This trial did not use NIV. | |
| This trial did not use NIV pressure or volume preset mode. | |
| This is not a randomised controlled trial. | |
| This is not a randomised controlled trial. | |
| This trial did not use NIV. | |
| This is not a randomised controlled trial of NIV versus no NIV. | |
| This is not a randomised controlled trial of NIV versus no NIV. |
see Table 1
Characteristics of studies awaiting assessment [ordered by study ID]
| Methods | Participants divided into 3 random groups. Sleep studies performed on respiratory ward supervised by experienced nurses. Duration: 6 months treatment. |
| Participants | 21 participants. Mean (SD) age: 27.3 (3.7) years. Mean (SD) FEV₁ % predicted: 44.1% (3.10). |
| Interventions | Group 1: ACBT. Group 2: ACBT with oxygen. Group 3: ACBT with NIV. |
| Outcomes | Frequency of respiratory exacerbations; arterial blood gases; spirometry; SWT; sleep parameters: AHI; mean SaO₂%; % of TST; oxygen desaturation index; SpO₂ mean % of TST; TcCO₂ mean of TST. |
| Notes | This is all the detail which is recorded in the abstract. To be completed once full study details are available. |
see Table 1
Data and analyses
| Outcome or subgroup title | No. of studies | No. of participants | Statistical method | Effect size |
| 1 CFQ scores Show forest plot | 1 | Mean Difference (IV, Fixed, 95% CI) | Totals not selected | |
| Analysis 1.1  Comparison 1 NIV versus no NIV during chest physiotherapy (any technique), Outcome 1 CFQ scores. | ||||
| 1.1 Physical Domain | 1 | Mean Difference (IV, Fixed, 95% CI) | 0.0 [0.0, 0.0] | |
| 1.2 Health Domain | 1 | Mean Difference (IV, Fixed, 95% CI) | 0.0 [0.0, 0.0] | |
| 1.3 Respiratory Domain | 1 | Mean Difference (IV, Fixed, 95% CI) | 0.0 [0.0, 0.0] | |
| 2 Fatigue Show forest plot | 1 | Mean Difference (IV, Fixed, 95% CI) | Totals not selected | |
| Analysis 1.2  Comparison 1 NIV versus no NIV during chest physiotherapy (any technique), Outcome 2 Fatigue. | ||||
| 3 FEV1 (L) Show forest plot | 2 | Mean Difference (IV, Fixed, 95% CI) | Subtotals only | |
| Analysis 1.3  Comparison 1 NIV versus no NIV during chest physiotherapy (any technique), Outcome 3 FEV1 (L). | ||||
| 3.1 Up to 1 week (directed cough) | 2 | 86 | Mean Difference (IV, Fixed, 95% CI) | ‐0.03 [‐0.17, 0.12] |
| 3.2 Up to 1 week (PEP) | 1 | 34 | Mean Difference (IV, Fixed, 95% CI) | ‐0.05 [‐0.22, 0.12] |
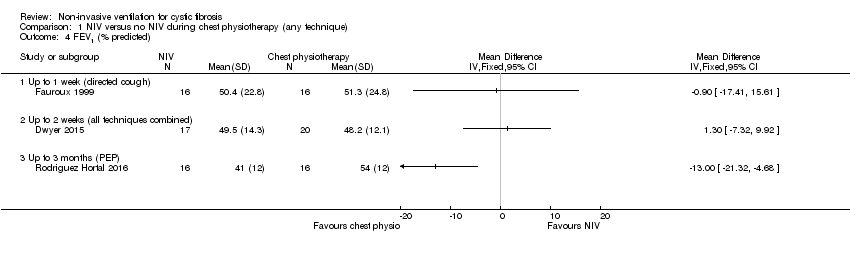
| 4 FEV1 (% predicted) Show forest plot | 3 | Mean Difference (IV, Fixed, 95% CI) | Totals not selected | |
| Analysis 1.4  Comparison 1 NIV versus no NIV during chest physiotherapy (any technique), Outcome 4 FEV1 (% predicted). | ||||
| 4.1 Up to 1 week (directed cough) | 1 | Mean Difference (IV, Fixed, 95% CI) | 0.0 [0.0, 0.0] | |
| 4.2 Up to 2 weeks (all techniques combined) | 1 | Mean Difference (IV, Fixed, 95% CI) | 0.0 [0.0, 0.0] | |
| 4.3 Up to 3 months (PEP) | 1 | Mean Difference (IV, Fixed, 95% CI) | 0.0 [0.0, 0.0] | |
| 5 FVC (L) Show forest plot | 2 | Mean Difference (IV, Fixed, 95% CI) | Subtotals only | |
| Analysis 1.5  Comparison 1 NIV versus no NIV during chest physiotherapy (any technique), Outcome 5 FVC (L). | ||||
| 5.1 Up to 1 week (directed cough) | 2 | 86 | Mean Difference (IV, Fixed, 95% CI) | 0.00 [‐0.30, 0.30] |
| 5.2 Up to 1 week (PEP) | 1 | 34 | Mean Difference (IV, Fixed, 95% CI) | ‐0.07 [‐0.47, 0.33] |
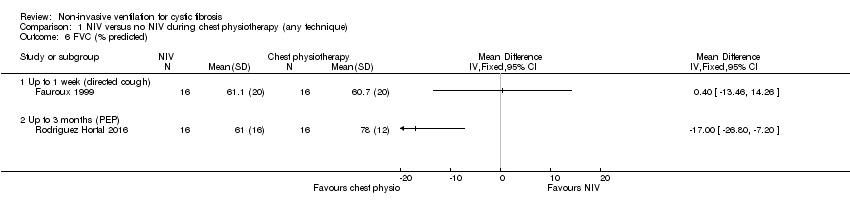
| 6 FVC (% predicted) Show forest plot | 2 | Mean Difference (IV, Fixed, 95% CI) | Totals not selected | |
| Analysis 1.6  Comparison 1 NIV versus no NIV during chest physiotherapy (any technique), Outcome 6 FVC (% predicted). | ||||
| 6.1 Up to 1 week (directed cough) | 1 | Mean Difference (IV, Fixed, 95% CI) | 0.0 [0.0, 0.0] | |
| 6.2 Up to 3 months (PEP) | 1 | Mean Difference (IV, Fixed, 95% CI) | 0.0 [0.0, 0.0] | |
| 7 FEF25‐75 (L) Show forest plot | 2 | Mean Difference (IV, Fixed, 95% CI) | Subtotals only | |
| Analysis 1.7  Comparison 1 NIV versus no NIV during chest physiotherapy (any technique), Outcome 7 FEF25‐75 (L). | ||||
| 7.1 Up to 1 week (directed cough) | 2 | 86 | Mean Difference (IV, Fixed, 95% CI) | ‐0.00 [‐0.08, 0.07] |
| 7.2 Up to 1 week (PEP) | 1 | 34 | Mean Difference (IV, Fixed, 95% CI) | 0.0 [‐0.07, 0.07] |
| 8 FEF25‐75 (% predicted) Show forest plot | 1 | Mean Difference (IV, Fixed, 95% CI) | Totals not selected | |
| Analysis 1.8  Comparison 1 NIV versus no NIV during chest physiotherapy (any technique), Outcome 8 FEF25‐75 (% predicted). | ||||
| 8.1 Up to 1 week (directed cough) | 1 | Mean Difference (IV, Fixed, 95% CI) | 0.0 [0.0, 0.0] | |
| 9 Respiratory muscle strength PImax (cmH20) Show forest plot | 2 | Mean Difference (IV, Fixed, 95% CI) | Totals not selected | |
| Analysis 1.9 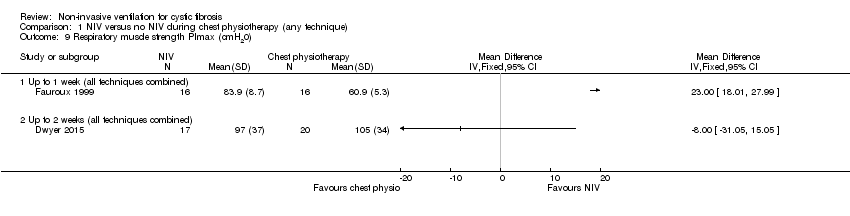 Comparison 1 NIV versus no NIV during chest physiotherapy (any technique), Outcome 9 Respiratory muscle strength PImax (cmH20). | ||||
| 9.1 Up to 1 week (all techniques combined) | 1 | Mean Difference (IV, Fixed, 95% CI) | 0.0 [0.0, 0.0] | |
| 9.2 Up to 2 weeks (all techniques combined) | 1 | Mean Difference (IV, Fixed, 95% CI) | 0.0 [0.0, 0.0] | |
| 10 Respiratory muscle strength PEmax (cmH20) Show forest plot | 2 | Mean Difference (IV, Fixed, 95% CI) | Totals not selected | |
| Analysis 1.10  Comparison 1 NIV versus no NIV during chest physiotherapy (any technique), Outcome 10 Respiratory muscle strength PEmax (cmH20). | ||||
| 10.1 Up to 1 week (all techniques combined) | 1 | Mean Difference (IV, Fixed, 95% CI) | 0.0 [0.0, 0.0] | |
| 10.2 Up to 2 weeks (all techniques combined) | 1 | Mean Difference (IV, Fixed, 95% CI) | 0.0 [0.0, 0.0] | |
| 11 Airway resistance % predicted Show forest plot | 1 | Mean Difference (IV, Fixed, 95% CI) | Totals not selected | |
| Analysis 1.11 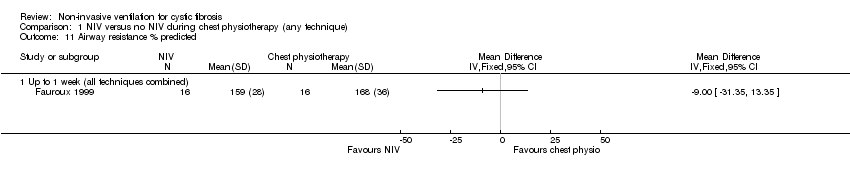 Comparison 1 NIV versus no NIV during chest physiotherapy (any technique), Outcome 11 Airway resistance % predicted. | ||||
| 11.1 Up to 1 week (all techniques combined) | 1 | Mean Difference (IV, Fixed, 95% CI) | 0.0 [0.0, 0.0] | |
| 12 LCI Show forest plot | 1 | Mean Difference (IV, Fixed, 95% CI) | Totals not selected | |
| Analysis 1.12 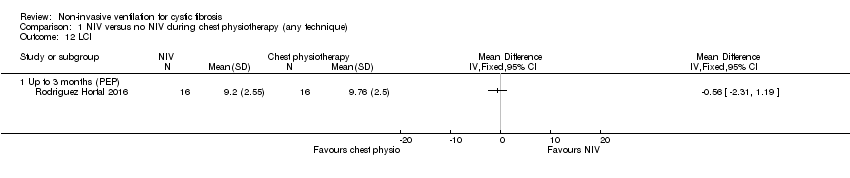 Comparison 1 NIV versus no NIV during chest physiotherapy (any technique), Outcome 12 LCI. | ||||
| 12.1 Up to 3 months (PEP) | 1 | Mean Difference (IV, Fixed, 95% CI) | 0.0 [0.0, 0.0] | |
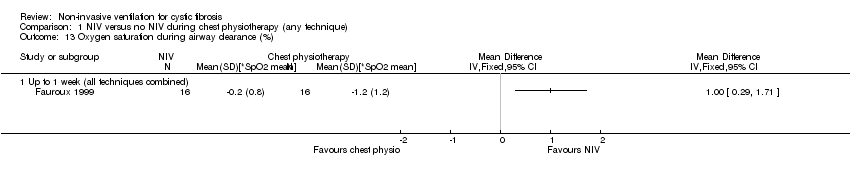
| 13 Oxygen saturation during airway clearance (%) Show forest plot | 1 | Mean Difference (IV, Fixed, 95% CI) | Totals not selected | |
| Analysis 1.13  Comparison 1 NIV versus no NIV during chest physiotherapy (any technique), Outcome 13 Oxygen saturation during airway clearance (%). | ||||
| 13.1 Up to 1 week (all techniques combined) | 1 | Mean Difference (IV, Fixed, 95% CI) | 0.0 [0.0, 0.0] | |
| 14 Oxygen saturation during airway clearance (change in SpO2 % during treatment) Show forest plot | 1 | Mean Difference (IV, Fixed, 95% CI) | Totals not selected | |
| Analysis 1.14  Comparison 1 NIV versus no NIV during chest physiotherapy (any technique), Outcome 14 Oxygen saturation during airway clearance (change in SpO2 % during treatment). | ||||
| 14.1 Up to 1 week (all techniques combined) | 1 | Mean Difference (IV, Fixed, 95% CI) | 0.0 [0.0, 0.0] | |
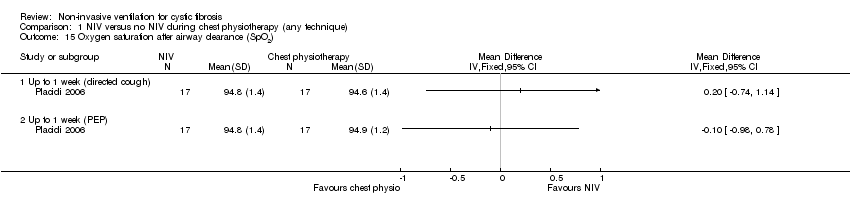
| 15 Oxygen saturation after airway clearance (SpO2) Show forest plot | 1 | Mean Difference (IV, Fixed, 95% CI) | Totals not selected | |
| Analysis 1.15  Comparison 1 NIV versus no NIV during chest physiotherapy (any technique), Outcome 15 Oxygen saturation after airway clearance (SpO2). | ||||
| 15.1 Up to 1 week (directed cough) | 1 | Mean Difference (IV, Fixed, 95% CI) | 0.0 [0.0, 0.0] | |
| 15.2 Up to 1 week (PEP) | 1 | Mean Difference (IV, Fixed, 95% CI) | 0.0 [0.0, 0.0] | |
| 16 PaCO2 Show forest plot | 1 | Mean Difference (IV, Fixed, 95% CI) | Totals not selected | |
| Analysis 1.16  Comparison 1 NIV versus no NIV during chest physiotherapy (any technique), Outcome 16 PaCO2. | ||||
| 16.1 Up to 3 months (PEP) | 1 | Mean Difference (IV, Fixed, 95% CI) | 0.0 [0.0, 0.0] | |
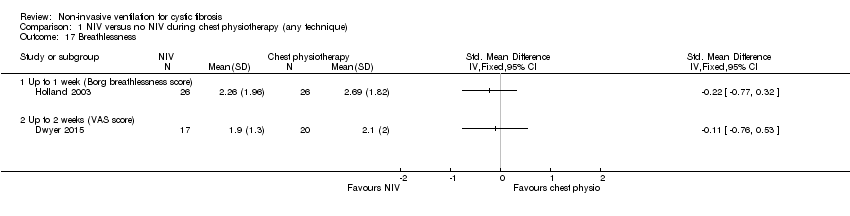
| 17 Breathlessness Show forest plot | 2 | Std. Mean Difference (IV, Fixed, 95% CI) | Totals not selected | |
| Analysis 1.17  Comparison 1 NIV versus no NIV during chest physiotherapy (any technique), Outcome 17 Breathlessness. | ||||
| 17.1 Up to 1 week (Borg breathlessness score) | 1 | Std. Mean Difference (IV, Fixed, 95% CI) | 0.0 [0.0, 0.0] | |
| 17.2 Up to 2 weeks (VAS score) | 1 | Std. Mean Difference (IV, Fixed, 95% CI) | 0.0 [0.0, 0.0] | |
| 18 Sputum wet weight (g) Show forest plot | 3 | Mean Difference (IV, Fixed, 95% CI) | Subtotals only | |
| Analysis 1.18 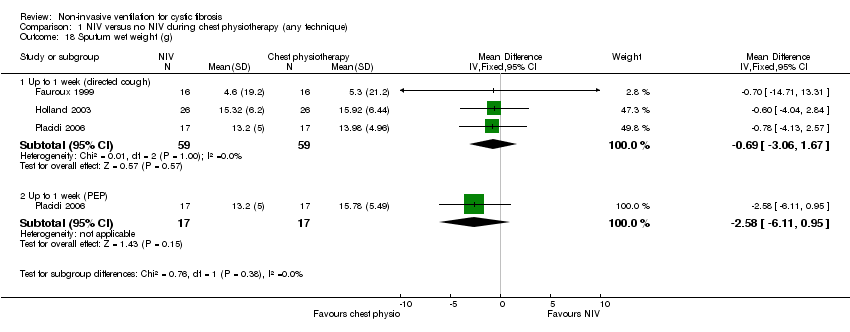 Comparison 1 NIV versus no NIV during chest physiotherapy (any technique), Outcome 18 Sputum wet weight (g). | ||||
| 18.1 Up to 1 week (directed cough) | 3 | 118 | Mean Difference (IV, Fixed, 95% CI) | ‐0.69 [‐3.06, 1.67] |
| 18.2 Up to 1 week (PEP) | 1 | 34 | Mean Difference (IV, Fixed, 95% CI) | ‐2.58 [‐6.11, 0.95] |
| 19 Sputum dry weight (g) Show forest plot | 1 | Mean Difference (IV, Fixed, 95% CI) | Totals not selected | |
| Analysis 1.19 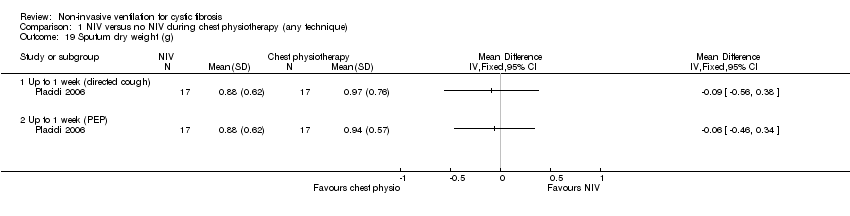 Comparison 1 NIV versus no NIV during chest physiotherapy (any technique), Outcome 19 Sputum dry weight (g). | ||||
| 19.1 Up to 1 week (directed cough) | 1 | Mean Difference (IV, Fixed, 95% CI) | 0.0 [0.0, 0.0] | |
| 19.2 Up to 1 week (PEP) | 1 | Mean Difference (IV, Fixed, 95% CI) | 0.0 [0.0, 0.0] | |
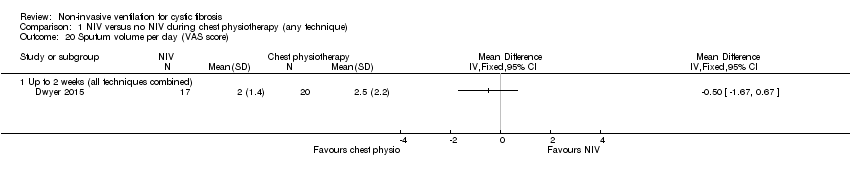
| 20 Sputum volume per day (VAS score) Show forest plot | 1 | Mean Difference (IV, Fixed, 95% CI) | Totals not selected | |
| Analysis 1.20  Comparison 1 NIV versus no NIV during chest physiotherapy (any technique), Outcome 20 Sputum volume per day (VAS score). | ||||
| 20.1 Up to 2 weeks (all techniques combined) | 1 | Mean Difference (IV, Fixed, 95% CI) | 0.0 [0.0, 0.0] | |
| 21 Pseudomonas density (log CFU/g) Show forest plot | 1 | Mean Difference (IV, Fixed, 95% CI) | Totals not selected | |
| Analysis 1.21  Comparison 1 NIV versus no NIV during chest physiotherapy (any technique), Outcome 21 Pseudomonas density (log CFU/g). | ||||
| 21.1 Up to 2 weeks (all techniques combined) | 1 | Mean Difference (IV, Fixed, 95% CI) | 0.0 [0.0, 0.0] | |
| 22 Exercise capacity: 25 level modified shuttle test (m) Show forest plot | 1 | Mean Difference (IV, Fixed, 95% CI) | Totals not selected | |
| Analysis 1.22 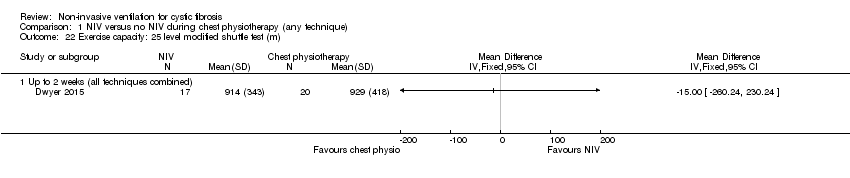 Comparison 1 NIV versus no NIV during chest physiotherapy (any technique), Outcome 22 Exercise capacity: 25 level modified shuttle test (m). | ||||
| 22.1 Up to 2 weeks (all techniques combined) | 1 | Mean Difference (IV, Fixed, 95% CI) | 0.0 [0.0, 0.0] | |
| 23 Energy (VAS score) Show forest plot | 1 | Mean Difference (IV, Fixed, 95% CI) | Totals not selected | |
| Analysis 1.23  Comparison 1 NIV versus no NIV during chest physiotherapy (any technique), Outcome 23 Energy (VAS score). | ||||
| 23.1 Up to 2 weeks (all techniques combined) | 1 | Mean Difference (IV, Fixed, 95% CI) | 0.0 [0.0, 0.0] | |
| 24 6MWT Show forest plot | 1 | Mean Difference (IV, Fixed, 95% CI) | Totals not selected | |
| Analysis 1.24 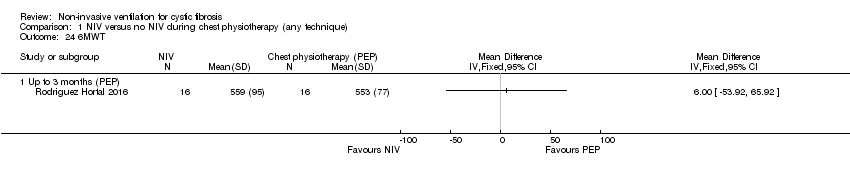 Comparison 1 NIV versus no NIV during chest physiotherapy (any technique), Outcome 24 6MWT. | ||||
| 24.1 Up to 3 months (PEP) | 1 | Mean Difference (IV, Fixed, 95% CI) | 0.0 [0.0, 0.0] | |
| 25 Length of hospital stay (days) Show forest plot | 1 | Mean Difference (IV, Fixed, 95% CI) | Totals not selected | |
| Analysis 1.25  Comparison 1 NIV versus no NIV during chest physiotherapy (any technique), Outcome 25 Length of hospital stay (days). | ||||
| 25.1 Up to 2 weeks (all techniques combined) | 1 | Mean Difference (IV, Fixed, 95% CI) | 0.0 [0.0, 0.0] | |
| 26 Time to next admission (days) Show forest plot | 1 | Mean Difference (IV, Fixed, 95% CI) | Totals not selected | |
| Analysis 1.26 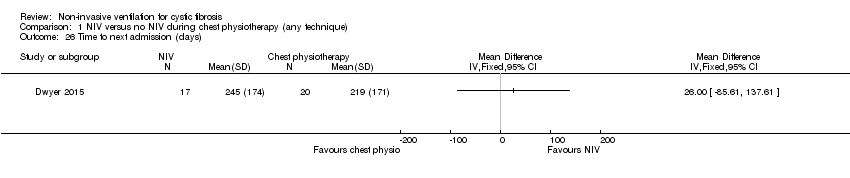 Comparison 1 NIV versus no NIV during chest physiotherapy (any technique), Outcome 26 Time to next admission (days). | ||||
| Outcome or subgroup title | No. of studies | No. of participants | Statistical method | Effect size |
| 1 CFQoL chest symptom score Show forest plot | 1 | Mean Difference (IV, Fixed, 95% CI) | Totals not selected | |
| Analysis 2.1  Comparison 2 NIV in overnight ventilation compared to oxygen, Outcome 1 CFQoL chest symptom score. | ||||
| 1.1 Up to 3 months | 1 | Mean Difference (IV, Fixed, 95% CI) | 0.0 [0.0, 0.0] | |
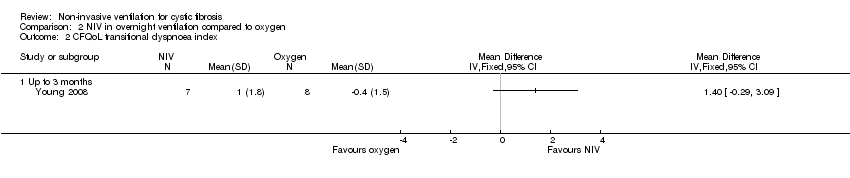
| 2 CFQoL transitional dyspnoea index Show forest plot | 1 | Mean Difference (IV, Fixed, 95% CI) | Totals not selected | |
| Analysis 2.2  Comparison 2 NIV in overnight ventilation compared to oxygen, Outcome 2 CFQoL transitional dyspnoea index. | ||||
| 2.1 Up to 3 months | 1 | Mean Difference (IV, Fixed, 95% CI) | 0.0 [0.0, 0.0] | |
| 3 Symptoms of sleep‐disordered breathing Show forest plot | 1 | Mean Difference (IV, Fixed, 95% CI) | Totals not selected | |
| Analysis 2.3 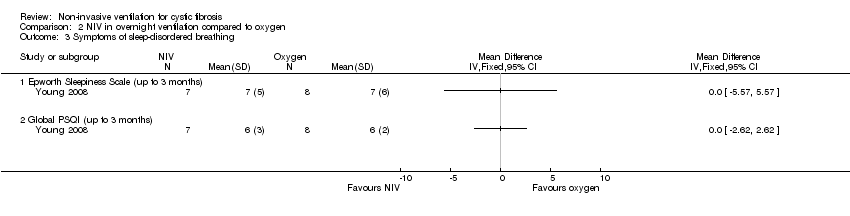 Comparison 2 NIV in overnight ventilation compared to oxygen, Outcome 3 Symptoms of sleep‐disordered breathing. | ||||
| 3.1 Epworth Sleepiness Scale (up to 3 months) | 1 | Mean Difference (IV, Fixed, 95% CI) | 0.0 [0.0, 0.0] | |
| 3.2 Global PSQI (up to 3 months) | 1 | Mean Difference (IV, Fixed, 95% CI) | 0.0 [0.0, 0.0] | |
| 4 Lung function during sleep Show forest plot | 1 | Mean Difference (Fixed, 95% CI) | Totals not selected | |
| Analysis 2.4 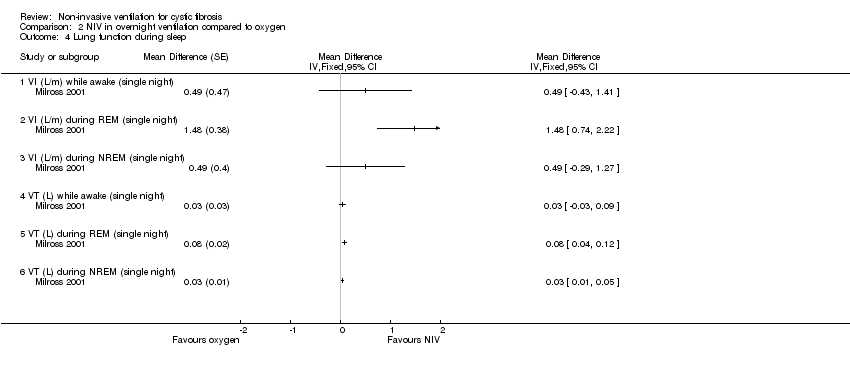 Comparison 2 NIV in overnight ventilation compared to oxygen, Outcome 4 Lung function during sleep. | ||||
| 4.1 VI (L/m) while awake (single night) | 1 | Mean Difference (Fixed, 95% CI) | 0.0 [0.0, 0.0] | |
| 4.2 VI (L/m) during REM (single night) | 1 | Mean Difference (Fixed, 95% CI) | 0.0 [0.0, 0.0] | |
| 4.3 VI (L/m) during NREM (single night) | 1 | Mean Difference (Fixed, 95% CI) | 0.0 [0.0, 0.0] | |
| 4.4 VT (L) while awake (single night) | 1 | Mean Difference (Fixed, 95% CI) | 0.0 [0.0, 0.0] | |
| 4.5 VT (L) during REM (single night) | 1 | Mean Difference (Fixed, 95% CI) | 0.0 [0.0, 0.0] | |
| 4.6 VT (L) during NREM (single night) | 1 | Mean Difference (Fixed, 95% CI) | 0.0 [0.0, 0.0] | |
| 5 Respiratory rate (breaths/min) Show forest plot | 1 | Mean Difference (Fixed, 95% CI) | Totals not selected | |
| Analysis 2.5  Comparison 2 NIV in overnight ventilation compared to oxygen, Outcome 5 Respiratory rate (breaths/min). | ||||
| 5.1 RR while awake (single night) | 1 | Mean Difference (Fixed, 95% CI) | 0.0 [0.0, 0.0] | |
| 5.2 RR during REM (single night) | 1 | Mean Difference (Fixed, 95% CI) | 0.0 [0.0, 0.0] | |
| 5.3 RR during NREM (single night) | 1 | Mean Difference (Fixed, 95% CI) | 0.0 [0.0, 0.0] | |
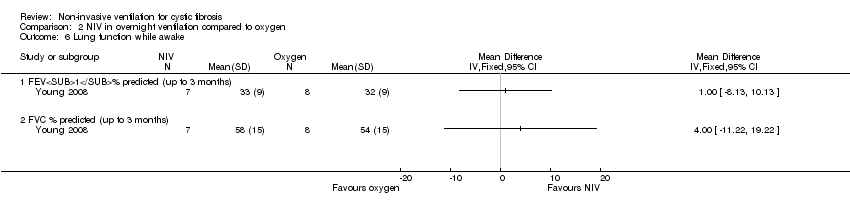
| 6 Lung function while awake Show forest plot | 1 | Mean Difference (IV, Fixed, 95% CI) | Totals not selected | |
| Analysis 2.6  Comparison 2 NIV in overnight ventilation compared to oxygen, Outcome 6 Lung function while awake. | ||||
| 6.1 FEV1% predicted (up to 3 months) | 1 | Mean Difference (IV, Fixed, 95% CI) | 0.0 [0.0, 0.0] | |
| 6.2 FVC % predicted (up to 3 months) | 1 | Mean Difference (IV, Fixed, 95% CI) | 0.0 [0.0, 0.0] | |
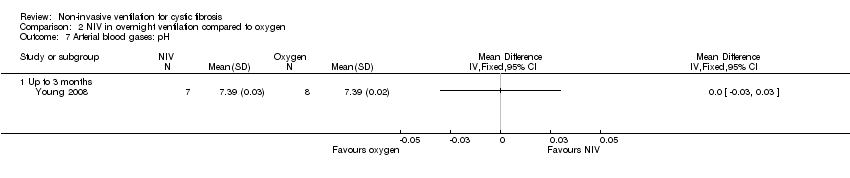
| 7 Arterial blood gases: pH Show forest plot | 1 | Mean Difference (IV, Fixed, 95% CI) | Totals not selected | |
| Analysis 2.7  Comparison 2 NIV in overnight ventilation compared to oxygen, Outcome 7 Arterial blood gases: pH. | ||||
| 7.1 Up to 3 months | 1 | Mean Difference (IV, Fixed, 95% CI) | 0.0 [0.0, 0.0] | |
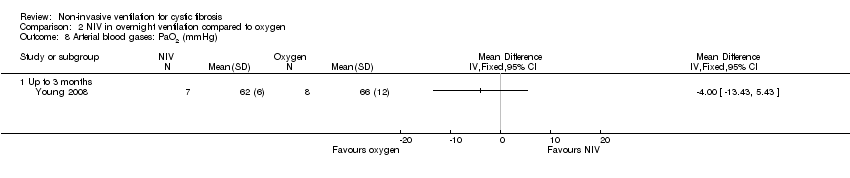
| 8 Arterial blood gases: PaO2 (mmHg) Show forest plot | 1 | Mean Difference (IV, Fixed, 95% CI) | Totals not selected | |
| Analysis 2.8  Comparison 2 NIV in overnight ventilation compared to oxygen, Outcome 8 Arterial blood gases: PaO2 (mmHg). | ||||
| 8.1 Up to 3 months | 1 | Mean Difference (IV, Fixed, 95% CI) | 0.0 [0.0, 0.0] | |
| 9 Arterial blood gases: PaCO2 (mmHg) Show forest plot | 1 | Mean Difference (IV, Fixed, 95% CI) | Totals not selected | |
| Analysis 2.9  Comparison 2 NIV in overnight ventilation compared to oxygen, Outcome 9 Arterial blood gases: PaCO2 (mmHg). | ||||
| 9.1 Up to 3 months | 1 | Mean Difference (IV, Fixed, 95% CI) | 0.0 [0.0, 0.0] | |
| 10 Arterial blood gases: HCO3 (mmol/L) Show forest plot | 1 | Mean Difference (IV, Fixed, 95% CI) | Totals not selected | |
| Analysis 2.10  Comparison 2 NIV in overnight ventilation compared to oxygen, Outcome 10 Arterial blood gases: HCO3 (mmol/L). | ||||
| 10.1 Up to 3 months | 1 | Mean Difference (IV, Fixed, 95% CI) | 0.0 [0.0, 0.0] | |
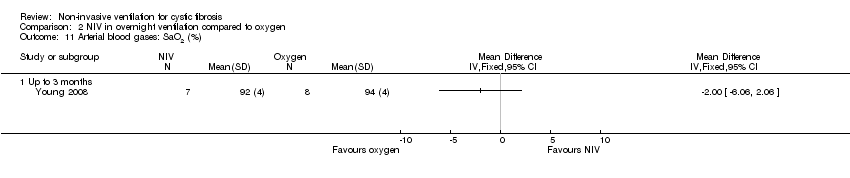
| 11 Arterial blood gases: SaO2 (%) Show forest plot | 1 | Mean Difference (IV, Fixed, 95% CI) | Totals not selected | |
| Analysis 2.11  Comparison 2 NIV in overnight ventilation compared to oxygen, Outcome 11 Arterial blood gases: SaO2 (%). | ||||
| 11.1 Up to 3 months | 1 | Mean Difference (IV, Fixed, 95% CI) | 0.0 [0.0, 0.0] | |
| 12 Exercise performance (MSWT) (metres) Show forest plot | 1 | Mean Difference (IV, Fixed, 95% CI) | Totals not selected | |
| Analysis 2.12  Comparison 2 NIV in overnight ventilation compared to oxygen, Outcome 12 Exercise performance (MSWT) (metres). | ||||
| 12.1 Up to 3 months | 1 | Mean Difference (IV, Fixed, 95% CI) | 0.0 [0.0, 0.0] | |
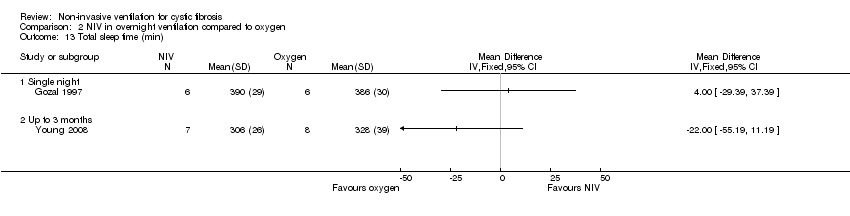
| 13 Total sleep time (min) Show forest plot | 2 | Mean Difference (IV, Fixed, 95% CI) | Totals not selected | |
| Analysis 2.13  Comparison 2 NIV in overnight ventilation compared to oxygen, Outcome 13 Total sleep time (min). | ||||
| 13.1 Single night | 1 | Mean Difference (IV, Fixed, 95% CI) | 0.0 [0.0, 0.0] | |
| 13.2 Up to 3 months | 1 | Mean Difference (IV, Fixed, 95% CI) | 0.0 [0.0, 0.0] | |
| 14 REM sleep architecture Show forest plot | 2 | Mean Difference (IV, Fixed, 95% CI) | Totals not selected | |
| Analysis 2.14 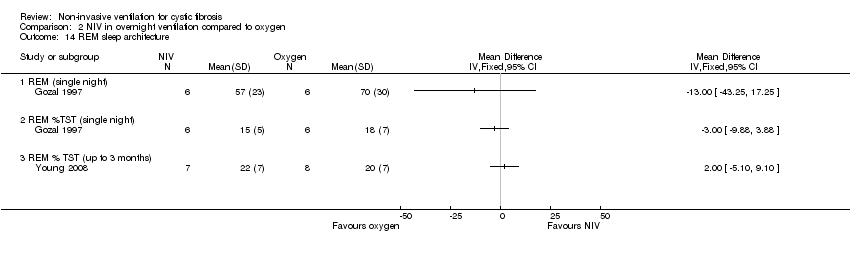 Comparison 2 NIV in overnight ventilation compared to oxygen, Outcome 14 REM sleep architecture. | ||||
| 14.1 REM (single night) | 1 | Mean Difference (IV, Fixed, 95% CI) | 0.0 [0.0, 0.0] | |
| 14.2 REM %TST (single night) | 1 | Mean Difference (IV, Fixed, 95% CI) | 0.0 [0.0, 0.0] | |
| 14.3 REM % TST (up to 3 months) | 1 | Mean Difference (IV, Fixed, 95% CI) | 0.0 [0.0, 0.0] | |
| 15 Sleep latency (min) Show forest plot | 3 | Mean Difference (IV, Fixed, 95% CI) | Subtotals only | |
| Analysis 2.15 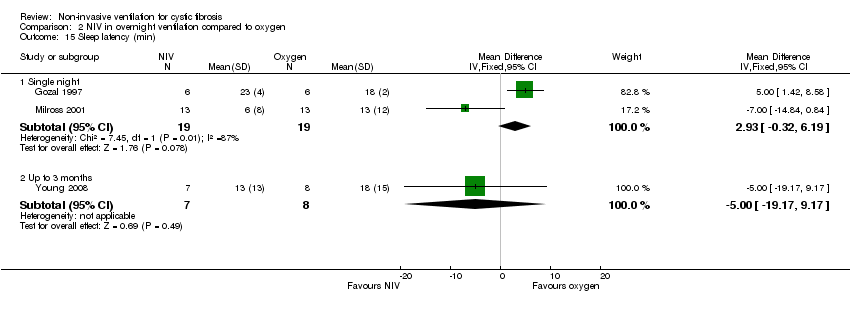 Comparison 2 NIV in overnight ventilation compared to oxygen, Outcome 15 Sleep latency (min). | ||||
| 15.1 Single night | 2 | 38 | Mean Difference (IV, Fixed, 95% CI) | 2.93 [‐0.32, 6.19] |
| 15.2 Up to 3 months | 1 | 15 | Mean Difference (IV, Fixed, 95% CI) | ‐5.0 [‐19.17, 9.17] |
| 16 Nocturnal oxygen saturation (%) Show forest plot | 2 | Mean Difference (IV, Fixed, 95% CI) | Totals not selected | |
| Analysis 2.16 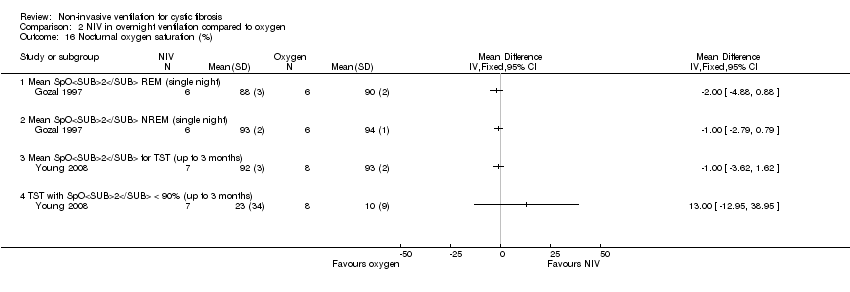 Comparison 2 NIV in overnight ventilation compared to oxygen, Outcome 16 Nocturnal oxygen saturation (%). | ||||
| 16.1 Mean SpO2 REM (single night) | 1 | Mean Difference (IV, Fixed, 95% CI) | 0.0 [0.0, 0.0] | |
| 16.2 Mean SpO2 NREM (single night) | 1 | Mean Difference (IV, Fixed, 95% CI) | 0.0 [0.0, 0.0] | |
| 16.3 Mean SpO2 for TST (up to 3 months) | 1 | Mean Difference (IV, Fixed, 95% CI) | 0.0 [0.0, 0.0] | |
| 16.4 TST with SpO2 < 90% (up to 3 months) | 1 | Mean Difference (IV, Fixed, 95% CI) | 0.0 [0.0, 0.0] | |
| 17 Nocturnal oxygen saturation (%) Show forest plot | 1 | Mean Difference (Fixed, 95% CI) | Totals not selected | |
| Analysis 2.17  Comparison 2 NIV in overnight ventilation compared to oxygen, Outcome 17 Nocturnal oxygen saturation (%). | ||||
| 17.1 Percentage TST SpO2>90% | 1 | Mean Difference (Fixed, 95% CI) | 0.0 [0.0, 0.0] | |
| 17.2 Percentage REM SpO2>90% | 1 | Mean Difference (Fixed, 95% CI) | 0.0 [0.0, 0.0] | |
| 17.3 Percentage NREM SpO2>90% | 1 | Mean Difference (Fixed, 95% CI) | 0.0 [0.0, 0.0] | |
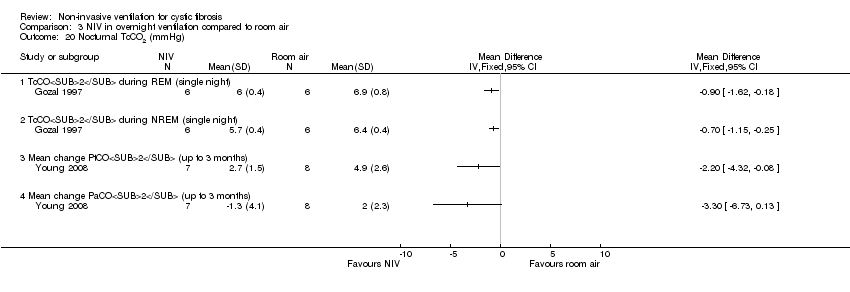
| 18 Nocturnal TcCO2 (mmHg Show forest plot | 2 | Mean Difference (IV, Fixed, 95% CI) | Totals not selected | |
| Analysis 2.18  Comparison 2 NIV in overnight ventilation compared to oxygen, Outcome 18 Nocturnal TcCO2 (mmHg. | ||||
| 18.1 TcCO2 during REM (single night) | 1 | Mean Difference (IV, Fixed, 95% CI) | 0.0 [0.0, 0.0] | |
| 18.2 TcCO2 during NREM (single night) | 1 | Mean Difference (IV, Fixed, 95% CI) | 0.0 [0.0, 0.0] | |
| 18.3 Mean change PtCO2 (mmHg) (up to 3 months) | 1 | Mean Difference (IV, Fixed, 95% CI) | 0.0 [0.0, 0.0] | |
| 18.4 Mean change PaCO2 (mmHg) (up to 3 months) | 1 | Mean Difference (IV, Fixed, 95% CI) | 0.0 [0.0, 0.0] | |
| 19 Nocturnal TcCO2 (mmHg) Show forest plot | 1 | Mean Difference (Fixed, 95% CI) | Totals not selected | |
| Analysis 2.19 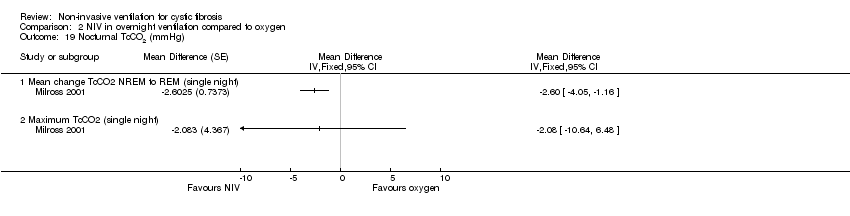 Comparison 2 NIV in overnight ventilation compared to oxygen, Outcome 19 Nocturnal TcCO2 (mmHg). | ||||
| 19.1 Mean change TcCO2 NREM to REM (single night) | 1 | Mean Difference (Fixed, 95% CI) | 0.0 [0.0, 0.0] | |
| 19.2 Maximum TcCO2 (single night) | 1 | Mean Difference (Fixed, 95% CI) | 0.0 [0.0, 0.0] | |
| 20 Nocturnal TcCO2 TST (mmHg) Show forest plot | 1 | Mean Difference (IV, Fixed, 95% CI) | Totals not selected | |
| Analysis 2.20 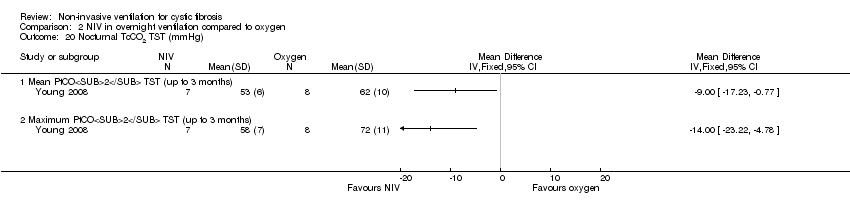 Comparison 2 NIV in overnight ventilation compared to oxygen, Outcome 20 Nocturnal TcCO2 TST (mmHg). | ||||
| 20.1 Mean PtCO2 TST (up to 3 months) | 1 | Mean Difference (IV, Fixed, 95% CI) | 0.0 [0.0, 0.0] | |
| 20.2 Maximum PtCO2 TST (up to 3 months) | 1 | Mean Difference (IV, Fixed, 95% CI) | 0.0 [0.0, 0.0] | |
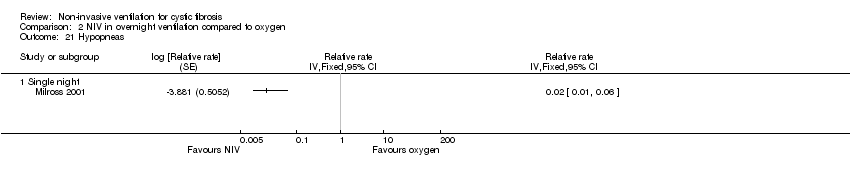
| 21 Hypopneas Show forest plot | 1 | Relative rate (Fixed, 95% CI) | Totals not selected | |
| Analysis 2.21  Comparison 2 NIV in overnight ventilation compared to oxygen, Outcome 21 Hypopneas. | ||||
| 21.1 Single night | 1 | Relative rate (Fixed, 95% CI) | 0.0 [0.0, 0.0] | |
| 22 Mean heart rate (beats/min) Show forest plot | 1 | Mean Difference (IV, Fixed, 95% CI) | Totals not selected | |
| Analysis 2.22 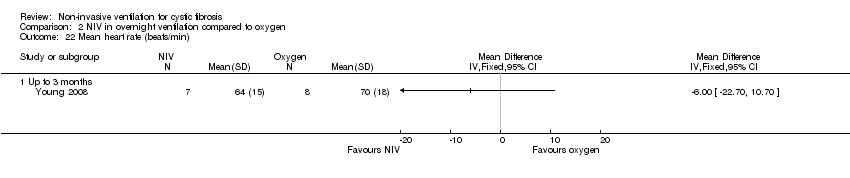 Comparison 2 NIV in overnight ventilation compared to oxygen, Outcome 22 Mean heart rate (beats/min). | ||||
| 22.1 Up to 3 months | 1 | Mean Difference (IV, Fixed, 95% CI) | 0.0 [0.0, 0.0] | |
| 23 Respiratory rate Show forest plot | 1 | Mean Difference (IV, Fixed, 95% CI) | Totals not selected | |
| Analysis 2.23  Comparison 2 NIV in overnight ventilation compared to oxygen, Outcome 23 Respiratory rate. | ||||
| 23.1 Up to 3 months | 1 | Mean Difference (IV, Fixed, 95% CI) | 0.0 [0.0, 0.0] | |
| Outcome or subgroup title | No. of studies | No. of participants | Statistical method | Effect size |
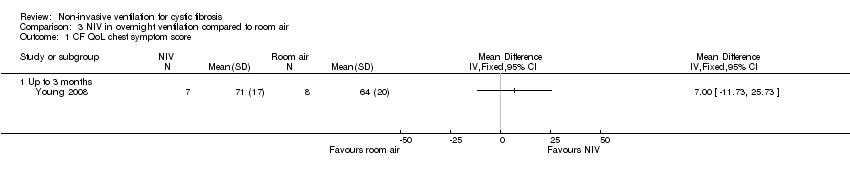
| 1 CF QoL chest symptom score Show forest plot | 1 | Mean Difference (IV, Fixed, 95% CI) | Totals not selected | |
| Analysis 3.1  Comparison 3 NIV in overnight ventilation compared to room air, Outcome 1 CF QoL chest symptom score. | ||||
| 1.1 Up to 3 months | 1 | Mean Difference (IV, Fixed, 95% CI) | 0.0 [0.0, 0.0] | |
| 2 CF QoL traditional dyspnoea index score Show forest plot | 1 | Mean Difference (IV, Fixed, 95% CI) | Totals not selected | |
| Analysis 3.2  Comparison 3 NIV in overnight ventilation compared to room air, Outcome 2 CF QoL traditional dyspnoea index score. | ||||
| 2.1 Up to 3 months | 1 | Mean Difference (IV, Fixed, 95% CI) | 0.0 [0.0, 0.0] | |
| 3 Symptoms of sleep‐disordered breathing Show forest plot | 1 | Mean Difference (IV, Fixed, 95% CI) | Totals not selected | |
| Analysis 3.3 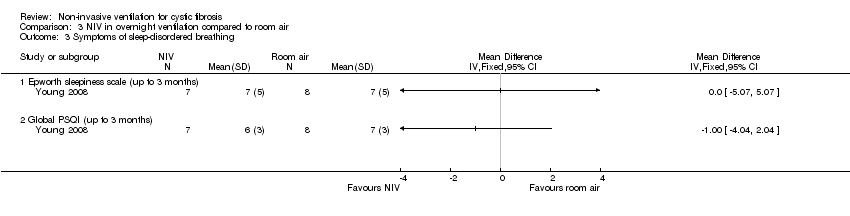 Comparison 3 NIV in overnight ventilation compared to room air, Outcome 3 Symptoms of sleep‐disordered breathing. | ||||
| 3.1 Epworth sleepiness scale (up to 3 months) | 1 | Mean Difference (IV, Fixed, 95% CI) | 0.0 [0.0, 0.0] | |
| 3.2 Global PSQI (up to 3 months) | 1 | Mean Difference (IV, Fixed, 95% CI) | 0.0 [0.0, 0.0] | |
| 4 Lung function during sleep Show forest plot | 1 | Mean Difference (Fixed, 95% CI) | Totals not selected | |
| Analysis 3.4 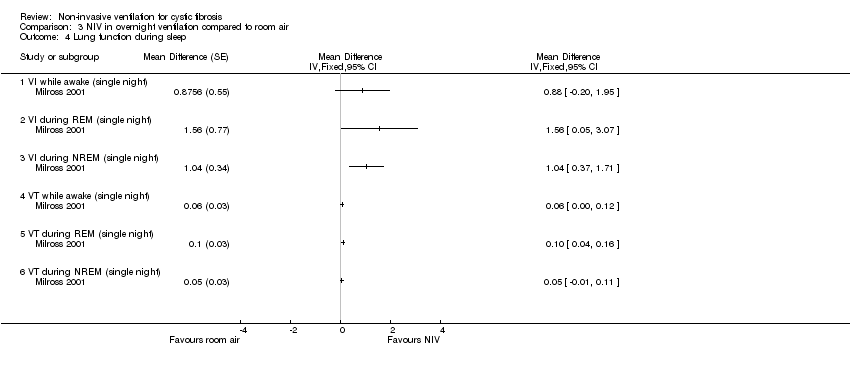 Comparison 3 NIV in overnight ventilation compared to room air, Outcome 4 Lung function during sleep. | ||||
| 4.1 VI while awake (single night) | 1 | Mean Difference (Fixed, 95% CI) | 0.0 [0.0, 0.0] | |
| 4.2 VI during REM (single night) | 1 | Mean Difference (Fixed, 95% CI) | 0.0 [0.0, 0.0] | |
| 4.3 VI during NREM (single night) | 1 | Mean Difference (Fixed, 95% CI) | 0.0 [0.0, 0.0] | |
| 4.4 VT while awake (single night) | 1 | Mean Difference (Fixed, 95% CI) | 0.0 [0.0, 0.0] | |
| 4.5 VT during REM (single night) | 1 | Mean Difference (Fixed, 95% CI) | 0.0 [0.0, 0.0] | |
| 4.6 VT during NREM (single night) | 1 | Mean Difference (Fixed, 95% CI) | 0.0 [0.0, 0.0] | |
| 5 Respiratory rate(breaths/min) during sleep Show forest plot | 1 | Mean Difference (Fixed, 95% CI) | Totals not selected | |
| Analysis 3.5  Comparison 3 NIV in overnight ventilation compared to room air, Outcome 5 Respiratory rate(breaths/min) during sleep. | ||||
| 5.1 RR while awake (single night) | 1 | Mean Difference (Fixed, 95% CI) | 0.0 [0.0, 0.0] | |
| 5.2 RR during REM (single night) | 1 | Mean Difference (Fixed, 95% CI) | 0.0 [0.0, 0.0] | |
| 5.3 RR during NREM (single night) | 1 | Mean Difference (Fixed, 95% CI) | 0.0 [0.0, 0.0] | |
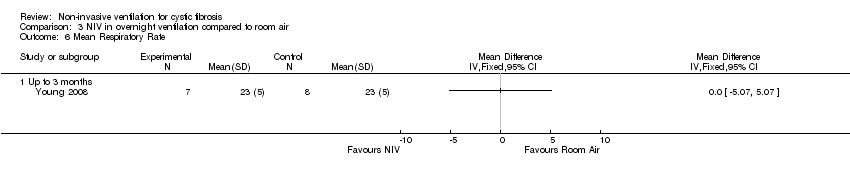
| 6 Mean Respiratory Rate Show forest plot | 1 | Mean Difference (IV, Fixed, 95% CI) | Totals not selected | |
| Analysis 3.6  Comparison 3 NIV in overnight ventilation compared to room air, Outcome 6 Mean Respiratory Rate. | ||||
| 6.1 Up to 3 months | 1 | Mean Difference (IV, Fixed, 95% CI) | 0.0 [0.0, 0.0] | |
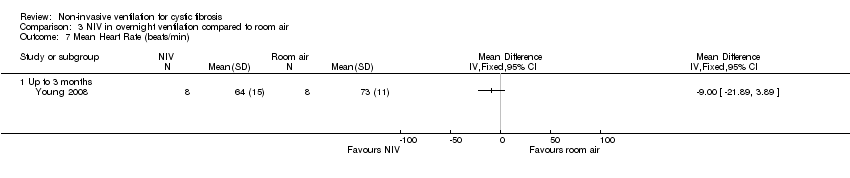
| 7 Mean Heart Rate (beats/min) Show forest plot | 1 | Mean Difference (IV, Fixed, 95% CI) | Totals not selected | |
| Analysis 3.7  Comparison 3 NIV in overnight ventilation compared to room air, Outcome 7 Mean Heart Rate (beats/min). | ||||
| 7.1 Up to 3 months | 1 | Mean Difference (IV, Fixed, 95% CI) | 0.0 [0.0, 0.0] | |
| 8 Lung function while awake Show forest plot | 1 | Mean Difference (IV, Fixed, 95% CI) | Totals not selected | |
| Analysis 3.8  Comparison 3 NIV in overnight ventilation compared to room air, Outcome 8 Lung function while awake. | ||||
| 8.1 FEV1% predicted (up to 3 months) | 1 | Mean Difference (IV, Fixed, 95% CI) | 0.0 [0.0, 0.0] | |
| 8.2 FVC % predicted (up to 3 months) | 1 | Mean Difference (IV, Fixed, 95% CI) | 0.0 [0.0, 0.0] | |
| 9 Arterial blood gases: pH Show forest plot | 1 | Mean Difference (IV, Fixed, 95% CI) | Totals not selected | |
| Analysis 3.9  Comparison 3 NIV in overnight ventilation compared to room air, Outcome 9 Arterial blood gases: pH. | ||||
| 9.1 Up to 3 months | 1 | Mean Difference (IV, Fixed, 95% CI) | 0.0 [0.0, 0.0] | |
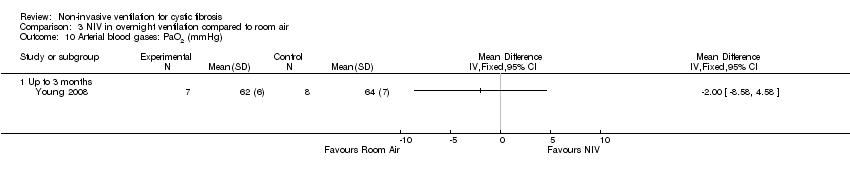
| 10 Arterial blood gases: PaO2 (mmHg) Show forest plot | 1 | Mean Difference (IV, Fixed, 95% CI) | Totals not selected | |
| Analysis 3.10  Comparison 3 NIV in overnight ventilation compared to room air, Outcome 10 Arterial blood gases: PaO2 (mmHg). | ||||
| 10.1 Up to 3 months | 1 | Mean Difference (IV, Fixed, 95% CI) | 0.0 [0.0, 0.0] | |
| 11 Arterial blood gases: PaCO2 (mmHg) Show forest plot | 1 | Mean Difference (IV, Fixed, 95% CI) | Totals not selected | |
| Analysis 3.11  Comparison 3 NIV in overnight ventilation compared to room air, Outcome 11 Arterial blood gases: PaCO2 (mmHg). | ||||
| 11.1 Up to 3 months | 1 | Mean Difference (IV, Fixed, 95% CI) | 0.0 [0.0, 0.0] | |
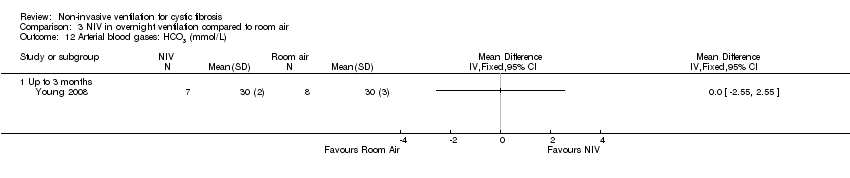
| 12 Arterial blood gases: HCO3 (mmol/L) Show forest plot | 1 | Mean Difference (IV, Fixed, 95% CI) | Totals not selected | |
| Analysis 3.12  Comparison 3 NIV in overnight ventilation compared to room air, Outcome 12 Arterial blood gases: HCO3 (mmol/L). | ||||
| 12.1 Up to 3 months | 1 | Mean Difference (IV, Fixed, 95% CI) | 0.0 [0.0, 0.0] | |
| 13 Arterial blood gases: SaO2 (%) Show forest plot | 1 | Mean Difference (IV, Fixed, 95% CI) | Totals not selected | |
| Analysis 3.13  Comparison 3 NIV in overnight ventilation compared to room air, Outcome 13 Arterial blood gases: SaO2 (%). | ||||
| 13.1 Up to 3 months | 1 | Mean Difference (IV, Fixed, 95% CI) | 0.0 [0.0, 0.0] | |
| 14 Exercise performance (metres) Show forest plot | 1 | Mean Difference (IV, Fixed, 95% CI) | Totals not selected | |
| Analysis 3.14  Comparison 3 NIV in overnight ventilation compared to room air, Outcome 14 Exercise performance (metres). | ||||
| 14.1 Up to 3 months | 1 | Mean Difference (IV, Fixed, 95% CI) | 0.0 [0.0, 0.0] | |
| 15 Total sleep time (min) Show forest plot | 2 | Mean Difference (IV, Fixed, 95% CI) | Totals not selected | |
| Analysis 3.15 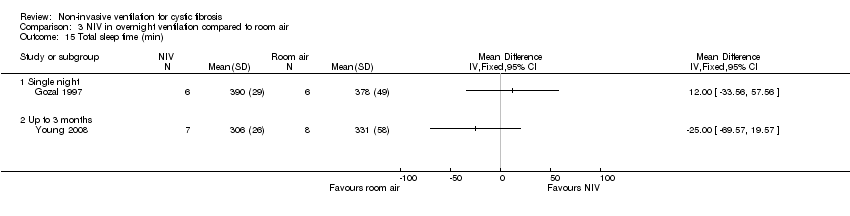 Comparison 3 NIV in overnight ventilation compared to room air, Outcome 15 Total sleep time (min). | ||||
| 15.1 Single night | 1 | Mean Difference (IV, Fixed, 95% CI) | 0.0 [0.0, 0.0] | |
| 15.2 Up to 3 months | 1 | Mean Difference (IV, Fixed, 95% CI) | 0.0 [0.0, 0.0] | |
| 16 REM sleep architecture Show forest plot | 2 | Mean Difference (IV, Fixed, 95% CI) | Totals not selected | |
| Analysis 3.16  Comparison 3 NIV in overnight ventilation compared to room air, Outcome 16 REM sleep architecture. | ||||
| 16.1 REM (single night) | 1 | Mean Difference (IV, Fixed, 95% CI) | 0.0 [0.0, 0.0] | |
| 16.2 REM %TST (single night) | 1 | Mean Difference (IV, Fixed, 95% CI) | 0.0 [0.0, 0.0] | |
| 16.3 REM % TST (up to 3 months) | 1 | Mean Difference (IV, Fixed, 95% CI) | 0.0 [0.0, 0.0] | |
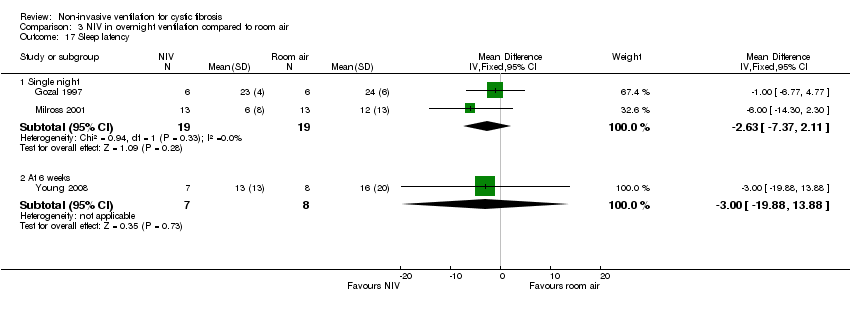
| 17 Sleep latency Show forest plot | 3 | Mean Difference (IV, Fixed, 95% CI) | Subtotals only | |
| Analysis 3.17  Comparison 3 NIV in overnight ventilation compared to room air, Outcome 17 Sleep latency. | ||||
| 17.1 Single night | 2 | 38 | Mean Difference (IV, Fixed, 95% CI) | ‐2.63 [‐7.37, 2.11] |
| 17.2 At 6 weeks | 1 | 15 | Mean Difference (IV, Fixed, 95% CI) | ‐3.00 [‐19.88, 13.88] |
| 18 Nocturnal oxygen saturation (%) Show forest plot | 2 | Mean Difference (IV, Fixed, 95% CI) | Totals not selected | |
| Analysis 3.18 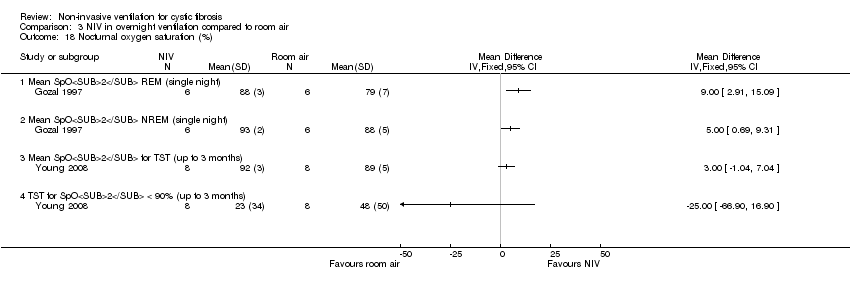 Comparison 3 NIV in overnight ventilation compared to room air, Outcome 18 Nocturnal oxygen saturation (%). | ||||
| 18.1 Mean SpO2 REM (single night) | 1 | Mean Difference (IV, Fixed, 95% CI) | 0.0 [0.0, 0.0] | |
| 18.2 Mean SpO2 NREM (single night) | 1 | Mean Difference (IV, Fixed, 95% CI) | 0.0 [0.0, 0.0] | |
| 18.3 Mean SpO2 for TST (up to 3 months) | 1 | Mean Difference (IV, Fixed, 95% CI) | 0.0 [0.0, 0.0] | |
| 18.4 TST for SpO2 < 90% (up to 3 months) | 1 | Mean Difference (IV, Fixed, 95% CI) | 0.0 [0.0, 0.0] | |
| 19 Nocturnal oxygen saturation (%) Show forest plot | 1 | Mean Difference (Fixed, 95% CI) | Totals not selected | |
| Analysis 3.19  Comparison 3 NIV in overnight ventilation compared to room air, Outcome 19 Nocturnal oxygen saturation (%). | ||||
| 19.1 Percentage TST SpO2 > 90% (single night) | 1 | Mean Difference (Fixed, 95% CI) | 0.0 [0.0, 0.0] | |
| 19.2 Percentage REM SpO2 > 90% (single night) | 1 | Mean Difference (Fixed, 95% CI) | 0.0 [0.0, 0.0] | |
| 19.3 Percentage NREM SpO2 > 90% (single night) | 1 | Mean Difference (Fixed, 95% CI) | 0.0 [0.0, 0.0] | |
| 20 Nocturnal TcCO2 (mmHg) Show forest plot | 2 | Mean Difference (IV, Fixed, 95% CI) | Totals not selected | |
| Analysis 3.20  Comparison 3 NIV in overnight ventilation compared to room air, Outcome 20 Nocturnal TcCO2 (mmHg). | ||||
| 20.1 TcCO2 during REM (single night) | 1 | Mean Difference (IV, Fixed, 95% CI) | 0.0 [0.0, 0.0] | |
| 20.2 TcCO2 during NREM (single night) | 1 | Mean Difference (IV, Fixed, 95% CI) | 0.0 [0.0, 0.0] | |
| 20.3 Mean change PtCO2 (up to 3 months) | 1 | Mean Difference (IV, Fixed, 95% CI) | 0.0 [0.0, 0.0] | |
| 20.4 Mean change PaCO2 (up to 3 months) | 1 | Mean Difference (IV, Fixed, 95% CI) | 0.0 [0.0, 0.0] | |
| 21 Nocturnal TcCO2(mmHg) Show forest plot | 1 | Mean Difference (Fixed, 95% CI) | Totals not selected | |
| Analysis 3.21  Comparison 3 NIV in overnight ventilation compared to room air, Outcome 21 Nocturnal TcCO2(mmHg). | ||||
| 21.1 Mean change TcCO2 NREM to REM (single night) | 1 | Mean Difference (Fixed, 95% CI) | 0.0 [0.0, 0.0] | |
| 21.2 Maximum TcCO2 (single night) | 1 | Mean Difference (Fixed, 95% CI) | 0.0 [0.0, 0.0] | |
| 22 Nocturnal TcCO2 TST (mmHg) Show forest plot | 1 | Mean Difference (IV, Fixed, 95% CI) | Totals not selected | |
| Analysis 3.22 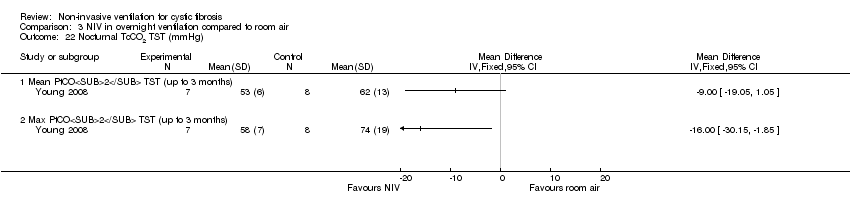 Comparison 3 NIV in overnight ventilation compared to room air, Outcome 22 Nocturnal TcCO2 TST (mmHg). | ||||
| 22.1 Mean PtCO2 TST (up to 3 months) | 1 | Mean Difference (IV, Fixed, 95% CI) | 0.0 [0.0, 0.0] | |
| 22.2 Max PtCO2 TST (up to 3 months) | 1 | Mean Difference (IV, Fixed, 95% CI) | 0.0 [0.0, 0.0] | |
| 23 Hypopneas Show forest plot | 1 | Relative rate (Fixed, 95% CI) | Totals not selected | |
| Analysis 3.23  Comparison 3 NIV in overnight ventilation compared to room air, Outcome 23 Hypopneas. | ||||
| 23.1 Single night | 1 | Relative rate (Fixed, 95% CI) | 0.0 [0.0, 0.0] | |
| Outcome or subgroup title | No. of studies | No. of participants | Statistical method | Effect size |
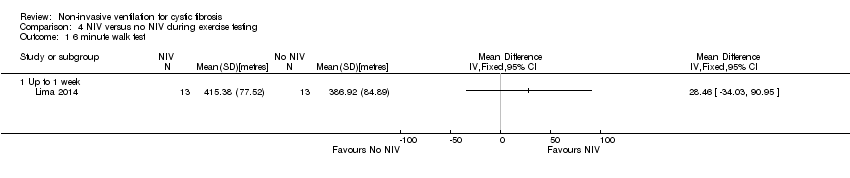
| 1 6 minute walk test Show forest plot | 1 | Mean Difference (IV, Fixed, 95% CI) | Totals not selected | |
| Analysis 4.1  Comparison 4 NIV versus no NIV during exercise testing, Outcome 1 6 minute walk test. | ||||
| 1.1 Up to 1 week | 1 | Mean Difference (IV, Fixed, 95% CI) | 0.0 [0.0, 0.0] | |

Comparison 1 NIV versus no NIV during chest physiotherapy (any technique), Outcome 1 CFQ scores.

Comparison 1 NIV versus no NIV during chest physiotherapy (any technique), Outcome 2 Fatigue.

Comparison 1 NIV versus no NIV during chest physiotherapy (any technique), Outcome 3 FEV1 (L).
Comparison 1 NIV versus no NIV during chest physiotherapy (any technique), Outcome 4 FEV1 (% predicted).

Comparison 1 NIV versus no NIV during chest physiotherapy (any technique), Outcome 5 FVC (L).
Comparison 1 NIV versus no NIV during chest physiotherapy (any technique), Outcome 6 FVC (% predicted).

Comparison 1 NIV versus no NIV during chest physiotherapy (any technique), Outcome 7 FEF25‐75 (L).

Comparison 1 NIV versus no NIV during chest physiotherapy (any technique), Outcome 8 FEF25‐75 (% predicted).

Comparison 1 NIV versus no NIV during chest physiotherapy (any technique), Outcome 9 Respiratory muscle strength PImax (cmH20).

Comparison 1 NIV versus no NIV during chest physiotherapy (any technique), Outcome 10 Respiratory muscle strength PEmax (cmH20).

Comparison 1 NIV versus no NIV during chest physiotherapy (any technique), Outcome 11 Airway resistance % predicted.

Comparison 1 NIV versus no NIV during chest physiotherapy (any technique), Outcome 12 LCI.
Comparison 1 NIV versus no NIV during chest physiotherapy (any technique), Outcome 13 Oxygen saturation during airway clearance (%).

Comparison 1 NIV versus no NIV during chest physiotherapy (any technique), Outcome 14 Oxygen saturation during airway clearance (change in SpO2 % during treatment).
Comparison 1 NIV versus no NIV during chest physiotherapy (any technique), Outcome 15 Oxygen saturation after airway clearance (SpO2).

Comparison 1 NIV versus no NIV during chest physiotherapy (any technique), Outcome 16 PaCO2.
Comparison 1 NIV versus no NIV during chest physiotherapy (any technique), Outcome 17 Breathlessness.

Comparison 1 NIV versus no NIV during chest physiotherapy (any technique), Outcome 18 Sputum wet weight (g).

Comparison 1 NIV versus no NIV during chest physiotherapy (any technique), Outcome 19 Sputum dry weight (g).
Comparison 1 NIV versus no NIV during chest physiotherapy (any technique), Outcome 20 Sputum volume per day (VAS score).

Comparison 1 NIV versus no NIV during chest physiotherapy (any technique), Outcome 21 Pseudomonas density (log CFU/g).

Comparison 1 NIV versus no NIV during chest physiotherapy (any technique), Outcome 22 Exercise capacity: 25 level modified shuttle test (m).

Comparison 1 NIV versus no NIV during chest physiotherapy (any technique), Outcome 23 Energy (VAS score).

Comparison 1 NIV versus no NIV during chest physiotherapy (any technique), Outcome 24 6MWT.

Comparison 1 NIV versus no NIV during chest physiotherapy (any technique), Outcome 25 Length of hospital stay (days).

Comparison 1 NIV versus no NIV during chest physiotherapy (any technique), Outcome 26 Time to next admission (days).

Comparison 2 NIV in overnight ventilation compared to oxygen, Outcome 1 CFQoL chest symptom score.
Comparison 2 NIV in overnight ventilation compared to oxygen, Outcome 2 CFQoL transitional dyspnoea index.

Comparison 2 NIV in overnight ventilation compared to oxygen, Outcome 3 Symptoms of sleep‐disordered breathing.

Comparison 2 NIV in overnight ventilation compared to oxygen, Outcome 4 Lung function during sleep.

Comparison 2 NIV in overnight ventilation compared to oxygen, Outcome 5 Respiratory rate (breaths/min).
Comparison 2 NIV in overnight ventilation compared to oxygen, Outcome 6 Lung function while awake.
Comparison 2 NIV in overnight ventilation compared to oxygen, Outcome 7 Arterial blood gases: pH.
Comparison 2 NIV in overnight ventilation compared to oxygen, Outcome 8 Arterial blood gases: PaO2 (mmHg).

Comparison 2 NIV in overnight ventilation compared to oxygen, Outcome 9 Arterial blood gases: PaCO2 (mmHg).

Comparison 2 NIV in overnight ventilation compared to oxygen, Outcome 10 Arterial blood gases: HCO3 (mmol/L).
Comparison 2 NIV in overnight ventilation compared to oxygen, Outcome 11 Arterial blood gases: SaO2 (%).

Comparison 2 NIV in overnight ventilation compared to oxygen, Outcome 12 Exercise performance (MSWT) (metres).
Comparison 2 NIV in overnight ventilation compared to oxygen, Outcome 13 Total sleep time (min).

Comparison 2 NIV in overnight ventilation compared to oxygen, Outcome 14 REM sleep architecture.

Comparison 2 NIV in overnight ventilation compared to oxygen, Outcome 15 Sleep latency (min).

Comparison 2 NIV in overnight ventilation compared to oxygen, Outcome 16 Nocturnal oxygen saturation (%).

Comparison 2 NIV in overnight ventilation compared to oxygen, Outcome 17 Nocturnal oxygen saturation (%).

Comparison 2 NIV in overnight ventilation compared to oxygen, Outcome 18 Nocturnal TcCO2 (mmHg.

Comparison 2 NIV in overnight ventilation compared to oxygen, Outcome 19 Nocturnal TcCO2 (mmHg).

Comparison 2 NIV in overnight ventilation compared to oxygen, Outcome 20 Nocturnal TcCO2 TST (mmHg).
Comparison 2 NIV in overnight ventilation compared to oxygen, Outcome 21 Hypopneas.

Comparison 2 NIV in overnight ventilation compared to oxygen, Outcome 22 Mean heart rate (beats/min).

Comparison 2 NIV in overnight ventilation compared to oxygen, Outcome 23 Respiratory rate.
Comparison 3 NIV in overnight ventilation compared to room air, Outcome 1 CF QoL chest symptom score.

Comparison 3 NIV in overnight ventilation compared to room air, Outcome 2 CF QoL traditional dyspnoea index score.

Comparison 3 NIV in overnight ventilation compared to room air, Outcome 3 Symptoms of sleep‐disordered breathing.

Comparison 3 NIV in overnight ventilation compared to room air, Outcome 4 Lung function during sleep.

Comparison 3 NIV in overnight ventilation compared to room air, Outcome 5 Respiratory rate(breaths/min) during sleep.
Comparison 3 NIV in overnight ventilation compared to room air, Outcome 6 Mean Respiratory Rate.
Comparison 3 NIV in overnight ventilation compared to room air, Outcome 7 Mean Heart Rate (beats/min).

Comparison 3 NIV in overnight ventilation compared to room air, Outcome 8 Lung function while awake.

Comparison 3 NIV in overnight ventilation compared to room air, Outcome 9 Arterial blood gases: pH.
Comparison 3 NIV in overnight ventilation compared to room air, Outcome 10 Arterial blood gases: PaO2 (mmHg).

Comparison 3 NIV in overnight ventilation compared to room air, Outcome 11 Arterial blood gases: PaCO2 (mmHg).
Comparison 3 NIV in overnight ventilation compared to room air, Outcome 12 Arterial blood gases: HCO3 (mmol/L).

Comparison 3 NIV in overnight ventilation compared to room air, Outcome 13 Arterial blood gases: SaO2 (%).

Comparison 3 NIV in overnight ventilation compared to room air, Outcome 14 Exercise performance (metres).

Comparison 3 NIV in overnight ventilation compared to room air, Outcome 15 Total sleep time (min).

Comparison 3 NIV in overnight ventilation compared to room air, Outcome 16 REM sleep architecture.
Comparison 3 NIV in overnight ventilation compared to room air, Outcome 17 Sleep latency.

Comparison 3 NIV in overnight ventilation compared to room air, Outcome 18 Nocturnal oxygen saturation (%).

Comparison 3 NIV in overnight ventilation compared to room air, Outcome 19 Nocturnal oxygen saturation (%).
Comparison 3 NIV in overnight ventilation compared to room air, Outcome 20 Nocturnal TcCO2 (mmHg).

Comparison 3 NIV in overnight ventilation compared to room air, Outcome 21 Nocturnal TcCO2(mmHg).

Comparison 3 NIV in overnight ventilation compared to room air, Outcome 22 Nocturnal TcCO2 TST (mmHg).

Comparison 3 NIV in overnight ventilation compared to room air, Outcome 23 Hypopneas.
Comparison 4 NIV versus no NIV during exercise testing, Outcome 1 6 minute walk test.
| Abbreviation | Definition | Explanation |
| 6MWT | six minute walk test | |
| ABG | analysis of arterial blood gases | |
| ACBT | active cycle of breathing technique | |
| AHI | apnoea/hypopnoea Index | |
| CF | cystic fibrosis | |
| COPD | chronic obstructive pulmonary disease | |
| CPAP | continuous positive airway pressure | a system that maintains a positive pressure in the circuitry and airways throughout inspiration and expiration |
| CPT | chest physiotherapy | |
| CSS | chest symptom score | a validated CF quality of life measurement on a scale of 0 (worst) to 100 (best) |
| ESS | Epworth sleepiness scale | a scale measuring sleepiness ranging from 0 (best) to 24 (worst) |
| FEF25‐75 | flow rate between 25% and 75% of maximal expiration | |
| FEV₁ | forced expiratory volume in 1 second | |
| FRC | functional residual capacity | resting volume of the lungs |
| FVC | forced vital capacity | total volume of air expired during a forced expiration following a full inspiration |
| Global PSQI | Global score Pittsburgh sleep quality index | sleep quality scale ranging from 0 (best) to 21 (worst) |
| LCI | lung clearance index | measured by multiple breath washouts; a sensitive measure of ventilation inhomogeneity |
| MEF50 | maximal expiratory flow with 50% of vital capacity remaining in the lung | |
| mmHg | millimetres of mercury | |
| mSpO2 | mean oxygen saturation | |
| MSWT | modified shuttle walk test | incremental exercise tolerance test with minimum clinically important difference = 40 m |
| nadirSpO₂ | the largest fall expressed in the absolute value of SpO₂ | |
| NIPPV | non‐invasive positive pressure ventilation | |
| NIV | non‐invasive ventilation | |
| NREM | non‐rapid eye movement | a phase during sleep |
| ODI | oxygen desaturation index | |
| OEP | optoelectronic plethysmography | |
| PaCO₂ | partial pressure of carbon dioxide in arterial blood | |
| PaO₂ | partial pressure of oxygen in arterial blood | |
| PEP | positive expiratory pressure | an airway clearance technique |
| PSV | pressure support ventilation | |
| QoL | quality of life | |
| RCT | randomised controlled trial | |
| RDI | respiratory disturbance index | |
| RE | respiratory exacerbations | |
| REM | rapid eye movement | a phase during sleep |
| RR | respiratory rate | |
| SaO₂ | saturation of haemoglobin with oxygen in arterial blood | |
| SD | standard deviation | |
| SOB | shortness of breath | |
| SpO2 | saturation of haemoglobin with oxygen using pulse oximetry | |
| *SpO2 max | the largest fall expressed as the difference with the SpO2 just before the manoeuvre | |
| *SpO₂ mean | the mean of *SpO₂ max during the whole chest physiotherapy period | |
| SWT | shuttle walk test | |
| TcCO₂ | transcutaneous carbon dioxide | |
| TDI | transitional dyspnoea index | a measurement of CF quality of life, scores ranging from ‐9 (worst) to +9 (best); the minimal clinically important difference is 1 unit |
| TLC | total lung capacity | total volume of air in lungs following a maximum inspiration |
| TST | total sleep time | |
| TWT | treadmill walking test | |
| VI | minute ventilation | |
| VT | tidal volume | volume air inspired or expired during normal breathing |
| IPAP | inspiratory positive airway pressure | |
| PImax | inspiratory respiratory muscle strength | |
| PEmax | expiratory respiratory muscle strength | |
| Vab | abdominal volume of the chest wall | variable calculated from OEP |
| Vrca | abdominal rib cage volume | variable calculated from OEP |
| Vrcp | pulmonary rib cage volume | variable calculated from OEP |
| Outcome or subgroup title | No. of studies | No. of participants | Statistical method | Effect size |
| 1 CFQ scores Show forest plot | 1 | Mean Difference (IV, Fixed, 95% CI) | Totals not selected | |
| 1.1 Physical Domain | 1 | Mean Difference (IV, Fixed, 95% CI) | 0.0 [0.0, 0.0] | |
| 1.2 Health Domain | 1 | Mean Difference (IV, Fixed, 95% CI) | 0.0 [0.0, 0.0] | |
| 1.3 Respiratory Domain | 1 | Mean Difference (IV, Fixed, 95% CI) | 0.0 [0.0, 0.0] | |
| 2 Fatigue Show forest plot | 1 | Mean Difference (IV, Fixed, 95% CI) | Totals not selected | |
| 3 FEV1 (L) Show forest plot | 2 | Mean Difference (IV, Fixed, 95% CI) | Subtotals only | |
| 3.1 Up to 1 week (directed cough) | 2 | 86 | Mean Difference (IV, Fixed, 95% CI) | ‐0.03 [‐0.17, 0.12] |
| 3.2 Up to 1 week (PEP) | 1 | 34 | Mean Difference (IV, Fixed, 95% CI) | ‐0.05 [‐0.22, 0.12] |
| 4 FEV1 (% predicted) Show forest plot | 3 | Mean Difference (IV, Fixed, 95% CI) | Totals not selected | |
| 4.1 Up to 1 week (directed cough) | 1 | Mean Difference (IV, Fixed, 95% CI) | 0.0 [0.0, 0.0] | |
| 4.2 Up to 2 weeks (all techniques combined) | 1 | Mean Difference (IV, Fixed, 95% CI) | 0.0 [0.0, 0.0] | |
| 4.3 Up to 3 months (PEP) | 1 | Mean Difference (IV, Fixed, 95% CI) | 0.0 [0.0, 0.0] | |
| 5 FVC (L) Show forest plot | 2 | Mean Difference (IV, Fixed, 95% CI) | Subtotals only | |
| 5.1 Up to 1 week (directed cough) | 2 | 86 | Mean Difference (IV, Fixed, 95% CI) | 0.00 [‐0.30, 0.30] |
| 5.2 Up to 1 week (PEP) | 1 | 34 | Mean Difference (IV, Fixed, 95% CI) | ‐0.07 [‐0.47, 0.33] |
| 6 FVC (% predicted) Show forest plot | 2 | Mean Difference (IV, Fixed, 95% CI) | Totals not selected | |
| 6.1 Up to 1 week (directed cough) | 1 | Mean Difference (IV, Fixed, 95% CI) | 0.0 [0.0, 0.0] | |
| 6.2 Up to 3 months (PEP) | 1 | Mean Difference (IV, Fixed, 95% CI) | 0.0 [0.0, 0.0] | |
| 7 FEF25‐75 (L) Show forest plot | 2 | Mean Difference (IV, Fixed, 95% CI) | Subtotals only | |
| 7.1 Up to 1 week (directed cough) | 2 | 86 | Mean Difference (IV, Fixed, 95% CI) | ‐0.00 [‐0.08, 0.07] |
| 7.2 Up to 1 week (PEP) | 1 | 34 | Mean Difference (IV, Fixed, 95% CI) | 0.0 [‐0.07, 0.07] |
| 8 FEF25‐75 (% predicted) Show forest plot | 1 | Mean Difference (IV, Fixed, 95% CI) | Totals not selected | |
| 8.1 Up to 1 week (directed cough) | 1 | Mean Difference (IV, Fixed, 95% CI) | 0.0 [0.0, 0.0] | |
| 9 Respiratory muscle strength PImax (cmH20) Show forest plot | 2 | Mean Difference (IV, Fixed, 95% CI) | Totals not selected | |
| 9.1 Up to 1 week (all techniques combined) | 1 | Mean Difference (IV, Fixed, 95% CI) | 0.0 [0.0, 0.0] | |
| 9.2 Up to 2 weeks (all techniques combined) | 1 | Mean Difference (IV, Fixed, 95% CI) | 0.0 [0.0, 0.0] | |
| 10 Respiratory muscle strength PEmax (cmH20) Show forest plot | 2 | Mean Difference (IV, Fixed, 95% CI) | Totals not selected | |
| 10.1 Up to 1 week (all techniques combined) | 1 | Mean Difference (IV, Fixed, 95% CI) | 0.0 [0.0, 0.0] | |
| 10.2 Up to 2 weeks (all techniques combined) | 1 | Mean Difference (IV, Fixed, 95% CI) | 0.0 [0.0, 0.0] | |
| 11 Airway resistance % predicted Show forest plot | 1 | Mean Difference (IV, Fixed, 95% CI) | Totals not selected | |
| 11.1 Up to 1 week (all techniques combined) | 1 | Mean Difference (IV, Fixed, 95% CI) | 0.0 [0.0, 0.0] | |
| 12 LCI Show forest plot | 1 | Mean Difference (IV, Fixed, 95% CI) | Totals not selected | |
| 12.1 Up to 3 months (PEP) | 1 | Mean Difference (IV, Fixed, 95% CI) | 0.0 [0.0, 0.0] | |
| 13 Oxygen saturation during airway clearance (%) Show forest plot | 1 | Mean Difference (IV, Fixed, 95% CI) | Totals not selected | |
| 13.1 Up to 1 week (all techniques combined) | 1 | Mean Difference (IV, Fixed, 95% CI) | 0.0 [0.0, 0.0] | |
| 14 Oxygen saturation during airway clearance (change in SpO2 % during treatment) Show forest plot | 1 | Mean Difference (IV, Fixed, 95% CI) | Totals not selected | |
| 14.1 Up to 1 week (all techniques combined) | 1 | Mean Difference (IV, Fixed, 95% CI) | 0.0 [0.0, 0.0] | |
| 15 Oxygen saturation after airway clearance (SpO2) Show forest plot | 1 | Mean Difference (IV, Fixed, 95% CI) | Totals not selected | |
| 15.1 Up to 1 week (directed cough) | 1 | Mean Difference (IV, Fixed, 95% CI) | 0.0 [0.0, 0.0] | |
| 15.2 Up to 1 week (PEP) | 1 | Mean Difference (IV, Fixed, 95% CI) | 0.0 [0.0, 0.0] | |
| 16 PaCO2 Show forest plot | 1 | Mean Difference (IV, Fixed, 95% CI) | Totals not selected | |
| 16.1 Up to 3 months (PEP) | 1 | Mean Difference (IV, Fixed, 95% CI) | 0.0 [0.0, 0.0] | |
| 17 Breathlessness Show forest plot | 2 | Std. Mean Difference (IV, Fixed, 95% CI) | Totals not selected | |
| 17.1 Up to 1 week (Borg breathlessness score) | 1 | Std. Mean Difference (IV, Fixed, 95% CI) | 0.0 [0.0, 0.0] | |
| 17.2 Up to 2 weeks (VAS score) | 1 | Std. Mean Difference (IV, Fixed, 95% CI) | 0.0 [0.0, 0.0] | |
| 18 Sputum wet weight (g) Show forest plot | 3 | Mean Difference (IV, Fixed, 95% CI) | Subtotals only | |
| 18.1 Up to 1 week (directed cough) | 3 | 118 | Mean Difference (IV, Fixed, 95% CI) | ‐0.69 [‐3.06, 1.67] |
| 18.2 Up to 1 week (PEP) | 1 | 34 | Mean Difference (IV, Fixed, 95% CI) | ‐2.58 [‐6.11, 0.95] |
| 19 Sputum dry weight (g) Show forest plot | 1 | Mean Difference (IV, Fixed, 95% CI) | Totals not selected | |
| 19.1 Up to 1 week (directed cough) | 1 | Mean Difference (IV, Fixed, 95% CI) | 0.0 [0.0, 0.0] | |
| 19.2 Up to 1 week (PEP) | 1 | Mean Difference (IV, Fixed, 95% CI) | 0.0 [0.0, 0.0] | |
| 20 Sputum volume per day (VAS score) Show forest plot | 1 | Mean Difference (IV, Fixed, 95% CI) | Totals not selected | |
| 20.1 Up to 2 weeks (all techniques combined) | 1 | Mean Difference (IV, Fixed, 95% CI) | 0.0 [0.0, 0.0] | |
| 21 Pseudomonas density (log CFU/g) Show forest plot | 1 | Mean Difference (IV, Fixed, 95% CI) | Totals not selected | |
| 21.1 Up to 2 weeks (all techniques combined) | 1 | Mean Difference (IV, Fixed, 95% CI) | 0.0 [0.0, 0.0] | |
| 22 Exercise capacity: 25 level modified shuttle test (m) Show forest plot | 1 | Mean Difference (IV, Fixed, 95% CI) | Totals not selected | |
| 22.1 Up to 2 weeks (all techniques combined) | 1 | Mean Difference (IV, Fixed, 95% CI) | 0.0 [0.0, 0.0] | |
| 23 Energy (VAS score) Show forest plot | 1 | Mean Difference (IV, Fixed, 95% CI) | Totals not selected | |
| 23.1 Up to 2 weeks (all techniques combined) | 1 | Mean Difference (IV, Fixed, 95% CI) | 0.0 [0.0, 0.0] | |
| 24 6MWT Show forest plot | 1 | Mean Difference (IV, Fixed, 95% CI) | Totals not selected | |
| 24.1 Up to 3 months (PEP) | 1 | Mean Difference (IV, Fixed, 95% CI) | 0.0 [0.0, 0.0] | |
| 25 Length of hospital stay (days) Show forest plot | 1 | Mean Difference (IV, Fixed, 95% CI) | Totals not selected | |
| 25.1 Up to 2 weeks (all techniques combined) | 1 | Mean Difference (IV, Fixed, 95% CI) | 0.0 [0.0, 0.0] | |
| 26 Time to next admission (days) Show forest plot | 1 | Mean Difference (IV, Fixed, 95% CI) | Totals not selected | |
| Outcome or subgroup title | No. of studies | No. of participants | Statistical method | Effect size |
| 1 CFQoL chest symptom score Show forest plot | 1 | Mean Difference (IV, Fixed, 95% CI) | Totals not selected | |
| 1.1 Up to 3 months | 1 | Mean Difference (IV, Fixed, 95% CI) | 0.0 [0.0, 0.0] | |
| 2 CFQoL transitional dyspnoea index Show forest plot | 1 | Mean Difference (IV, Fixed, 95% CI) | Totals not selected | |
| 2.1 Up to 3 months | 1 | Mean Difference (IV, Fixed, 95% CI) | 0.0 [0.0, 0.0] | |
| 3 Symptoms of sleep‐disordered breathing Show forest plot | 1 | Mean Difference (IV, Fixed, 95% CI) | Totals not selected | |
| 3.1 Epworth Sleepiness Scale (up to 3 months) | 1 | Mean Difference (IV, Fixed, 95% CI) | 0.0 [0.0, 0.0] | |
| 3.2 Global PSQI (up to 3 months) | 1 | Mean Difference (IV, Fixed, 95% CI) | 0.0 [0.0, 0.0] | |
| 4 Lung function during sleep Show forest plot | 1 | Mean Difference (Fixed, 95% CI) | Totals not selected | |
| 4.1 VI (L/m) while awake (single night) | 1 | Mean Difference (Fixed, 95% CI) | 0.0 [0.0, 0.0] | |
| 4.2 VI (L/m) during REM (single night) | 1 | Mean Difference (Fixed, 95% CI) | 0.0 [0.0, 0.0] | |
| 4.3 VI (L/m) during NREM (single night) | 1 | Mean Difference (Fixed, 95% CI) | 0.0 [0.0, 0.0] | |
| 4.4 VT (L) while awake (single night) | 1 | Mean Difference (Fixed, 95% CI) | 0.0 [0.0, 0.0] | |
| 4.5 VT (L) during REM (single night) | 1 | Mean Difference (Fixed, 95% CI) | 0.0 [0.0, 0.0] | |
| 4.6 VT (L) during NREM (single night) | 1 | Mean Difference (Fixed, 95% CI) | 0.0 [0.0, 0.0] | |
| 5 Respiratory rate (breaths/min) Show forest plot | 1 | Mean Difference (Fixed, 95% CI) | Totals not selected | |
| 5.1 RR while awake (single night) | 1 | Mean Difference (Fixed, 95% CI) | 0.0 [0.0, 0.0] | |
| 5.2 RR during REM (single night) | 1 | Mean Difference (Fixed, 95% CI) | 0.0 [0.0, 0.0] | |
| 5.3 RR during NREM (single night) | 1 | Mean Difference (Fixed, 95% CI) | 0.0 [0.0, 0.0] | |
| 6 Lung function while awake Show forest plot | 1 | Mean Difference (IV, Fixed, 95% CI) | Totals not selected | |
| 6.1 FEV1% predicted (up to 3 months) | 1 | Mean Difference (IV, Fixed, 95% CI) | 0.0 [0.0, 0.0] | |
| 6.2 FVC % predicted (up to 3 months) | 1 | Mean Difference (IV, Fixed, 95% CI) | 0.0 [0.0, 0.0] | |
| 7 Arterial blood gases: pH Show forest plot | 1 | Mean Difference (IV, Fixed, 95% CI) | Totals not selected | |
| 7.1 Up to 3 months | 1 | Mean Difference (IV, Fixed, 95% CI) | 0.0 [0.0, 0.0] | |
| 8 Arterial blood gases: PaO2 (mmHg) Show forest plot | 1 | Mean Difference (IV, Fixed, 95% CI) | Totals not selected | |
| 8.1 Up to 3 months | 1 | Mean Difference (IV, Fixed, 95% CI) | 0.0 [0.0, 0.0] | |
| 9 Arterial blood gases: PaCO2 (mmHg) Show forest plot | 1 | Mean Difference (IV, Fixed, 95% CI) | Totals not selected | |
| 9.1 Up to 3 months | 1 | Mean Difference (IV, Fixed, 95% CI) | 0.0 [0.0, 0.0] | |
| 10 Arterial blood gases: HCO3 (mmol/L) Show forest plot | 1 | Mean Difference (IV, Fixed, 95% CI) | Totals not selected | |
| 10.1 Up to 3 months | 1 | Mean Difference (IV, Fixed, 95% CI) | 0.0 [0.0, 0.0] | |
| 11 Arterial blood gases: SaO2 (%) Show forest plot | 1 | Mean Difference (IV, Fixed, 95% CI) | Totals not selected | |
| 11.1 Up to 3 months | 1 | Mean Difference (IV, Fixed, 95% CI) | 0.0 [0.0, 0.0] | |
| 12 Exercise performance (MSWT) (metres) Show forest plot | 1 | Mean Difference (IV, Fixed, 95% CI) | Totals not selected | |
| 12.1 Up to 3 months | 1 | Mean Difference (IV, Fixed, 95% CI) | 0.0 [0.0, 0.0] | |
| 13 Total sleep time (min) Show forest plot | 2 | Mean Difference (IV, Fixed, 95% CI) | Totals not selected | |
| 13.1 Single night | 1 | Mean Difference (IV, Fixed, 95% CI) | 0.0 [0.0, 0.0] | |
| 13.2 Up to 3 months | 1 | Mean Difference (IV, Fixed, 95% CI) | 0.0 [0.0, 0.0] | |
| 14 REM sleep architecture Show forest plot | 2 | Mean Difference (IV, Fixed, 95% CI) | Totals not selected | |
| 14.1 REM (single night) | 1 | Mean Difference (IV, Fixed, 95% CI) | 0.0 [0.0, 0.0] | |
| 14.2 REM %TST (single night) | 1 | Mean Difference (IV, Fixed, 95% CI) | 0.0 [0.0, 0.0] | |
| 14.3 REM % TST (up to 3 months) | 1 | Mean Difference (IV, Fixed, 95% CI) | 0.0 [0.0, 0.0] | |
| 15 Sleep latency (min) Show forest plot | 3 | Mean Difference (IV, Fixed, 95% CI) | Subtotals only | |
| 15.1 Single night | 2 | 38 | Mean Difference (IV, Fixed, 95% CI) | 2.93 [‐0.32, 6.19] |
| 15.2 Up to 3 months | 1 | 15 | Mean Difference (IV, Fixed, 95% CI) | ‐5.0 [‐19.17, 9.17] |
| 16 Nocturnal oxygen saturation (%) Show forest plot | 2 | Mean Difference (IV, Fixed, 95% CI) | Totals not selected | |
| 16.1 Mean SpO2 REM (single night) | 1 | Mean Difference (IV, Fixed, 95% CI) | 0.0 [0.0, 0.0] | |
| 16.2 Mean SpO2 NREM (single night) | 1 | Mean Difference (IV, Fixed, 95% CI) | 0.0 [0.0, 0.0] | |
| 16.3 Mean SpO2 for TST (up to 3 months) | 1 | Mean Difference (IV, Fixed, 95% CI) | 0.0 [0.0, 0.0] | |
| 16.4 TST with SpO2 < 90% (up to 3 months) | 1 | Mean Difference (IV, Fixed, 95% CI) | 0.0 [0.0, 0.0] | |
| 17 Nocturnal oxygen saturation (%) Show forest plot | 1 | Mean Difference (Fixed, 95% CI) | Totals not selected | |
| 17.1 Percentage TST SpO2>90% | 1 | Mean Difference (Fixed, 95% CI) | 0.0 [0.0, 0.0] | |
| 17.2 Percentage REM SpO2>90% | 1 | Mean Difference (Fixed, 95% CI) | 0.0 [0.0, 0.0] | |
| 17.3 Percentage NREM SpO2>90% | 1 | Mean Difference (Fixed, 95% CI) | 0.0 [0.0, 0.0] | |
| 18 Nocturnal TcCO2 (mmHg Show forest plot | 2 | Mean Difference (IV, Fixed, 95% CI) | Totals not selected | |
| 18.1 TcCO2 during REM (single night) | 1 | Mean Difference (IV, Fixed, 95% CI) | 0.0 [0.0, 0.0] | |
| 18.2 TcCO2 during NREM (single night) | 1 | Mean Difference (IV, Fixed, 95% CI) | 0.0 [0.0, 0.0] | |
| 18.3 Mean change PtCO2 (mmHg) (up to 3 months) | 1 | Mean Difference (IV, Fixed, 95% CI) | 0.0 [0.0, 0.0] | |
| 18.4 Mean change PaCO2 (mmHg) (up to 3 months) | 1 | Mean Difference (IV, Fixed, 95% CI) | 0.0 [0.0, 0.0] | |
| 19 Nocturnal TcCO2 (mmHg) Show forest plot | 1 | Mean Difference (Fixed, 95% CI) | Totals not selected | |
| 19.1 Mean change TcCO2 NREM to REM (single night) | 1 | Mean Difference (Fixed, 95% CI) | 0.0 [0.0, 0.0] | |
| 19.2 Maximum TcCO2 (single night) | 1 | Mean Difference (Fixed, 95% CI) | 0.0 [0.0, 0.0] | |
| 20 Nocturnal TcCO2 TST (mmHg) Show forest plot | 1 | Mean Difference (IV, Fixed, 95% CI) | Totals not selected | |
| 20.1 Mean PtCO2 TST (up to 3 months) | 1 | Mean Difference (IV, Fixed, 95% CI) | 0.0 [0.0, 0.0] | |
| 20.2 Maximum PtCO2 TST (up to 3 months) | 1 | Mean Difference (IV, Fixed, 95% CI) | 0.0 [0.0, 0.0] | |
| 21 Hypopneas Show forest plot | 1 | Relative rate (Fixed, 95% CI) | Totals not selected | |
| 21.1 Single night | 1 | Relative rate (Fixed, 95% CI) | 0.0 [0.0, 0.0] | |
| 22 Mean heart rate (beats/min) Show forest plot | 1 | Mean Difference (IV, Fixed, 95% CI) | Totals not selected | |
| 22.1 Up to 3 months | 1 | Mean Difference (IV, Fixed, 95% CI) | 0.0 [0.0, 0.0] | |
| 23 Respiratory rate Show forest plot | 1 | Mean Difference (IV, Fixed, 95% CI) | Totals not selected | |
| 23.1 Up to 3 months | 1 | Mean Difference (IV, Fixed, 95% CI) | 0.0 [0.0, 0.0] | |
| Outcome or subgroup title | No. of studies | No. of participants | Statistical method | Effect size |
| 1 CF QoL chest symptom score Show forest plot | 1 | Mean Difference (IV, Fixed, 95% CI) | Totals not selected | |
| 1.1 Up to 3 months | 1 | Mean Difference (IV, Fixed, 95% CI) | 0.0 [0.0, 0.0] | |
| 2 CF QoL traditional dyspnoea index score Show forest plot | 1 | Mean Difference (IV, Fixed, 95% CI) | Totals not selected | |
| 2.1 Up to 3 months | 1 | Mean Difference (IV, Fixed, 95% CI) | 0.0 [0.0, 0.0] | |
| 3 Symptoms of sleep‐disordered breathing Show forest plot | 1 | Mean Difference (IV, Fixed, 95% CI) | Totals not selected | |
| 3.1 Epworth sleepiness scale (up to 3 months) | 1 | Mean Difference (IV, Fixed, 95% CI) | 0.0 [0.0, 0.0] | |
| 3.2 Global PSQI (up to 3 months) | 1 | Mean Difference (IV, Fixed, 95% CI) | 0.0 [0.0, 0.0] | |
| 4 Lung function during sleep Show forest plot | 1 | Mean Difference (Fixed, 95% CI) | Totals not selected | |
| 4.1 VI while awake (single night) | 1 | Mean Difference (Fixed, 95% CI) | 0.0 [0.0, 0.0] | |
| 4.2 VI during REM (single night) | 1 | Mean Difference (Fixed, 95% CI) | 0.0 [0.0, 0.0] | |
| 4.3 VI during NREM (single night) | 1 | Mean Difference (Fixed, 95% CI) | 0.0 [0.0, 0.0] | |
| 4.4 VT while awake (single night) | 1 | Mean Difference (Fixed, 95% CI) | 0.0 [0.0, 0.0] | |
| 4.5 VT during REM (single night) | 1 | Mean Difference (Fixed, 95% CI) | 0.0 [0.0, 0.0] | |
| 4.6 VT during NREM (single night) | 1 | Mean Difference (Fixed, 95% CI) | 0.0 [0.0, 0.0] | |
| 5 Respiratory rate(breaths/min) during sleep Show forest plot | 1 | Mean Difference (Fixed, 95% CI) | Totals not selected | |
| 5.1 RR while awake (single night) | 1 | Mean Difference (Fixed, 95% CI) | 0.0 [0.0, 0.0] | |
| 5.2 RR during REM (single night) | 1 | Mean Difference (Fixed, 95% CI) | 0.0 [0.0, 0.0] | |
| 5.3 RR during NREM (single night) | 1 | Mean Difference (Fixed, 95% CI) | 0.0 [0.0, 0.0] | |
| 6 Mean Respiratory Rate Show forest plot | 1 | Mean Difference (IV, Fixed, 95% CI) | Totals not selected | |
| 6.1 Up to 3 months | 1 | Mean Difference (IV, Fixed, 95% CI) | 0.0 [0.0, 0.0] | |
| 7 Mean Heart Rate (beats/min) Show forest plot | 1 | Mean Difference (IV, Fixed, 95% CI) | Totals not selected | |
| 7.1 Up to 3 months | 1 | Mean Difference (IV, Fixed, 95% CI) | 0.0 [0.0, 0.0] | |
| 8 Lung function while awake Show forest plot | 1 | Mean Difference (IV, Fixed, 95% CI) | Totals not selected | |
| 8.1 FEV1% predicted (up to 3 months) | 1 | Mean Difference (IV, Fixed, 95% CI) | 0.0 [0.0, 0.0] | |
| 8.2 FVC % predicted (up to 3 months) | 1 | Mean Difference (IV, Fixed, 95% CI) | 0.0 [0.0, 0.0] | |
| 9 Arterial blood gases: pH Show forest plot | 1 | Mean Difference (IV, Fixed, 95% CI) | Totals not selected | |
| 9.1 Up to 3 months | 1 | Mean Difference (IV, Fixed, 95% CI) | 0.0 [0.0, 0.0] | |
| 10 Arterial blood gases: PaO2 (mmHg) Show forest plot | 1 | Mean Difference (IV, Fixed, 95% CI) | Totals not selected | |
| 10.1 Up to 3 months | 1 | Mean Difference (IV, Fixed, 95% CI) | 0.0 [0.0, 0.0] | |
| 11 Arterial blood gases: PaCO2 (mmHg) Show forest plot | 1 | Mean Difference (IV, Fixed, 95% CI) | Totals not selected | |
| 11.1 Up to 3 months | 1 | Mean Difference (IV, Fixed, 95% CI) | 0.0 [0.0, 0.0] | |
| 12 Arterial blood gases: HCO3 (mmol/L) Show forest plot | 1 | Mean Difference (IV, Fixed, 95% CI) | Totals not selected | |
| 12.1 Up to 3 months | 1 | Mean Difference (IV, Fixed, 95% CI) | 0.0 [0.0, 0.0] | |
| 13 Arterial blood gases: SaO2 (%) Show forest plot | 1 | Mean Difference (IV, Fixed, 95% CI) | Totals not selected | |
| 13.1 Up to 3 months | 1 | Mean Difference (IV, Fixed, 95% CI) | 0.0 [0.0, 0.0] | |
| 14 Exercise performance (metres) Show forest plot | 1 | Mean Difference (IV, Fixed, 95% CI) | Totals not selected | |
| 14.1 Up to 3 months | 1 | Mean Difference (IV, Fixed, 95% CI) | 0.0 [0.0, 0.0] | |
| 15 Total sleep time (min) Show forest plot | 2 | Mean Difference (IV, Fixed, 95% CI) | Totals not selected | |
| 15.1 Single night | 1 | Mean Difference (IV, Fixed, 95% CI) | 0.0 [0.0, 0.0] | |
| 15.2 Up to 3 months | 1 | Mean Difference (IV, Fixed, 95% CI) | 0.0 [0.0, 0.0] | |
| 16 REM sleep architecture Show forest plot | 2 | Mean Difference (IV, Fixed, 95% CI) | Totals not selected | |
| 16.1 REM (single night) | 1 | Mean Difference (IV, Fixed, 95% CI) | 0.0 [0.0, 0.0] | |
| 16.2 REM %TST (single night) | 1 | Mean Difference (IV, Fixed, 95% CI) | 0.0 [0.0, 0.0] | |
| 16.3 REM % TST (up to 3 months) | 1 | Mean Difference (IV, Fixed, 95% CI) | 0.0 [0.0, 0.0] | |
| 17 Sleep latency Show forest plot | 3 | Mean Difference (IV, Fixed, 95% CI) | Subtotals only | |
| 17.1 Single night | 2 | 38 | Mean Difference (IV, Fixed, 95% CI) | ‐2.63 [‐7.37, 2.11] |
| 17.2 At 6 weeks | 1 | 15 | Mean Difference (IV, Fixed, 95% CI) | ‐3.00 [‐19.88, 13.88] |
| 18 Nocturnal oxygen saturation (%) Show forest plot | 2 | Mean Difference (IV, Fixed, 95% CI) | Totals not selected | |
| 18.1 Mean SpO2 REM (single night) | 1 | Mean Difference (IV, Fixed, 95% CI) | 0.0 [0.0, 0.0] | |
| 18.2 Mean SpO2 NREM (single night) | 1 | Mean Difference (IV, Fixed, 95% CI) | 0.0 [0.0, 0.0] | |
| 18.3 Mean SpO2 for TST (up to 3 months) | 1 | Mean Difference (IV, Fixed, 95% CI) | 0.0 [0.0, 0.0] | |
| 18.4 TST for SpO2 < 90% (up to 3 months) | 1 | Mean Difference (IV, Fixed, 95% CI) | 0.0 [0.0, 0.0] | |
| 19 Nocturnal oxygen saturation (%) Show forest plot | 1 | Mean Difference (Fixed, 95% CI) | Totals not selected | |
| 19.1 Percentage TST SpO2 > 90% (single night) | 1 | Mean Difference (Fixed, 95% CI) | 0.0 [0.0, 0.0] | |
| 19.2 Percentage REM SpO2 > 90% (single night) | 1 | Mean Difference (Fixed, 95% CI) | 0.0 [0.0, 0.0] | |
| 19.3 Percentage NREM SpO2 > 90% (single night) | 1 | Mean Difference (Fixed, 95% CI) | 0.0 [0.0, 0.0] | |
| 20 Nocturnal TcCO2 (mmHg) Show forest plot | 2 | Mean Difference (IV, Fixed, 95% CI) | Totals not selected | |
| 20.1 TcCO2 during REM (single night) | 1 | Mean Difference (IV, Fixed, 95% CI) | 0.0 [0.0, 0.0] | |
| 20.2 TcCO2 during NREM (single night) | 1 | Mean Difference (IV, Fixed, 95% CI) | 0.0 [0.0, 0.0] | |
| 20.3 Mean change PtCO2 (up to 3 months) | 1 | Mean Difference (IV, Fixed, 95% CI) | 0.0 [0.0, 0.0] | |
| 20.4 Mean change PaCO2 (up to 3 months) | 1 | Mean Difference (IV, Fixed, 95% CI) | 0.0 [0.0, 0.0] | |
| 21 Nocturnal TcCO2(mmHg) Show forest plot | 1 | Mean Difference (Fixed, 95% CI) | Totals not selected | |
| 21.1 Mean change TcCO2 NREM to REM (single night) | 1 | Mean Difference (Fixed, 95% CI) | 0.0 [0.0, 0.0] | |
| 21.2 Maximum TcCO2 (single night) | 1 | Mean Difference (Fixed, 95% CI) | 0.0 [0.0, 0.0] | |
| 22 Nocturnal TcCO2 TST (mmHg) Show forest plot | 1 | Mean Difference (IV, Fixed, 95% CI) | Totals not selected | |
| 22.1 Mean PtCO2 TST (up to 3 months) | 1 | Mean Difference (IV, Fixed, 95% CI) | 0.0 [0.0, 0.0] | |
| 22.2 Max PtCO2 TST (up to 3 months) | 1 | Mean Difference (IV, Fixed, 95% CI) | 0.0 [0.0, 0.0] | |
| 23 Hypopneas Show forest plot | 1 | Relative rate (Fixed, 95% CI) | Totals not selected | |
| 23.1 Single night | 1 | Relative rate (Fixed, 95% CI) | 0.0 [0.0, 0.0] | |
| Outcome or subgroup title | No. of studies | No. of participants | Statistical method | Effect size |
| 1 6 minute walk test Show forest plot | 1 | Mean Difference (IV, Fixed, 95% CI) | Totals not selected | |
| 1.1 Up to 1 week | 1 | Mean Difference (IV, Fixed, 95% CI) | 0.0 [0.0, 0.0] | |