Non‐invasive ventilation for cystic fibrosis
Información
- DOI:
- https://doi.org/10.1002/14651858.CD002769.pub5Copiar DOI

- Base de datos:
-
- Cochrane Database of Systematic Reviews
- Versión publicada:
-
- 20 febrero 2017see what's new
- Tipo:
-
- Intervention
- Etapa:
-
- Review
- Grupo Editorial Cochrane:
-
Grupo Cochrane de Fibrosis quística y enfermedades genéticas
- Copyright:
-
- Copyright © 2017 The Cochrane Collaboration. Published by John Wiley & Sons, Ltd.
Cifras del artículo
Altmetric:
Citado por:
Autores
Contributions of authors
The title for the protocol was conceived by the Cochrane Cystic Fibrosis and Genetic Disorders Group.
Both F. Moran and J. Bradley designed and assisted in writing the protocol and the review.
A. Piper has reviewed and contributed to the updated versions of the review.
F. Moran acts as guarantor of the review.
Sources of support
Internal sources
-
No sources of support supplied
External sources
-
National Institute for Health Research, UK.
This systematic review was supported by the National Institute for Health Research, via Cochrane Infrastructure funding to the Cochrane Cystic Fibrosis and Genetic Disorders Group.
Declarations of interest
Amanda Piper was a clinical consultant to ResMed Australia until 2004. She has also been involved in: educational activities sponsored by manufacturers of bilevel devices (Mayo Healthcare, Australia; Weinmann, Germany; Air Liquide, Australia; ResMed, Australia; Philps Respironics, Australia) and transcutaneous carbon dioxide devices (Sentec, Switzwerland; industry‐sponsored research (ResMed, Australia) and has received equipment for research projects from distributors of bilevel equipment (Air Liquide, Australia; Mayo Healthcare, Australia) as well as a competitive research grant from the ResMed Foundation.
Fidelma Moran and Judy Bradley received a NIPPY3 ventilator for a research clinical trial from Respicare.
Acknowledgements
The authors thank Dr Peter Wark and Professor Rosalind Smyth for editorial advice. The authors would also like to thank Ashley Jones who has advised on the statistics in previous updated versions of the review. Thanks to Nikki Jahnke for help with reformatting text.
Version history
| Published | Title | Stage | Authors | Version |
| 2017 Feb 20 | Non‐invasive ventilation for cystic fibrosis | Review | Fidelma Moran, Judy M Bradley, Amanda J Piper | |
| 2013 Apr 30 | Non‐invasive ventilation for cystic fibrosis | Review | Fidelma Moran, Judy M Bradley, Amanda J Piper | |
| 2009 Jan 21 | Non‐invasive ventilation for cystic fibrosis | Review | Fidelma Moran, Judy M Bradley, Amanda J Piper | |
| 2007 Oct 17 | Non‐invasive ventilation for cystic fibrosis | Review | Fidelma Moran, Judy M Bradley, Ashley P Jones, Amanda J Piper | |
| 2003 Apr 22 | Non‐invasive ventilation for cystic fibrosis | Review | Fidelma Moran, Judy M Bradley, Amanda J Piper | |
Differences between protocol and review
In a post hoc change we have defined short‐term trials as those with a duration less than three months. We decided to analyse single‐night interventions separately from other short‐term trials as we did not feel it appropriate to combine them with other longer trials.
Keywords
MeSH
Medical Subject Headings (MeSH) Keywords
Medical Subject Headings Check Words
Humans;
PICO

Comparison 1 NIV versus no NIV during chest physiotherapy (any technique), Outcome 1 CFQ scores.

Comparison 1 NIV versus no NIV during chest physiotherapy (any technique), Outcome 2 Fatigue.

Comparison 1 NIV versus no NIV during chest physiotherapy (any technique), Outcome 3 FEV1 (L).
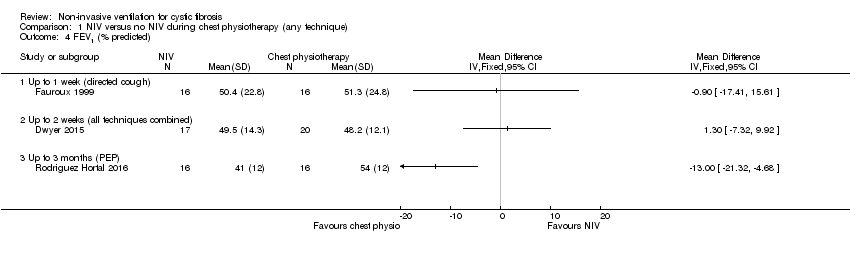
Comparison 1 NIV versus no NIV during chest physiotherapy (any technique), Outcome 4 FEV1 (% predicted).

Comparison 1 NIV versus no NIV during chest physiotherapy (any technique), Outcome 5 FVC (L).
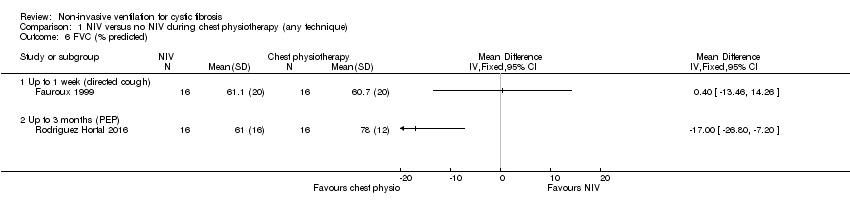
Comparison 1 NIV versus no NIV during chest physiotherapy (any technique), Outcome 6 FVC (% predicted).

Comparison 1 NIV versus no NIV during chest physiotherapy (any technique), Outcome 7 FEF25‐75 (L).

Comparison 1 NIV versus no NIV during chest physiotherapy (any technique), Outcome 8 FEF25‐75 (% predicted).
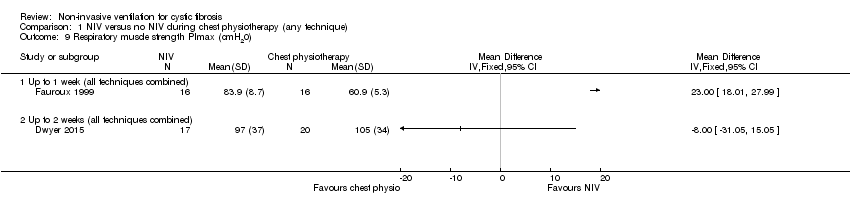
Comparison 1 NIV versus no NIV during chest physiotherapy (any technique), Outcome 9 Respiratory muscle strength PImax (cmH20).

Comparison 1 NIV versus no NIV during chest physiotherapy (any technique), Outcome 10 Respiratory muscle strength PEmax (cmH20).

Comparison 1 NIV versus no NIV during chest physiotherapy (any technique), Outcome 11 Airway resistance % predicted.

Comparison 1 NIV versus no NIV during chest physiotherapy (any technique), Outcome 12 LCI.
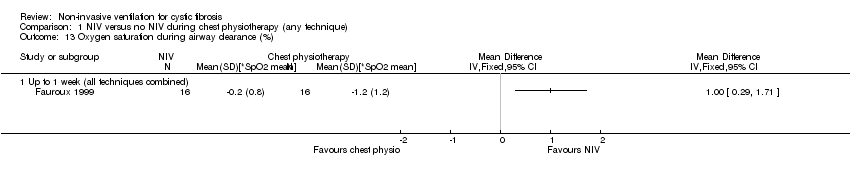
Comparison 1 NIV versus no NIV during chest physiotherapy (any technique), Outcome 13 Oxygen saturation during airway clearance (%).

Comparison 1 NIV versus no NIV during chest physiotherapy (any technique), Outcome 14 Oxygen saturation during airway clearance (change in SpO2 % during treatment).
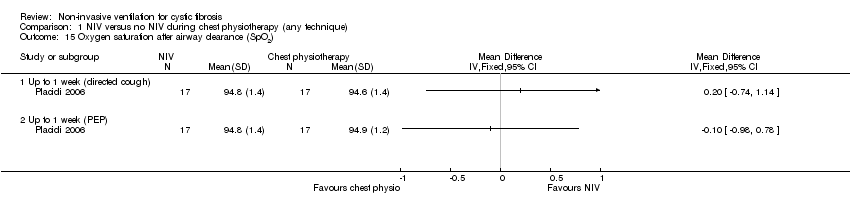
Comparison 1 NIV versus no NIV during chest physiotherapy (any technique), Outcome 15 Oxygen saturation after airway clearance (SpO2).

Comparison 1 NIV versus no NIV during chest physiotherapy (any technique), Outcome 16 PaCO2.
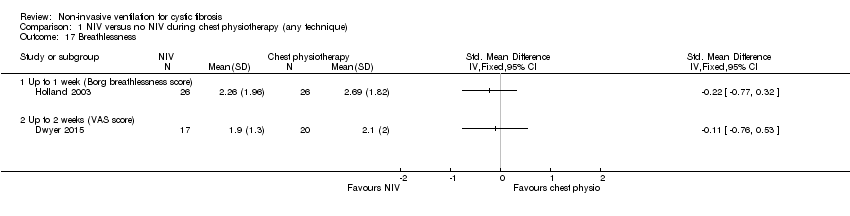
Comparison 1 NIV versus no NIV during chest physiotherapy (any technique), Outcome 17 Breathlessness.

Comparison 1 NIV versus no NIV during chest physiotherapy (any technique), Outcome 18 Sputum wet weight (g).

Comparison 1 NIV versus no NIV during chest physiotherapy (any technique), Outcome 19 Sputum dry weight (g).
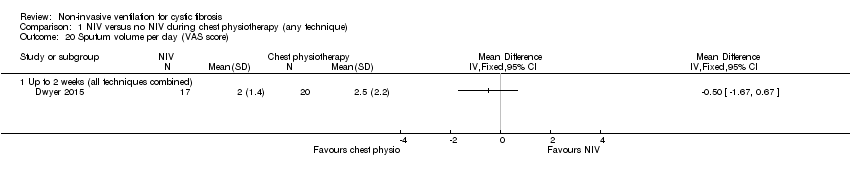
Comparison 1 NIV versus no NIV during chest physiotherapy (any technique), Outcome 20 Sputum volume per day (VAS score).

Comparison 1 NIV versus no NIV during chest physiotherapy (any technique), Outcome 21 Pseudomonas density (log CFU/g).

Comparison 1 NIV versus no NIV during chest physiotherapy (any technique), Outcome 22 Exercise capacity: 25 level modified shuttle test (m).

Comparison 1 NIV versus no NIV during chest physiotherapy (any technique), Outcome 23 Energy (VAS score).

Comparison 1 NIV versus no NIV during chest physiotherapy (any technique), Outcome 24 6MWT.

Comparison 1 NIV versus no NIV during chest physiotherapy (any technique), Outcome 25 Length of hospital stay (days).

Comparison 1 NIV versus no NIV during chest physiotherapy (any technique), Outcome 26 Time to next admission (days).

Comparison 2 NIV in overnight ventilation compared to oxygen, Outcome 1 CFQoL chest symptom score.
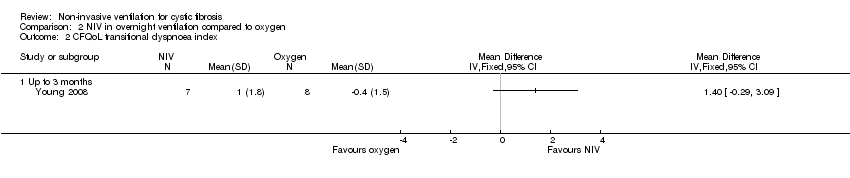
Comparison 2 NIV in overnight ventilation compared to oxygen, Outcome 2 CFQoL transitional dyspnoea index.

Comparison 2 NIV in overnight ventilation compared to oxygen, Outcome 3 Symptoms of sleep‐disordered breathing.
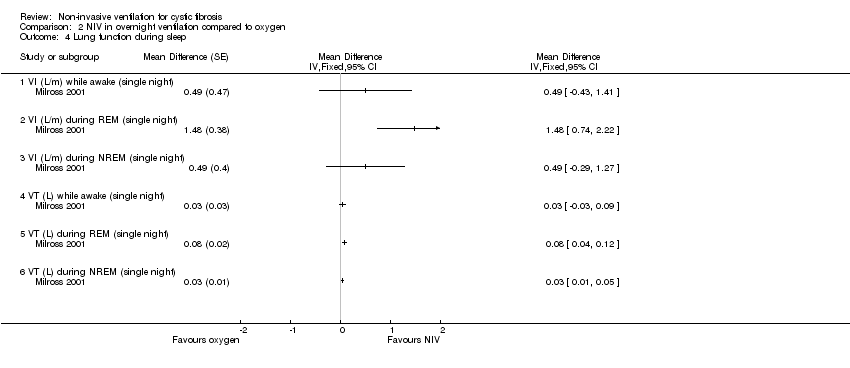
Comparison 2 NIV in overnight ventilation compared to oxygen, Outcome 4 Lung function during sleep.

Comparison 2 NIV in overnight ventilation compared to oxygen, Outcome 5 Respiratory rate (breaths/min).
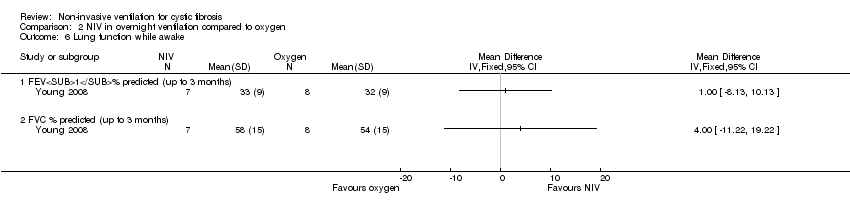
Comparison 2 NIV in overnight ventilation compared to oxygen, Outcome 6 Lung function while awake.
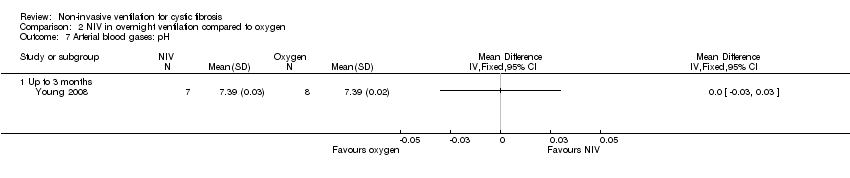
Comparison 2 NIV in overnight ventilation compared to oxygen, Outcome 7 Arterial blood gases: pH.
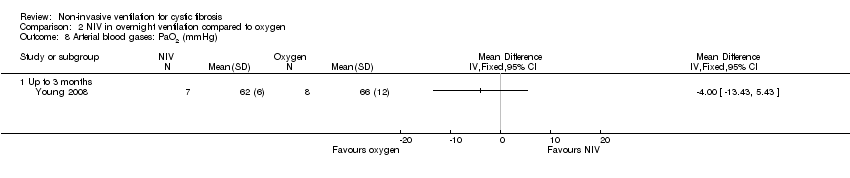
Comparison 2 NIV in overnight ventilation compared to oxygen, Outcome 8 Arterial blood gases: PaO2 (mmHg).

Comparison 2 NIV in overnight ventilation compared to oxygen, Outcome 9 Arterial blood gases: PaCO2 (mmHg).

Comparison 2 NIV in overnight ventilation compared to oxygen, Outcome 10 Arterial blood gases: HCO3 (mmol/L).
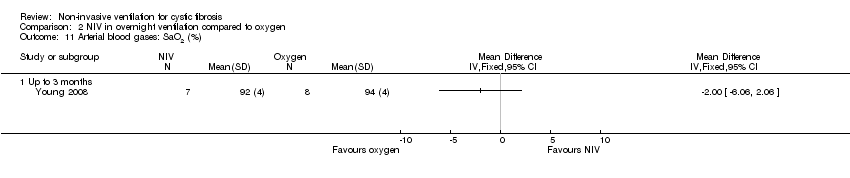
Comparison 2 NIV in overnight ventilation compared to oxygen, Outcome 11 Arterial blood gases: SaO2 (%).

Comparison 2 NIV in overnight ventilation compared to oxygen, Outcome 12 Exercise performance (MSWT) (metres).
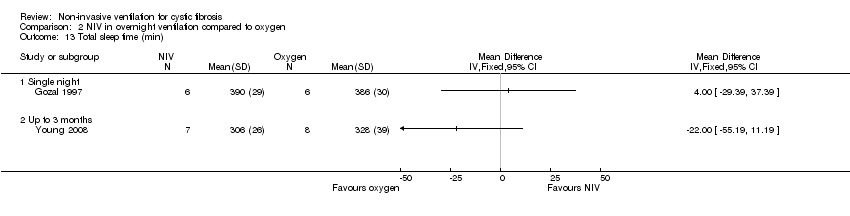
Comparison 2 NIV in overnight ventilation compared to oxygen, Outcome 13 Total sleep time (min).

Comparison 2 NIV in overnight ventilation compared to oxygen, Outcome 14 REM sleep architecture.

Comparison 2 NIV in overnight ventilation compared to oxygen, Outcome 15 Sleep latency (min).

Comparison 2 NIV in overnight ventilation compared to oxygen, Outcome 16 Nocturnal oxygen saturation (%).

Comparison 2 NIV in overnight ventilation compared to oxygen, Outcome 17 Nocturnal oxygen saturation (%).

Comparison 2 NIV in overnight ventilation compared to oxygen, Outcome 18 Nocturnal TcCO2 (mmHg.
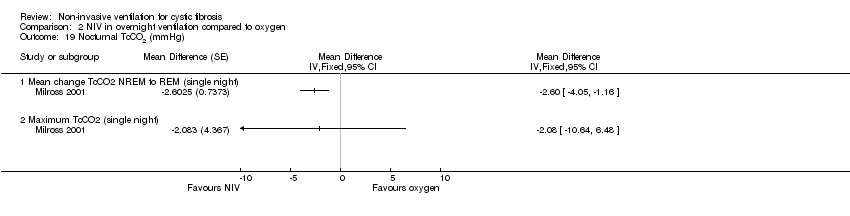
Comparison 2 NIV in overnight ventilation compared to oxygen, Outcome 19 Nocturnal TcCO2 (mmHg).
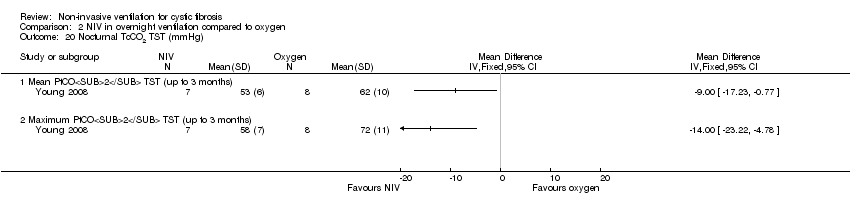
Comparison 2 NIV in overnight ventilation compared to oxygen, Outcome 20 Nocturnal TcCO2 TST (mmHg).
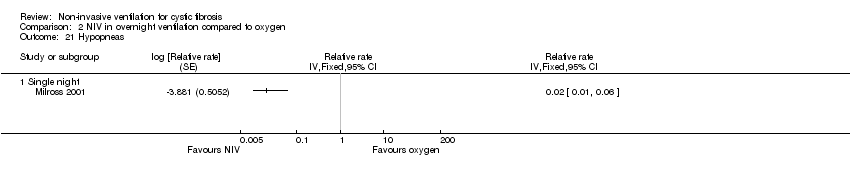
Comparison 2 NIV in overnight ventilation compared to oxygen, Outcome 21 Hypopneas.

Comparison 2 NIV in overnight ventilation compared to oxygen, Outcome 22 Mean heart rate (beats/min).

Comparison 2 NIV in overnight ventilation compared to oxygen, Outcome 23 Respiratory rate.
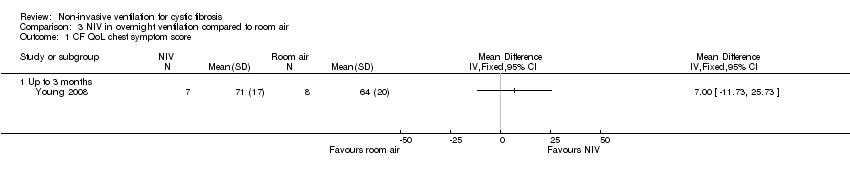
Comparison 3 NIV in overnight ventilation compared to room air, Outcome 1 CF QoL chest symptom score.

Comparison 3 NIV in overnight ventilation compared to room air, Outcome 2 CF QoL traditional dyspnoea index score.

Comparison 3 NIV in overnight ventilation compared to room air, Outcome 3 Symptoms of sleep‐disordered breathing.

Comparison 3 NIV in overnight ventilation compared to room air, Outcome 4 Lung function during sleep.

Comparison 3 NIV in overnight ventilation compared to room air, Outcome 5 Respiratory rate(breaths/min) during sleep.
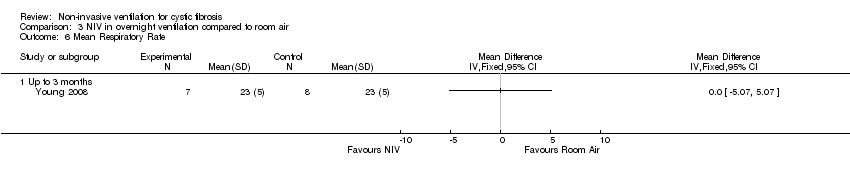
Comparison 3 NIV in overnight ventilation compared to room air, Outcome 6 Mean Respiratory Rate.
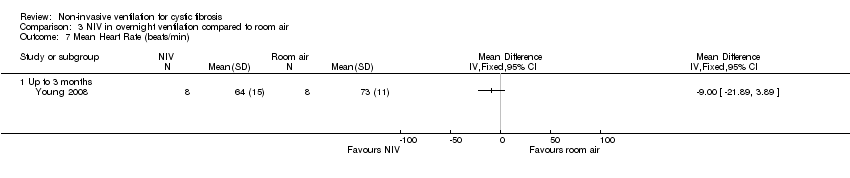
Comparison 3 NIV in overnight ventilation compared to room air, Outcome 7 Mean Heart Rate (beats/min).

Comparison 3 NIV in overnight ventilation compared to room air, Outcome 8 Lung function while awake.

Comparison 3 NIV in overnight ventilation compared to room air, Outcome 9 Arterial blood gases: pH.
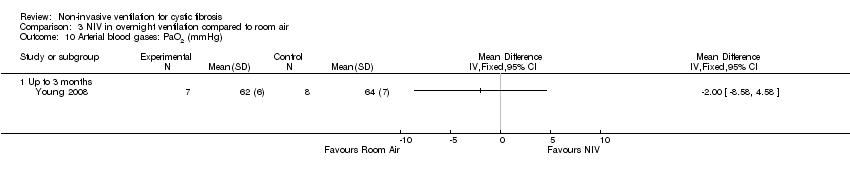
Comparison 3 NIV in overnight ventilation compared to room air, Outcome 10 Arterial blood gases: PaO2 (mmHg).

Comparison 3 NIV in overnight ventilation compared to room air, Outcome 11 Arterial blood gases: PaCO2 (mmHg).
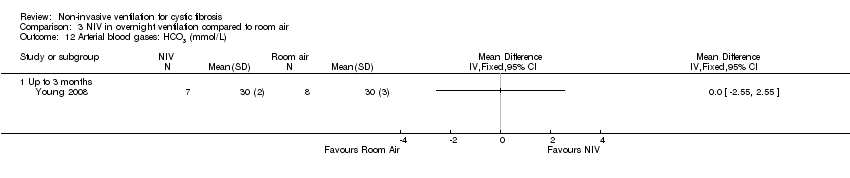
Comparison 3 NIV in overnight ventilation compared to room air, Outcome 12 Arterial blood gases: HCO3 (mmol/L).

Comparison 3 NIV in overnight ventilation compared to room air, Outcome 13 Arterial blood gases: SaO2 (%).

Comparison 3 NIV in overnight ventilation compared to room air, Outcome 14 Exercise performance (metres).

Comparison 3 NIV in overnight ventilation compared to room air, Outcome 15 Total sleep time (min).

Comparison 3 NIV in overnight ventilation compared to room air, Outcome 16 REM sleep architecture.
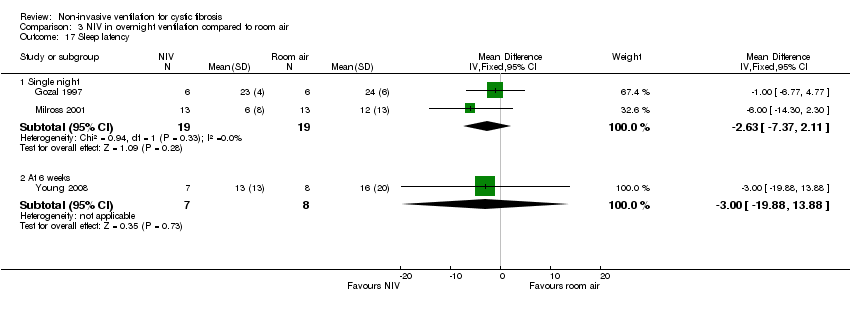
Comparison 3 NIV in overnight ventilation compared to room air, Outcome 17 Sleep latency.

Comparison 3 NIV in overnight ventilation compared to room air, Outcome 18 Nocturnal oxygen saturation (%).

Comparison 3 NIV in overnight ventilation compared to room air, Outcome 19 Nocturnal oxygen saturation (%).
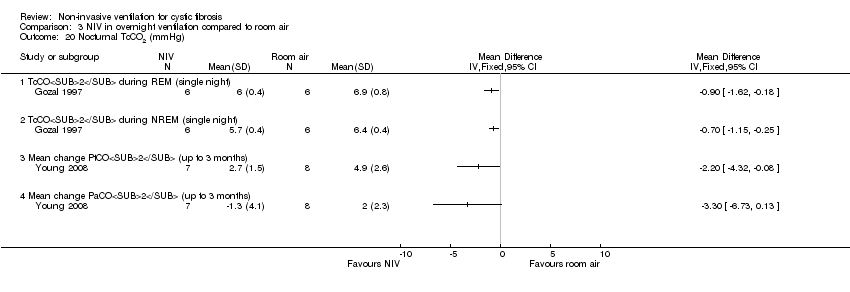
Comparison 3 NIV in overnight ventilation compared to room air, Outcome 20 Nocturnal TcCO2 (mmHg).

Comparison 3 NIV in overnight ventilation compared to room air, Outcome 21 Nocturnal TcCO2(mmHg).

Comparison 3 NIV in overnight ventilation compared to room air, Outcome 22 Nocturnal TcCO2 TST (mmHg).

Comparison 3 NIV in overnight ventilation compared to room air, Outcome 23 Hypopneas.
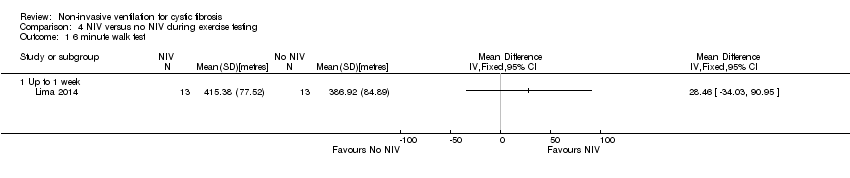
Comparison 4 NIV versus no NIV during exercise testing, Outcome 1 6 minute walk test.
| Abbreviation | Definition | Explanation |
| 6MWT | six minute walk test | |
| ABG | analysis of arterial blood gases | |
| ACBT | active cycle of breathing technique | |
| AHI | apnoea/hypopnoea Index | |
| CF | cystic fibrosis | |
| COPD | chronic obstructive pulmonary disease | |
| CPAP | continuous positive airway pressure | a system that maintains a positive pressure in the circuitry and airways throughout inspiration and expiration |
| CPT | chest physiotherapy | |
| CSS | chest symptom score | a validated CF quality of life measurement on a scale of 0 (worst) to 100 (best) |
| ESS | Epworth sleepiness scale | a scale measuring sleepiness ranging from 0 (best) to 24 (worst) |
| FEF25‐75 | flow rate between 25% and 75% of maximal expiration | |
| FEV₁ | forced expiratory volume in 1 second | |
| FRC | functional residual capacity | resting volume of the lungs |
| FVC | forced vital capacity | total volume of air expired during a forced expiration following a full inspiration |
| Global PSQI | Global score Pittsburgh sleep quality index | sleep quality scale ranging from 0 (best) to 21 (worst) |
| LCI | lung clearance index | measured by multiple breath washouts; a sensitive measure of ventilation inhomogeneity |
| MEF50 | maximal expiratory flow with 50% of vital capacity remaining in the lung | |
| mmHg | millimetres of mercury | |
| mSpO2 | mean oxygen saturation | |
| MSWT | modified shuttle walk test | incremental exercise tolerance test with minimum clinically important difference = 40 m |
| nadirSpO₂ | the largest fall expressed in the absolute value of SpO₂ | |
| NIPPV | non‐invasive positive pressure ventilation | |
| NIV | non‐invasive ventilation | |
| NREM | non‐rapid eye movement | a phase during sleep |
| ODI | oxygen desaturation index | |
| OEP | optoelectronic plethysmography | |
| PaCO₂ | partial pressure of carbon dioxide in arterial blood | |
| PaO₂ | partial pressure of oxygen in arterial blood | |
| PEP | positive expiratory pressure | an airway clearance technique |
| PSV | pressure support ventilation | |
| QoL | quality of life | |
| RCT | randomised controlled trial | |
| RDI | respiratory disturbance index | |
| RE | respiratory exacerbations | |
| REM | rapid eye movement | a phase during sleep |
| RR | respiratory rate | |
| SaO₂ | saturation of haemoglobin with oxygen in arterial blood | |
| SD | standard deviation | |
| SOB | shortness of breath | |
| SpO2 | saturation of haemoglobin with oxygen using pulse oximetry | |
| *SpO2 max | the largest fall expressed as the difference with the SpO2 just before the manoeuvre | |
| *SpO₂ mean | the mean of *SpO₂ max during the whole chest physiotherapy period | |
| SWT | shuttle walk test | |
| TcCO₂ | transcutaneous carbon dioxide | |
| TDI | transitional dyspnoea index | a measurement of CF quality of life, scores ranging from ‐9 (worst) to +9 (best); the minimal clinically important difference is 1 unit |
| TLC | total lung capacity | total volume of air in lungs following a maximum inspiration |
| TST | total sleep time | |
| TWT | treadmill walking test | |
| VI | minute ventilation | |
| VT | tidal volume | volume air inspired or expired during normal breathing |
| IPAP | inspiratory positive airway pressure | |
| PImax | inspiratory respiratory muscle strength | |
| PEmax | expiratory respiratory muscle strength | |
| Vab | abdominal volume of the chest wall | variable calculated from OEP |
| Vrca | abdominal rib cage volume | variable calculated from OEP |
| Vrcp | pulmonary rib cage volume | variable calculated from OEP |
| Outcome or subgroup title | No. of studies | No. of participants | Statistical method | Effect size |
| 1 CFQ scores Show forest plot | 1 | Mean Difference (IV, Fixed, 95% CI) | Totals not selected | |
| 1.1 Physical Domain | 1 | Mean Difference (IV, Fixed, 95% CI) | 0.0 [0.0, 0.0] | |
| 1.2 Health Domain | 1 | Mean Difference (IV, Fixed, 95% CI) | 0.0 [0.0, 0.0] | |
| 1.3 Respiratory Domain | 1 | Mean Difference (IV, Fixed, 95% CI) | 0.0 [0.0, 0.0] | |
| 2 Fatigue Show forest plot | 1 | Mean Difference (IV, Fixed, 95% CI) | Totals not selected | |
| 3 FEV1 (L) Show forest plot | 2 | Mean Difference (IV, Fixed, 95% CI) | Subtotals only | |
| 3.1 Up to 1 week (directed cough) | 2 | 86 | Mean Difference (IV, Fixed, 95% CI) | ‐0.03 [‐0.17, 0.12] |
| 3.2 Up to 1 week (PEP) | 1 | 34 | Mean Difference (IV, Fixed, 95% CI) | ‐0.05 [‐0.22, 0.12] |
| 4 FEV1 (% predicted) Show forest plot | 3 | Mean Difference (IV, Fixed, 95% CI) | Totals not selected | |
| 4.1 Up to 1 week (directed cough) | 1 | Mean Difference (IV, Fixed, 95% CI) | 0.0 [0.0, 0.0] | |
| 4.2 Up to 2 weeks (all techniques combined) | 1 | Mean Difference (IV, Fixed, 95% CI) | 0.0 [0.0, 0.0] | |
| 4.3 Up to 3 months (PEP) | 1 | Mean Difference (IV, Fixed, 95% CI) | 0.0 [0.0, 0.0] | |
| 5 FVC (L) Show forest plot | 2 | Mean Difference (IV, Fixed, 95% CI) | Subtotals only | |
| 5.1 Up to 1 week (directed cough) | 2 | 86 | Mean Difference (IV, Fixed, 95% CI) | 0.00 [‐0.30, 0.30] |
| 5.2 Up to 1 week (PEP) | 1 | 34 | Mean Difference (IV, Fixed, 95% CI) | ‐0.07 [‐0.47, 0.33] |
| 6 FVC (% predicted) Show forest plot | 2 | Mean Difference (IV, Fixed, 95% CI) | Totals not selected | |
| 6.1 Up to 1 week (directed cough) | 1 | Mean Difference (IV, Fixed, 95% CI) | 0.0 [0.0, 0.0] | |
| 6.2 Up to 3 months (PEP) | 1 | Mean Difference (IV, Fixed, 95% CI) | 0.0 [0.0, 0.0] | |
| 7 FEF25‐75 (L) Show forest plot | 2 | Mean Difference (IV, Fixed, 95% CI) | Subtotals only | |
| 7.1 Up to 1 week (directed cough) | 2 | 86 | Mean Difference (IV, Fixed, 95% CI) | ‐0.00 [‐0.08, 0.07] |
| 7.2 Up to 1 week (PEP) | 1 | 34 | Mean Difference (IV, Fixed, 95% CI) | 0.0 [‐0.07, 0.07] |
| 8 FEF25‐75 (% predicted) Show forest plot | 1 | Mean Difference (IV, Fixed, 95% CI) | Totals not selected | |
| 8.1 Up to 1 week (directed cough) | 1 | Mean Difference (IV, Fixed, 95% CI) | 0.0 [0.0, 0.0] | |
| 9 Respiratory muscle strength PImax (cmH20) Show forest plot | 2 | Mean Difference (IV, Fixed, 95% CI) | Totals not selected | |
| 9.1 Up to 1 week (all techniques combined) | 1 | Mean Difference (IV, Fixed, 95% CI) | 0.0 [0.0, 0.0] | |
| 9.2 Up to 2 weeks (all techniques combined) | 1 | Mean Difference (IV, Fixed, 95% CI) | 0.0 [0.0, 0.0] | |
| 10 Respiratory muscle strength PEmax (cmH20) Show forest plot | 2 | Mean Difference (IV, Fixed, 95% CI) | Totals not selected | |
| 10.1 Up to 1 week (all techniques combined) | 1 | Mean Difference (IV, Fixed, 95% CI) | 0.0 [0.0, 0.0] | |
| 10.2 Up to 2 weeks (all techniques combined) | 1 | Mean Difference (IV, Fixed, 95% CI) | 0.0 [0.0, 0.0] | |
| 11 Airway resistance % predicted Show forest plot | 1 | Mean Difference (IV, Fixed, 95% CI) | Totals not selected | |
| 11.1 Up to 1 week (all techniques combined) | 1 | Mean Difference (IV, Fixed, 95% CI) | 0.0 [0.0, 0.0] | |
| 12 LCI Show forest plot | 1 | Mean Difference (IV, Fixed, 95% CI) | Totals not selected | |
| 12.1 Up to 3 months (PEP) | 1 | Mean Difference (IV, Fixed, 95% CI) | 0.0 [0.0, 0.0] | |
| 13 Oxygen saturation during airway clearance (%) Show forest plot | 1 | Mean Difference (IV, Fixed, 95% CI) | Totals not selected | |
| 13.1 Up to 1 week (all techniques combined) | 1 | Mean Difference (IV, Fixed, 95% CI) | 0.0 [0.0, 0.0] | |
| 14 Oxygen saturation during airway clearance (change in SpO2 % during treatment) Show forest plot | 1 | Mean Difference (IV, Fixed, 95% CI) | Totals not selected | |
| 14.1 Up to 1 week (all techniques combined) | 1 | Mean Difference (IV, Fixed, 95% CI) | 0.0 [0.0, 0.0] | |
| 15 Oxygen saturation after airway clearance (SpO2) Show forest plot | 1 | Mean Difference (IV, Fixed, 95% CI) | Totals not selected | |
| 15.1 Up to 1 week (directed cough) | 1 | Mean Difference (IV, Fixed, 95% CI) | 0.0 [0.0, 0.0] | |
| 15.2 Up to 1 week (PEP) | 1 | Mean Difference (IV, Fixed, 95% CI) | 0.0 [0.0, 0.0] | |
| 16 PaCO2 Show forest plot | 1 | Mean Difference (IV, Fixed, 95% CI) | Totals not selected | |
| 16.1 Up to 3 months (PEP) | 1 | Mean Difference (IV, Fixed, 95% CI) | 0.0 [0.0, 0.0] | |
| 17 Breathlessness Show forest plot | 2 | Std. Mean Difference (IV, Fixed, 95% CI) | Totals not selected | |
| 17.1 Up to 1 week (Borg breathlessness score) | 1 | Std. Mean Difference (IV, Fixed, 95% CI) | 0.0 [0.0, 0.0] | |
| 17.2 Up to 2 weeks (VAS score) | 1 | Std. Mean Difference (IV, Fixed, 95% CI) | 0.0 [0.0, 0.0] | |
| 18 Sputum wet weight (g) Show forest plot | 3 | Mean Difference (IV, Fixed, 95% CI) | Subtotals only | |
| 18.1 Up to 1 week (directed cough) | 3 | 118 | Mean Difference (IV, Fixed, 95% CI) | ‐0.69 [‐3.06, 1.67] |
| 18.2 Up to 1 week (PEP) | 1 | 34 | Mean Difference (IV, Fixed, 95% CI) | ‐2.58 [‐6.11, 0.95] |
| 19 Sputum dry weight (g) Show forest plot | 1 | Mean Difference (IV, Fixed, 95% CI) | Totals not selected | |
| 19.1 Up to 1 week (directed cough) | 1 | Mean Difference (IV, Fixed, 95% CI) | 0.0 [0.0, 0.0] | |
| 19.2 Up to 1 week (PEP) | 1 | Mean Difference (IV, Fixed, 95% CI) | 0.0 [0.0, 0.0] | |
| 20 Sputum volume per day (VAS score) Show forest plot | 1 | Mean Difference (IV, Fixed, 95% CI) | Totals not selected | |
| 20.1 Up to 2 weeks (all techniques combined) | 1 | Mean Difference (IV, Fixed, 95% CI) | 0.0 [0.0, 0.0] | |
| 21 Pseudomonas density (log CFU/g) Show forest plot | 1 | Mean Difference (IV, Fixed, 95% CI) | Totals not selected | |
| 21.1 Up to 2 weeks (all techniques combined) | 1 | Mean Difference (IV, Fixed, 95% CI) | 0.0 [0.0, 0.0] | |
| 22 Exercise capacity: 25 level modified shuttle test (m) Show forest plot | 1 | Mean Difference (IV, Fixed, 95% CI) | Totals not selected | |
| 22.1 Up to 2 weeks (all techniques combined) | 1 | Mean Difference (IV, Fixed, 95% CI) | 0.0 [0.0, 0.0] | |
| 23 Energy (VAS score) Show forest plot | 1 | Mean Difference (IV, Fixed, 95% CI) | Totals not selected | |
| 23.1 Up to 2 weeks (all techniques combined) | 1 | Mean Difference (IV, Fixed, 95% CI) | 0.0 [0.0, 0.0] | |
| 24 6MWT Show forest plot | 1 | Mean Difference (IV, Fixed, 95% CI) | Totals not selected | |
| 24.1 Up to 3 months (PEP) | 1 | Mean Difference (IV, Fixed, 95% CI) | 0.0 [0.0, 0.0] | |
| 25 Length of hospital stay (days) Show forest plot | 1 | Mean Difference (IV, Fixed, 95% CI) | Totals not selected | |
| 25.1 Up to 2 weeks (all techniques combined) | 1 | Mean Difference (IV, Fixed, 95% CI) | 0.0 [0.0, 0.0] | |
| 26 Time to next admission (days) Show forest plot | 1 | Mean Difference (IV, Fixed, 95% CI) | Totals not selected | |
| Outcome or subgroup title | No. of studies | No. of participants | Statistical method | Effect size |
| 1 CFQoL chest symptom score Show forest plot | 1 | Mean Difference (IV, Fixed, 95% CI) | Totals not selected | |
| 1.1 Up to 3 months | 1 | Mean Difference (IV, Fixed, 95% CI) | 0.0 [0.0, 0.0] | |
| 2 CFQoL transitional dyspnoea index Show forest plot | 1 | Mean Difference (IV, Fixed, 95% CI) | Totals not selected | |
| 2.1 Up to 3 months | 1 | Mean Difference (IV, Fixed, 95% CI) | 0.0 [0.0, 0.0] | |
| 3 Symptoms of sleep‐disordered breathing Show forest plot | 1 | Mean Difference (IV, Fixed, 95% CI) | Totals not selected | |
| 3.1 Epworth Sleepiness Scale (up to 3 months) | 1 | Mean Difference (IV, Fixed, 95% CI) | 0.0 [0.0, 0.0] | |
| 3.2 Global PSQI (up to 3 months) | 1 | Mean Difference (IV, Fixed, 95% CI) | 0.0 [0.0, 0.0] | |
| 4 Lung function during sleep Show forest plot | 1 | Mean Difference (Fixed, 95% CI) | Totals not selected | |
| 4.1 VI (L/m) while awake (single night) | 1 | Mean Difference (Fixed, 95% CI) | 0.0 [0.0, 0.0] | |
| 4.2 VI (L/m) during REM (single night) | 1 | Mean Difference (Fixed, 95% CI) | 0.0 [0.0, 0.0] | |
| 4.3 VI (L/m) during NREM (single night) | 1 | Mean Difference (Fixed, 95% CI) | 0.0 [0.0, 0.0] | |
| 4.4 VT (L) while awake (single night) | 1 | Mean Difference (Fixed, 95% CI) | 0.0 [0.0, 0.0] | |
| 4.5 VT (L) during REM (single night) | 1 | Mean Difference (Fixed, 95% CI) | 0.0 [0.0, 0.0] | |
| 4.6 VT (L) during NREM (single night) | 1 | Mean Difference (Fixed, 95% CI) | 0.0 [0.0, 0.0] | |
| 5 Respiratory rate (breaths/min) Show forest plot | 1 | Mean Difference (Fixed, 95% CI) | Totals not selected | |
| 5.1 RR while awake (single night) | 1 | Mean Difference (Fixed, 95% CI) | 0.0 [0.0, 0.0] | |
| 5.2 RR during REM (single night) | 1 | Mean Difference (Fixed, 95% CI) | 0.0 [0.0, 0.0] | |
| 5.3 RR during NREM (single night) | 1 | Mean Difference (Fixed, 95% CI) | 0.0 [0.0, 0.0] | |
| 6 Lung function while awake Show forest plot | 1 | Mean Difference (IV, Fixed, 95% CI) | Totals not selected | |
| 6.1 FEV1% predicted (up to 3 months) | 1 | Mean Difference (IV, Fixed, 95% CI) | 0.0 [0.0, 0.0] | |
| 6.2 FVC % predicted (up to 3 months) | 1 | Mean Difference (IV, Fixed, 95% CI) | 0.0 [0.0, 0.0] | |
| 7 Arterial blood gases: pH Show forest plot | 1 | Mean Difference (IV, Fixed, 95% CI) | Totals not selected | |
| 7.1 Up to 3 months | 1 | Mean Difference (IV, Fixed, 95% CI) | 0.0 [0.0, 0.0] | |
| 8 Arterial blood gases: PaO2 (mmHg) Show forest plot | 1 | Mean Difference (IV, Fixed, 95% CI) | Totals not selected | |
| 8.1 Up to 3 months | 1 | Mean Difference (IV, Fixed, 95% CI) | 0.0 [0.0, 0.0] | |
| 9 Arterial blood gases: PaCO2 (mmHg) Show forest plot | 1 | Mean Difference (IV, Fixed, 95% CI) | Totals not selected | |
| 9.1 Up to 3 months | 1 | Mean Difference (IV, Fixed, 95% CI) | 0.0 [0.0, 0.0] | |
| 10 Arterial blood gases: HCO3 (mmol/L) Show forest plot | 1 | Mean Difference (IV, Fixed, 95% CI) | Totals not selected | |
| 10.1 Up to 3 months | 1 | Mean Difference (IV, Fixed, 95% CI) | 0.0 [0.0, 0.0] | |
| 11 Arterial blood gases: SaO2 (%) Show forest plot | 1 | Mean Difference (IV, Fixed, 95% CI) | Totals not selected | |
| 11.1 Up to 3 months | 1 | Mean Difference (IV, Fixed, 95% CI) | 0.0 [0.0, 0.0] | |
| 12 Exercise performance (MSWT) (metres) Show forest plot | 1 | Mean Difference (IV, Fixed, 95% CI) | Totals not selected | |
| 12.1 Up to 3 months | 1 | Mean Difference (IV, Fixed, 95% CI) | 0.0 [0.0, 0.0] | |
| 13 Total sleep time (min) Show forest plot | 2 | Mean Difference (IV, Fixed, 95% CI) | Totals not selected | |
| 13.1 Single night | 1 | Mean Difference (IV, Fixed, 95% CI) | 0.0 [0.0, 0.0] | |
| 13.2 Up to 3 months | 1 | Mean Difference (IV, Fixed, 95% CI) | 0.0 [0.0, 0.0] | |
| 14 REM sleep architecture Show forest plot | 2 | Mean Difference (IV, Fixed, 95% CI) | Totals not selected | |
| 14.1 REM (single night) | 1 | Mean Difference (IV, Fixed, 95% CI) | 0.0 [0.0, 0.0] | |
| 14.2 REM %TST (single night) | 1 | Mean Difference (IV, Fixed, 95% CI) | 0.0 [0.0, 0.0] | |
| 14.3 REM % TST (up to 3 months) | 1 | Mean Difference (IV, Fixed, 95% CI) | 0.0 [0.0, 0.0] | |
| 15 Sleep latency (min) Show forest plot | 3 | Mean Difference (IV, Fixed, 95% CI) | Subtotals only | |
| 15.1 Single night | 2 | 38 | Mean Difference (IV, Fixed, 95% CI) | 2.93 [‐0.32, 6.19] |
| 15.2 Up to 3 months | 1 | 15 | Mean Difference (IV, Fixed, 95% CI) | ‐5.0 [‐19.17, 9.17] |
| 16 Nocturnal oxygen saturation (%) Show forest plot | 2 | Mean Difference (IV, Fixed, 95% CI) | Totals not selected | |
| 16.1 Mean SpO2 REM (single night) | 1 | Mean Difference (IV, Fixed, 95% CI) | 0.0 [0.0, 0.0] | |
| 16.2 Mean SpO2 NREM (single night) | 1 | Mean Difference (IV, Fixed, 95% CI) | 0.0 [0.0, 0.0] | |
| 16.3 Mean SpO2 for TST (up to 3 months) | 1 | Mean Difference (IV, Fixed, 95% CI) | 0.0 [0.0, 0.0] | |
| 16.4 TST with SpO2 < 90% (up to 3 months) | 1 | Mean Difference (IV, Fixed, 95% CI) | 0.0 [0.0, 0.0] | |
| 17 Nocturnal oxygen saturation (%) Show forest plot | 1 | Mean Difference (Fixed, 95% CI) | Totals not selected | |
| 17.1 Percentage TST SpO2>90% | 1 | Mean Difference (Fixed, 95% CI) | 0.0 [0.0, 0.0] | |
| 17.2 Percentage REM SpO2>90% | 1 | Mean Difference (Fixed, 95% CI) | 0.0 [0.0, 0.0] | |
| 17.3 Percentage NREM SpO2>90% | 1 | Mean Difference (Fixed, 95% CI) | 0.0 [0.0, 0.0] | |
| 18 Nocturnal TcCO2 (mmHg Show forest plot | 2 | Mean Difference (IV, Fixed, 95% CI) | Totals not selected | |
| 18.1 TcCO2 during REM (single night) | 1 | Mean Difference (IV, Fixed, 95% CI) | 0.0 [0.0, 0.0] | |
| 18.2 TcCO2 during NREM (single night) | 1 | Mean Difference (IV, Fixed, 95% CI) | 0.0 [0.0, 0.0] | |
| 18.3 Mean change PtCO2 (mmHg) (up to 3 months) | 1 | Mean Difference (IV, Fixed, 95% CI) | 0.0 [0.0, 0.0] | |
| 18.4 Mean change PaCO2 (mmHg) (up to 3 months) | 1 | Mean Difference (IV, Fixed, 95% CI) | 0.0 [0.0, 0.0] | |
| 19 Nocturnal TcCO2 (mmHg) Show forest plot | 1 | Mean Difference (Fixed, 95% CI) | Totals not selected | |
| 19.1 Mean change TcCO2 NREM to REM (single night) | 1 | Mean Difference (Fixed, 95% CI) | 0.0 [0.0, 0.0] | |
| 19.2 Maximum TcCO2 (single night) | 1 | Mean Difference (Fixed, 95% CI) | 0.0 [0.0, 0.0] | |
| 20 Nocturnal TcCO2 TST (mmHg) Show forest plot | 1 | Mean Difference (IV, Fixed, 95% CI) | Totals not selected | |
| 20.1 Mean PtCO2 TST (up to 3 months) | 1 | Mean Difference (IV, Fixed, 95% CI) | 0.0 [0.0, 0.0] | |
| 20.2 Maximum PtCO2 TST (up to 3 months) | 1 | Mean Difference (IV, Fixed, 95% CI) | 0.0 [0.0, 0.0] | |
| 21 Hypopneas Show forest plot | 1 | Relative rate (Fixed, 95% CI) | Totals not selected | |
| 21.1 Single night | 1 | Relative rate (Fixed, 95% CI) | 0.0 [0.0, 0.0] | |
| 22 Mean heart rate (beats/min) Show forest plot | 1 | Mean Difference (IV, Fixed, 95% CI) | Totals not selected | |
| 22.1 Up to 3 months | 1 | Mean Difference (IV, Fixed, 95% CI) | 0.0 [0.0, 0.0] | |
| 23 Respiratory rate Show forest plot | 1 | Mean Difference (IV, Fixed, 95% CI) | Totals not selected | |
| 23.1 Up to 3 months | 1 | Mean Difference (IV, Fixed, 95% CI) | 0.0 [0.0, 0.0] | |
| Outcome or subgroup title | No. of studies | No. of participants | Statistical method | Effect size |
| 1 CF QoL chest symptom score Show forest plot | 1 | Mean Difference (IV, Fixed, 95% CI) | Totals not selected | |
| 1.1 Up to 3 months | 1 | Mean Difference (IV, Fixed, 95% CI) | 0.0 [0.0, 0.0] | |
| 2 CF QoL traditional dyspnoea index score Show forest plot | 1 | Mean Difference (IV, Fixed, 95% CI) | Totals not selected | |
| 2.1 Up to 3 months | 1 | Mean Difference (IV, Fixed, 95% CI) | 0.0 [0.0, 0.0] | |
| 3 Symptoms of sleep‐disordered breathing Show forest plot | 1 | Mean Difference (IV, Fixed, 95% CI) | Totals not selected | |
| 3.1 Epworth sleepiness scale (up to 3 months) | 1 | Mean Difference (IV, Fixed, 95% CI) | 0.0 [0.0, 0.0] | |
| 3.2 Global PSQI (up to 3 months) | 1 | Mean Difference (IV, Fixed, 95% CI) | 0.0 [0.0, 0.0] | |
| 4 Lung function during sleep Show forest plot | 1 | Mean Difference (Fixed, 95% CI) | Totals not selected | |
| 4.1 VI while awake (single night) | 1 | Mean Difference (Fixed, 95% CI) | 0.0 [0.0, 0.0] | |
| 4.2 VI during REM (single night) | 1 | Mean Difference (Fixed, 95% CI) | 0.0 [0.0, 0.0] | |
| 4.3 VI during NREM (single night) | 1 | Mean Difference (Fixed, 95% CI) | 0.0 [0.0, 0.0] | |
| 4.4 VT while awake (single night) | 1 | Mean Difference (Fixed, 95% CI) | 0.0 [0.0, 0.0] | |
| 4.5 VT during REM (single night) | 1 | Mean Difference (Fixed, 95% CI) | 0.0 [0.0, 0.0] | |
| 4.6 VT during NREM (single night) | 1 | Mean Difference (Fixed, 95% CI) | 0.0 [0.0, 0.0] | |
| 5 Respiratory rate(breaths/min) during sleep Show forest plot | 1 | Mean Difference (Fixed, 95% CI) | Totals not selected | |
| 5.1 RR while awake (single night) | 1 | Mean Difference (Fixed, 95% CI) | 0.0 [0.0, 0.0] | |
| 5.2 RR during REM (single night) | 1 | Mean Difference (Fixed, 95% CI) | 0.0 [0.0, 0.0] | |
| 5.3 RR during NREM (single night) | 1 | Mean Difference (Fixed, 95% CI) | 0.0 [0.0, 0.0] | |
| 6 Mean Respiratory Rate Show forest plot | 1 | Mean Difference (IV, Fixed, 95% CI) | Totals not selected | |
| 6.1 Up to 3 months | 1 | Mean Difference (IV, Fixed, 95% CI) | 0.0 [0.0, 0.0] | |
| 7 Mean Heart Rate (beats/min) Show forest plot | 1 | Mean Difference (IV, Fixed, 95% CI) | Totals not selected | |
| 7.1 Up to 3 months | 1 | Mean Difference (IV, Fixed, 95% CI) | 0.0 [0.0, 0.0] | |
| 8 Lung function while awake Show forest plot | 1 | Mean Difference (IV, Fixed, 95% CI) | Totals not selected | |
| 8.1 FEV1% predicted (up to 3 months) | 1 | Mean Difference (IV, Fixed, 95% CI) | 0.0 [0.0, 0.0] | |
| 8.2 FVC % predicted (up to 3 months) | 1 | Mean Difference (IV, Fixed, 95% CI) | 0.0 [0.0, 0.0] | |
| 9 Arterial blood gases: pH Show forest plot | 1 | Mean Difference (IV, Fixed, 95% CI) | Totals not selected | |
| 9.1 Up to 3 months | 1 | Mean Difference (IV, Fixed, 95% CI) | 0.0 [0.0, 0.0] | |
| 10 Arterial blood gases: PaO2 (mmHg) Show forest plot | 1 | Mean Difference (IV, Fixed, 95% CI) | Totals not selected | |
| 10.1 Up to 3 months | 1 | Mean Difference (IV, Fixed, 95% CI) | 0.0 [0.0, 0.0] | |
| 11 Arterial blood gases: PaCO2 (mmHg) Show forest plot | 1 | Mean Difference (IV, Fixed, 95% CI) | Totals not selected | |
| 11.1 Up to 3 months | 1 | Mean Difference (IV, Fixed, 95% CI) | 0.0 [0.0, 0.0] | |
| 12 Arterial blood gases: HCO3 (mmol/L) Show forest plot | 1 | Mean Difference (IV, Fixed, 95% CI) | Totals not selected | |
| 12.1 Up to 3 months | 1 | Mean Difference (IV, Fixed, 95% CI) | 0.0 [0.0, 0.0] | |
| 13 Arterial blood gases: SaO2 (%) Show forest plot | 1 | Mean Difference (IV, Fixed, 95% CI) | Totals not selected | |
| 13.1 Up to 3 months | 1 | Mean Difference (IV, Fixed, 95% CI) | 0.0 [0.0, 0.0] | |
| 14 Exercise performance (metres) Show forest plot | 1 | Mean Difference (IV, Fixed, 95% CI) | Totals not selected | |
| 14.1 Up to 3 months | 1 | Mean Difference (IV, Fixed, 95% CI) | 0.0 [0.0, 0.0] | |
| 15 Total sleep time (min) Show forest plot | 2 | Mean Difference (IV, Fixed, 95% CI) | Totals not selected | |
| 15.1 Single night | 1 | Mean Difference (IV, Fixed, 95% CI) | 0.0 [0.0, 0.0] | |
| 15.2 Up to 3 months | 1 | Mean Difference (IV, Fixed, 95% CI) | 0.0 [0.0, 0.0] | |
| 16 REM sleep architecture Show forest plot | 2 | Mean Difference (IV, Fixed, 95% CI) | Totals not selected | |
| 16.1 REM (single night) | 1 | Mean Difference (IV, Fixed, 95% CI) | 0.0 [0.0, 0.0] | |
| 16.2 REM %TST (single night) | 1 | Mean Difference (IV, Fixed, 95% CI) | 0.0 [0.0, 0.0] | |
| 16.3 REM % TST (up to 3 months) | 1 | Mean Difference (IV, Fixed, 95% CI) | 0.0 [0.0, 0.0] | |
| 17 Sleep latency Show forest plot | 3 | Mean Difference (IV, Fixed, 95% CI) | Subtotals only | |
| 17.1 Single night | 2 | 38 | Mean Difference (IV, Fixed, 95% CI) | ‐2.63 [‐7.37, 2.11] |
| 17.2 At 6 weeks | 1 | 15 | Mean Difference (IV, Fixed, 95% CI) | ‐3.00 [‐19.88, 13.88] |
| 18 Nocturnal oxygen saturation (%) Show forest plot | 2 | Mean Difference (IV, Fixed, 95% CI) | Totals not selected | |
| 18.1 Mean SpO2 REM (single night) | 1 | Mean Difference (IV, Fixed, 95% CI) | 0.0 [0.0, 0.0] | |
| 18.2 Mean SpO2 NREM (single night) | 1 | Mean Difference (IV, Fixed, 95% CI) | 0.0 [0.0, 0.0] | |
| 18.3 Mean SpO2 for TST (up to 3 months) | 1 | Mean Difference (IV, Fixed, 95% CI) | 0.0 [0.0, 0.0] | |
| 18.4 TST for SpO2 < 90% (up to 3 months) | 1 | Mean Difference (IV, Fixed, 95% CI) | 0.0 [0.0, 0.0] | |
| 19 Nocturnal oxygen saturation (%) Show forest plot | 1 | Mean Difference (Fixed, 95% CI) | Totals not selected | |
| 19.1 Percentage TST SpO2 > 90% (single night) | 1 | Mean Difference (Fixed, 95% CI) | 0.0 [0.0, 0.0] | |
| 19.2 Percentage REM SpO2 > 90% (single night) | 1 | Mean Difference (Fixed, 95% CI) | 0.0 [0.0, 0.0] | |
| 19.3 Percentage NREM SpO2 > 90% (single night) | 1 | Mean Difference (Fixed, 95% CI) | 0.0 [0.0, 0.0] | |
| 20 Nocturnal TcCO2 (mmHg) Show forest plot | 2 | Mean Difference (IV, Fixed, 95% CI) | Totals not selected | |
| 20.1 TcCO2 during REM (single night) | 1 | Mean Difference (IV, Fixed, 95% CI) | 0.0 [0.0, 0.0] | |
| 20.2 TcCO2 during NREM (single night) | 1 | Mean Difference (IV, Fixed, 95% CI) | 0.0 [0.0, 0.0] | |
| 20.3 Mean change PtCO2 (up to 3 months) | 1 | Mean Difference (IV, Fixed, 95% CI) | 0.0 [0.0, 0.0] | |
| 20.4 Mean change PaCO2 (up to 3 months) | 1 | Mean Difference (IV, Fixed, 95% CI) | 0.0 [0.0, 0.0] | |
| 21 Nocturnal TcCO2(mmHg) Show forest plot | 1 | Mean Difference (Fixed, 95% CI) | Totals not selected | |
| 21.1 Mean change TcCO2 NREM to REM (single night) | 1 | Mean Difference (Fixed, 95% CI) | 0.0 [0.0, 0.0] | |
| 21.2 Maximum TcCO2 (single night) | 1 | Mean Difference (Fixed, 95% CI) | 0.0 [0.0, 0.0] | |
| 22 Nocturnal TcCO2 TST (mmHg) Show forest plot | 1 | Mean Difference (IV, Fixed, 95% CI) | Totals not selected | |
| 22.1 Mean PtCO2 TST (up to 3 months) | 1 | Mean Difference (IV, Fixed, 95% CI) | 0.0 [0.0, 0.0] | |
| 22.2 Max PtCO2 TST (up to 3 months) | 1 | Mean Difference (IV, Fixed, 95% CI) | 0.0 [0.0, 0.0] | |
| 23 Hypopneas Show forest plot | 1 | Relative rate (Fixed, 95% CI) | Totals not selected | |
| 23.1 Single night | 1 | Relative rate (Fixed, 95% CI) | 0.0 [0.0, 0.0] | |
| Outcome or subgroup title | No. of studies | No. of participants | Statistical method | Effect size |
| 1 6 minute walk test Show forest plot | 1 | Mean Difference (IV, Fixed, 95% CI) | Totals not selected | |
| 1.1 Up to 1 week | 1 | Mean Difference (IV, Fixed, 95% CI) | 0.0 [0.0, 0.0] | |