| 1 Patients with at least one exacerbation requiring systemic steroids Show forest plot | 21 | 6077 | Risk Ratio (M‐H, Random, 95% CI) | 1.51 [1.17, 1.96] |
|
| 1.1 Paediatrics | 6 | 1662 | Risk Ratio (M‐H, Random, 95% CI) | 1.35 [0.99, 1.86] |
| 1.2 Adults | 15 | 4415 | Risk Ratio (M‐H, Random, 95% CI) | 1.61 [1.12, 2.31] |
| 2 Patients with at least one exacerbation requiring hospital admission Show forest plot | 12 | 2715 | Risk Ratio (M‐H, Fixed, 95% CI) | 3.33 [1.02, 10.94] |
|
| 2.1 Paediatrics | 4 | 558 | Risk Ratio (M‐H, Fixed, 95% CI) | 3.04 [0.12, 73.98] |
| 2.2 Adults | 8 | 2157 | Risk Ratio (M‐H, Fixed, 95% CI) | 3.38 [0.94, 12.17] |
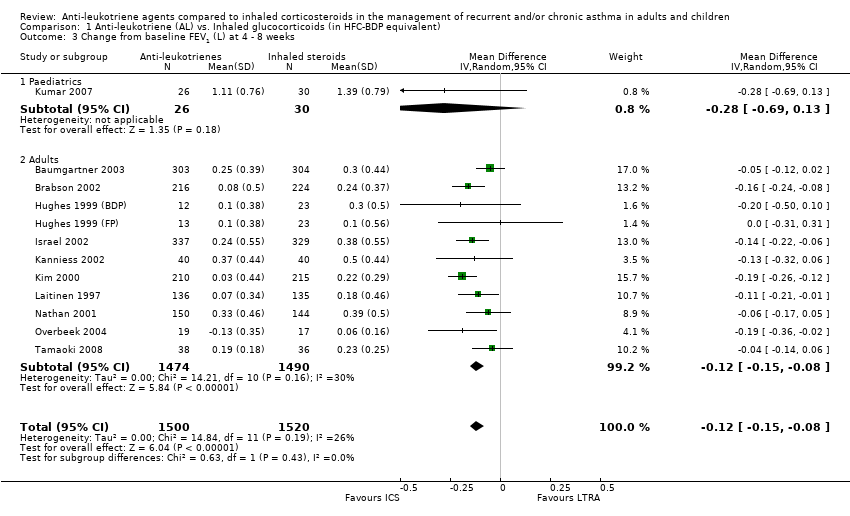
| 3 Change from baseline FEV1 (L) at 4 ‐ 8 weeks Show forest plot | 12 | 3020 | Mean Difference (IV, Random, 95% CI) | ‐0.12 [‐0.15, ‐0.08] |
|
| 3.1 Paediatrics | 1 | 56 | Mean Difference (IV, Random, 95% CI) | ‐0.28 [‐0.69, 0.13] |
| 3.2 Adults | 11 | 2964 | Mean Difference (IV, Random, 95% CI) | ‐0.12 [‐0.15, ‐0.08] |
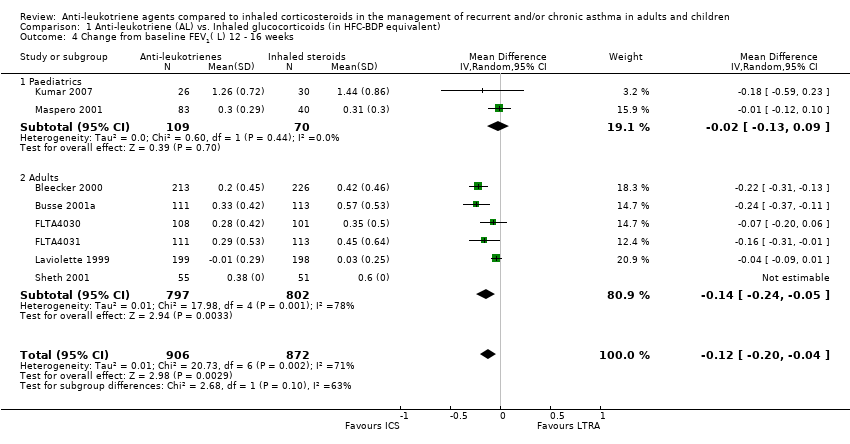
| 4 Change from baseline FEV1( L) 12 ‐ 16 weeks Show forest plot | 8 | 1778 | Mean Difference (IV, Random, 95% CI) | ‐0.12 [‐0.20, ‐0.04] |
|
| 4.1 Paediatrics | 2 | 179 | Mean Difference (IV, Random, 95% CI) | ‐0.02 [‐0.13, 0.09] |
| 4.2 Adults | 6 | 1599 | Mean Difference (IV, Random, 95% CI) | ‐0.14 [‐0.24, ‐0.05] |
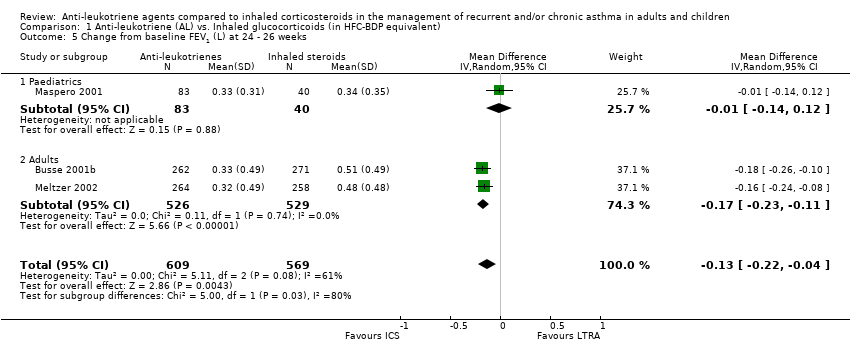
| 5 Change from baseline FEV1 (L) at 24 ‐ 26 weeks Show forest plot | 3 | 1178 | Mean Difference (IV, Random, 95% CI) | ‐0.13 [‐0.22, ‐0.04] |
|
| 5.1 Paediatrics | 1 | 123 | Mean Difference (IV, Random, 95% CI) | ‐0.01 [‐0.14, 0.12] |
| 5.2 Adults | 2 | 1055 | Mean Difference (IV, Random, 95% CI) | ‐0.17 [‐0.23, ‐0.11] |
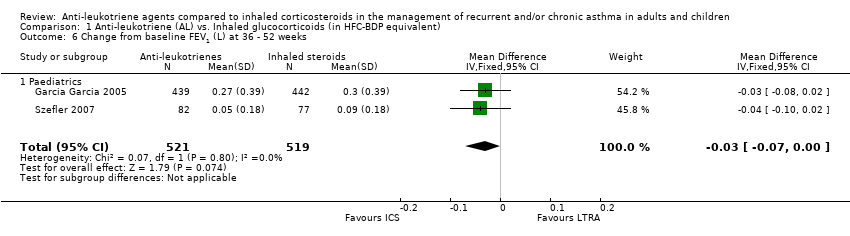
| 6 Change from baseline FEV1 (L) at 36 ‐ 52 weeks Show forest plot | 2 | 1040 | Mean Difference (IV, Fixed, 95% CI) | ‐0.03 [‐0.07, 0.00] |
|
| 6.1 Paediatrics | 2 | 1040 | Mean Difference (IV, Fixed, 95% CI) | ‐0.03 [‐0.07, 0.00] |
| 7 FEV1 irrespective of time of treatment Show forest plot | 23 | 7016 | Mean Difference (IV, Random, 95% CI) | ‐0.11 [‐0.14, ‐0.08] |
|
| 7.1 Paediatrics | 4 | 1398 | Mean Difference (IV, Random, 95% CI) | ‐0.03 [‐0.07, 0.00] |
| 7.2 Adults | 19 | 5618 | Mean Difference (IV, Random, 95% CI) | ‐0.13 [‐0.16, ‐0.09] |
| 8 Responders (defined as change from baseline in FEV1 >= 7.5% Show forest plot | 1 | | Odds Ratio (Fixed, 95% CI) | Totals not selected |
|
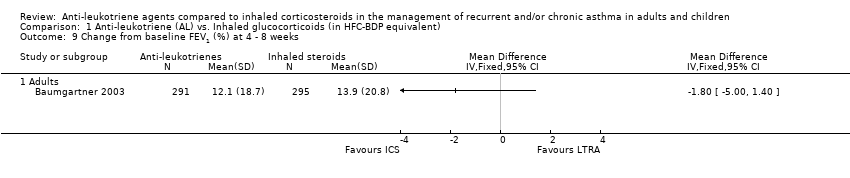
| 9 Change from baseline FEV1 (%) at 4 ‐ 8 weeks Show forest plot | 1 | | Mean Difference (IV, Fixed, 95% CI) | Totals not selected |
|
| 9.1 Adults | 1 | | Mean Difference (IV, Fixed, 95% CI) | 0.0 [0.0, 0.0] |
| 10 Change from baseline FEV1 (%) 12 ‐ 16 weeks Show forest plot | 2 | 603 | Mean Difference (IV, Fixed, 95% CI) | ‐5.70 [‐9.81, ‐1.59] |
|
| 10.1 Adults | 2 | 603 | Mean Difference (IV, Fixed, 95% CI) | ‐5.70 [‐9.81, ‐1.59] |
| 11 Change from baseline FEV1 (%) at 24 ‐ 26 weeks Show forest plot | 2 | 838 | Mean Difference (IV, Fixed, 95% CI) | ‐8.20 [‐10.85, ‐5.55] |
|
| 11.1 Adults | 2 | 838 | Mean Difference (IV, Fixed, 95% CI) | ‐8.20 [‐10.85, ‐5.55] |
| 12 Change from baseline FEV1 % of predicted at 4 ‐ 8 weeks Show forest plot | 2 | 219 | Mean Difference (IV, Random, 95% CI) | ‐2.58 [‐6.56, 1.40] |
|
| 12.1 Paediatrics | 1 | 183 | Mean Difference (IV, Random, 95% CI) | ‐0.54 [‐4.82, 3.74] |
| 12.2 Adults | 1 | 36 | Mean Difference (IV, Random, 95% CI) | ‐4.6 [‐8.86, ‐0.34] |
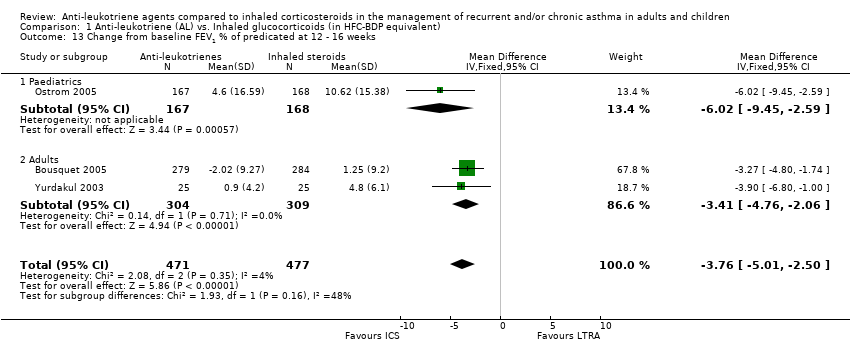
| 13 Change from baseline FEV1 % of predicated at 12 ‐ 16 weeks Show forest plot | 3 | 948 | Mean Difference (IV, Fixed, 95% CI) | ‐3.76 [‐5.01, ‐2.50] |
|
| 13.1 Paediatrics | 1 | 335 | Mean Difference (IV, Fixed, 95% CI) | ‐6.02 [‐9.45, ‐2.59] |
| 13.2 Adults | 2 | 613 | Mean Difference (IV, Fixed, 95% CI) | ‐3.41 [‐4.76, ‐2.06] |
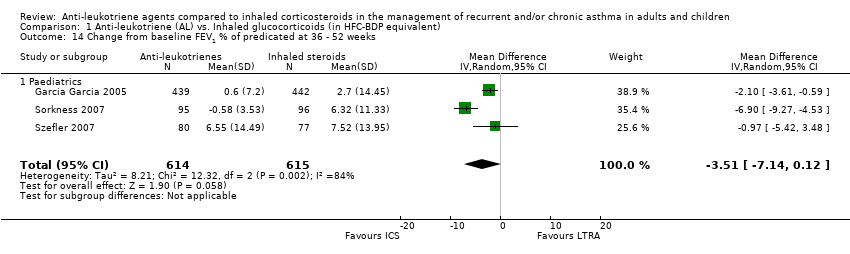
| 14 Change from baseline FEV1 % of predicated at 36 ‐ 52 weeks Show forest plot | 3 | 1229 | Mean Difference (IV, Random, 95% CI) | ‐3.51 [‐7.14, 0.12] |
|
| 14.1 Paediatrics | 3 | 1229 | Mean Difference (IV, Random, 95% CI) | ‐3.51 [‐7.14, 0.12] |
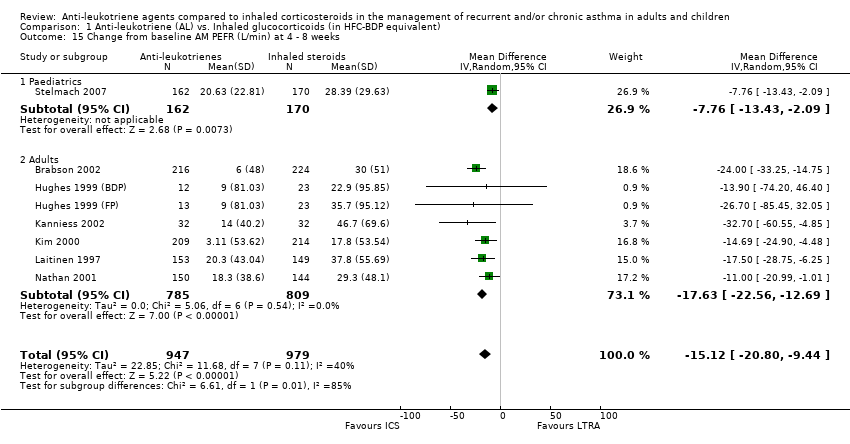
| 15 Change from baseline AM PEFR (L/min) at 4 ‐ 8 weeks Show forest plot | 8 | 1926 | Mean Difference (IV, Random, 95% CI) | ‐15.12 [‐20.80, ‐9.44] |
|
| 15.1 Paediatrics | 1 | 332 | Mean Difference (IV, Random, 95% CI) | ‐7.76 [‐13.43, ‐2.09] |
| 15.2 Adults | 7 | 1594 | Mean Difference (IV, Random, 95% CI) | ‐17.63 [‐22.56, ‐12.69] |
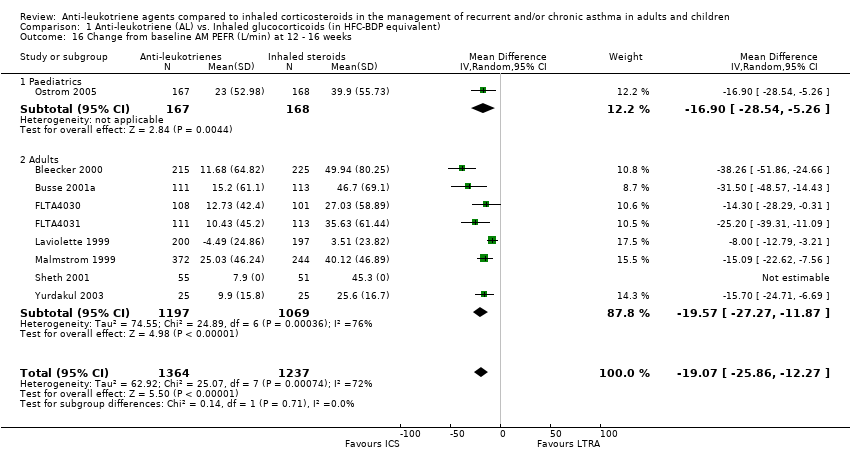
| 16 Change from baseline AM PEFR (L/min) at 12 ‐ 16 weeks Show forest plot | 9 | 2601 | Mean Difference (IV, Random, 95% CI) | ‐19.07 [‐25.86, ‐12.27] |
|
| 16.1 Paediatrics | 1 | 335 | Mean Difference (IV, Random, 95% CI) | ‐16.9 [‐28.54, ‐5.26] |
| 16.2 Adults | 8 | 2266 | Mean Difference (IV, Random, 95% CI) | ‐19.57 [‐27.27, ‐11.87] |
| 17 Change from baseline AM PEFR (L/min) at 24 ‐ 26 weeks Show forest plot | 3 | 1718 | Mean Difference (IV, Random, 95% CI) | ‐21.62 [‐40.19, ‐3.05] |
|
| 17.1 Adults | 3 | 1718 | Mean Difference (IV, Random, 95% CI) | ‐21.62 [‐40.19, ‐3.05] |
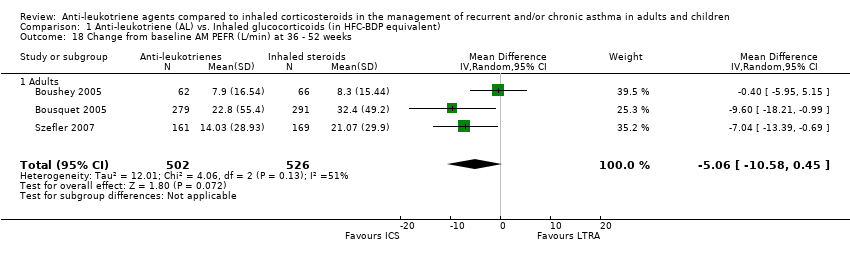
| 18 Change from baseline AM PEFR (L/min) at 36 ‐ 52 weeks Show forest plot | 3 | 1028 | Mean Difference (IV, Random, 95% CI) | ‐5.06 [‐10.58, 0.45] |
|
| 18.1 Adults | 3 | 1028 | Mean Difference (IV, Random, 95% CI) | ‐5.06 [‐10.58, 0.45] |
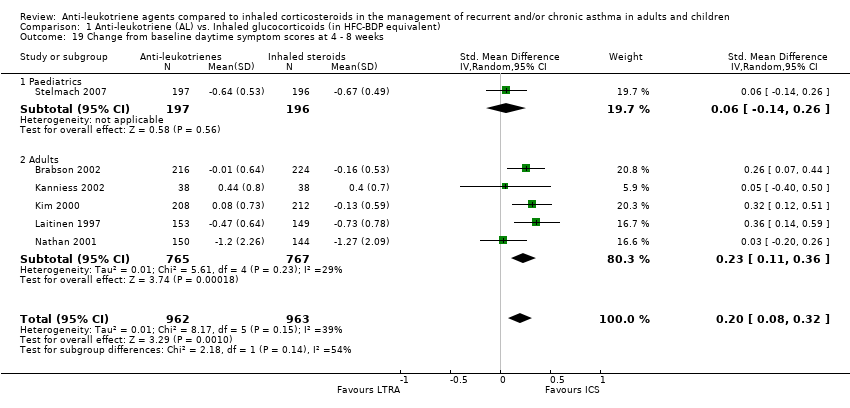
| 19 Change from baseline daytime symptom scores at 4 ‐ 8 weeks Show forest plot | 6 | 1925 | Std. Mean Difference (IV, Random, 95% CI) | 0.20 [0.08, 0.32] |
|
| 19.1 Paediatrics | 1 | 393 | Std. Mean Difference (IV, Random, 95% CI) | 0.06 [‐0.14, 0.26] |
| 19.2 Adults | 5 | 1532 | Std. Mean Difference (IV, Random, 95% CI) | 0.23 [0.11, 0.36] |
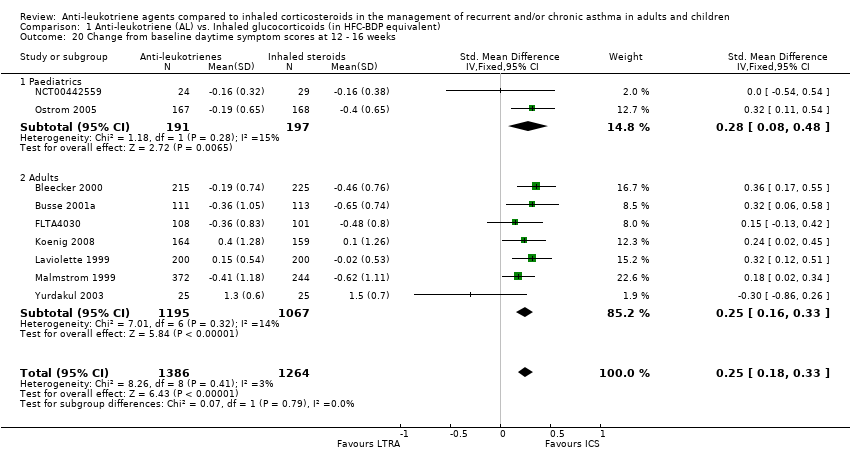
| 20 Change from baseline daytime symptom scores at 12 ‐ 16 weeks Show forest plot | 9 | 2650 | Std. Mean Difference (IV, Fixed, 95% CI) | 0.25 [0.18, 0.33] |
|
| 20.1 Paediatrics | 2 | 388 | Std. Mean Difference (IV, Fixed, 95% CI) | 0.28 [0.08, 0.48] |
| 20.2 Adults | 7 | 2262 | Std. Mean Difference (IV, Fixed, 95% CI) | 0.25 [0.16, 0.33] |
| 21 Change from baseline daytime symptom scores at 24 ‐ 26 weeks Show forest plot | 3 | 1719 | Std. Mean Difference (IV, Random, 95% CI) | 0.22 [0.02, 0.42] |
|
| 21.1 Adults | 3 | 1719 | Std. Mean Difference (IV, Random, 95% CI) | 0.22 [0.02, 0.42] |
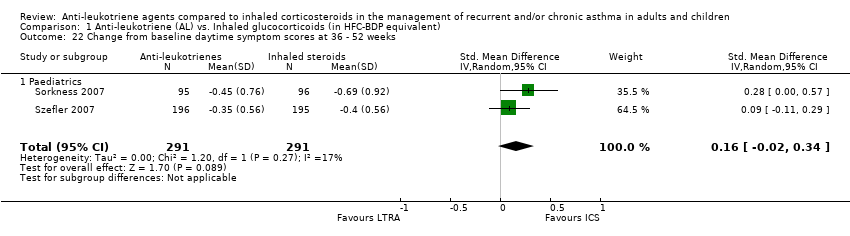
| 22 Change from baseline daytime symptom scores at 36 ‐ 52 weeks Show forest plot | 2 | 582 | Std. Mean Difference (IV, Random, 95% CI) | 0.16 [‐0.02, 0.34] |
|
| 22.1 Paediatrics | 2 | 582 | Std. Mean Difference (IV, Random, 95% CI) | 0.16 [‐0.02, 0.34] |
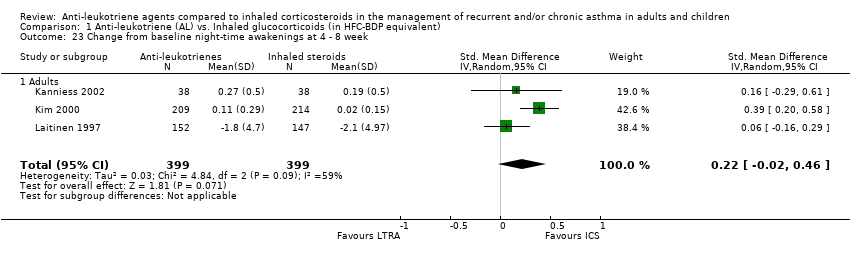
| 23 Change from baseline night‐time awakenings at 4 ‐ 8 week Show forest plot | 3 | 798 | Std. Mean Difference (IV, Random, 95% CI) | 0.22 [‐0.02, 0.46] |
|
| 23.1 Adults | 3 | 798 | Std. Mean Difference (IV, Random, 95% CI) | 0.22 [‐0.02, 0.46] |
| 24 Change from baseline night‐time awakenings at 12 ‐ 16 weeks Show forest plot | 9 | 2916 | Std. Mean Difference (IV, Fixed, 95% CI) | 0.18 [0.11, 0.26] |
|
| 24.1 Adults | 9 | 2916 | Std. Mean Difference (IV, Fixed, 95% CI) | 0.18 [0.11, 0.26] |
| 25 Change from baseline night‐time awakenings at 24 ‐ 26 weeks Show forest plot | 2 | 1055 | Std. Mean Difference (IV, Fixed, 95% CI) | 0.23 [0.11, 0.35] |
|
| 25.1 Adults | 2 | 1055 | Std. Mean Difference (IV, Fixed, 95% CI) | 0.23 [0.11, 0.35] |
| 26 Change from baseline mean daily use of β2‐agonists at 4 ‐ 8 weeks Show forest plot | 10 | 3264 | Std. Mean Difference (IV, Random, 95% CI) | 0.20 [0.07, 0.34] |
|
| 26.1 Paediatrics | 1 | 393 | Std. Mean Difference (IV, Random, 95% CI) | ‐0.02 [‐0.22, 0.17] |
| 26.2 Adults | 9 | 2871 | Std. Mean Difference (IV, Random, 95% CI) | 0.24 [0.10, 0.38] |
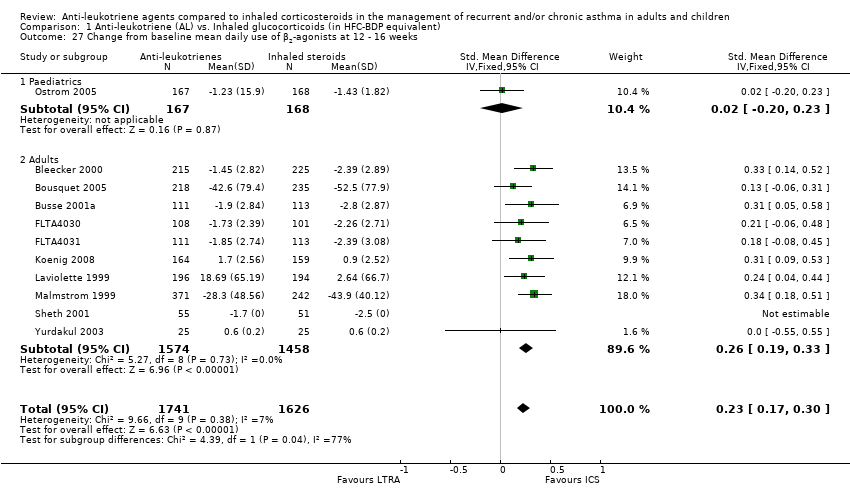
| 27 Change from baseline mean daily use of β2‐agonists at 12 ‐ 16 weeks Show forest plot | 11 | 3367 | Std. Mean Difference (IV, Fixed, 95% CI) | 0.23 [0.17, 0.30] |
|
| 27.1 Paediatrics | 1 | 335 | Std. Mean Difference (IV, Fixed, 95% CI) | 0.02 [‐0.20, 0.23] |
| 27.2 Adults | 10 | 3032 | Std. Mean Difference (IV, Fixed, 95% CI) | 0.26 [0.19, 0.33] |
| 28 Change from baseline mean daily use of β2‐agonists at 24 ‐ 26 weeks Show forest plot | 2 | 1055 | Std. Mean Difference (IV, Fixed, 95% CI) | 0.31 [0.19, 0.43] |
|
| 28.1 Adults | 2 | 1055 | Std. Mean Difference (IV, Fixed, 95% CI) | 0.31 [0.19, 0.43] |
| 29 Change from baseline mean daily use of β2‐agonists at 36 ‐ 52 weeks Show forest plot | 1 | | Std. Mean Difference (IV, Fixed, 95% CI) | Totals not selected |
|
| 29.1 Paediatrics | 1 | | Std. Mean Difference (IV, Fixed, 95% CI) | 0.0 [0.0, 0.0] |
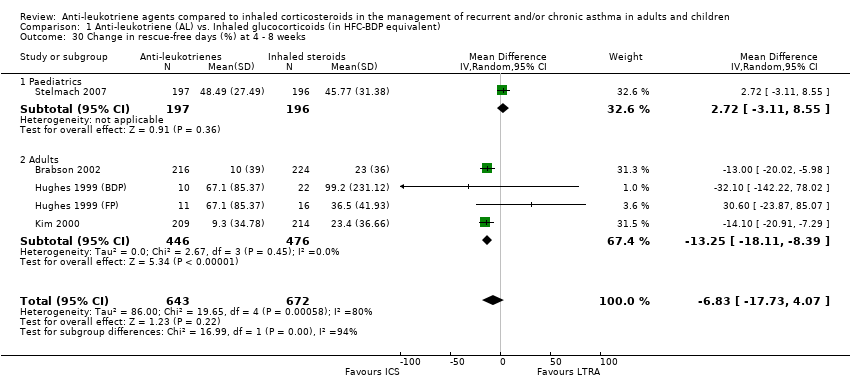
| 30 Change in rescue‐free days (%) at 4 ‐ 8 weeks Show forest plot | 5 | 1315 | Mean Difference (IV, Random, 95% CI) | ‐6.83 [‐17.73, 4.07] |
|
| 30.1 Paediatrics | 1 | 393 | Mean Difference (IV, Random, 95% CI) | 2.72 [‐3.11, 8.55] |
| 30.2 Adults | 4 | 922 | Mean Difference (IV, Random, 95% CI) | ‐13.25 [‐18.11, ‐8.39] |
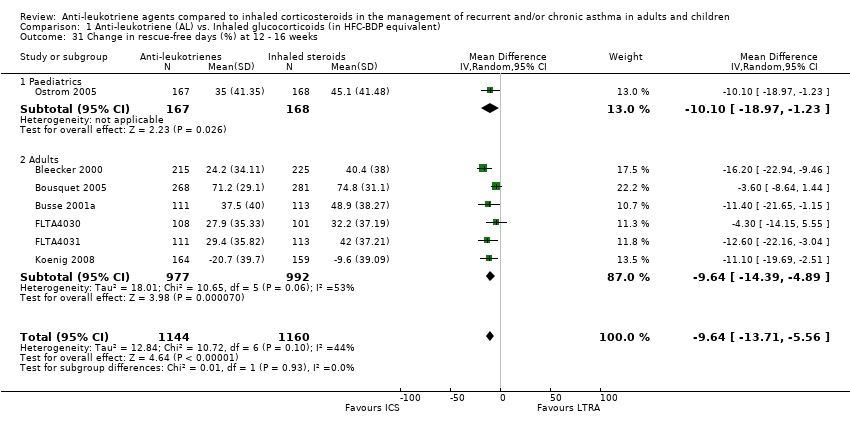
| 31 Change in rescue‐free days (%) at 12 ‐ 16 weeks Show forest plot | 7 | 2304 | Mean Difference (IV, Random, 95% CI) | ‐9.64 [‐13.71, ‐5.56] |
|
| 31.1 Paediatrics | 1 | 335 | Mean Difference (IV, Random, 95% CI) | ‐10.10 [‐18.97, ‐1.23] |
| 31.2 Adults | 6 | 1969 | Mean Difference (IV, Random, 95% CI) | ‐9.64 [‐14.39, ‐4.89] |
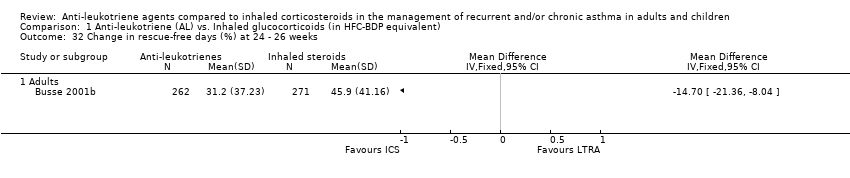
| 32 Change in rescue‐free days (%) at 24 ‐ 26 weeks Show forest plot | 1 | | Mean Difference (IV, Fixed, 95% CI) | Totals not selected |
|
| 32.1 Adults | 1 | | Mean Difference (IV, Fixed, 95% CI) | 0.0 [0.0, 0.0] |
| 33 Change in rescue‐free days (%) at 36 ‐ 52 weeks Show forest plot | 2 | 1350 | Mean Difference (IV, Fixed, 95% CI) | ‐2.59 [‐4.97, ‐0.21] |
|
| 33.1 Paediatrics | 2 | 1350 | Mean Difference (IV, Fixed, 95% CI) | ‐2.59 [‐4.97, ‐0.21] |
| 33.2 Adults | 0 | 0 | Mean Difference (IV, Fixed, 95% CI) | 0.0 [0.0, 0.0] |
| 34 Change in proportion of symptom‐free days (%) at 4 ‐ 8 weeks Show forest plot | 3 | 1154 | Mean Difference (IV, Fixed, 95% CI) | ‐10.46 [‐14.56, ‐6.36] |
|
| 34.1 Adults | 3 | 1154 | Mean Difference (IV, Fixed, 95% CI) | ‐10.46 [‐14.56, ‐6.36] |
| 35 Change in proportion of symptom‐free days (%) at 12 ‐ 16 weeks Show forest plot | 8 | 2423 | Mean Difference (IV, Fixed, 95% CI) | ‐8.89 [‐11.92, ‐5.87] |
|
| 35.1 Paediatrics | 1 | 335 | Mean Difference (IV, Fixed, 95% CI) | ‐6.40 [‐15.82, 3.02] |
| 35.2 Adults | 7 | 2088 | Mean Difference (IV, Fixed, 95% CI) | ‐9.18 [‐12.38, ‐5.98] |
| 36 Change in proportion of symptom‐free days (%) at 24 ‐ 26 weeks Show forest plot | 1 | | Mean Difference (IV, Fixed, 95% CI) | Totals not selected |
|
| 36.1 Adults | 1 | | Mean Difference (IV, Fixed, 95% CI) | 0.0 [0.0, 0.0] |
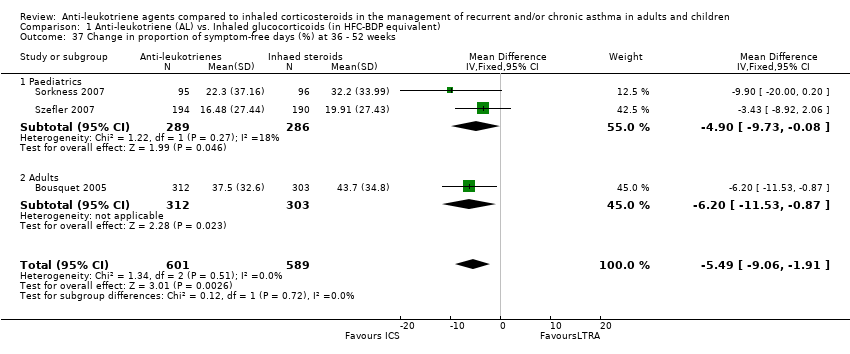
| 37 Change in proportion of symptom‐free days (%) at 36 ‐ 52 weeks Show forest plot | 3 | 1190 | Mean Difference (IV, Fixed, 95% CI) | ‐5.49 [‐9.06, ‐1.91] |
|
| 37.1 Paediatrics | 2 | 575 | Mean Difference (IV, Fixed, 95% CI) | ‐4.90 [‐9.73, ‐0.08] |
| 37.2 Adults | 1 | 615 | Mean Difference (IV, Fixed, 95% CI) | ‐6.20 [‐11.53, ‐0.87] |
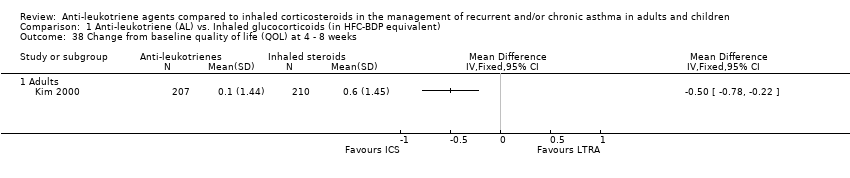
| 38 Change from baseline quality of life (QOL) at 4 ‐ 8 weeks Show forest plot | 1 | | Mean Difference (IV, Fixed, 95% CI) | Totals not selected |
|
| 38.1 Adults | 1 | | Mean Difference (IV, Fixed, 95% CI) | 0.0 [0.0, 0.0] |
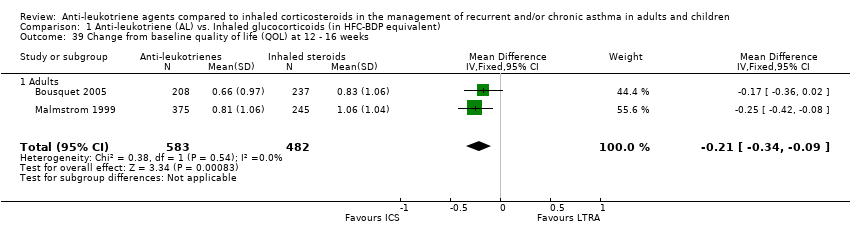
| 39 Change from baseline quality of life (QOL) at 12 ‐ 16 weeks Show forest plot | 2 | 1065 | Mean Difference (IV, Fixed, 95% CI) | ‐0.21 [‐0.34, ‐0.09] |
|
| 39.1 Adults | 2 | 1065 | Mean Difference (IV, Fixed, 95% CI) | ‐0.21 [‐0.34, ‐0.09] |
| 40 Change from baseline quality of life (QOL) at 24 ‐ 26 weeks Show forest plot | 2 | 1028 | Mean Difference (IV, Fixed, 95% CI) | ‐0.38 [‐0.54, ‐0.21] |
|
| 40.1 Adults | 2 | 1028 | Mean Difference (IV, Fixed, 95% CI) | ‐0.38 [‐0.54, ‐0.21] |
| 41 Change from baseline quality of life (QOL) at 36 ‐ 52 weeks Show forest plot | 1 | 541 | Mean Difference (IV, Fixed, 95% CI) | ‐0.13 [‐0.33, 0.07] |
|
| 41.1 Paediatrics | 1 | 541 | Mean Difference (IV, Fixed, 95% CI) | ‐0.13 [‐0.33, 0.07] |
| 41.2 Adults | 0 | 0 | Mean Difference (IV, Fixed, 95% CI) | 0.0 [0.0, 0.0] |
| 42 Days with use of β2‐agonists at 36 ‐ 52 weeks Show forest plot | 1 | | Mean Difference (IV, Fixed, 95% CI) | Totals not selected |
|
| 42.1 Paediatrics | 1 | | Mean Difference (IV, Fixed, 95% CI) | 0.0 [0.0, 0.0] |
| 43 Change from baseline blood eosinophils at 4 ‐ 8 weeks Show forest plot | 4 | 1294 | Mean Difference (IV, Random, 95% CI) | 0.06 [0.02, 0.10] |
|
| 43.1 Adults | 4 | 1294 | Mean Difference (IV, Random, 95% CI) | 0.06 [0.02, 0.10] |
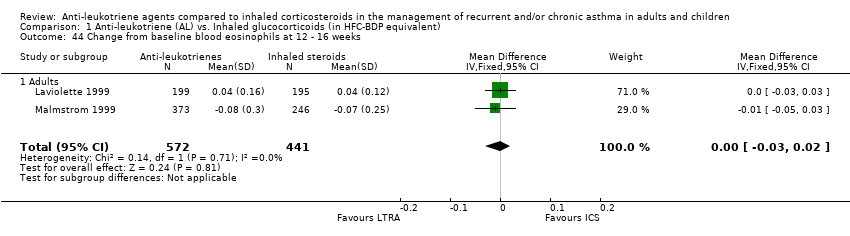
| 44 Change from baseline blood eosinophils at 12 ‐ 16 weeks Show forest plot | 2 | 1013 | Mean Difference (IV, Fixed, 95% CI) | ‐0.00 [‐0.03, 0.02] |
|
| 44.1 Adults | 2 | 1013 | Mean Difference (IV, Fixed, 95% CI) | ‐0.00 [‐0.03, 0.02] |
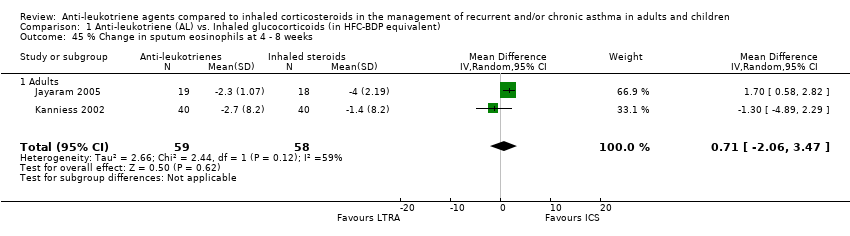
| 45 % Change in sputum eosinophils at 4 ‐ 8 weeks Show forest plot | 2 | 117 | Mean Difference (IV, Random, 95% CI) | 0.71 [‐2.06, 3.47] |
|
| 45.1 Adults | 2 | 117 | Mean Difference (IV, Random, 95% CI) | 0.71 [‐2.06, 3.47] |
| 46 % Change in sputum eosinophils at 36 ‐ 52 weeks Show forest plot | 1 | | Mean Difference (IV, Fixed, 95% CI) | Totals not selected |
|
| 46.1 Paediatrics | 1 | | Mean Difference (IV, Fixed, 95% CI) | 0.0 [0.0, 0.0] |
| 47 LTC4 concentration (ng/mL) in nasal wash at 24 ‐ 26 weeks Show forest plot | 1 | | Mean Difference (IV, Fixed, 95% CI) | Totals not selected |
|
| 47.1 Paediatrics | 1 | | Mean Difference (IV, Fixed, 95% CI) | 0.0 [0.0, 0.0] |
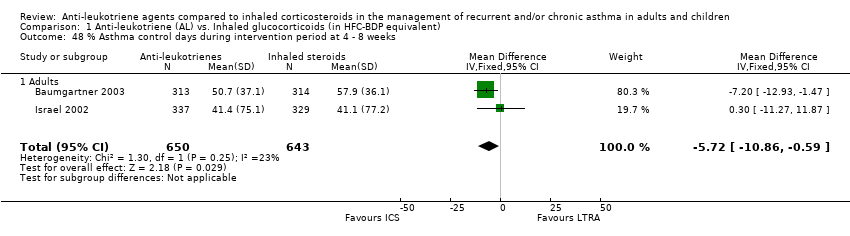
| 48 % Asthma control days during intervention period at 4 ‐ 8 weeks Show forest plot | 2 | 1293 | Mean Difference (IV, Fixed, 95% CI) | ‐5.72 [‐10.86, ‐0.59] |
|
| 48.1 Adults | 2 | 1293 | Mean Difference (IV, Fixed, 95% CI) | ‐5.72 [‐10.86, ‐0.59] |
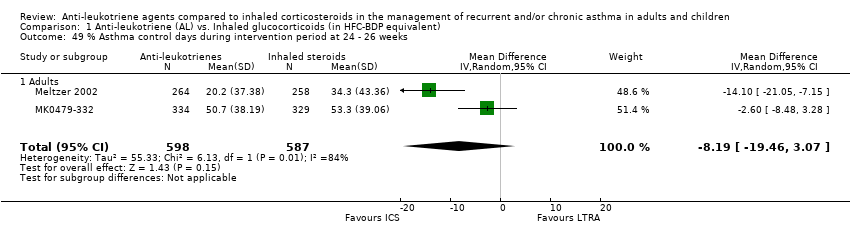
| 49 % Asthma control days during intervention period at 24 ‐ 26 weeks Show forest plot | 2 | 1185 | Mean Difference (IV, Random, 95% CI) | ‐8.19 [‐19.46, 3.07] |
|
| 49.1 Adults | 2 | 1185 | Mean Difference (IV, Random, 95% CI) | ‐8.19 [‐19.46, 3.07] |
| 50 Change in PC20 at 4 ‐ 8 weeks Show forest plot | 1 | | Mean Difference (IV, Fixed, 95% CI) | Totals not selected |
|
| 50.1 Adults | 1 | | Mean Difference (IV, Fixed, 95% CI) | 0.0 [0.0, 0.0] |
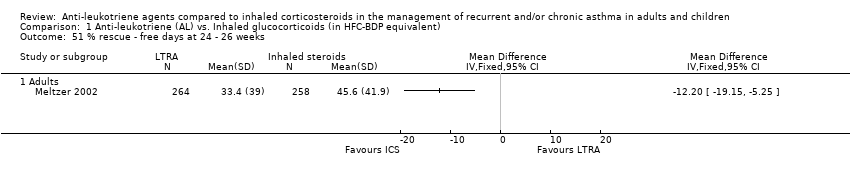
| 51 % rescue ‐ free days at 24 ‐ 26 weeks Show forest plot | 1 | | Mean Difference (IV, Fixed, 95% CI) | Totals not selected |
|
| 51.1 Adults | 1 | | Mean Difference (IV, Fixed, 95% CI) | 0.0 [0.0, 0.0] |
| 52 Days off work or school at 24 ‐ 26 weeks Show forest plot | 2 | 606 | Mean Difference (IV, Fixed, 95% CI) | 0.12 [‐0.01, 0.26] |
|
| 52.1 Paediatrics | 1 | 124 | Mean Difference (IV, Fixed, 95% CI) | ‐0.24 [‐1.31, 0.83] |
| 52.2 Adults | 1 | 482 | Mean Difference (IV, Fixed, 95% CI) | 0.13 [‐0.00, 0.26] |
| 53 Change in height (cm) Show forest plot | 1 | | Mean Difference (IV, Fixed, 95% CI) | Totals not selected |
|
| 53.1 Paediatrics | 1 | | Mean Difference (IV, Fixed, 95% CI) | 0.0 [0.0, 0.0] |
| 54 Patient's satisfaction at 4 ‐ 8 weeks Show forest plot | 1 | | Mean Difference (IV, Fixed, 95% CI) | Totals not selected |
|
| 54.1 Adults | 1 | | Mean Difference (IV, Fixed, 95% CI) | 0.0 [0.0, 0.0] |
| 55 Physician's satisfaction at 4 ‐ 8 weeks Show forest plot | 1 | | Mean Difference (IV, Fixed, 95% CI) | Totals not selected |
|
| 55.1 Adults | 1 | | Mean Difference (IV, Fixed, 95% CI) | 0.0 [0.0, 0.0] |
| 56 Overall Withdrawals Show forest plot | 42 | 10939 | Risk Ratio (M‐H, Random, 95% CI) | 1.22 [1.08, 1.38] |
|
| 56.1 Paediatrics | 18 | 3397 | Risk Ratio (M‐H, Random, 95% CI) | 1.03 [0.88, 1.21] |
| 56.2 Adults | 24 | 7542 | Risk Ratio (M‐H, Random, 95% CI) | 1.31 [1.11, 1.54] |
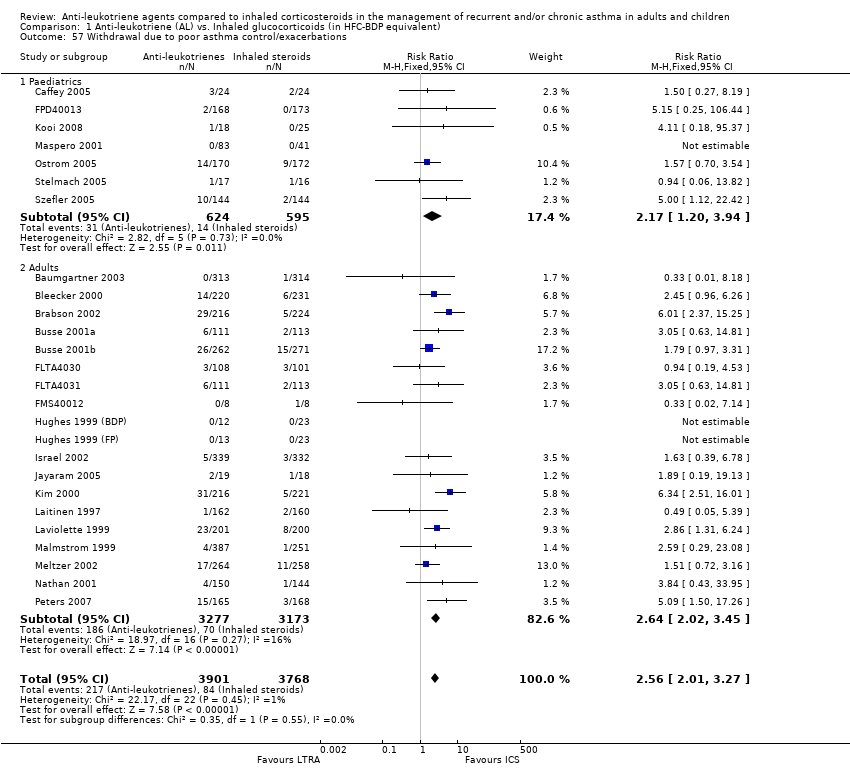
| 57 Withdrawal due to poor asthma control/exacerbations Show forest plot | 26 | 7669 | Risk Ratio (M‐H, Fixed, 95% CI) | 2.56 [2.01, 3.27] |
|
| 57.1 Paediatrics | 7 | 1219 | Risk Ratio (M‐H, Fixed, 95% CI) | 2.17 [1.20, 3.94] |
| 57.2 Adults | 19 | 6450 | Risk Ratio (M‐H, Fixed, 95% CI) | 2.64 [2.02, 3.45] |
| 58 Withdrawals due to adverse effects Show forest plot | 25 | 8518 | Risk Ratio (M‐H, Fixed, 95% CI) | 1.24 [0.95, 1.63] |
|
| 58.1 Paediatrics | 8 | 2330 | Risk Ratio (M‐H, Fixed, 95% CI) | 1.27 [0.70, 2.33] |
| 58.2 Adults | 17 | 6188 | Risk Ratio (M‐H, Fixed, 95% CI) | 1.23 [0.91, 1.67] |
| 59 Overall Adverse effects Show forest plot | 22 | 7818 | Risk Ratio (M‐H, Fixed, 95% CI) | 1.00 [0.95, 1.05] |
|
| 59.1 Paediatrics | 3 | 1460 | Risk Ratio (M‐H, Fixed, 95% CI) | 1.02 [0.90, 1.15] |
| 59.2 Adults | 19 | 6358 | Risk Ratio (M‐H, Fixed, 95% CI) | 0.99 [0.94, 1.05] |
| 60 Elevated liver enzymes Show forest plot | 7 | 1761 | Risk Ratio (M‐H, Fixed, 95% CI) | 1.13 [0.58, 2.19] |
|
| 60.1 Paediatrics | 1 | 118 | Risk Ratio (M‐H, Fixed, 95% CI) | 0.49 [0.03, 7.68] |
| 60.2 Adults | 6 | 1643 | Risk Ratio (M‐H, Fixed, 95% CI) | 1.19 [0.60, 2.36] |
| 61 Upper respiratory tract infections Show forest plot | 8 | 2729 | Odds Ratio (M‐H, Fixed, 95% CI) | 1.04 [0.84, 1.29] |
|
| 61.1 Paediatrics | 5 | 1514 | Odds Ratio (M‐H, Fixed, 95% CI) | 1.05 [0.81, 1.36] |
| 61.2 Adults | 3 | 1215 | Odds Ratio (M‐H, Fixed, 95% CI) | 1.01 [0.69, 1.50] |
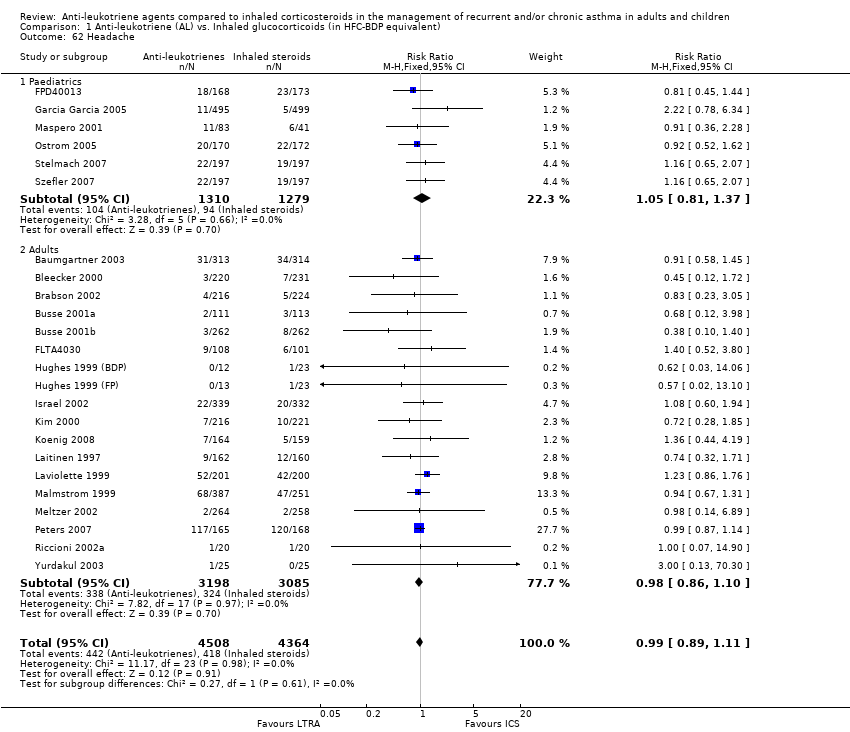
| 62 Headache Show forest plot | 24 | 8872 | Risk Ratio (M‐H, Fixed, 95% CI) | 0.99 [0.89, 1.11] |
|
| 62.1 Paediatrics | 6 | 2589 | Risk Ratio (M‐H, Fixed, 95% CI) | 1.05 [0.81, 1.37] |
| 62.2 Adults | 18 | 6283 | Risk Ratio (M‐H, Fixed, 95% CI) | 0.98 [0.86, 1.10] |
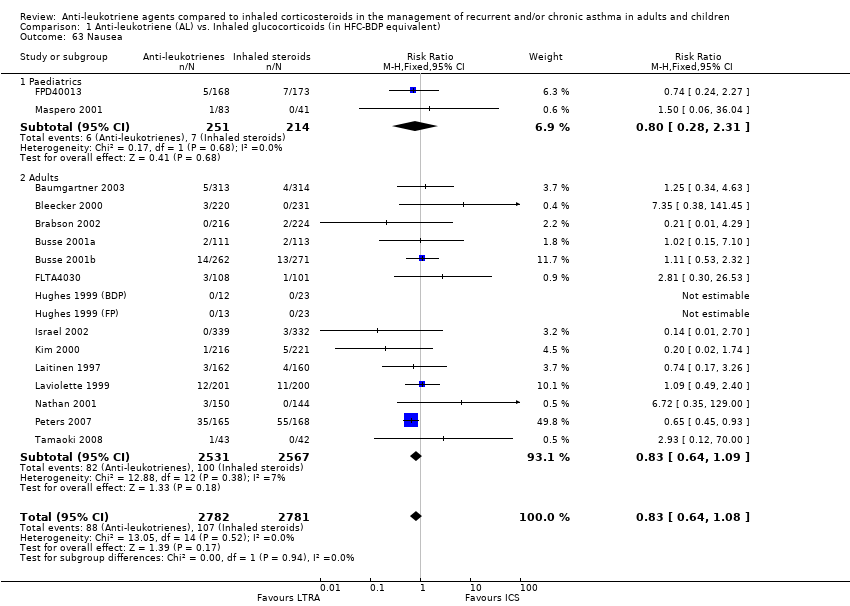
| 63 Nausea Show forest plot | 17 | 5563 | Risk Ratio (M‐H, Fixed, 95% CI) | 0.83 [0.64, 1.08] |
|
| 63.1 Paediatrics | 2 | 465 | Risk Ratio (M‐H, Fixed, 95% CI) | 0.80 [0.28, 2.31] |
| 63.2 Adults | 15 | 5098 | Risk Ratio (M‐H, Fixed, 95% CI) | 0.83 [0.64, 1.09] |
| 64 Oral candidiasis Show forest plot | 3 | 865 | Risk Ratio (M‐H, Fixed, 95% CI) | 0.25 [0.05, 1.19] |
|
| 64.1 Adults | 3 | 865 | Risk Ratio (M‐H, Fixed, 95% CI) | 0.25 [0.05, 1.19] |
| 65 Hoarseness Show forest plot | 2 | 734 | Risk Ratio (M‐H, Fixed, 95% CI) | 0.25 [0.03, 2.24] |
|
| 65.1 Adults | 2 | 734 | Risk Ratio (M‐H, Fixed, 95% CI) | 0.25 [0.03, 2.24] |
| 66 Death Show forest plot | 13 | 5489 | Risk Ratio (M‐H, Fixed, 95% CI) | 3.05 [0.32, 29.26] |
|
| 66.1 Paediatrics | 2 | 1114 | Risk Ratio (M‐H, Fixed, 95% CI) | 3.0 [0.12, 73.46] |
| 66.2 Adults | 11 | 4375 | Risk Ratio (M‐H, Fixed, 95% CI) | 3.10 [0.13, 75.82] |
| 67 Primary outcome ‐ stratified by anti‐leukotrienes Show forest plot | 21 | 6077 | Odds Ratio (M‐H, Random, 95% CI) | 1.61 [1.20, 2.16] |
|
| 67.1 Monelukast | 15 | 4352 | Odds Ratio (M‐H, Random, 95% CI) | 1.55 [1.14, 2.12] |
| 67.2 Zafirlukast | 6 | 1725 | Odds Ratio (M‐H, Random, 95% CI) | 1.92 [0.88, 4.20] |
| 68 Primary outcome ‐ stratified by duration of intervention Show forest plot | 21 | 6077 | Risk Ratio (M‐H, Random, 95% CI) | 1.51 [1.17, 1.96] |
|
| 68.1 4‐8 weeks | 9 | 2346 | Risk Ratio (M‐H, Random, 95% CI) | 1.74 [0.78, 3.87] |
| 68.2 12‐16 weeks | 7 | 1541 | Risk Ratio (M‐H, Random, 95% CI) | 2.06 [1.43, 2.96] |
| 68.3 24‐26 weeks | 2 | 657 | Risk Ratio (M‐H, Random, 95% CI) | 1.17 [0.55, 2.45] |
| 68.4 36‐52 weeks | 3 | 1533 | Risk Ratio (M‐H, Random, 95% CI) | 1.29 [0.87, 1.91] |
| 69 Main outcome ‐stratified by severity of airway obstruction Show forest plot | 21 | 6077 | Risk Ratio (M‐H, Random, 95% CI) | 1.51 [1.17, 1.96] |
|
| 69.1 Mean FEV1 60‐80% of predicted | 11 | 3922 | Risk Ratio (M‐H, Random, 95% CI) | 2.03 [1.41, 2.91] |
| 69.2 Mean FEV1 ≥80% of predicted | 10 | 2155 | Risk Ratio (M‐H, Random, 95% CI) | 1.25 [0.97, 1.61] |
| 70 Primary outcome ‐ stratified by methodological quality Show forest plot | 21 | 6061 | Risk Ratio (M‐H, Random, 95% CI) | 1.51 [1.17, 1.96] |
|
| 70.1 High quality | 11 | 4366 | Risk Ratio (M‐H, Random, 95% CI) | 1.62 [1.29, 2.03] |
| 70.2 Poor quality | 10 | 1695 | Risk Ratio (M‐H, Random, 95% CI) | 1.34 [0.74, 2.43] |
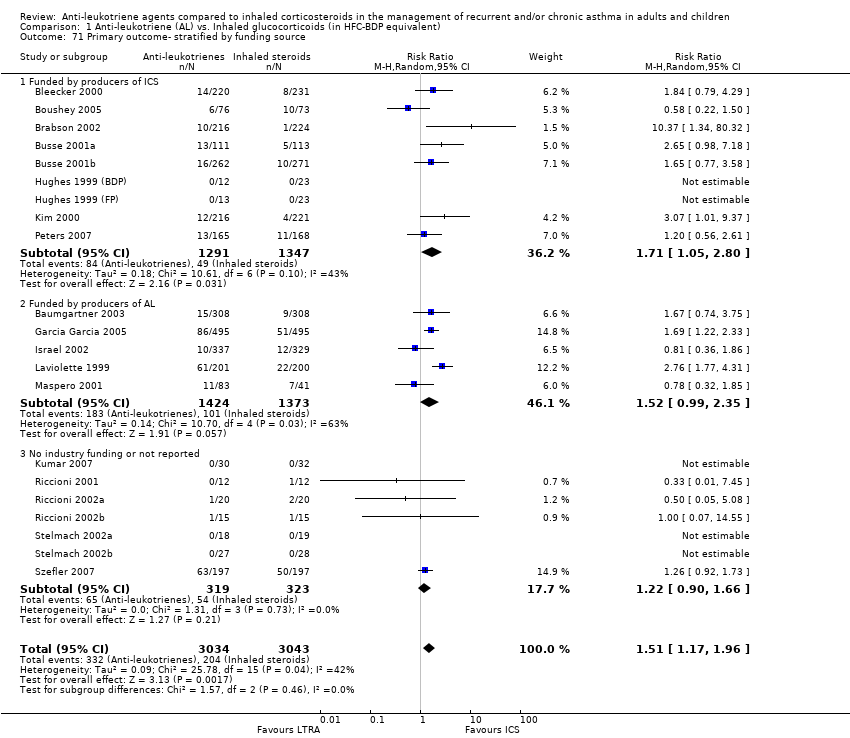
| 71 Primary outcome‐ stratified by funding source Show forest plot | 21 | 6077 | Risk Ratio (M‐H, Random, 95% CI) | 1.51 [1.17, 1.96] |
|
| 71.1 Funded by producers of ICS | 9 | 2638 | Risk Ratio (M‐H, Random, 95% CI) | 1.71 [1.05, 2.80] |
| 71.2 Funded by producers of AL | 5 | 2797 | Risk Ratio (M‐H, Random, 95% CI) | 1.52 [0.99, 2.35] |
| 71.3 No industry funding or not reported | 7 | 642 | Risk Ratio (M‐H, Random, 95% CI) | 1.22 [0.90, 1.66] |
| 72 Primary outcome ‐ stratified by HFC‐BDP equivalent Show forest plot | 21 | 6077 | Odds Ratio (M‐H, Random, 95% CI) | 1.61 [1.20, 2.16] |
|
| 72.1 100‐150 μg HFA‐BDP equivalent | 3 | 216 | Odds Ratio (M‐H, Random, 95% CI) | 0.74 [0.26, 2.08] |
| 72.2 200‐250 μg HFA‐BDP equivalent | 15 | 5767 | Odds Ratio (M‐H, Random, 95% CI) | 1.75 [1.29, 2.38] |
| 72.3 400‐500 μg HFA‐BDP equivalent | 3 | 94 | Odds Ratio (M‐H, Random, 95% CI) | 0.54 [0.11, 2.78] |