Corticosteroids for treating sepsis
Información
- DOI:
- https://doi.org/10.1002/14651858.CD002243.pub3Copiar DOI

- Base de datos:
-
- Cochrane Database of Systematic Reviews
- Versión publicada:
-
- 03 diciembre 2015see what's new
- Tipo:
-
- Intervention
- Etapa:
-
- Review
- Grupo Editorial Cochrane:
-
Grupo Cochrane de Atención crítica y de emergencia
- Copyright:
-
- Copyright © 2018 The Cochrane Collaboration. Published by John Wiley & Sons, Ltd.
Cifras del artículo
Altmetric:
Citado por:
Autores
Contributions of authors
Conceiving of the review: Djillali Annane (DA), Eric Bellissant (EB), Pierre Edouard Bollaert (PEB), Josef Briegel (JB), Didier Keh (DK), Yizhak Kupfer (YK).
Co‐ordinating the review: DA.
Undertaking manual searches: DA, PEB, JB, DK.
Screening search results: DA, PEB, JB, DK, YK.
Organizing retrieval of papers: DA, PEB, JB, DK, YK.
Screening retrieved papers against inclusion criteria: DA, PEB, JB, DK, YK.
Appraising the quality of papers: DA, PEB, JB, DK, YK.
Abstracting data from papers: DA.
Writing to authors of papers to ask for additional information: DA.
Providing additional data about papers: DA, PEB, JB, DK, YK.
Obtaining and screening data on unpublished studies: DA, PEB, JB, DK, YK.
Managing data for the review: DA, EB.
Entering data into Review Manager (RevMan 5): DA.
Analysing RevMan statistical data: DA, EB.
Performing other statistical analyses not using RevMan: not applicable.
Performing double entry of data (data entered by person one: DA; data entered by person two: Laurenne Authelet).
Interpreting data: DA, EB, PEB, JB, DK, YK.
Making statistical inferences: EB.
Writing the review: DA, EB, PEB, JB, DK, YK.
Securing funding for the review: DA.
Performing previous work that served as the foundation of the present study: DA, EB, PEB, JB, DK, YK.
Serving as guarantor for the review (one review author): DA.
Taking responsibility for reading and checking the review before submission: DA.
Sources of support
Internal sources
-
Hopital Raymond Poincaré, Garches, France.
External sources
-
Department for International Development, UK.
Declarations of interest
The following review authors have been involved in randomized controlled trials of low‐dose hydrocortisone that are included in this updated review: Djillali Annane in Annane 2002 and Sprung 2008; Eric Bellissant in Annane 2002; Pierre Edouard Bollaert in Bollaert 1998 and Annane 2002; Josef Briegel in Briegel 1999 and Sprung 2008; Didier Keh in Keh 2003 and Sprung 2008; and Yizhak Kupfer in Chawla 1999.
Djillali Annane is involved with one ongoing study: NCT00625209 2008. This trial is funded by the French Ministry of Social Affairs, Health and Women Rights ‐ Programme Hospitalier de Recherche Clinique PHRC‐12‐002‐0030.
Didier Keh is involved with one ongoing study: NCT00670254 2008. This trial is funded by the Federal Ministry of Education and Research (01KG0701).
Yizhak Kupfer: I am a member of the Pfizer/BMS speakers' bureau for epixaban. This product has no relationship to steroids in sepsis.
Acknowledgements
We would like to thank Harald Herkner (Content Editor), Jing Xie (Statistical Editor), Philipp Schuetz and Mirjam Christ‐Crain (Peer Reviewers) and Janet Wale (Consumer Editor) for help and editorial advice provided during preparation of this 2015 updated systematic review.
We would like to thank Dr. R. DeGaudio, Dr. G.U. Meduri, Dr. M. Oppert, Dr. C. Sprung and Dr. S. Tandan for providing us with unpublished data. We also would like to thank Dr. Bin Du (Medical ICU, Peking Union Medical College Hospital, Beijing 100730, China) for helping with abstraction of information from papers in the Chinese language.
We would like to thank Prof. Harald Herkner (Content Editor); Marialena Trivella (Statistical Editor); Peter Minneci, Charles Natanson, Gordon Guyatt and Matthias Briel (Peer Reviewers) and Karen Hovhannisyan (Trials Search Co‐ordinator) for help and editorial advice provided during preparation of the 2010 updated review.
Version history
| Published | Title | Stage | Authors | Version |
| 2019 Dec 06 | Corticosteroids for treating sepsis in children and adults | Review | Djillali Annane, Eric Bellissant, Pierre Edouard Bollaert, Josef Briegel, Didier Keh, Yizhak Kupfer, Romain Pirracchio, Bram Rochwerg | |
| 2015 Dec 03 | Corticosteroids for treating sepsis | Review | Djillali Annane, Eric Bellissant, Pierre Edouard Bollaert, Josef Briegel, Didier Keh, Yizhak Kupfer | |
| 2004 Jan 26 | Corticosteroids for treating severe sepsis and septic shock | Review | Djillali Annane, Eric Bellissant, Pierre Edouard Bollaert, Josef Briegel, Didier Keh, Yizhak Kupfer | |
| 2000 May 05 | Corticosteroid treatment for septic shock | Protocol | Djillali Annane, Eric Bellissant, Pierre Edouard Bollaert, Josef Briegel, Didier Keh | |
Notes
This review was initially developed within the Infectious Diseases Group and was transferred to the Anaesthesia Group in May 2005.
Updated 2010
The review was updated in 2010 (Annane 2004). At that time, Cochrane updates did not earn a new citation unless they had new review authors or included a change to conclusions. Review authors found 21 new trials in 2010. Of those 21 trials, they included nine randomized controlled trials in the 2010 update. Additional included studies did not change the conclusions of this review. Therefore the 2010 update did not earn a new citation.
Updated 2015
The new search of the literature identified nine additional trials. Cumulated evidence from 33 trials confirmed the direction and magnitude of the point estimate for 28‐day mortality with narrow confidence interval limits. Thus, this update suggested moderate evidence for reduced 28‐day mortality with corticosteroids in the primary analysis and confirmed significant interactions between the relative risk of dying at 28 days and treatment modalities used (lower doses and longer duration yielded better chance of survival) and patient case mix included (patients with septic shock, sepsis‐related ARDS or community‐acquired pneumonia may be more likely to benefit from corticosteroids).
We decided to change the title to "Corticosteroids for treating sepsis" owing to recent changes in the definition of sepsis, suggesting that the term "severe sepsis" should be avoided.
Several changes were made to the Methods section.
-
We now exclude quasi‐randomized trials (three trials).
-
We changed the definition of "long course" from at least five days to at least three days. Indeed, and in keeping with the Surviving Sepsis Campaign recommendation, corticosteroids are often given at full dose until cessation of vasopressor therapy, which may occur sooner than five days. We changed the definition of "low dose" from 300 mg or less per day to 400 mg or less per day. Indeed, no consensus has been reached about what should be the optimal dose, and several RCTs testing so called "low‐dose" corticosteroids used variable doses up to 400 mg. According to findings from the meta‐regression analysis, changes in the definition of "low dose" and "long course" might have had a negative impact on observed survival benefits of corticosteroids. Indeed, we found that both longer duration and lower dose were associated with better survival rates.
-
We have incorporated information on how we used the GRADE system and how we selected outcomes for the 'Summary of findings' table.
Sensitivity analyses based on methodological quality are now restricted to the primary outcome.
Random‐effects models are used only in cases of heterogeneity, with I2 statistic > 30%. Otherwise, fixed‐effect models are used.
Keywords
MeSH
Medical Subject Headings (MeSH) Keywords
- Adrenal Cortex Hormones [adverse effects, *therapeutic use];
- Critical Care;
- Dexamethasone;
- Fludrocortisone [therapeutic use];
- Hydrocortisone [therapeutic use];
- Methylprednisolone [therapeutic use];
- Organ Dysfunction Scores;
- Prednisolone [therapeutic use];
- Randomized Controlled Trials as Topic;
- Sepsis [*drug therapy, mortality];
- Shock, Septic [drug therapy, mortality];
- Time Factors;
Medical Subject Headings Check Words
Adult; Child; Humans;
PICO

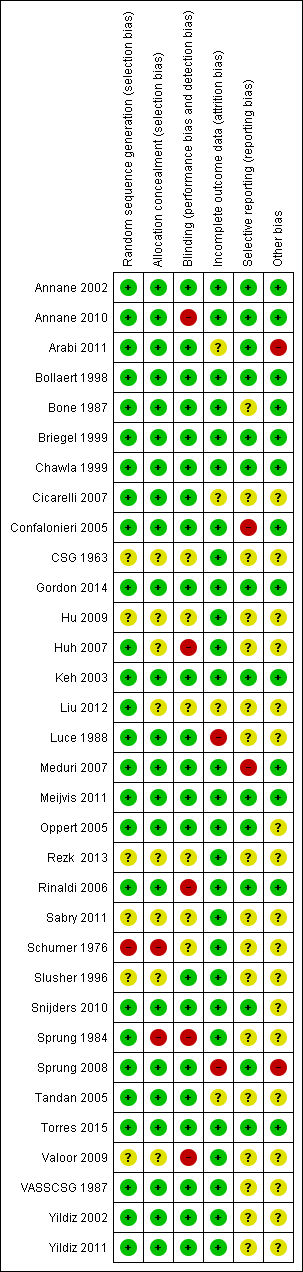
Methodological quality summary: review authors' judgements about each methodological quality item for each included study.

Figure represents the results from meta‐regression of log of risk ratio of dying and log of the dose of corticosteroids given at day 1 and expressed as equivalent mg of hydrocortisone. Estimates from each study are represented by circles. Circle sizes depend on the precision of each estimate (the inverse of its within‐study variance), which is the weight given to each study in the fixed‐effect model.
Meta‐regression included 26 trials. The trial by Schummer et al was not included.
REML estimate of between‐study variance tau2 = .01078.
% residual variation due to heterogeneity: I2 res = 5.07%
Proportion of between‐study variance explained Adj R2 = 11.16%

Figure represents results from meta‐regression of log of risk ratio of dying and log of cumulated dose of corticosteroids expressed as equivalent mg of hydrocortisone. Estimates from each study are represented by circles. Circle sizes depend on the precision of each estimate (the inverse of its within‐study variance), which is the weight given to each study in the fixed‐effect model.
Meta‐regression included 26 trials. The trial by Schummer et al was not included.
REML estimate of between‐study variance tau2 = .01183
% residual variation due to heterogeneity I2 res = 6.99%
Proportion of between‐study variance explained Adj R2 = 2.49%
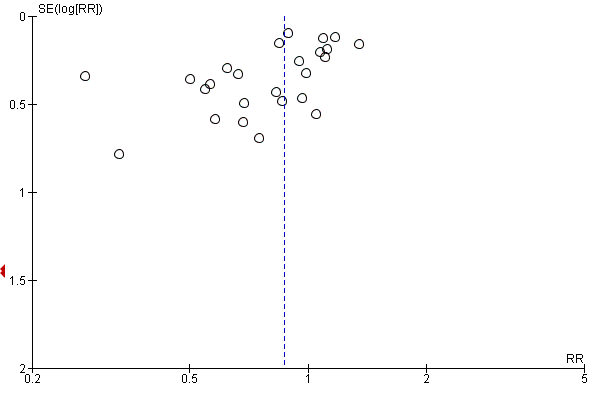
Funnel plot of comparison: 1 Steroids versus control, outcome: 1.1 28‐Day all‐cause mortality.

Contour‐enhanced funnel plot
Log of risk ratio for 28‐day mortality is plotted against its standard error

Comparison 1 Steroids versus control, Outcome 1 28‐Day all‐cause mortality.
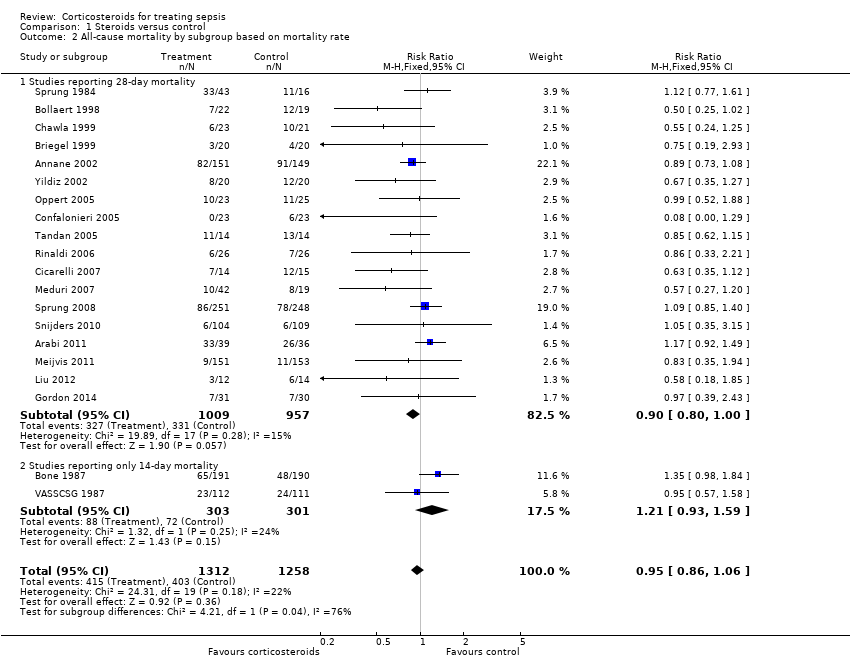
Comparison 1 Steroids versus control, Outcome 2 All‐cause mortality by subgroup based on mortality rate.

Comparison 1 Steroids versus control, Outcome 3 28‐Day all‐cause mortality by subgroups based on methodological quality.

Comparison 1 Steroids versus control, Outcome 4 28‐Day all‐cause mortality by subgroups based on treatment dose/duration.

Comparison 1 Steroids versus control, Outcome 5 28‐Day all‐cause mortality by subgroups based on targeted population.
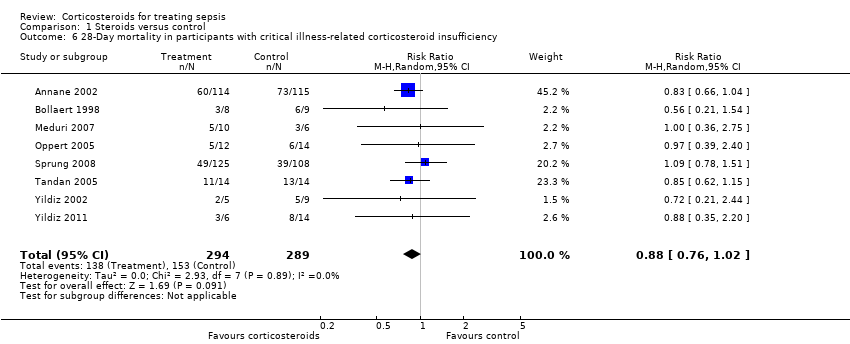
Comparison 1 Steroids versus control, Outcome 6 28‐Day mortality in participants with critical illness‐related corticosteroid insufficiency.
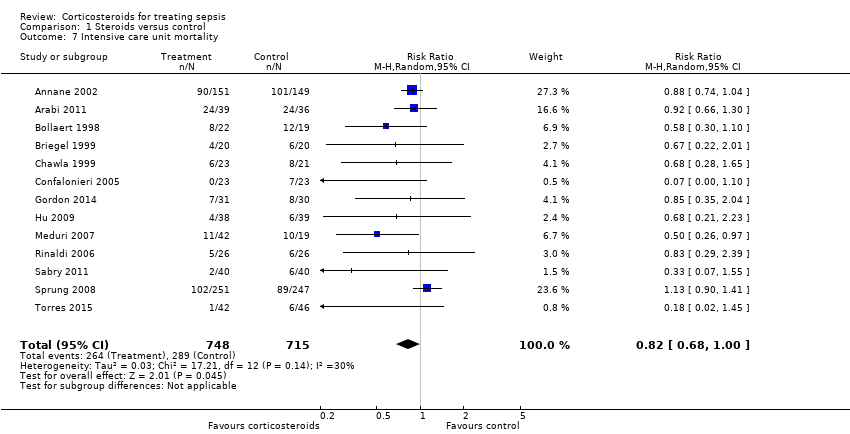
Comparison 1 Steroids versus control, Outcome 7 Intensive care unit mortality.
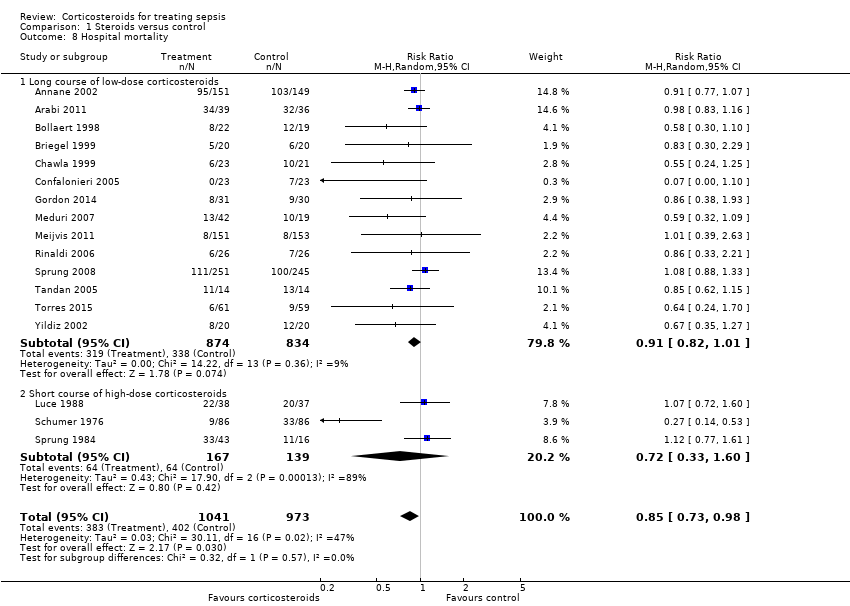
Comparison 1 Steroids versus control, Outcome 8 Hospital mortality.

Comparison 1 Steroids versus control, Outcome 9 Number of participants with shock reversal at day 7.

Comparison 1 Steroids versus control, Outcome 10 Number of participants with shock reversal at 28 days.

Comparison 1 Steroids versus control, Outcome 11 SOFA score at day 7.
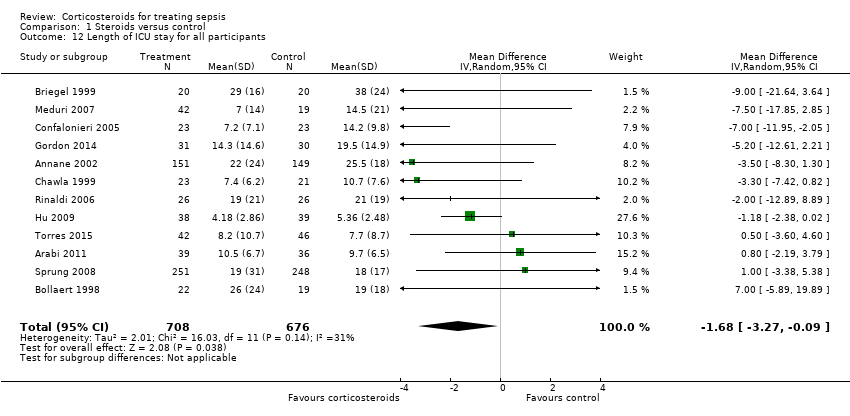
Comparison 1 Steroids versus control, Outcome 12 Length of ICU stay for all participants.

Comparison 1 Steroids versus control, Outcome 13 Length of ICU stay for survivors.

Comparison 1 Steroids versus control, Outcome 14 Length of hospital stay for all participants.
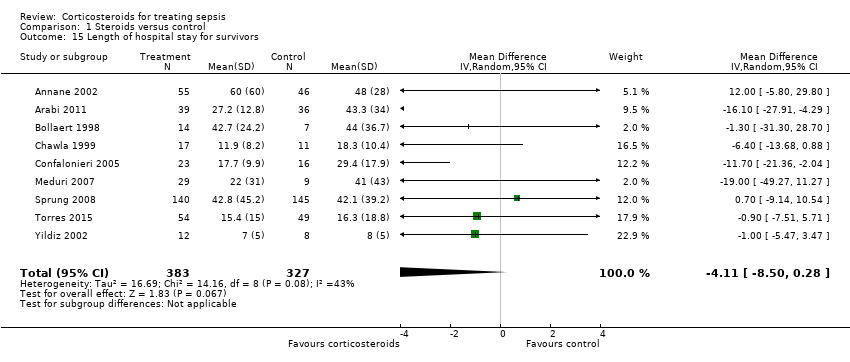
Comparison 1 Steroids versus control, Outcome 15 Length of hospital stay for survivors.

Comparison 1 Steroids versus control, Outcome 16 Number of participants with adverse events.
| Steroids versus control for treating sepsis | ||||||
| Patient or population: patients with sepsis | ||||||
| Outcomes | Illustrative comparative risks* (95% CI) | Relative effect | Number of participants | Quality of the evidence | Comments | |
| Assumed risk | Corresponding risk | |||||
| Control | Steroids vs control | |||||
| 28‐Day all‐cause mortality | Study population | RR 0.87 | 3176 | ⊕⊕⊝⊝ | Trials were conducted over a period from 1976 to 2015. Differences in participant management and in the definition of sepsis were substantial <BR/>18 trial | |
| 318 per 1000 | 276 per 1000 | |||||
| 28‐Day all‐cause mortality by subgroups based on treatment dose/duration ‐ long course of low‐dose corticosteroids | Study population | RR 0.87 | 2266 | ⊕⊕⊕⊝ | Meta‐regression analysis also showed evidence of a dose response: Low doses were associated with better treatment response | |
| 321 per 1000 | 279 per 1000 | |||||
| Hospital mortality | Study population | RR 0.85 | 2014 | ⊕⊕⊕⊝ | Low doses of corticosteroids were associated with better treatment response | |
| 413 per 1000 | 351 per 1000 | |||||
| Number of participants with shock reversal at day 7 | Study population | RR 1.31 | 1561 | ⊕⊕⊕⊕ | Low doses of corticosteroids were associated with better treatment response | |
| 523 per 1000 | 685 per 1000 | |||||
| SOFA score at day 7 | Mean SOFA score at day 7 in intervention groups was | 1132 | ⊕⊕⊕⊕ | Observed reduction in SOFA score was of a magnitude that exceeded any reduction seen with any other treatment for sepsis | ||
| Length of ICU stay for survivors | Mean length of ICU stay for survivors in intervention groups was | 778 | ⊕⊕⊕⊕ | Observed reduction in length of ICU stay was of a magnitude that exceeded any reduction seen with any other treatment for sepsis | ||
| Length of hospital stay for survivors | Mean length of hospital stay for survivors in intervention groups was | 710 | ⊕⊕⊕⊝ | Observed reduction in length of hospital stay was of a magnitude that exceeded any reduction seen with any other treatment for sepsis | ||
| Number of participants with adverse events ‐ superinfections | Study population | RR 1.02 | 2567 | ⊕⊕⊕⊕ | One large trial suggested increased risk of new sepsis with corticosteroids | |
| 161 per 1000 | 164 per 1000 | |||||
| Number of participants with adverse events ‐ hyperglycaemia | Study population | RR 1.26 | 2081 | ⊕⊕⊕⊕ | One trial suggested that risk of hyperglycaemia was lower when corticosteroids were given as a continuous perfusion than when they were given as an intravenous bolus | |
| 348 per 1000 | 438 per 1000 | |||||
| *The basis for the assumed risk is provided in footnotes. The corresponding risk (and its 95% confidence interval) is based on the assumed risk in the comparison group and the relative effect of the intervention (and its 95% CI) | ||||||
| GRADE Working Group grades of evidence | ||||||
| aQuality of evidence was downgraded by 1 point owing to some inconsistency; 1 of the 2 largest trials showed no survival benefit | ||||||
| Outcome or subgroup title | No. of studies | No. of participants | Statistical method | Effect size |
| 1 28‐Day all‐cause mortality Show forest plot | 27 | 3176 | Risk Ratio (M‐H, Random, 95% CI) | 0.87 [0.76, 1.00] |
| 2 All‐cause mortality by subgroup based on mortality rate Show forest plot | 20 | 2570 | Risk Ratio (M‐H, Fixed, 95% CI) | 0.95 [0.86, 1.06] |
| 2.1 Studies reporting 28‐day mortality | 18 | 1966 | Risk Ratio (M‐H, Fixed, 95% CI) | 0.90 [0.80, 1.00] |
| 2.2 Studies reporting only 14‐day mortality | 2 | 604 | Risk Ratio (M‐H, Fixed, 95% CI) | 1.21 [0.93, 1.59] |
| 3 28‐Day all‐cause mortality by subgroups based on methodological quality Show forest plot | 20 | Risk Ratio (M‐H, Random, 95% CI) | Subtotals only | |
| 3.1 Adequate generation of allocation sequence | 19 | 2342 | Risk Ratio (M‐H, Random, 95% CI) | 0.97 [0.86, 1.10] |
| 3.2 Adequate allocation concealment | 18 | 2283 | Risk Ratio (M‐H, Random, 95% CI) | 0.96 [0.84, 1.09] |
| 3.3 Blinded trials | 18 | 2259 | Risk Ratio (M‐H, Random, 95% CI) | 0.95 [0.84, 1.08] |
| 4 28‐Day all‐cause mortality by subgroups based on treatment dose/duration Show forest plot | 27 | Risk Ratio (M‐H, Fixed, 95% CI) | Subtotals only | |
| 4.1 Long course of low‐dose corticosteroids | 22 | 2266 | Risk Ratio (M‐H, Fixed, 95% CI) | 0.87 [0.78, 0.97] |
| 4.2 Short course of high‐dose corticosteroids | 5 | 910 | Risk Ratio (M‐H, Fixed, 95% CI) | 0.96 [0.80, 1.16] |
| 5 28‐Day all‐cause mortality by subgroups based on targeted population Show forest plot | 26 | Risk Ratio (M‐H, Fixed, 95% CI) | Subtotals only | |
| 5.1 Sepsis | 6 | 826 | Risk Ratio (M‐H, Fixed, 95% CI) | 1.11 [0.91, 1.34] |
| 5.2 Septic shock only | 12 | 1444 | Risk Ratio (M‐H, Fixed, 95% CI) | 0.88 [0.78, 0.99] |
| 5.3 Sepsis and ARDS | 3 | 114 | Risk Ratio (M‐H, Fixed, 95% CI) | 0.46 [0.25, 0.85] |
| 5.4 Sepsis and community‐acquired pneumonia | 5 | 763 | Risk Ratio (M‐H, Fixed, 95% CI) | 0.62 [0.38, 1.02] |
| 6 28‐Day mortality in participants with critical illness‐related corticosteroid insufficiency Show forest plot | 8 | 583 | Risk Ratio (M‐H, Random, 95% CI) | 0.88 [0.76, 1.02] |
| 7 Intensive care unit mortality Show forest plot | 13 | 1463 | Risk Ratio (M‐H, Random, 95% CI) | 0.82 [0.68, 1.00] |
| 8 Hospital mortality Show forest plot | 17 | 2014 | Risk Ratio (M‐H, Random, 95% CI) | 0.85 [0.73, 0.98] |
| 8.1 Long course of low‐dose corticosteroids | 14 | 1708 | Risk Ratio (M‐H, Random, 95% CI) | 0.91 [0.82, 1.01] |
| 8.2 Short course of high‐dose corticosteroids | 3 | 306 | Risk Ratio (M‐H, Random, 95% CI) | 0.72 [0.33, 1.60] |
| 9 Number of participants with shock reversal at day 7 Show forest plot | 12 | 1561 | Risk Ratio (M‐H, Random, 95% CI) | 1.31 [1.14, 1.51] |
| 9.1 Shock reversal at day 7 in trials on long course of low‐dose corticosteroids | 10 | 1258 | Risk Ratio (M‐H, Random, 95% CI) | 1.34 [1.22, 1.46] |
| 9.2 Shock reversal at day 7 in trials on short course of high‐dose corticosteroids | 2 | 303 | Risk Ratio (M‐H, Random, 95% CI) | 1.07 [0.64, 1.79] |
| 10 Number of participants with shock reversal at 28 days Show forest plot | 7 | 1013 | Risk Ratio (M‐H, Random, 95% CI) | 1.11 [1.02, 1.21] |
| 11 SOFA score at day 7 Show forest plot | 8 | 1132 | Mean Difference (IV, Random, 95% CI) | ‐1.53 [‐2.04, ‐1.03] |
| 12 Length of ICU stay for all participants Show forest plot | 12 | 1384 | Mean Difference (IV, Random, 95% CI) | ‐1.68 [‐3.27, ‐0.09] |
| 13 Length of ICU stay for survivors Show forest plot | 10 | 778 | Mean Difference (IV, Fixed, 95% CI) | ‐2.19 [‐3.93, ‐0.46] |
| 14 Length of hospital stay for all participants Show forest plot | 12 | 1802 | Mean Difference (IV, Random, 95% CI) | ‐0.97 [‐2.55, 0.61] |
| 15 Length of hospital stay for survivors Show forest plot | 9 | 710 | Mean Difference (IV, Random, 95% CI) | ‐4.11 [‐8.50, 0.28] |
| 16 Number of participants with adverse events Show forest plot | 21 | Risk Ratio (M‐H, Fixed, 95% CI) | Subtotals only | |
| 16.1 Gastroduodenal bleeding | 19 | 2382 | Risk Ratio (M‐H, Fixed, 95% CI) | 1.24 [0.92, 1.67] |
| 16.2 Superinfections | 19 | 2567 | Risk Ratio (M‐H, Fixed, 95% CI) | 1.02 [0.87, 1.20] |
| 16.3 Hyperglycaemia | 13 | 2081 | Risk Ratio (M‐H, Fixed, 95% CI) | 1.26 [1.16, 1.37] |
| 16.4 Hypernatraemia | 3 | 805 | Risk Ratio (M‐H, Fixed, 95% CI) | 1.64 [1.28, 2.09] |
| 16.5 Neuromuscular weakness | 3 | 811 | Risk Ratio (M‐H, Fixed, 95% CI) | 0.62 [0.21, 1.88] |