Corticosteroides para el tratamiento de la sepsis en niños y adultos
Resumen
Antecedentes
La sepsis ocurre cuando una infección es complicada a causa de una insuficiencia orgánica. La sepsis puede ser complicada por una deficiencia en el metabolismo de los corticosteroides. Por lo tanto, la administración de corticosteroides puede beneficiar a los pacientes. La revisión original se publicó en 2004 y se actualizó en 2010 y 2015 antes de esta actualización.
Objetivos
Investigar los efectos de los corticosteroides sobre la muerte en niños y adultos con sepsis.
Métodos de búsqueda
Se realizaron búsquedas en CENTRAL, MEDLINE, Embase, LILACS, ClinicalTrials.gov, ISRCTN y en el Clinical Trials Search Portal de la OMS, el 25 de julio 2019. Además, se realizó la verificación de las referencias y la búsqueda en las citas, y se estableció contacto con los autores de los estudios para identificar estudios adicionales, cuando fue necesario.
Criterios de selección
Se incluyeron los ensayos controlados aleatorizados (ECA) de los corticosteroides versus placebo o atención habitual (antimicrobianos, reemplazo de líquidos y tratamiento con vasopresores cuando fue necesario) en niños y adultos con sepsis. También se incluyeron ECA de la infusión continua versus bolo intermitente de corticosteroides.
Obtención y análisis de los datos
Todos los autores de la revisión examinaron y seleccionaron los estudios para su inclusión. Un autor de la revisión extrajo los datos, que fueron verificados por los otros autores, y por el autor principal del estudio primario, cuando fue posible. Se obtuvieron datos no publicados por parte de los autores de algunos ensayos. Se evaluó la calidad metodológica de los ensayos y se aplicaron los criterios GRADE para evaluar la certeza de la evidencia. Los autores de la revisión no contribuyeron con la evaluación de la elegibilidad y el riesgo de sesgo, ni con la extracción de los datos, para los ensayos en los que habían participado.
Resultados principales
Se incluyeron 61 ensayos (12 192 participantes), de los que seis solo incluyeron a niños, dos incluyeron a niños y adultos, y los ensayos restantes solo incluyeron a adultos. Nueve estudios están en curso y se considerarán en las versiones futuras de esta revisión. Se consideró que 19 ensayos estuvieron en riesgo bajo de sesgo.
Corticosteroides versus placebo o atención habitual
En comparación con placebo o atención habitual, los corticosteroides probablemente reducen ligeramente la mortalidad a los 28 días (riesgo relativo [RR] 0,91; intervalo de confianza [IC] del 95%: 0,84 a 0,99; 11 233 participantes; 50 estudios; evidencia de certeza moderada). Los corticosteroides pueden producir poca o ninguna diferencia en la mortalidad a largo plazo (RR 0,97; IC del 95%: 0,91 a 1,03; 6236 participantes; 7 estudios; evidencia de certeza baja) y probablemente reducen de forma ligera la mortalidad hospitalaria (RR 0,90; IC del 95%: 0,82 a 0,99; 8183 participantes; 26 ensayos; evidencia de certeza moderada). Los corticosteroides redujeron la duración de la estancia en la unidad de cuidados intensivos (UCI) para todos los participantes (diferencia de medias [DM] ‐1,07 días; IC del 95%: ‐1,95 a ‐0,19; 7612 participantes; 21 estudios; evidencia de certeza alta) y dieron lugar a una gran reducción de la estancia hospitalaria para todos los participantes (DM ‐1,63 días; IC del 95%: ‐2,93 a ‐0,33; 8795 participantes; 22 estudios; evidencia de certeza alta). Los corticosteroides aumentan el riesgo de debilidad muscular (RR 1,21; IC del 95%: 1,01 a 1,44; 6145 participantes; 6 estudios; evidencia de certeza alta). Los corticosteroides probablemente no aumentan el riesgo de sobreinfección (RR 1,06; IC del 95%: 0,95 a 1,19; 5356 participantes; 25 estudios; evidencia de certeza moderada). Los corticosteroides aumentan el riesgo de hipernatremia (evidencia de certeza alta) y probablemente aumentan el riesgo de hiperglucemia (evidencia de certeza moderada). La evidencia de certeza moderada muestra que probablemente hay poca o ninguna diferencia en la hemorragia gastroduodenal, el accidente cerebrovascular o los eventos cardíacos, y la evidencia de certeza baja indica que los corticosteroides pueden dar lugar a poca o ninguna diferencia en los eventos neuropsiquiátricos.
Infusión continua de corticosteroides versus bolo intermitente
No se conocen con certeza los efectos de la infusión continua de corticosteroides en comparación con la administración intermitente en bolo. Tres estudios presentaron datos para esta comparación y la certeza de la evidencia para todos los resultados fue muy baja.
Conclusiones de los autores
La evidencia de certeza moderada indica que los corticosteroides probablemente reducen la mortalidad a los 28 días y la mortalidad hospitalaria entre los pacientes con sepsis. Los corticosteroides producen grandes reducciones en la duración de la estancia en la UCI y en el hospital (evidencia de certeza alta). Puede haber poca o ninguna diferencia en el riesgo de complicaciones mayores; sin embargo, los corticosteroides aumentan el riesgo de debilidad muscular e hipernatremia, y probablemente aumentan el riesgo de hiperglucemia. No se conocen efectos de la administración continua versus intermitente en bolo de corticosteroides.
PICO
Resumen en términos sencillos
Corticosteroides para el tratamiento de la sepsis
Pregunta de la revisión
Se examinó la evidencia del efecto sobre la muerte de la administración de corticosteroides en niños y adultos con sepsis.
Antecedentes
La sepsis se observa cuando una infección se complica a causa de una insuficiencia orgánica. Los pacientes desarrollan respiración rápida, hipotensión (presión arterial baja) y confusión mental. La sepsis puede interferir con la efectividad de los corticosteroides del cuerpo, que sirven como una defensa clave contra la infección. Los corticosteroides se han administrado durante décadas a los pacientes con infección por diversas causas.
Fecha de la búsqueda
La evidencia proporcionada en esta revisión está actualizada hasta julio 2019.
Características de los estudios
Esta revisión incluyó 61 ensayos (12 192 participantes). Cincuenta y ocho ensayos compararon corticosteroides con ningún corticosteroide (placebo o atención habitual en 48 y nueve ensayos, respectivamente); tres ensayos también compararon la administración continua versus en bolo de los corticosteroides.
Fuentes de financiación de los estudios
Tres ensayos fueron financiados por una compañía farmacéutica, 27 por organizaciones públicas o a través de fondos caritativos, y seis por parte de una compañía farmacéutica y organizaciones públicas o fondos caritativos; 25 no declararon la fuente de financiación.
Resultados clave
Se analizaron las dos comparaciones siguientes.
‐ Corticosteroides versus placebo/atención habitual.
Los corticosteroides probablemente reducen el riesgo de muerte a los 28 días en un 9% (50 ensayos; 11 233 participantes), con efectos consistentes del tratamiento entre niños y adultos. También es probable que reduzcan ligeramente el riesgo de muerte en el hospital. Puede haber poco o ningún efecto de los corticosteroides sobre el riesgo de muerte a largo plazo (más de tres meses), aunque hay menos certeza en cuanto a estos resultados. Los corticosteroides producen una gran reducción en la duración de la estancia en la unidad de cuidados intensivos (UCI) y en el hospital. Los corticosteroides aumentan el riesgo de debilidad muscular e hipernatremia. Probablemente aumentan el riesgo de hiperglucemia. Probablemente no aumentan el riesgo de sobreinfección. Los corticosteroides pueden tener poco o ningún efecto sobre el riesgo de hemorragia gastroduodenal, eventos neuropsiquiátricos, accidente cerebrovascular o eventos cardíacos.
‐ Infusión continua versus bolos intermitentes de corticosteroides.
No se conocen con certeza los efectos de la infusión continua de corticosteroides en comparación con la administración intermitente en bolo. Tres estudios presentaron datos para esta comparación y la certeza de la evidencia para todos los resultados fue muy baja.
Certeza de la evidencia
‐ Corticosteroides versus placebo/atención habitual
La certeza de la evidencia en cuanto a la mortalidad a los 28 días se consideró moderada debido a cierta inconsistencia relacionada con las diferencias entre las poblaciones de estudio, los tipos de corticosteroides y cómo se administraron, y el uso de intervenciones adicionales.
‐ Infusión continua versus bolos intermitentes de corticosteroides
La certeza de la evidencia en cuanto a la mortalidad a los 28 días se consideró muy baja debido a la inconsistencia y la imprecisión.
Conclusiones de los autores
Summary of findings
| Corticosteroids compared to placebo or usual care for treating sepsis | ||||||
| Patient or population: children and adults with sepsis | ||||||
| Outcomes | Anticipated absolute effects* (95% CI) | Relative effect | № of participants | Certainty of the evidence | Comments | |
| Risk with placebo or usual care | Risk with corticosteroids | |||||
| 28‐Day all‐cause mortalitya | Study population | RR 0.91 | 11233 | ⊕⊕⊕⊝ | Corticosteroids probably slightly reduce 28‐day all‐cause mortality | |
| 264 per 1000 | 240 per 1000 | |||||
| Long‐term mortalityc | Study population | RR 0.97 | 6236 | ⊕⊕⊝⊝ | Corticosteroids may result in little to no difference in long‐term mortality | |
| 386 per 1000 | 374 per 1000 | |||||
| Hospital mortality | Study population | RR 0.90 | 8183 | ⊕⊕⊕⊝ | Corticosteroids probably slightly reduce hospital mortality | |
| 323 per 1000 | 291 per 1000 | |||||
| Length of intensive care unit stay for all participants in days | Mean length of intensive care unit stay for all participants was 14 days | MD 1.07 lower | ‐ | 7612 | ⊕⊕⊕⊕ | Corticosteroids reduced length of intensive care unit stay for all participants |
| Length of hospital stay for all participants in days | Mean length of hospital stay for all participants was 21 days | MD 1.63 lower | ‐ | 8795 | ⊕⊕⊕⊕ | Corticosteroids result in a large reduction in length of hospital stay for all participants |
| Number of participants with adverse events ‐ superinfection (up to longest follow‐up) | Study population | RR 1.06 | 5356 | ⊕⊕⊕⊕ | Corticosteroids probably do not increase the number of participants with adverse events ‐ superinfection | |
| 169 per 1000 | 180 per 1000 | |||||
| Number of participants with adverse events ‐ muscle weakness (up to longest follow‐up) | Study population | RR 1.21 | 6145 | ⊕⊕⊕⊕ | Corticosteroids increase the number of participants with adverse events ‐ muscle weakness | |
| 56 per 1000 | 68 per 1000 | |||||
| *The risk in the intervention group (and its 95% confidence interval) is based on the assumed risk in the comparison group and the relative effect of the intervention (and its 95% CI). The unit of measure for length of stay is days. | ||||||
| GRADE Working Group grades of evidence. | ||||||
| aSensitivity analysis based on trials judged as being at low risk of bias showed an RR for dying at 28 days of 0.91 (95% CI 0.84 to 0.98; P = 0.01; 7896 participants; 17 studies; I² = 0%). bDowngraded one level for inconsistency; there was significant statistical heterogeneity. cLong‐term mortality was recorded up to six months for three trials (Annane 2018; Keh 2016; Venkatesh 2018), and up to one year for four trials (Annane 2002; Briegel 1999; Meduri 2007; Sprung 2008). dLarge 95% confidence interval overlapping the neutrality line. eUpgraded one level due to large size effects. | ||||||
Antecedentes
Descripción de la afección
La sepsis ocurre cuando se observa una respuesta desregulada del huésped a una infección (Singer 2016). La respuesta desregulada del huésped se suele definir por la presencia de una puntuación de 2 o más en la evaluación secuencial de la insuficiencia orgánica (SOFA, por sus siglas en inglés) (Singer 2016; Vincent 1996). El shock séptico es un subgrupo de la sepsis en el que las anomalías circulatorias, celulares y metabólicas particularmente profundas se asocian con un riesgo mayor de mortalidad que la sepsis sola. Los pacientes con shock séptico se pueden identificar clínicamente por la necesidad de vasopresores para mantener una presión arterial media de 65 mmHg o superior, y niveles de lactato sérico superiores a 2 mmol/l (> 18 mg/dl) en ausencia de hipovolemia. La respuesta desregulada puede dar lugar a inflamación sistémica y a daño a los órganos, o a paresia inmune e infección secundaria (van der Poll 2017). En 2017 la Organización Mundial de la Salud calculó que alrededor de 31 000 000 de personas desarrollan sepsis cada año, y alrededor de 10 000 000 mueren (WHO 2018). Según un estudio de cohortes retrospectivo reciente de pacientes adultos que ingresaron en 409 hospitales académicos, comunitarios y federales de los EE.UU. entre 2009 y 2014; la sepsis estuvo presente en el 6% de las hospitalizaciones de adultos (Rhee 2017). Otro estudio de registros electrónicos sanitarios de 27 hospitales académicos en los EE.UU. informó sobre una incidencia anual de shock séptico de aproximadamente 19 por 1000 hospitalizaciones en 2014 (Kadri 2017). Los pacientes con sepsis generalmente mueren por hipotensión o insuficiencia progresiva de múltiples órganos (Angus 2013; Annane 2003; Annane 2005; Parrillo 1993). Actualmente no existe una prueba diagnóstica para la sepsis. Su tratamiento estándar incluye el control de la fuente de infección con antibióticos y cirugía de ser necesario, así como el control de la oxigenación de los tejidos con reemplazo de líquidos, oxígeno con o sin asistencia respiratoria y vasopresores de ser necesario (Rhodes 2017). Todavía no se dispone de intervenciones específicas para controlar las respuestas inmunitarias a los patógenos invasores (Rhodes 2017). Se ha calculado que la carga financiera de la sepsis en el sistema sanitario es de > USD 24 000 millones; lo que representó el 6,2% del total de los costes hospitalarios en 2013 (WHO 2018). Los estudios realizados en Europa y Canadá calcularon que los costes diarios de la atención hospitalaria de un paciente séptico en el año 2000 fueron de entre EUR 710 y 1033 (equivalente a alrededor de USD 645 y USD 939, respectivamente) (WHO 2018).
Descripción de la intervención
Los corticosteroides incluyen hormonas esteroides naturales producidas por las células adrenocorticales y una variedad amplia de análogos sintéticos. Estas sustancias tienen diversos efectos que se pueden clasificar de manera general en efectos glucocorticoides y mineralocorticoides. Los efectos glucocorticoides incluyen principalmente la regulación del metabolismo de carbohidratos, lípidos y proteínas, así como la regulación de la inflamación. Los efectos mineralocorticoides incluyen principalmente la regulación de los electrólitos y el metabolismo del agua. A niveles moleculares, los glucocorticoides tienen efectos genómicos y no genómicos (Annane 2017a; Cain 2017). Los efectos rápidos (en minutos) no genómicos de los glucocorticoides incluyen una disminución en la agregación plaquetaria, en la adhesión celular y en las fosfotirosinoquinasas intracelulares, e incluyen un aumento en la externalización de la anexina 1 (Lowenberg 2005). Estos efectos pueden deberse a la interacción de los glucocorticoides con sitios específicos de la membrana (Norman 2004). Los glucocorticoides tienen efectos genómicos indirectos, llamados transrepresión (Rhen 2005). Los mismos ocurren unas pocas horas después de la exposición de las células a los glucocorticoides. Son resultado de la interacción física entre el complejo glucocorticoide monomérico‐receptor de glucocorticoide (G‐GR)α y varios factores de transcripción nuclear, como el factor nuclear (NF)‐κB y el activador proteico (AP)‐1. Posteriormente, estos factores de transcripción nuclear son secuestrados en el citosol y no pueden entrar al núcleo, lo que impide la expresión de los genes codificados para la mayoría de los mediadores proinflamatorios, o de todos ellos. Los glucocorticoides también tienen efectos genómicos directos, llamados transactivación. Requieren solamente unos pocos días de exposición celular a los glucocorticoides. De hecho, se necesitan cambios conformacionales (es decir, dimerización del complejo G‐GRα) antes de que este complejo pueda migrar al núcleo para interactuar con elementos que responden a los glucocorticoides, o sea, partes de genes codificados para los reguladores de la terminación de la inflamación. Entonces, aumenta el número de factores antiinflamatorios clave, lo que da lugar a fagocitosis, quimiocinesia y procesos antioxidantes. El efecto neto de los glucocorticoides incluye la reprogramación en lugar de la inhibición de la función de las células inmunitarias (Erschen 2007). Los glucocorticoides inducen subtipos específicos de monocitos antiinflamatorios activados que migran rápidamente a los tejidos inflamados (Varga 2008). Prolongan la supervivencia de este subtipo de monocitos mediante los efectos antiapoptóticos desencadenados por el receptor de adenosina A3 (Barczyk 2010). En términos generales, estos mecanismos moleculares de acción de los glucocorticoides son apropiados para contrarrestar la inflamación no controlada que podría caracterizar la sepsis.
De qué manera podría funcionar la intervención
Los investigadores han explorado los mecanismos biológicos de la sepsis para investigar las posibles intervenciones. Los corticosteroides han sido un tema de interés particular debido a su influencia en la respuesta inmunitaria (Cain 2017). En la sepsis, la vía hormonal hipotálamo‐hipofisaria hacia las glándulas suprarrenales estimula la producción de corticosteroides (Annane 2017a; Chrousos 1995; Cooper 2003; Heming 2018). Estas hormonas afectan la inflamación mediante la producción de glóbulos blancos, citoquinas (proteínas que influyen sobre la respuesta inmunitaria) y óxido nítrico. En la sepsis, las citoquinas pueden suprimir la síntesis de la hormona adrenocorticotropina (Annane 2017a; Polito 2011; Sharshar 2003), junto con la respuesta del cortisol a la hormona adrenocorticotropina exógena (Annane 2017a; Hotta 1986; Jaattela 1991). De la misma manera, la sepsis se puede asociar con alteraciones en la liberación de colesterol mediada por el receptor neutralizador B1 (Cai 2008). Lo anterior causa una actividad suprarrenal deficiente en casi la mitad de los pacientes (Annane 2000; Lipiner 2007; Marik 2008; Rothwell 1991), así como una posible resistencia de los tejidos corporales a los corticosteroides debido a un menor número de receptores de corticosteroides, o a la menor afinidad de los receptores (Barnes 1995; Huang 1987; Meduri 1998a; Molijn 1995). La alteración en el número de receptores de corticosteroides y en la capacidad de unión puede estar relacionada al menos en parte al óxido nítrico (Duma 2004; Galigniana 1999). Los trabajos recientes indican que las células inmunitarias (no las células que secretan esteroides) son reguladores clave de la interacción entre el sistema inmunitario y las suprarrenales (Kanczkowski 2013). Además, algunas enfermedades agudas como la sepsis se pueden asociar con una disminución de la eliminación de cortisol del plasma (Boonen 2013; Melby 1958), probablemente como resultado de la alteración de la inactivación hepática y renal del cortisol (Boonen 2013). Los estudios anteriores demostraron que una dosis farmacológica de corticosteroides prolongó la supervivencia entre los animales con sepsis (Fabian 1982). Los estudios más recientes en roedores demostraron que las dosis inferiores de corticosteroides, por ejemplo, 0,1 mg/kg de dexametasona, mejoraron la función hemodinámica y orgánica, modularon de manera favorable la respuesta inflamatoria y prolongaron la supervivencia (di Villa Bianca 2003; Heller 2003; Tsao 2004; Vachharajani 2006). Los efectos protectores de estos glucocorticoides contra la sepsis pueden ser mediados en parte por el receptor de glucocorticoide endotelial (Goodwin 2013). En voluntarios sanos estimulados con endotoxinas, una dosis baja de corticosteroides, por ejemplo, 10 mg de prednisolona, bloqueó la liberación de citoquinas proinflamatorias, impidió la activación de las células endoteliales y los neutrófilos e inhibió la respuesta de la fase aguda sin alterar el equilibrio de la coagulación y la fibrinólisis (de Kruif 2007). Los estudios en pacientes con shock séptico demostraron que un tratamiento de corta duración con corticosteroides puede dar lugar a un rebote en la respuesta inflamatoria sistémica (Briegel 1994; Keh 2003). Además, actualmente se reconoce que el aumento en la liberación de citoquinas proinflamatorias se puede mantener por más de una semana en los pacientes con sepsis (Kellum 2007). Asimismo, el momento de inicio de los corticosteroides puede ser un factor importante en la respuesta al tratamiento. De hecho, en los estudios observacionales la mortalidad a corto plazo aumentó con el inicio tardío de la hidrocortisona (Katsenos 2014; Park 2012). Por dichos motivos, se podría prever que el tratamiento con corticosteroides es beneficioso en pacientes con sepsis, y que las diferencias en las dosis, el momento adecuado o la duración del tratamiento con corticosteroides pueden afectar de manera diferente la respuesta del paciente al tratamiento. Finalmente, varios autores han argumentado que en pacientes con sepsis la hidrocortisona se debe administrar como una infusión continua en lugar de bolos intermitentes para reducir el riesgo de complicaciones metabólicas (Rhodes 2017). En los ensayos de la sepsis, la infusión continua de hidrocortisona se asoció de forma variable con mejores o peores resultados que los bolos intravenosos intermitentes (Loisa 2007; Tilouche 2019).
Por qué es importante realizar esta revisión
Inicialmente los investigadores utilizaron dosis altas de corticosteroides, en general administradas como un único bolo, en un intento por bloquear la posible descarga de citoquinas proinflamatorias. Dos revisiones sistemáticas y metanálisis de ensayos de los corticosteroides en la sepsis o en el shock séptico incluyeron diez (Lefering 1995) y nueve (Cronin 1995) ensayos controlados aleatorizados (ECA), respectivamente. Estas revisiones sistemáticas no mostraron efectos significativos sobre el riesgo relativo de muerte, hemorragia gastrointestinal o sobreinfección asociada con el uso de corticosteroides.
Por consiguiente, la mayoría de los médicos no recomendarán la administración de dosis altas de corticosteroides en la sepsis (Annane 2017b; Rhodes 2017). Los posibles efectos beneficiosos de una dosis más baja (≤ 400 mg de hidrocortisona o equivalente por día) y una duración más prolongada con una dosis completa (≥ 3 días) del tratamiento se han investigado en numerosos ECA durante las últimas tres décadas (Annane 2017b; Lamontagne 2018; Rochwerg 2018). En los últimos dos años, al menos cinco entidades han publicado guías de práctica clínica sobre el uso de corticosteroides en la sepsis (Annane 2017b; Lamontagne 2018; Nishida 2018; Rhodes 2017; Tavaré 2017). Todas las guías excepto una (Lamontagne 2018) recomendaron no usar corticosteroides en la sepsis, excepto en pacientes con shock séptico y una respuesta deficiente al reemplazo de líquidos y al tratamiento con vasopresores. Algunas guías indicaron que los corticosteroides se deben administrar como infusión continua en lugar de en bolos intermitentes (Annane 2017b; Rhodes 2017). En el año 2018 cinco revisiones sistemáticas y metanálisis diferentes consideraron los efectos de los corticosteroides en la sepsis (Allen 2018; Fang 2018; Ni 2018; Rochwerg 2018; Rygard 2018). El número de ensayos incluidos fue diferente en todas las revisiones y varió entre 14 y 42. El riesgo relativo de muerte a corto plazo varió de 0,91 a 0,96, y el límite superior del intervalo de confianza (IC) del 95% varió de 0,98 a 1,03. Otra revisión sistemática y metanálisis de un ensayo aleatorizado y 17 estudios observacionales examinó el riesgo de debilidad muscular adquirida asociada con la exposición a corticosteroides en pacientes en la unidad de cuidados intensivos (UCI) (Yang 2018). Esta revisión encontró un odds ratio para la debilidad muscular adquirida de 1,84 (IC del 95%: 1,26 a 2,67) con los corticosteroides en comparación con el control.
Por lo tanto, el objetivo es revisar sistemáticamente los efectos de los corticosteroides en niños y adultos con sepsis.
Objetivos
Investigar los efectos de los corticosteroides sobre la muerte en niños y adultos con sepsis.
Métodos
Criterios de inclusión de estudios para esta revisión
Tipos de estudios
Se incluyeron ensayos controlados aleatorizados (ECA), sin restricciones metodológicas. Se excluyeron los ensayos cuasialeatorizados (es decir, los ensayos que asignaron a los pacientes a los brazos de tratamiento según métodos sistemáticos como la alternancia, la asignación según la fecha de nacimiento, el número de registro de casos y la fecha de presentación).
Tipos de participantes
Se incluyó a niños y adultos con sepsis según lo definido por los criterios Sepsis 3 (Singer 2016) o por los siguientes criterios (ACCP/SCCM 1992; Vincent 2013).
-
Sospecha de infección o infección documentada definida como un cultivo o tinción de Gram de sangre, esputo, orina o líquido corporal normalmente estéril que es positivo para un microorganismo patógeno; o un foco de infección identificado mediante la inspección visual (p.ej. ruptura de intestino con presencia de aire libre o contenido intestinal en el abdomen encontrados al momento de la cirugía; herida con drenaje purulento).
-
Al menos dos síntomas de un síndrome de respuesta inflamatoria sistémica, como fiebre (temperatura corporal > 38°C) o hipotermia (< 36°C), taquicardia (> 90 latidos por minuto), taquipnea (> 20 respiraciones por minuto) o hiperventilación (tensión de dióxido de carbono arterial [PaCO₂] < 32 mmHg) y recuento anormal de leucocitos (> 12 000 células/ml o < 4000 células/ml) o más del 10% del grupo de neutrófilos inmaduros.
-
Al menos un signo de disfunción orgánica, o sea, acidosis metabólica, hipoxemia arterial (tensión de oxígeno arterial [PaO₂]:fracción inspirada de oxígeno [FiO₂] < 250 mmHg), oliguresis (< 30 ml/h durante ≥ 3 horas), coagulopatía o encefalopatía.
El shock séptico se definió mediante la presencia de sepsis y de hipotensión (presión arterial sistólica constante < 90 mmHg) que no responde a la reanimación con líquidos y requiere apoyo vasopresor (es decir, > 5 µg/kg de peso corporal por minuto de dopamina o cualquier dosis de epinefrina o norepinefrina).
Se incluyeron datos de ensayos sobre la neumonía adquirida en la comunidad o el síndrome de dificultad respiratoria aguda (SDRA) cuando había datos de los participantes con sepsis disponibles por separado, o cuando el contacto con los autores de los estudios dio lugar a que se proporcionaran datos.
Tipos de intervenciones
Corticosteroides versus placebo/atención habitual
Intervención
El tratamiento sistémico se proporcionó como cualquier tipo de preparación de corticosteroides (p.ej. cortisona, hidrocortisona, metilprednisolona, betametasona, dexametasona).
El tratamiento con corticosteroides en dosis baja se definió como una dosis diaria total de 400 mg o menos de hidrocortisona (o equivalente); de lo contrario, la dosis de corticosteroides se consideraría alta. Un ciclo largo para la intervención se definió como una duración del tratamiento de dosis completa de tres días o más; de lo contrario, el tratamiento se consideró un ciclo corto.
Control
Se proporcionó tratamiento estándar (que pudo incluir antibióticos, reemplazo de líquidos, tratamiento inotrópico o vasopresor, ventilación mecánica o tratamiento de reemplazo renal) o placebo.
Infusión continua versus administración en bolo de corticosteroides
Intervención
La infusión continua se definió mediante la infusión intravenosa de corticosteroides con o sin una dosis de carga inicial.
Control
La administración en bolo se definió como inyecciones intravenosas intermitentes con una duración inferior a 30 minutos.
Tipos de medida de resultado
Resultados primarios
-
Mortalidad por todas las causas a los 28 días
De hecho, ésta fue la medida de resultado primaria en la mayoría de los ECA sobre la sepsis realizados desde 1992 (Annane 2009b). La mayoría de los estudios realizados antes de 1992 analizó las tasas de mortalidad hospitalaria o a los 14 días. Estos datos se utilizaron para computar el análisis agrupado sobre la mortalidad a los 28 días, a menos que se pudieran obtener las tasas de mortalidad reales a los 28 días por parte de los autores de los estudios primarios.
Resultados secundarios
-
Mortalidad por todas las causas a los 90 días
Éste fue el resultado primario en los dos ensayos más recientes y más grandes sobre corticosteroides para la sepsis.
-
Mortalidad por todas las causas a largo plazo (el seguimiento más largo disponible después de 3 meses)
-
Mortalidad por todas las causas en la UCI
-
Mortalidad por todas las causas en el hospital
Los resultados de la mortalidad dentro de la UCI y hospitalaria proporcionan la ubicación de la muerte, lo que agrega contexto al resultado primario.
-
Número de participantes con reversión del shock (definida por un estado hemodinámico estable ≥ 24 horas después de la interrupción del tratamiento vasopresor) a los siete días y a los 28 días
-
Número de órganos afectados y gravedad de la disfunción orgánica en el día siete, en los pacientes individuales, según lo medido con la puntuación SOFA (Vincent 1996). Esta puntuación califica de 0 (función normal) a 4 (la más grave) la disfunción de seis sistemas orgánicos (Respiración, Coagulación, Hígado, Cardiovascular, Sistema Nervioso Central, Renal). Varía de 0 (sin insuficiencia orgánica) a 24 (disfunción orgánica más grave)
-
Duración de la estancia en la UCI (para todos los participantes y para los supervivientes solamente). Este resultado se expresa como la media (desviación estándar [DE]) del número de días y se calcula por la diferencia entre las fechas del alta de la UCI y de ingreso en la UCI; el primer y el último día de estancia en la UCI se cuentan como días completos en la UCI, independientemente del momento del ingreso y del alta
-
Duración de la estancia hospitalaria (para todos los participantes y para los supervivientes solamente). Este resultado se expresa como el número medio (DE) de días y se calcula de acuerdo a la diferencia entre las fechas del alta hospitalaria y de ingreso, con el primer y el último día de la estancia hospitalaria contados como días completos de hospitalización, independientemente del momento del ingreso y del alta
-
Eventos adversos (es decir, hemorragia gastrointestinal, sobreinfección, hiperglucemia, hipernatremia, debilidad muscular, eventos neuropsiquiátricos, accidente cerebrovascular, eventos cardíacos o cualquier otro efecto adverso o complicaciones del tratamiento con corticosteroides). Cada evento adverso se expresa como el número (%) de pacientes con al menos un episodio de este evento, según lo definido en los estudios individuales, excepto para la hiperglucemia y la hipernatremia. Siempre que fue posible, la hiperglucemia se definió como valores > 180 mg/dl, y la hipernatremia como valores > 149 mmol/l.
Métodos de búsqueda para la identificación de los estudios
We attempted to identify all relevant studies regardless of language or publication status (e.g. published, unpublished, in press, in progress).
Búsquedas electrónicas
We searched the Cochrane Central Register of Controlled Trials (CENTRAL; 2019 Issue 7), in the Cochrane Library, using the search terms 'sepsis', 'septic shock', 'steroids', and 'corticosteroids' (for the detailed search strategy, see Appendix 1).
We also searched (to 25 July 2019) MEDLINE ALL (Ovid SP), Embase (Ovid SP), and Latin American Caribbean Health Sciences Literature (LILACS), using the topic search terms in combination with the search strategy for identifying trials developed by Cochrane (Higgins 2011). (For detailed search strategies, see Appendix 2 (MEDLINE), Appendix 3 (Embase), and Appendix 4 (LILACS).)
Finally, we searched for ongoing RCTs (to 25 July 2019) at ClinicalTrials.gov, International Standard Randomized Controlled Trials Number (ISRCTN), and the World Health Organization (WHO) International Clinical Trials Registry Platform (ICTRP), using the search terms 'septic shock', 'sepsis', steroids', 'corticosteroids', 'adrenal cortex hormones', and 'glucocorticoids'.
Búsqueda de otros recursos
We checked the reference lists and citations of all trials and relevant systematic reviews identified by the electronic searches, and we contacted study authors to request additional published or unpublished data. We also searched the proceedings of annual meetings of major critical care medicine symposia, that is, Society of Critical Care Medicine, American Thoracic Society, International Symposium on Intensive Care and Emergency Medicine, American College of Chest Physicians, and European Society of Intensive Care Medicine (1998 to 2019).
Obtención y análisis de los datos
Selección de los estudios
All review authors checked the titles and abstracts identified during the search. All review authors examined, in full, any trial that potentially met the inclusion criteria. We decided which trials met the inclusion criteria. We resolved disagreements between review authors by discussion until we reached consensus. Review authors did not contribute to the decision for inclusion of trials in which they had participated.
One review author (DA) contacted study authors for clarification, when necessary.
Extracción y manejo de los datos
One review author (DA) drew up a standard data extraction form, and four other review authors (PEB, JB, DK, YK) amended and validated the design of the form before data abstraction. Review authors (DA, PEB, JB, DK, RP, BR) independently extracted data, except those from trials in which they had participated.
One review author (DA) systematically contacted the authors of trials to request missing data when possible.
One review author (DA) and one member of this author’s research staff independently extracted and entered data into the computer. All review authors checked the accuracy of data entered against the original articles.
Evaluación del riesgo de sesgo de los estudios incluidos
We assessed risk of bias within individual trials as recommended by the Cochrane Handbook for Systematic Reviews of Interventions (Higgins 2011). We considered the following domains: selection bias, performance bias, detection bias, attrition bias, reporting bias, and any other bias. We judged selection bias on the basis of how the random sequence was generated, and how allocation was concealed. We judged performance bias and detection bias on the basis of who was blinded and how, among participants, caregivers, pharmacists, data collectors, outcome assessors, and data analysts (Devereaux 2001). In judging attrition bias, we considered how many participants were lost to follow‐up or were not included in analyses (and the reasons why). When available, we compared outcomes reported in trial protocols versus actual results reported, to identify potential selective reporting bias. We resolved disagreements between review authors by discussion until we reached consensus.
One review author (DA) contacted study authors for clarification, when necessary.
We assessed, independently and in duplicate (two of DA, BR, or RP), for each outcome of individual studies using a modified Cochrane risk of bias tool (Guyatt 2013), which classifies risk of bias as "low", "probably low", "probably high", or "high" for each of the following domains: sequence generation, allocation sequence concealment, blinding, selective outcome reporting, and other bias. We rated the overall risk of bias as the highest risk attributed to any criterion.
Review authors did not contribute to the assessment of risk of bias of any trial in which they had participated.
Medidas del efecto del tratamiento
-
We performed intention‐to‐treat (ITT) analyses. We performed all statistical calculations using Review Manager 2014 or Stata 2015, as appropriate
-
We calculated a weighted treatment effect across trials. We expressed results as risk ratios (RRs) with 95% confidence intervals (CIs) for dichotomous outcomes, and as mean differences (MDs, 95% CIs) for continuous outcomes
Cuestiones relativas a la unidad de análisis
In this review, we used data from trials in which the unit of randomization was the individual, and in which parallel groups were designed. For events that may occur repeatedly, such as receiving vasopressor therapy or staying in the ICU, we used only the first occurrence of the event.
When trials included more than two arms (e.g. comparing vs control two different corticosteroids or two different modes of administration of the same corticosteroid), we pooled data from the experimental arms for comparison of steroids versus control.
Manejo de los datos faltantes
We systematically tried to contact primary authors of original trials to obtain missing information and unpublished data. We obtained additional data from primary authors of 28 trials, including access to individual patient data for 16 trials (Appendix 5). This information is provided for each trial in the notes section of Characteristics of included studies.
For the primary outcome of this review (28‐day all‐cause mortality), we systematically contacted trial authors when needed to obtain data for participants who dropped out. When trials did not report 28‐day all‐cause mortality, and contact with trial authors failed to yield actual 28‐day mortality rates, we used available mortality data closest to 28 days.
When trials reported length of stay in the ICU or in hospital only as median and interquartile ratio (IQR), and when contact with trial authors failed to elicit means and SDs, we did not include these trials in the analysis.
Evaluación de la heterogeneidad
We considered that evidence for significant heterogeneity was present when I² > 30%.
Evaluación de los sesgos de notificación
We sought evidence of publication bias by using the funnel plot method. We used Stata 2015 to prepare a contour‐enhanced funnel plot (Peters 2008). This graphical analysis used the standard error of the log of the RR. We plotted contours illustrating the statistical significance of study effect estimates by using a two‐tailed test.
Síntesis de los datos
We considered methods based on the random‐effects model for all analyses, except when we found no evidence for significant heterogeneity in the results (i.e. I² ≤ 30%). Indeed, we suspected that we would observe heterogeneity across studies, as they were conducted over a wide period of time (almost half a century between first and last trials) and the rationale on which studies were designed varied greatly over time, with marked differences in treatment strategies and in populations between studies conducted before and after the early 1990s.
Análisis de subgrupos e investigación de la heterogeneidad
To identify potential sources of heterogeneity, we sought, a priori, to conduct a subgroup analysis based on 'dose and duration', that is, a long course (≥ 3 days at full dose) of low‐dose (≤ 400 mg/d) hydrocortisone or equivalent. This subgroup analysis allowed evaluation of a strategy based on developments in our understanding of the role of corticosteroids in host response to sepsis, as tested in trials performed after 1992. Older trials used most often a short course (one to four bolus doses within 24 hours) of high‐dose corticosteroids (> 400 mg of hydrocortisone or equivalent), and trials conducted after 1992 used most often low‐dose corticosteroids at full dose over a longer period (≥ 3 days).
We also conducted a subgroup analysis based on the type of corticosteroids, the method of corticosteroid administration, intravenous bolus versus continuous infusion, and termination without versus with tapering off. To further explore the putative interaction between corticosteroid dose and duration and the magnitude of effect, we considered performing a meta‐regression analysis using 28‐day all‐cause mortality as the dependent variable, and dosage and duration of corticosteroids as predictors. We performed meta‐regression analyses using Stata 2015. We also tested, a priori, the interaction between baseline severity of illness and magnitude of effect in a meta‐regression analysis using mortality rates in controls as predictors. Finally, we conducted a subgroup analysis based on targeted population, sepsis, only septic shock, sepsis with ARDS, community‐acquired pneumonia, and sepsis with critical illness‐related corticosteroid insufficiency (Annane 2017a).
-
We assessed the validity of subgroup analyses on the basis of the following criteria.
-
Subgroup comparisons within rather than between studies.
-
Hypothesis preceding the analysis.
-
One of very few hypotheses.
-
Large and consistent differences across studies.
-
External evidence supporting the results (Guyatt 2008b).
-
When subgroup analyses met these criteria and were found to be statistically significant, we applied GRADE criteria to evaluate the certainty of evidence (GRADEpro GDT 2015; Guyatt 2008a).
Análisis de sensibilidad
We conducted sensitivity analyses based on generation of allocation sequence, concealment of allocation, and blinding, and for trials judged at low risk of bias.
'Summary of findings' table and GRADE
For assessment of the overall certainty of evidence for each outcome that included pooled data from RCTs only, we downgraded the evidence from "high certainty" by one level for serious (or by two for very serious) study limitations (according to risk of bias evaluation), indirectness of evidence, serious inconsistency (i.e. when I² > 30%), imprecision of effect estimates (large 95% confidence intervals or small treatment effects), or potential publication bias.
We exported data from Review Manager 5 to GRADEpro GDT 2015 to create 'Summary of findings' tables. We included the following patient‐centred outcomes in the 'Summary of findings' tables.
-
28‐Day all‐cause mortality.
-
In‐hospital all‐cause mortality.
-
Long‐term (longest follow‐up beyond three months) all‐cause mortality.
-
Length of stay in the ICU.
-
Length of hospital stay.
-
Number of participants with superinfection up to longest follow‐up.
-
Number of participants with muscle weakness up to longest follow‐up.
Results
Description of studies
Results of the search
Our search results are detailed in Figure 1.

Study flow diagram.
The search strategy yielded 98 trials that evaluated corticosteroids in sepsis, of which we excluded 28 trials (see Characteristics of excluded studies). Nine trials are still ongoing (see Characteristics of ongoing studies).
Included studies
Since the last update in 2015 (see Published notes), we have included 28 additional trials for a total of 61 trials (n = 12,192 participants); we have described these below (see Characteristics of included studies).
Source of information
In addition to data extracted from these publications, we obtained unpublished information from 28 trials by contacting the primary authors (Appendix 5). We did not contact the authors of 10 trials, mainly because of the absence of contact details (Characteristics of included studies). For the remaining trials, contact with study authors did not lead to the provision of additional information (Characteristics of included studies).
Trial centres
Twenty trials were multi‐centre trials (i.e. > 2 centres) (Characteristics of included studies). Twenty‐four trials were conducted in Europe, 11 in North America, 12 in Asia, five in the Middle East, five in Africa, and one in Latin America, and three multi‐national trials were conducted in North America and Africa (Slusher 1996), in Europe and the Middle East (Sprung 2008), and in Australia, New Zealand, Europe, and the Middle East (Venkatesh 2018) (Characteristics of included studies).
Age of participants
Two trials enrolled both children and adults (CSG 1963; McHardy 1972). Six trials included only children (El‐Nawawy 2017; Menon 2017; Nagy 2013; Slusher 1996; Tagaro 2017; Valoor 2009). All of the remaining trials included only adults.
Description of participants
Eleven trials included both participants with sepsis and individuals with septic shock. Four trials included participants with sepsis without shock (Fernández‐Serrano 2011; Keh 2016; Rinaldi 2006; Sabry 2011). Fifteen trials targeted participants with community‐acquired pneumonia‐related sepsis. Five trials focused on participants with ARDS and sepsis (Liu 2012; Meduri 2007; Rezk 2013; Tongyoo 2016; Zhou 2015). The remaining trials focused on participants with septic shock treated by a vasopressor. Three trials included only participants with septic shock and adrenal insufficiency as defined by a cortisol increment less than 9 µg/dL after a corticotropin bolus (Aboab 2008; Huh 2007; Tandan 2005). In 18 trials, investigators systematically performed a short corticotropin test at baseline.
Control
Comparison of corticosteroids versus placebo or usual care
Nine studies did not use a placebo and compared corticosteroid therapy versus usual care, that is, antibiotics, fluid resuscitation, and vasopressor when needed (El Ghamrawy 2006; Hu 2009; Huang 2014; Li 2016; McHardy 1972; Mirea 2014; Rinaldi 2006; Sui 2013; Zhou 2015). In one study, only one centre used a placebo (Sprung 1984). One trial that compared hydrocortisone versus hydrocortisone plus fludrocortisone did not use a placebo of fludrocortisone for technical reasons (Annane 2010). Another trial compared duration of hydrocortisone treatment (i.e. 3 days vs 7 days) and did not use a placebo (Huh 2007). The remaining trials compared corticosteroid therapy to placebo.
Comparison of continuous infusion versus intermittent intravenous boluses of corticosteroids
Three trials compared continuous infusion versus bolus administration of hydrocortisone (Hyvernat 2016; Loisa 2007; Tilouche 2019). One trial had three parallel arms including continuous infusion of 200 mg hydrocortisone daily for seven days, intravenous bolus of 50 mg hydrocortisone every six hours for seven days, and usual care (Mirea 2014).
Corticosteroid dose and treatment course
Thirty‐seven trials tested the effects of a long‐course (three or more days at full dose) of low‐dose hydrocortisone. In one trial (Huh 2007), investigators compared hydrocortisone 50 mg intravenously every six hours when given for three days versus seven days. One trial had three parallel groups including continuous infusion of 200 mg hydrocortisone per day for seven days, intravenous bolus of 50 mg hydrocortisone every six hours for seven days, and usual care (Mirea 2014). In three trials, investigators compared continuous infusion versus intermittent intravenous boluses of hydrocortisone (Hyvernat 2016; Loisa 2007; Tilouche 2019). Another trial compared seven‐day treatment with hydrocortisone versus seven‐day treatment with the combination of hydrocortisone plus fludrocortisone (Annane 2010). One trial compared a short course (two days at full dose) of low‐dose intravenous hydrocortisone (300 mg on day one and 250 mg on day two) versus placebo (CSG 1963). Another study used a cross‐over design to compare a three‐day course of low‐dose hydrocortisone versus placebo (Keh 2003).
Five trials tested the effects of a long course of low‐dose prednisone or prednisolone (Blum 2015; McHardy 1972; Snijders 2010; Yildiz 2002; Yildiz 2011).
Two trials tested the effects of a long course of low‐dose dexamethasone (Cicarelli 2007; Meijvis 2011). Two trials tested the effects of a short course (two days at full dose) of low‐dose dexamethasone (Slusher 1996; Tagaro 2017).
Eight studies tested the effects of a long course of low‐dose intravenous methylprednisolone (Fernández‐Serrano 2011; Li 2016; Meduri 2007; Nagy 2013; Rezk 2013; Sui 2013; Torres 2015; Zhou 2015).
Five trials tested the effects of a short course of a large dose of methylprednisolone (Bone 1987; Luce 1988; Schumer 1976; Sprung 1984; VASSCSG 1987), and two tested the effects of a large dose of dexamethasone (Schumer 1976; Sprung 1984).
One trial did not report the type of corticosteroids given (Kurungundla 2008).
Outcomes
Overall, data from 52 trials was used to inform 28‐day mortality rates. One trial (Mirea 2014) provided data for both comparison of corticosteroids versus placebo or usual care and comparison of continuous infusion versus bolus administration of corticosteroids. Two trials ( Hyvernat 2016;Tilouche 2019) provided data for the comparison of continuous infusion versus bolus administration of corticosteroids. Fifty trials were used in the comparison of corticosteroids versus placebo or usual care. Of these trials, 29 explicitly reported on 28‐day mortality and contact with the primary author of three additional trials led to recording of 28‐day mortality rates (Meduri 2007; Rinaldi 2006; Sprung 1984). Thus, actual 28‐day mortality rates were computed for 32 trials. For 18 additional trials, 28‐day mortality rates were extrapolated from hospital mortality rates (Aboab 2008, El Ghamrawy 2006,Fernández‐Serrano 2011, Luce 1988, McHardy 1972, Menon 2017,Nafae 2013, Schumer 1976, Slusher 1996, Torres 2015), ICU mortality rates (Hu 2009, Sabry 2011), 14‐day mortality rates (Bone 1987, VASSCSG 1987), and short term mortality rates (Kurungundla 2008, Mirea 2014, Nagy 2013, Rezk 2013).
Sixteen trials explicitly reported ICU mortality rates, and the primary authors of three additional trials reported this outcome (Chawla 1999; Rinaldi 2006; Torres 2015).
Hospital mortality rates were available for 26 trials.
Mortality rates at 90 days and in the long term were reported for seven trials.
Rates of shock reversal at day seven and at day 28 were reported in 16 and 13 trials, respectively.
Ten trials reported the numbers of dysfunctional organs, that is, SOFA scores, at day seven.
Twenty‐one trials reported length of ICU stay, and 22 reported on length of hospital stay.
Excluded studies
We excluded 28 trials (see Characteristics of excluded studies for details).
Ongoing studies
From trial registries, we identified nine additional RCTs of corticosteroids for sepsis (see Characteristics of ongoing studies). These trials are still recruiting patients, and we will follow the status of these trials to include them in a future update of the review whenever data become publicly available.
Studies awaiting classification
We found no studies awaiting classification
Risk of bias in included studies
We reported the detailed methodological quality of individual trials in the 'Risk of bias' tables in Figure 2 and Appendix 6.

Methodological quality summary: review authors' judgements about each methodological quality item for each included study.
We judged 19 trials as being at low risk of bias, that is, we assessed them as having low risk of bias for the five domains (allocation, blinding, incomplete data, selective reporting, and other potential sources of bias).
Allocation
Random sequence generation
In one trial, the method of generation of allocation sequence was based on a card system (Schumer 1976); we judged this trial to be at high risk of selection bias. For 16 trials, the method was unclear. We judged the remaining trials to have low risk of bias.
Allocation concealment
We judged the method used for allocation concealment to be at low risk of bias in all but 10 trials. One trial assigned treatment using unsealed envelopes (Schumer 1976). In another trial, investigators enrolling participants at one of the two participating centres could have foreseen the upcoming assignment, as the local ethical committee refused to accept concealed allocation (Sprung 1984). In 20 trials, study authors did not report the method used for allocation concealment.
Blinding
Blinding of participants and personnel
For 13 trials, we judged the method used for blinding of participants and personnel as having high risk of bias. Twelve trials used open‐label treatments. For one trial (Sprung 1984), the local ethical committee at one of the two centres did not permit double‐blind allocation and administration of treatment. Therefore, blinding was not possible for 40 of the 59 participants included in the trial.
Eleven additional trials did not report the method used to ensure blinding.
For the remaining trials, blinding of participants and personnel was deemed appropriate. We judged these trials to be at low risk of bias for this domain.
Blinding of outcomes assessors
In 12 trials, outcome assessors were not blinded to study treatments. We judged these trials to be at high risk of detection bias.
Twelve trials did not report any information that could be used to judge the risk of detection bias.
For the remaining trials, blinding of outcomes assessors was deemed appropriate. We judged these trials to be at low risk of bias for this domain.
Incomplete outcome data
Twenty‐eight trials explicitly provided the numbers of and reasons for withdrawals or losses to follow‐up.
Nineteen trials explicitly reported the use of intention‐to‐treat analysis (as the primary analysis) and the numbers of, and reasons for, non‐adherence to the protocol. One trial reported only use of intention‐to‐treat analysis (Luce 1988). The remaining trials provided no information about these criteria. However, the number of analysed participants matched the number of randomly assigned participants, except for 16 trials. One trial did not include one of 191 participants in the placebo group in the mortality analysis (Bone 1987). In four trials (Annane 2002; Lv 2017; Sprung 2008; Tongyoo 2016), participants withdrew their consent, and study authors did not include in the analyses one of 300, two of 120, one of 500, and nine of 206 randomly assigned participants, respectively. For two trials, contact with the primary author allowed us to obtain information on participants who were dropped out from the analysis (Oppert 2005; Rinaldi 2006). In the first study, seven randomly assigned participants (five in the corticosteroid group and two in the placebo group) were not analysed (Oppert 2005). Four of these participants (two in the corticosteroid group and two in the placebo group) were discharged alive from the ICU and then were lost to follow‐up. The three remaining participants (in the corticosteroid group) died: two before receiving hydrocortisone, and the last at study day 17. In the second study, 12 of 52 participants dropped out of the study: six in the control group and six in the corticosteroid group (Rinaldi 2006). Nine participants (four in the control group) were excluded, as they developed renal failure. Two control participants died in the ICU at day five and at day seven, respectively. Three of the corticosteroid‐treated participants died, at days 5, 6, and 28, respectively. Three other participants (two in the control group) were excluded, as they developed septic shock. All died at days 3, 5, and 6, respectively.
Two trials gave additional open‐label corticosteroids to some participants (Gordon 2014; Snijders 2010). In the first trial, five (23.3%) participants in the placebo arm were given rescue corticosteroids for treatment of life‐threatening hypotension and were considered as cross‐overs (Gordon 2014). In the second trial, 37 (17.4%) participants did not complete the full course of study treatment as a consequence of premature death of 10 participants, consent withdrawal for five participants, post‐randomization exclusion for eight participants, and additional open‐label corticosteroid treatment for 14 participants (Snijders 2010). In seven trials, from 4% to 20% were withdrawn from the primary analysis for various reasons that were explained in the trial report (Blum 2015; Fernández‐Serrano 2011; Keh 2016; Gordon 2016; Menon 2017; Tilouche 2019; Venkatesh 2018).
Selective reporting
For 34 trials, we could rule out selective reporting bias after contact with authors, full access to trial protocols, or access to individual participant data. We judged these trials to be at low risk of bias for this domain.
Seventeen trials were published before it was mandatory to register trials in an open access repository, and we have had no access to trial protocols. We judged these trials as having unclear risk of selective reporting bias. For the remaining trials, we could not obtain access to protocols, we could not find trials on an open access registry, and our attempts to contact trial authors failed.
Other potential sources of bias
One trial recruited only 500 of the 800 expected participants, mainly as the result of loss of equipoise among investigators (Sprung 2008). Another trial was halted prematurely for futility after enrolment of 75 of 150 foreseen participants (Arabi 2011).
No trials used the Sepsis 3 definition as all were designed before publication of the new definition for sepsis (Singer 2016). Thirty trials provided an explicit definition of sepsis (as defined in the Methods section of this review). Seven trials provided a definition of septic shock without referring to the need for vasopressor agents (Bone 1987; Luce 1988; Rinaldi 2006; Schumer 1976; Slusher 1996; VASSCSG 1987; Yildiz 2002). One study did not explicitly provide the definition used for sepsis (CSG 1963). Eleven trials explicitly defined sepsis due to community‐acquired pneumonia. Two trials randomly assigned participants on the basis of the presence of ARDS, and data provided in these papers confirmed the presence of sepsis (Liu 2012; Rezk 2013). In another trial on early ARDS, contact with the primary author confirmed that explicit definitions of sepsis were used (Meduri 2007).
Effects of interventions
We did not pool the data from one trial that included both children and adults (CSG 1963), one cross‐over trial (Keh 2003), one trial that compared two durations of hydrocortisone treatment (Huh 2007), and one trial that compared hydrocortisone versus the combination of hydrocortisone plus fludrocortisone (Annane 2010).
In this update, we introduced a new comparison (i.e. continuous infusion vs intermittent boluses of steroids).
Corticosteroids versus placebo or usual care
We have summarized the main results in summary of findings Table for the main comparison.
Primary outcome
28‐Day all‐cause mortality
Data for 28‐day mortality were available for 32 trials. In addition, we used data on 14‐day mortality (two trials), hospital mortality (10 trials), or ICU mortality (2 trials), or data on short‐term mortality (four trials). Thus, we computed data from 50 trials that accounted for 11,233 participants. In the treated group, 1388 of 5667 participants died by day 28 compared with 1469 of 5566 participants in the control group. Some heterogeneity was evident in the results (Chi² test = 68.06; P = 0.03; I² = 29%). The risk ratio (RR) of dying at 28 days was 0.91 (95% confidence interval (CI) 0.84 to 0.99; P = 0.04; random‐effects model; Analysis 1.1). We downgraded the certainty of evidence for this outcome from high to moderate for inconsistency (significant heterogeneity across trial results).
Differences in methodological quality across trials may have accounted for observed heterogeneity in the results. A sensitivity analysis based on trials judged as being at low risk of bias showed an RR for dying at 28 days of 0.91 (95% CI 0.84 to 0.98; P = 0.01; 7896 participants; 17 studies; I² = 0%; Analysis 1.2).
Heterogeneity across trials also may have been the result of different therapeutic regimens. Subgroup analyses based on types of corticosteroids did not suggest that this may influence the response to treatment (test for subgroup differences: Chi² = 1.48; df = 3; P = 0.69; I² = 0%; Analysis 1.3). Likewise there was no evidence that dose/duration (test for subgroup differences: Chi² = 0.29; df = 1; P = 0.59; I² = 0%; Analysis 1.4) or mode (continuous vs intermittent bolus) of corticosteroid administration (test for subgroup differences: Chi² = 0.41; df = 1; P = 0.52; I² = 0%; Analysis 1.5) influences the response to treatment. Meta‐regression analyses showed no evidence of interaction between the RR for dying at 28 days and the dose given at day 1 (P = 0.14; Figure 3), total dose (P = 0.12; Figure 4), or duration of treatment (P = 0.86). One trial of a large dose of corticosteroids was a statistical outlier and was excluded from the meta‐regression analysis (Schumer 1976).

Figure represents the results from meta‐regression of log of risk ratio of dying and the dose of corticosteroids given at day 1 and expressed as equivalent milligrams of hydrocortisone. Estimates from each study are represented by circles. Circle sizes depend on the precision of each estimate (the inverse of its within‐study variance), which is the weight given to each study in the fixed‐effect model.
Meta‐regression included 53 trials.
REML estimate of between‐study variance: tau² = .008551.
% residual variation due to heterogeneity: I² res = 28.86%.
Proportion of between‐study variance explained: Adj R² = 43.76%.

Figure represents results from meta‐regression of log of risk ratio of dying and log of cumulated dose of corticosteroids expressed as equivalent milligrams of hydrocortisone. Estimates from each study are represented by circles. Circle sizes depend on the precision of each estimate (the inverse of its within‐study variance), which is the weight given to each study in the fixed‐effect model.
Meta‐regression included 53 trials.
REML estimate of between‐study variance: tau² = .008628.
% residual variation due to heterogeneity: I² res = 28.68%.
Proportion of between‐study variance explained: Adj R² = 43.25%.
By contrast, trials in which corticosteroids were not tapered off found an RR of dying at 28 days of 0.87 (95% CI 0.78 to 0.98; 8770 participants; 30 studies; I² = 42%; random‐effects model) in favour of corticosteroids, whereas trials in which corticosteroids were tapered off found no evidence of mortality differences between groups (RR 1.04, 95% CI 0.92 to 1.18; P = 0.54; 2136 participants; 17 studies; I² = 0%) (test for subgroup differences: Chi² = 3.94; df = 1; P = 0.05; I² = 74.6%; Analysis 1.6).
Heterogeneity across trials may have resulted from factors related to participants. There was no evidence of differences in response to treatment between children and adults (test for subgroup differences: Chi² = 0.29; df = 1; P = 0.62; I² = 0%; Analysis 1.7). Subgroup analysis based on targeted populations showed non‐significant subgroup differences (test for subgroup differences: Chi² = 7.60; df = 3; P = 0.06; I² = 60.5%; Analysis 1.8). In studies of heterogeneous populations of participants with sepsis, the RR for dying at 28 days was 1.17 (95% CI 0.98 to 1.39; P = 0.09; 1358 participants; 10 studies; I² = 25%; fixed‐effect model). In studies of only participants with septic shock, the RR for dying at 28 days was 0.91 (95% CI 0.83 to 1.00; P = 0.06; 7428 participants; 23 studies; I² = 32%; random‐effects model). In studies of participants with sepsis and ARDS, the RR was 0.66 (95% CI 0.46 to 0.94; P = 0.02; 411 participants; 4 studies; I² = 8%; fixed‐effect model), and in studies of participants with sepsis and community‐acquired pneumonia, the RR was 0.69 (95% CI 0.50 to 0.96; P = 0.03; 2038 participants; 13 studies; I² = 0%; fixed‐effect model). Likewise, meta‐regression showed no evidence of interaction between the RR of dying at 28 days and severity of illness as assessed by crude mortality in the control arm (P = 0.29; Figure 5). Subgroup analysis of participants with adrenal insufficiency showed no heterogeneity in the results. Investigators reported 251 deaths among 525 participants in the treated group and 291 deaths among 554 in the placebo group. The RR for dying was 0.92 (95% CI 0.82 to 1.03; P = 0.16; 1079 participants; 12 studies; I² = 0%; fixed‐effect model; Analysis 1.9).
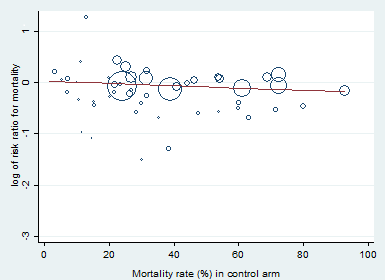
Meta‐regression of the log of the risk ratio for 28‐day mortality against actual mortality at 28 days in the control arm.
Funnel plot analysis, including all trials, suggested some asymmetry (Figure 6). Contour‐enhanced funnel plot analysis including trials of a long course of low‐dose corticosteroids suggested no significant asymmetry (Figure 7).
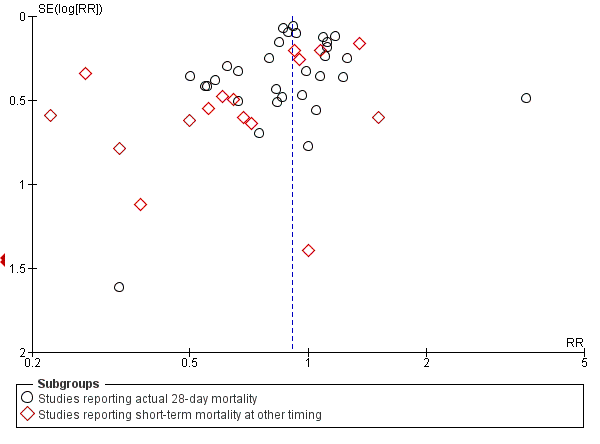
Funnel plot of comparison: 1 Steroids vs control, outcome: 1.1 28‐Day all‐cause mortality.
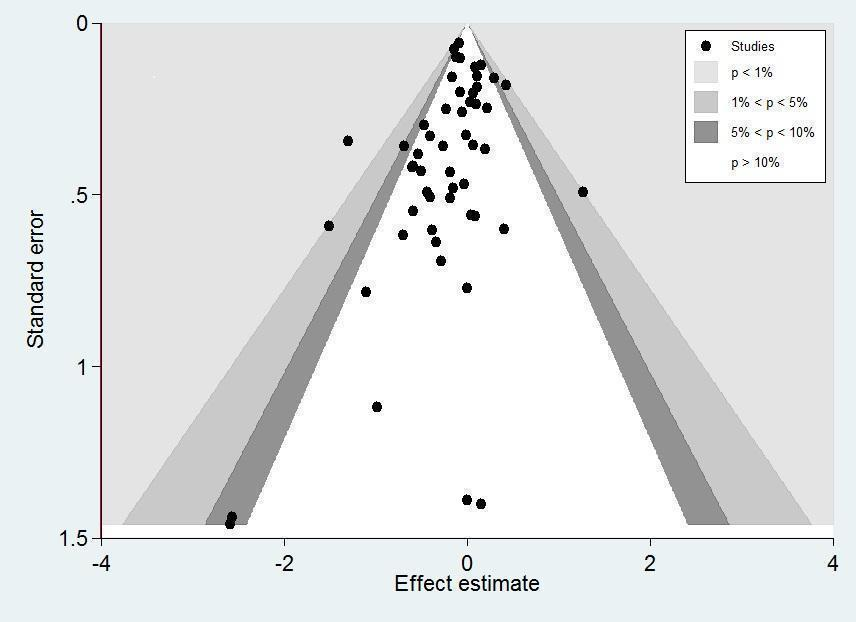
Contour‐enhanced funnel plot.
Log of risk ratio for 28‐day mortality is plotted against its standard error.
In one trial comparing hydrocortisone alone versus hydrocortisone plus fludrocortisone, the hazard ratio of death was 0.94 (95% CI 0.73 to 1.21; Annane 2010).
Secondary outcomes
90‐Day all‐cause mortality
We could extract data on 90‐day mortality from seven trials. A total of 961 of 2975 participants in the treated group and 1026 of 2959 in the control group died within 90 days. The RR of dying within 90 days was 0.93 (95% CI 0.87 to 1.00; P = 0.05; 5934 participants; 7 studies; I² = 0%; fixed‐effect model; Analysis 1.10) in favour of the corticosteroid group. This was based on moderate‐certainty evidence (lowered for imprecision).
Long‐term mortality
We could extract data on mortality beyond three months for seven trials. The RR of dying was 0.97 (95% CI 0.91 to 1.03; P = 0.29; 6236 participants; 7 studies; I² = 28%; Analysis 1.11). We downgraded the certainty of evidence to low owing to inconsistency in results and imprecision.
Intensive care unit (ICU) mortality
Data were available from 18 trials, accounting for 7267 participants. All of these trials investigated a long course of low‐dose corticosteroids. A total of 908 of 3636 participants in the treated group and 1015 of 3631 participants in the control group died in the ICU. There was little heterogeneity in the results (Chi² = 19.18; df = 17; P = 0.32; I² = 11%). The RR for dying in the ICU was 0.89 (95% CI 0.83 to 0.96; fixed ‐effect model; Analysis 1.12). This was based on high‐certainty evidence.
Hospital mortality
We could extract data on hospital mortality from 26 trials that accounted for 8183 participants. A total of 1223 of 4109 participants in the treated group compared with 1315 of 4074 in the control group died in hospital. Heterogeneity in the results was significant (Chi² = 39.58; df = 25; P = 0.03; I² = 37%). The RR for dying in hospital was 0.90 (95% CI 0.82 to 0.99; P = 0.03; random‐effects model; Analysis 1.13). We downgraded the certainty of evidence for this outcome from high to moderate for inconsistency.
Number of participants with shock reversal (as defined by stable haemodynamic status ≥ 24 hours after withdrawal of vasopressor therapy) at day 7
We could extract data from 16 trials that accounted for 6711 participants. A total of 2642 of 3361 participants in the treated group and 2168 of 3350 in the control group had shock reversed at day 7. Significant heterogeneity was evident in the results (Chi² = 43.87; df = 15; P = 0.0001; I² = 66%). The RR for having shock reversed at day 7 was 1.23 (95% CI 1.13 to 1.34; P < 0.0001; random‐effects model) in favour of the corticosteroid group (Analysis 1.14). This was based on moderate‐certainty evidence (lowered for inconsistency).
Sensitivity analysis excluding the two trials that evaluated a short course of high‐dose corticosteroids did not reduce heterogeneity in the results (RR 1.26, 95% CI 1.16 to 1.37; 6408 participants; 16 studies; I² = 59%) (Bone 1987; Sprung 1984).
In one cross‐over trial, hydrocortisone was given for three days at a dose of 240 mg per day (Keh 2003). Although this trial could not provide information on shock reversal at day 7, investigators showed that at day 3, fewer hydrocortisone patients than placebo‐treated patients required norepinephrine treatment (6/20 vs 14/20; P = 0.025).
Number of participants with shock reversal (as defined by stable haemodynamic status ≥ 24 hours after withdrawal of vasopressor therapy) at day 28
We could extract data from 13 trials, accounting for 6753 participants. A total of 2767 of 3382 participants in the treated group had shock reversed at day 28, as did 2629 of 3397 in the placebo group. No heterogeneity was evident in the results (I² = 0%). The RR for having shock reversed was 1.06 (95% CI 1.03 to 1.08; P < 0.00001) in favour of the corticosteroid group (Analysis 1.15). This was based on high‐certainty evidence.
Number of organs affected and severity of organ dysfunction at day 7, as measured by the sequential organ failure assessment (SOFA) score
Ten studies (2157 participants) reported the SOFA score at seven days post randomization. The mean difference (MD) in the SOFA score at day 7 was ‐1.37 (95% CI ‐1.84 to ‐0.90; P < 0.00001; random‐effects model) in favour of corticosteroids. Moderate heterogeneity across studies was noted (Chi² = 17.03; df = 9; P = 0.05; I² = 47%; Analysis 1.16). This was based on moderate‐certainty evidence (lowered for inconsistency).
In one study (Briegel 1999), corticosteroid treatment was associated with a non‐significant (P = 0.18) trend toward earlier resolution of organ dysfunction.
Length of stay in the intensive care unit
For all participants
In 21 trials (7612 participants), the MD for ICU length of stay for all participants was ‐1.07 days (95% CI ‐1.95 to ‐0.19; P = 0.02; random‐effects model) in favour of the corticosteroid group, with some heterogeneity evident across studies (Chi² = 31.49; df = 20; P = 0.05; I² = 36%; Analysis 1.17). We judged the certainty of evidence for this outcome as high. There was some heterogeneity in the results. However, the treatment effect was large.
For survivors only
We could extract data from 10 trials on 778 ICU survivors. The MD for ICU length of stay among these survivors was ‐2.19 days (95% CI ‐3.93 to ‐0.46; P = 0.01; fixed‐effect model). No heterogeneity was evident across studies (Chi² test = 8.63; P= 0.47; I² = 0%; Analysis 1.18).
Length of hospital stay
For all participants
From 22 trials (8795 participants), we could extract data on all participants. We noted heterogeneity in the results (heterogeneity: Chi² = 51.44; df = 201; P = 0.0002; I² = 59%). The MD for length of hospital stay for all participants was ‐1.63 days (95% CI ‐2.93 to ‐0.33 ; P = 0.01; random‐effects model; Analysis 1.19). We judged the certainty of evidence for this outcome as high. There was some heterogeneity in the results. However, the treatment effect was large.
For survivors only
We could extract data for hospital survivors from nine studies (710 participants). We noted some heterogeneity in the results (I² = 43%). No evidence suggested a difference between the two groups (MD ‐4.11 days, 95% CI ‐8.50 to 0.28; P = 0.07; random‐effects model; Analysis 1.20).
Adverse events
Gastroduodenal bleeding
We could extract data from 25 trials (5171 participants). A total of 131 of 2607 participants in the treated group and 120 of 2564 in the control group had an episode of gastroduodenal bleeding. We noted no heterogeneity in the results (I² = 0%). The RR for having gastroduodenal bleeding was 1.07 (95% CI 0.85 to 1.35; P = 0.55; fixed‐effect model; Analysis 1.21). We judged this to be based on moderate‐certainty evidence (lowered due to imprecision).
Superinfection
We could extract data from 25 trials (5356 participants). A total of 487 of 2695 participants in the treated group and 451 of 2661 participants in the control group had an episode of nosocomial infection. We noted no heterogeneity in the results (Chi² = 20.66; df = 21; P = 0.48; I² = 0%). The RR for superinfection was 1.06 (95% CI 0.95 to 1.19; P = 0.27; fixed‐effect model; Analysis 1.21). We judged the certainty of evidence as moderate for this outcome (lowered for imprecision).
Hyperglycaemia
The number of participants who presented with hyperglycaemia was reported for 20 trials (8594 participants). There was heterogeneity in the results (Chi² = 35.96; df = 17; P = 0.005; I² = 53%). The RR for hyperglycaemia was 1.20 (95% CI 1.10 to 1.31; P < 0.00001; random‐effects model; Analysis 1.21). This was based on moderate‐certainty evidence (lowered for inconsistency).
One trial comparing tight glucose control versus standard care found no benefit in normalizing blood glucose levels among corticosteroid‐treated septic shock participants (Annane 2010).
Hypernatraemia
The number of participants who presented with hypernatraemia was reported for six trials (5069 participants). We noted no heterogeneity in the results (Chi² = 4.45; df = 5; P = 0.49; I² = 0%). The RR for hypernatraemia was 1.66 (95% CI 1.34 to 2.06; P < 0.00001; fixed‐effect model; Analysis 1.21). This was based on high‐certainty evidence.
Muscle weakness
The number of participants who presented with muscle weakness was reported for six trials (6145 participants). There was little to no heterogeneity in the results (Chi² = 5.42; df = 5; P = 0.37; I² = 8%). The RR for muscle weakness was 1.21 (95% CI 1.01 to 1.44; P = 0.04; fixed‐effect model; Analysis 1.21) in favour of the control group. We judged the certainty of evidence as high for this outcome.
Neuropsychiatric events
The number of participants who presented with neuropsychiatric events was reported for eight trials (6941 participants). There was some heterogeneity in the results (Chi² = 9.93; df = 7; P = 0.19; I² = 30%). The RR for neuropsychiatric events was 1.15 (95% CI 0.52 to 2.57; P = 0.73; random‐effects model; Analysis 1.21). This was based on low‐certainty evidence (lowered for imprecision and inconsistency).
Stroke
The number of participants who presented with stroke was reported for four trials (2842 participants). There was no heterogeneity in the results (Chi² = 1.66; df = 3; P = 0.64; I² = 0%). The RR for stroke was 0.83 (95% CI 0.41 to 1.68; P = 0.73; fixed‐effect model; Analysis 1.21). This was based on moderate‐certainty evidence (lowered for imprecision).
Cardiac events
The number of participants who presented with cardiac events was reported for six trials (3567 participants). There was no heterogeneity in the results (Chi² = 3.51; df = 5; P = 0.62; I² = 0%). The RR for acute coronary events was 1.12 (95% CI 0.66 to 1.88; P = 0.68; fixed‐effect model; Analysis 1.21). This was based on moderate‐certainty evidence (lowered for imprecision).
Continuous infusion versus intermittent bolus of corticosteroids
We have summarized the main results in Table 1.
| Continuous infusion compared to bolus administration of corticosteroids for children and adults with sepsis | ||||||
| Patient or population: children and adults with sepsis | ||||||
| Outcomes | Anticipated absolute effects* (95% CI) | Relative effect | № of participants | Certainty of the evidence | Comments | |
| Risk with bolus administration of corticosteroids | Risk with continuous infusion | |||||
| 28‐Day all‐cause mortality | Study population | RR 1.03 | 310 | ⊕⊝⊝⊝ | Evidence is very uncertain about the effect of continuous infusion on 28‐day all‐cause mortality | |
| 444 per 1000 | 457 per 1000 | |||||
| Long‐term mortalityc | Study population | RR 1.36 | 70 | ⊕⊝⊝⊝ | Evidence is very uncertain about the effect of continuous infusion on long‐term mortality | |
| 636 per 1000 | 865 per 1000 | |||||
| Hospital mortality | Study population | RR 0.95 | 240 | ⊕⊝⊝⊝ | Evidence is very uncertain about the effect of continuous infusion on hospital mortality | |
| 458 per 1000 | 435 per 1000 | |||||
| Length of intensive care unit stay for all participants in days | Mean length of intensive care unit stay for all participants was 13 days | MD 1.05 lower | ‐ | 310 | ⊕⊝⊝⊝ | Evidence is very uncertain about the effect of continuous infusion on length of intensive care unit stay for all participants |
| Length of hospital stay for all participants in days | Mean length of hospital stay for all participants was 17 days | MD 0.01 higher | ‐ | 310 | ⊕⊝⊝⊝ | Evidence is very uncertain about the effect of continuous infusion on length of hospital stay for all participants |
| Number of participants with adverse events ‐ superinfection (up to longest follow‐up) | Study population | RR 1.12 | 193 | ⊕⊝⊝⊝ | Evidence is very uncertain about the effect of continuous infusion on number of participants with adverse events ‐ superinfection | |
| 204 per 1000 | 229 per 1000 | |||||
| Number of participants with adverse events ‐ muscle weakness (up to longest follow‐up) | Study population | RR 0.89 | 70 | ⊕⊕⊝⊝ | Evidence suggests that continuous infusion may result in little to no difference in the number of participants with adverse events ‐ muscle weakness | |
| 61 per 1000 | 54 per 1000 | |||||
| *The risk in the intervention group (and its 95% confidence interval) is based on the assumed risk in the comparison group and the relative effect of the intervention (and its 95% CI). The unit of measure for length of stay is days. | ||||||
| GRADE Working Group grades of evidence. | ||||||
aDowngraded one level as only one of the four trials was judged as having low risk of bias.
bDowngraded one level as trials were small and the 95% confidence interval was large.
dDowngraded one level as the only trial reporting this outcome was open‐labelled and at high risk of performance bias.
eDowngraded one level as only one trial reported this outcome.
fDowngraded one level as the observed increase in risk of dying in the long term is not consistent with treatment effects on 28‐day mortality.
gDowngraded one level as results show some heterogeneity.
hDowngraded two levels as heterogeneity in the results is strong.
cLong‐term mortality was assessed up to six months.
Primary outcome
28‐Day all‐cause mortality
Data for 28‐day mortality were available for three trials accounting for 310 participants. There was no heterogeneity in the results (Chi² = 1.94; df = 2; P = 0.38; I² = 0%). A total of 73 of 159 participants in the continuous infusion group and 67 of 151 participants in the intermittent bolus group died at 28 days. The RR of dying at 28 days was 1.03 (95% CI 0.81 to 1.31; P = 0.82; fixed‐effect model; Analysis 2.1) in favour of the intermittent bolus group. We downgraded the certainty of evidence to very low due to high risk of bias in all except one trial and due to imprecision.
Secondary outcomes
90‐Day all‐cause mortality
Data for 90‐day mortality were available for only one trial (Hyvernat 2016). This trial provided no evidence of a difference between groups for 90‐day all‐cause mortality (RR 0.87, 95% CI 0.61 to 1.22; Analysis 2.2). We judged this to be very low‐certainty evidence (with very high risk of bias and imprecision).
Long‐term mortality
In one trial that reported mortality at one year, the RR of dying was 1.36 (95% CI 1.02 to 1.81; 70 participants; Analysis 2.3) (Tilouche 2019). We downgraded the certainty of evidence to very low owing to the fact that data were available from only one small trial that was at high risk of performance and detection bias.
Intensive care unit mortality
We could extract data from four trials. We found no evidence of a difference between the two groups (RR 1.02, 95% CI 0.80 to 1.29; 358 participants; I² = 0%; fixed‐effect model; Analysis 2.4). This was based on very low‐certainty evidence (with very high risk of bias and imprecision).
In‐hospital mortality
We could extract data from two trials. We found no evidence of a difference between the two groups (RR 0.95, 95% CI 0.72 to 1.25; P = 0.70; 240 participants; 4 studies; I² = 0%; fixed‐effect model; Analysis 2.5). We downgraded the certainty of evidence to very low owing to imprecision and risk of bias in one study.
Number of participants with shock reversal (as defined by stable haemodynamic status ≥ 24 hours after withdrawal of vasopressor therapy) at day 7
We could extract data about shock reversal from four trials (358 participants). The results showed heterogeneity (Chi² = 10.09; df = 3; P = 0.02; I² = 70%). A total of 104 of 183 participants in the continuous infusion group and 118 of 175 participants in the intermittent bolus group had shock reversal. The RR of shock reversal was 0.80 (95% CI 0.59 to 1.10; P = 0.17; random‐effects model; Analysis 2.6). This was based on very low‐certainty evidence (due to risk of bias, imprecision, and inconsistency).
Number of participants with shock reversal (as defined by stable haemodynamic status ≥ 24 hours after withdrawal of vasopressor therapy) at 28 days
Data were available from one trial (Tilouche 2019). The RR of having shock reversed by 28 days was 0.78 (95% CI 0.45 to 1.34; 70 participants; Analysis 2.7). This was based on very low‐certainty evidence (due to risk of bias and very severe imprecision).
Number of organs affected and severity of organ dysfunction at day 7, as measured by the sequential organ failure assessment (SOFA) score
The SOFA score at day 7 was available for three trials. The mean difference between groups for the SOFA score was 1.00 (95% CI ‐0.25 to 2.26; 260 participants; I² = 7%; fixed‐effect model; Analysis 2.8). This was based on very low‐certainty evidence (due to risk of bias and very severe imprecision).
Length of stay in the intensive care unit
For all participants
We could extract data about length of stay in the ICU for three trials. We found no evidence of a difference between groups (MD ‐1.05 days, 95% CI ‐4.54 to 2.45; P = .56; 310 participants; I² = 67%; random‐effects model; Analysis 2.9). We downgraded the certainty of evidence to very low owing to inconsistency, imprecision, and high risk of bias in two studies.
For survivors only
No trial provided data for length of ICU stay among survivors only.
Length of stay in the hospital
For all participants
We could extract data about length of stay in the hospital from three trials. We found no evidence of a difference between groups (MD 0.01 days, 95% CI ‐5.05 to 5.07; P = 1.00; 310 participants; I² = 70%; random‐effects model; Analysis 2.10). We downgraded the certainty of evidence to very low owing to inconsistency, imprecision, and high risk of bias in two studies.
For survivors only
No trial provided data for length of hospital stay among survivors only.
Adverse events
Gastroduodenal bleeding
Data from two trials suggest no evidence of a difference between groups in the risk of gastroduodenal bleeding (RR 0.79, 95% CI 0.10 to 6.37; P = 0.83; 193 participants; I² = 67%; random‐effects model; Analysis 2.11). This was based on very low‐certainty evidence (due to risk of bias, inconsistency, and very severe imprecision).
Superinfection
Data from two trials suggest no evidence of a difference between groups in the risk of superinfection (RR 1.12, 95% CI 0.37 to 3.33; P = 0.84; 193 participants; I² = 74%; random‐effects model; Analysis 2.11). We downgraded the certainty of evidence to very low owing to inconsistency, imprecision, and high risk of bias in one of the studies.
Hyperglycaemia
Data from three trials suggest no evidence of a difference between groups in the number of patients with at least one episode of hyperglycaemia (RR 0.89, 95% CI 0.47 to 1.71; P = 0.74; 310 participants; I² = 80%; random‐effects model; Analysis 2.11). This was based on very low‐certainty evidence (due to risk of bias, inconsistency, and imprecision).
Two trials reported mean blood glucose levels. One trial found slightly lower mean blood glucose levels in the continuous infusion group when compared to the intermittent boluses group (6.4 ± 0.7 mmol/L vs 6.2 ± 0.7; P = 0.04) (Loisa 2007). Another trial found no statistically significant difference between these groups (9.± 2.5 mmol/L vs 8.5 ± 6.0; P = 0.55) (Hyvernat 2016). In addition, three trials found that managing hyperglycaemia required higher doses of insulin in continuous infusion versus bolus administration. The MDs for insulin dose were 12.92 (95% CI ‐15.43 to 41.27) (Hyvernat 2016), ‐5.00 (95% CI ‐28.50 to 18.50) (Loisa 2007), and 7.57 (95% CI 4.07 to 11.07) (Tilouche 2019).
Hypernatremia
Data from two trials suggest no evidence of a difference between groups (RR 0.74, 95% CI 0.34 to 1.61; P = 0.45; 187 participants; I² = 47%; random‐effects model; Analysis 2.11). This was based on very low‐certainty evidence (due to risk of bias, inconsistency, and imprecision).
Muscle weakness
Only one trial reported data about muscle weakness (Tilouche 2019). This trial provided no evidence of a difference in this outcome between groups (RR 0.89, 95% CI 0.13 to 5.98). We downgraded the certainty of evidence to very low as this outcome was available from only one trial that was at high risk of performance and detection bias.
Neuropsychiatric events
Only one trial reported data about neuropsychiatric events (Tilouche 2019). This trial provided no evidence of a difference in this outcome between groups (RR 1.56, 95% CI 0.50 to 4.86). This was based on very low‐certainty evidence (due to risk of bias, inconsistency, and very severe imprecision).
Stroke
One trial reported that this outcome did not occur during patient follow‐up (Tilouche 2019). The other trials did not report information about this outcome.
Cardiac events
One trial reported that this outcome did not occur during patient follow‐up (Analysis 2.11) (Tilouche 2019). The other trials did not report information about this outcome.
Discusión
Resumen de los resultados principales
Efectos de los corticosteroides sobre la mortalidad
En general, esta revisión indica que en la sepsis los corticosteroides reducen la mortalidad por todas las causas a los 28 y 90 días, así como la mortalidad en la unidad de cuidados intensivos (UCI) y al alta hospitalaria. Para estos hallazgos, los resultados muestran cierta heterogeneidad.
El análisis de sensibilidad basado en ensayos considerados en riesgo bajo de sesgo encontró una reducción significativa de la mortalidad por todas las causas a los 28 días con los corticosteroides.
El análisis de subgrupos basado en el fármaco de estudio específico utilizado no encontró diferencias significativas en los subgrupos, aunque los efectos del tratamiento sobre la mortalidad a los 28 días podrían ser mayores con la combinación de hidrocortisona y fludrocortisona. Solo un ensayo comparó directamente hidrocortisona sola con hidrocortisona y fludrocortisona y encontró una reducción absoluta estadísticamente no significativa del 3% en la mortalidad hospitalaria a favor de la combinación (Annane 2010). Los análisis de metarregresión y de subgrupos basados en las modalidades de tratamiento muestran que la dosis y la duración no influyeron en la respuesta a los corticosteroides. Sin embargo, la mayoría de los ensayos publicados en las últimas dos décadas proporcionaron un ciclo largo (> 72 horas a una dosis completa) de corticosteroides en dosis bajas (< 400 mg por día de equivalente de hidrocortisona). Los investigadores no proporcionaron evidencia de diferencias entre subgrupos basado en la infusión continua versus la administración en bolo intermitente de corticosteroides. Asimismo, los ensayos que compararon directamente la infusión continua versus bolo intermitente de corticosteroides no informaron evidencia de una diferencia entre los grupos en la mortalidad a los 28 días, a los 90 días, a largo plazo, y en la UCI y al alta hospitalaria. El análisis de subgrupos basado en las modalidades para interrumpir los corticosteroides indica que el efecto beneficioso para la supervivencia de los corticosteroides fue mayor sin ajuste de la dosis versus con ajuste.
Los análisis de subgrupos basados en factores relacionados con los participantes indican que la edad (niños versus adultos) no influyó en la respuesta de los pacientes a los corticosteroides. Los pacientes con shock séptico, con síndrome de dificultad respiratoria aguda (SDRA) y con neumonía adquirida en la comunidad tienen más probabilidades de obtener un beneficio para la supervivencia de los corticosteroides que los pacientes con sepsis menos grave, aunque las diferencias de subgrupos fueron apenas estadísticamente significativas. El análisis de los ensayos que incluyeron a pacientes con insuficiencia de corticosteroides relacionada con la enfermedad grave (CIRCI, por sus siglas en inglés) no indicó una reducción significativa en el riesgo de muerte a los 28 días. Sin embargo, los estudios no utilizaron la misma definición de insuficiencia suprarrenal. Se necesitan estudios adicionales para determinar la mejor herramienta de diagnóstico para la CIRCI (Annane 2017b).
Efectos de los corticosteroides sobre los resultados de morbilidad
Los efectos beneficiosos de los corticosteroides sobre la mortalidad pueden estar relacionados con los efectos favorables del tratamiento sobre la duración del shock. De hecho, esta revisión demuestra que el tratamiento con corticosteroides dio lugar a una disminución significativa en la duración del shock, y menos pacientes continuaron recibiendo tratamiento vasopresor a los siete días y a los 28 días. El tratamiento con corticosteroides puede atenuar la gravedad de la inflamación (Confalonieri 2005; Keh 2003; Mikami 2007; Oppert 2005; Rinaldi 2006), así como la intensidad y la duración de la insuficiencia del sistema orgánico (Briegel 1999; Confalonieri 2005; Keh 2003; Oppert 2005; Sprung 2008), como se observa en esta revisión, con una marcada disminución de la puntuación de la evaluación de la insuficiencia orgánica secuencial (SOFA) al día 7. Además, debido a los efectos favorables sobre las funciones cardiovasculares y de otros órganos, el tratamiento con corticosteroides dio lugar a un acortamiento significativo en la duración de la estancia hospitalaria y en la UCI.
Estos efectos favorables de los corticosteroides sobre la morbilidad relacionada con la sepsis no se vieron influidos por las modalidades de administración del tratamiento, como se encontró en los ensayos que compararon directamente la infusión continua versus intermitentes en bolo de corticosteroides.
Tolerabilidad de los corticosteroides
Finalmente, esta revisión tampoco encontró evidencia de un efecto de los corticosteroides sobre las tasas de hemorragia gastroduodenal o sobreinfección, ni sobre la proporción de pacientes con eventos neuropsiquiátricos, accidente cerebrovascular o eventos cardíacos. Los corticosteroides se asociaron con un mayor riesgo de desarrollar hiperglucemia e hipernatremia, así como de desarrollar debilidad muscular adquirida.
La evidencia de cuatro ensayos que compararon la infusión continua versus bolo intermitente de corticosteroides no muestra diferencias significativas en las tasas de hiperglucemia, los niveles medios de glucemia o la necesidad de dosis mayores de insulina cuando los corticosteroides se administraron como una infusión continua. Un ensayo con 509 pacientes con shock séptico tratados con corticosteroides no informó efectos beneficiosos sobre la normalización de los niveles de glucosa en sangre (Annane 2010). Las tasas de cualquier otro evento adverso grave no fueron significativamente diferentes entre la infusión continua y la administración de un bolo intermitente de corticosteroides.
Compleción y aplicabilidad general de las pruebas
Se identificaron 61 ensayos que consideraron la comparación de corticosteroides versus control para la sepsis. Estos ensayos representaron a una población grande (es decir 12 192 participantes). La mayoría de los ensayos elegibles contribuyeron al resultado primario para esta revisión. Además, cuatro ensayos proporcionaron información sobre la comparación directa de la infusión continua versus administración intermitente en bolo de corticosteroides. No se halló evidencia de sesgo de publicación.
Debido al gran número de ensayos y al gran tamaño de algunos ensayos individuales, fue posible investigar todos los resultados previstos. Se encontró heterogeneidad leve en los hallazgos para el resultado primario, que se exploró mediante análisis de sensibilidad, análisis de subgrupos y análisis de metarregresión. Aunque los análisis de subgrupos representan una hipótesis entre estudios, no dentro de los estudios, se consideró que la validez era aceptable según los criterios propuestos (Guyatt 2008b). En primer lugar, se definió a priori la hipótesis de una interacción entre las modalidades prácticas de administración y los efectos de los corticosteroides sobre la mortalidad. En segundo lugar, se realizaron análisis de subgrupos basados solo en dos factores (es decir, las modalidades de administración de los fármacos y la población). Tercero, los hallazgos muestran que el efecto del tratamiento fue consistente en términos de mortalidad a los 28 días, en la UCI, hospitalaria, a los 90 días y a largo plazo (riesgos relativos [RR] 0,91; 0,89; 0,90; 0,93 y 0,97; respectivamente). Cuarto, hay evidencia externa sólida que apoya estos resultados. Los estudios experimentales y realizados en seres humanos demostraron que una dosis de 400 mg o menos de hidrocortisona o equivalente puede revertir la respuesta inflamatoria sistémica, la activación endotelial y los trastornos de la coagulación secundarios a la infección (Annane 2005; Heming 2018), por lo que argumentan en contra de la administración de dosis mayores. Además, con estas dosis bajas, los corticosteroides demostraron que mejoran, en lugar de suprimir, la inmunidad innata en los pacientes con shock séptico (Kaufman 2008). Actualmente se ha comprobado que la sepsis provoca un estado proinflamatorio sostenido, que sirve de argumento en contra de un ciclo corto de tratamiento (Angus 2013; Kellum 2007; van der Poll 2017).
Los autores de la revisión observaron cierta variación en el uso sistemático de corticosteroides para la sepsis. Una encuesta de 542 médicos de launidad de cuidados críticos de los EE.UU. encontró que el 83% no usa corticosteroides de manera sistemática en adultos con sepsis, en contraste con el 81% que informó sobre el uso frecuente de corticosteroides para el shock séptico (Bruno 2012). Los hallazgos de esta revisión indican que los efectos del tratamiento sobre la mortalidad pueden ser mayores en la sepsis con shock versus sin shock. Aproximadamente uno de cada tres encuestados cree que los corticosteroides reducen la mortalidad en el shock séptico, mientras que el 27% no, y el 45% no está seguro. La hidrocortisona fue el corticosteroide prescrito con mayor frecuencia (93%), con una dosis mediana de 200 mg/día y administrado mediante una inyección intravenosa intermitente.
Calidad de la evidencia
La certeza de la evidencia pera la mortalidad a los 28 días se consideró moderada en lugar de alta debido a cierta inconsistencia entre los ensayos, relacionada en parte con las diferencias en las poblaciones de estudio y con las diferencias en los tipos de corticosteroides utilizados, así como en las formas en que se administraron los corticosteroides.
Sesgos potenciales en el proceso de revisión
Para esta revisión se realizó una búsqueda exhaustiva en la bibliografía, sin restricción de idioma, por lo que se puede suponer que el riesgo de omitir ensayos importantes fue muy limitado. Una ligera asimetría en el gráfico en embudo para el resultado primario de esta revisión puede indicar sesgo de publicación. Sin embargo, las posibles fuentes de un gráfico en embudo asimétrico también incluyen sesgos de selección, calidad metodológica deficiente de los estudios más pequeños, heterogeneidad verdadera, artificios y el azar (Egger 1997). La inspección visual del gráfico en embudo indica un efecto de estudio pequeño (es decir, entre los estudios pequeños, es más probable que se publiquen los positivos). No obstante, la estrategia de búsqueda minuciosa y la necesidad de inscribir los estudios en los registros públicos de ensayos clínicos pueden haber reducido el riesgo de omisión de algún ensayo controlado aleatorizado. Una verdadera heterogeneidad parece ser una explicación más verosímil para el gráfico en embudo asimétrico observado. De hecho, los efectos de los corticosteroides sobre la mortalidad pueden ser proporcionales al riesgo basal de muerte, y los dos ensayos grandes que no encontraron efectos beneficiosos para la supervivencia (Sprung 2008, Venkatesh 2018) incluyeron a pacientes con un riesgo menor de muerte de lo que se observó en los dos ensayos grandes que encontraron un efecto beneficioso en la supervivencia (Annane 2002 y Annane 2018). Finalmente, es posible que el gráfico en embudo asimétrico se haya debido al azar.
Un ensayo presentó un diseño cruzado (cross‐over) (Keh 2003) y no fue posible obtener los resultados previstos para esta revisión. Este ensayo estableció la conclusión de que un tratamiento prolongado con una dosis baja de hidrocortisona mejoró los resultados hemodinámicos e inmunitarios. Otro ensayo comparó tres días versus siete días de tratamiento con hidrocortisona y no indicó evidencia de diferencias en los resultados entre los pacientes tratados por tres días o siete días (Huh 2007). Sin embargo, este ensayo tuvo algunas limitaciones que incluyen la falta de cegamiento y el tamaño de la muestra pequeño. Se consideró aceptable el agrupamiento de los resultados de los ensayos restantes en un metanálisis.
Tres ensayos se publicaron solo como resumen (Chawla 1999; Mirea 2014; Tandan 2005). Sin embargo, los investigadores principales de estos estudios proporcionaron suficientes datos no publicados a los autores de la revisión para calcular el resultado primario y varios resultados secundarios de esta revisión, lo que permitió incluir estos ensayos en el metanálisis. Se dispuso de datos publicados y no publicados para 28 ensayos (Apéndice 5), y el autor principal de cada ensayo validó el formulario de extracción de datos. Para cuatro estudios, el contacto con el investigador primario no produjo datos adicionales (Luce 1988; Meijvis 2011; Rezk 2013; Snijders 2010).
Se decidió convertir las medidas de resultado que corresponden a los datos censurados en variables dicotómicas; es decir, la proporción de participantes con un evento en particular después de una y de cuatro semanas, o en el momento del alta de la UCI o del hospital.
Acuerdos y desacuerdos con otros estudios o revisiones
Los hallazgos de esta revisión de que un ciclo corto de dosis altas de corticosteroides no proporciona efectos beneficiosos para los pacientes con sepsis concuerdan con los informes de las revisiones sistemáticas anteriores (Cronin 1995; Lefering 1995), así como con las guías internacionales actuales (Annane 2017b; Rhodes 2017).
Se encontraron datos escasos que no permitieron establecer conclusiones sobre los efectos de los corticosteroides en los niños con sepsis, de acuerdo con una revisión sistemática reciente (Menon 2013). Sin embargo, no se encontró evidencia de una diferencia en la respuesta a los corticosteroides entre los niños y los adultos.
Los efectos beneficiosos de los corticosteroides sobre la reversión del shock en pacientes con shock séptico son consistentes en las revisiones sistemáticas recientes (Allen 2018; Fang 2018; Kalil 2011; Moran 2010; Ni 2018; Rochwerg 2018; Rygard 2018; Sherwin 2012). Algunos autores anteriores indicaron un efecto beneficioso para la supervivencia derivado de los corticosteroides para los pacientes con sepsis (Allen 2018; Fang 2018; Moran 2010; Ni 2018; Rochwerg 2018), but not by others (Table 2) (Kalil 2011; Rygard 2018; Sherwin 2012). No obstante, esta revisión sistemática incluyó ensayos que no se habían incluido en las revisiones sistemáticas anteriores, debido a que se publicaron solo recientemente o se publicaron en otro idioma diferente del inglés. Las revisiones actuales incluyeron información no publicada de un gran número de ensayos, después de establecer contacto con los autores de los estudios originales, lo que dio lugar a la inclusión de datos cualitativa y cuantitativamente mejores que los proporcionados anteriormente.
Un metanálisis en red reciente indica que la hidrocortisona tuvo mayores probabilidades que la metilprednisolona de lograr la reversión del shock (Gibbison 2017).
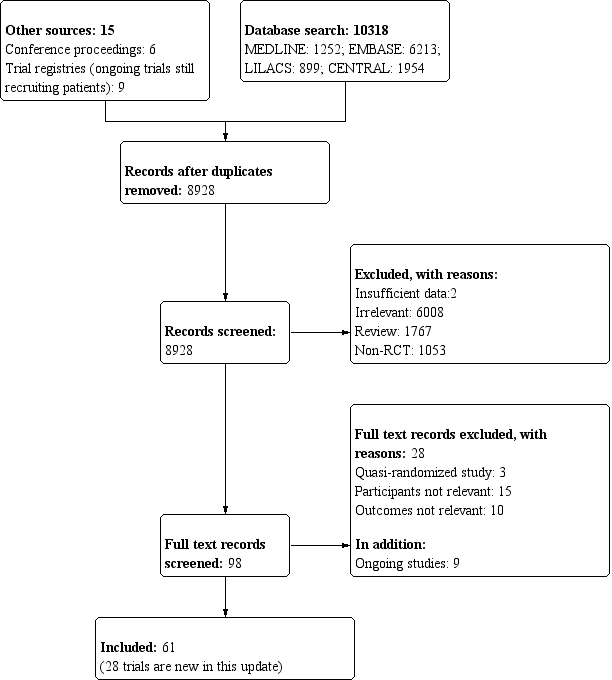
Study flow diagram.

Methodological quality summary: review authors' judgements about each methodological quality item for each included study.
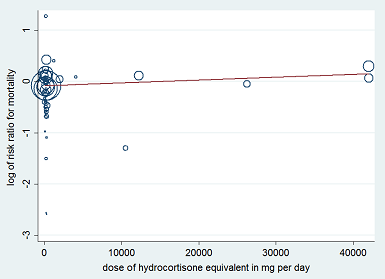
Figure represents the results from meta‐regression of log of risk ratio of dying and the dose of corticosteroids given at day 1 and expressed as equivalent milligrams of hydrocortisone. Estimates from each study are represented by circles. Circle sizes depend on the precision of each estimate (the inverse of its within‐study variance), which is the weight given to each study in the fixed‐effect model.
Meta‐regression included 53 trials.
REML estimate of between‐study variance: tau² = .008551.
% residual variation due to heterogeneity: I² res = 28.86%.
Proportion of between‐study variance explained: Adj R² = 43.76%.
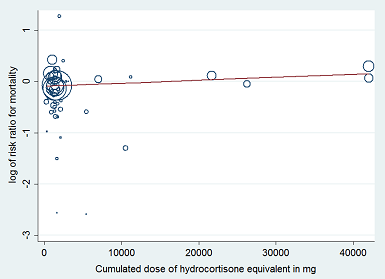
Figure represents results from meta‐regression of log of risk ratio of dying and log of cumulated dose of corticosteroids expressed as equivalent milligrams of hydrocortisone. Estimates from each study are represented by circles. Circle sizes depend on the precision of each estimate (the inverse of its within‐study variance), which is the weight given to each study in the fixed‐effect model.
Meta‐regression included 53 trials.
REML estimate of between‐study variance: tau² = .008628.
% residual variation due to heterogeneity: I² res = 28.68%.
Proportion of between‐study variance explained: Adj R² = 43.25%.

Meta‐regression of the log of the risk ratio for 28‐day mortality against actual mortality at 28 days in the control arm.

Funnel plot of comparison: 1 Steroids vs control, outcome: 1.1 28‐Day all‐cause mortality.

Contour‐enhanced funnel plot.
Log of risk ratio for 28‐day mortality is plotted against its standard error.

Comparison 1 Corticosteroids versus placebo or usual care, Outcome 1 28‐Day all‐cause mortality.

Comparison 1 Corticosteroids versus placebo or usual care, Outcome 2 28‐Day all‐cause mortality ‐ sensitivity analysis based on methodological quality.

Comparison 1 Corticosteroids versus placebo or usual care, Outcome 3 28‐Day all‐cause mortality by subgroups based on study drug.

Comparison 1 Corticosteroids versus placebo or usual care, Outcome 4 28‐Day all‐cause mortality by subgroups based on treatment dose/duration.

Comparison 1 Corticosteroids versus placebo or usual care, Outcome 5 28‐Day all‐cause mortality based on mode of drug administration.
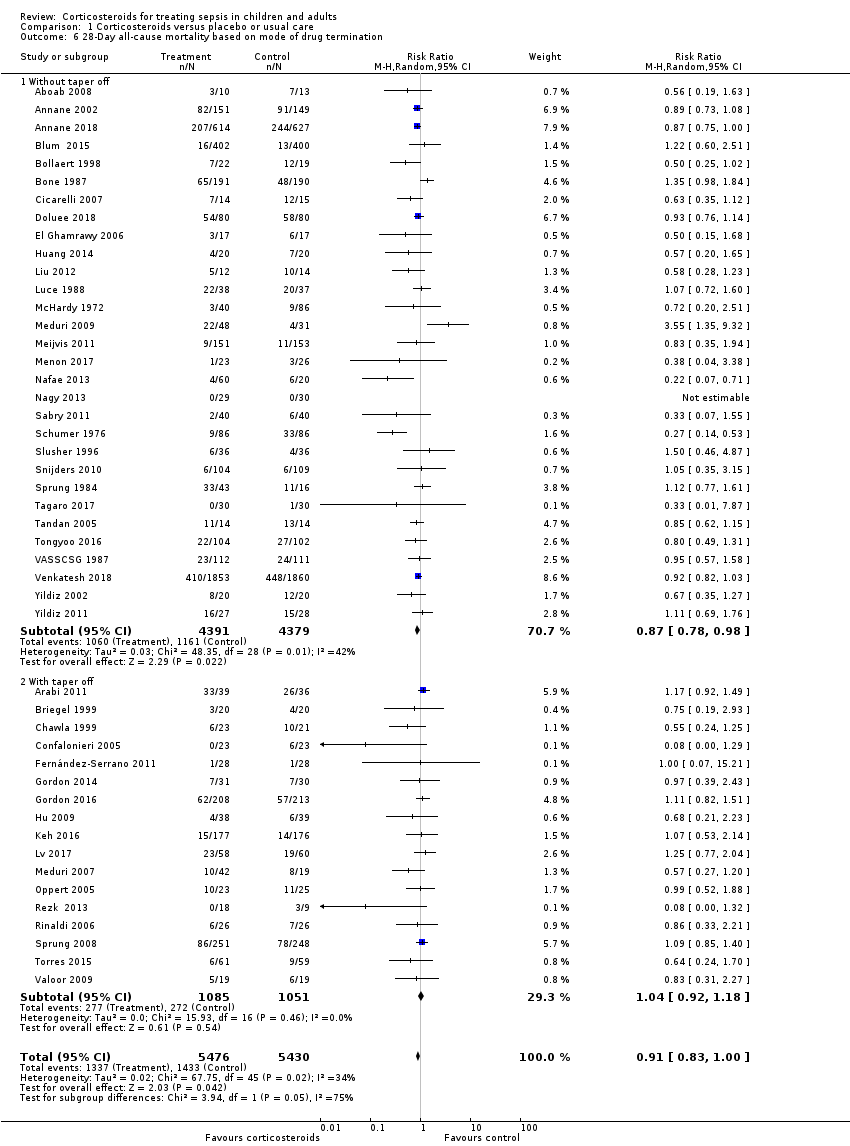
Comparison 1 Corticosteroids versus placebo or usual care, Outcome 6 28‐Day all‐cause mortality based on mode of drug termination.
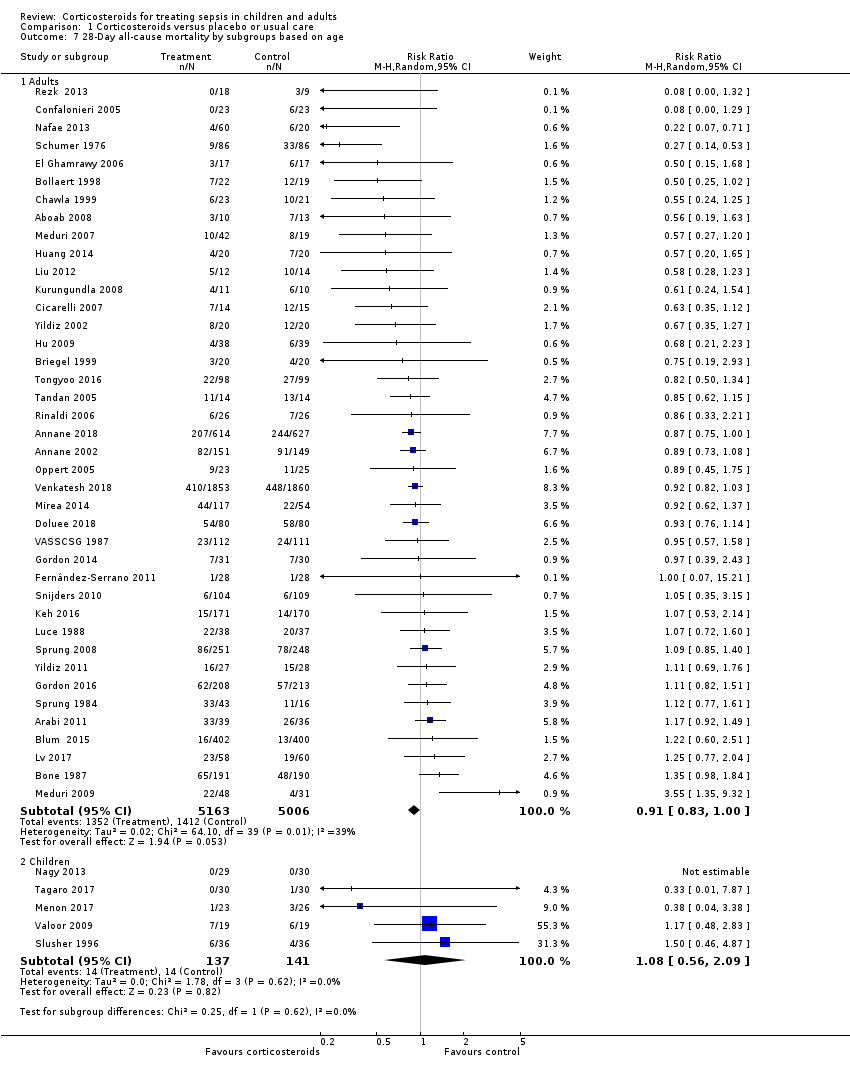
Comparison 1 Corticosteroids versus placebo or usual care, Outcome 7 28‐Day all‐cause mortality by subgroups based on age.

Comparison 1 Corticosteroids versus placebo or usual care, Outcome 8 28‐Day all‐cause mortality by subgroups based on targeted population.
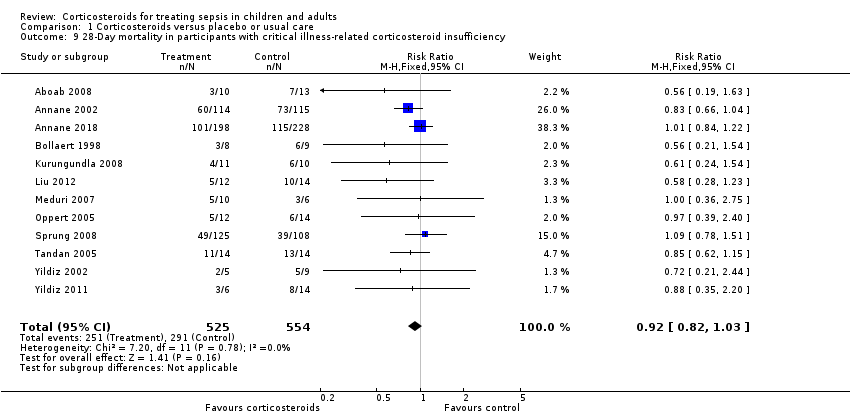
Comparison 1 Corticosteroids versus placebo or usual care, Outcome 9 28‐Day mortality in participants with critical illness‐related corticosteroid insufficiency.
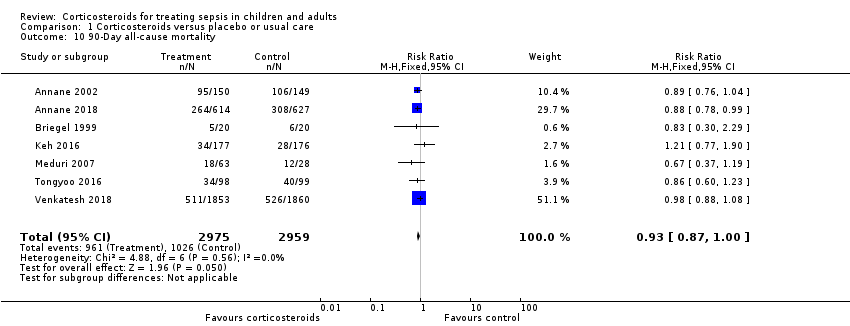
Comparison 1 Corticosteroids versus placebo or usual care, Outcome 10 90‐Day all‐cause mortality.
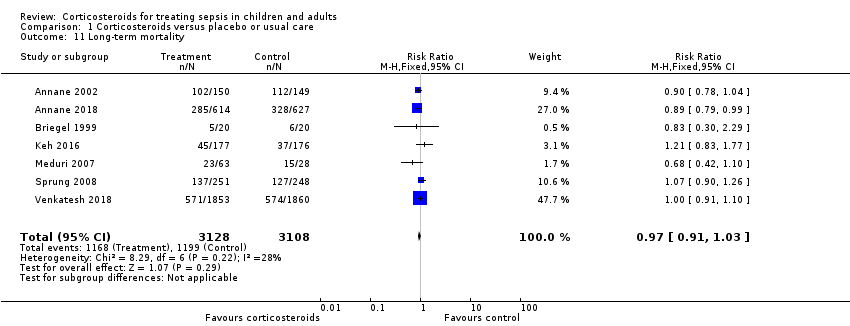
Comparison 1 Corticosteroids versus placebo or usual care, Outcome 11 Long‐term mortality.
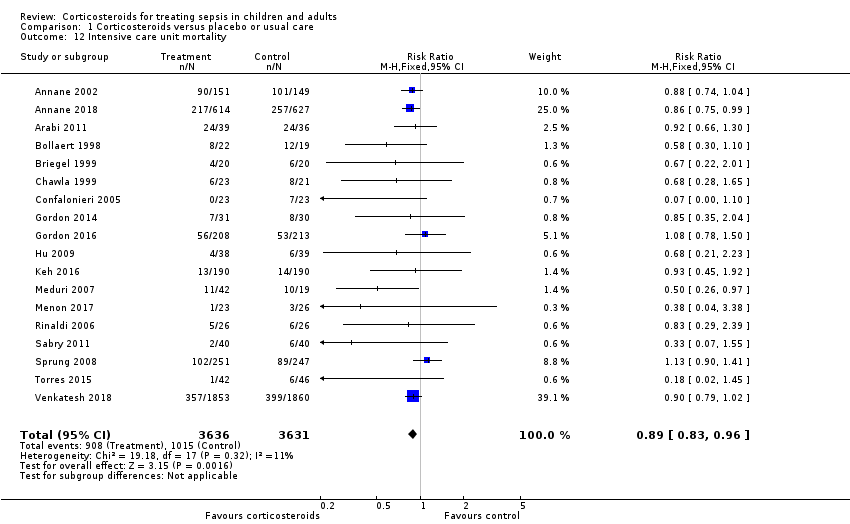
Comparison 1 Corticosteroids versus placebo or usual care, Outcome 12 Intensive care unit mortality.

Comparison 1 Corticosteroids versus placebo or usual care, Outcome 13 Hospital mortality.

Comparison 1 Corticosteroids versus placebo or usual care, Outcome 14 Number of participants with shock reversal at day 7.
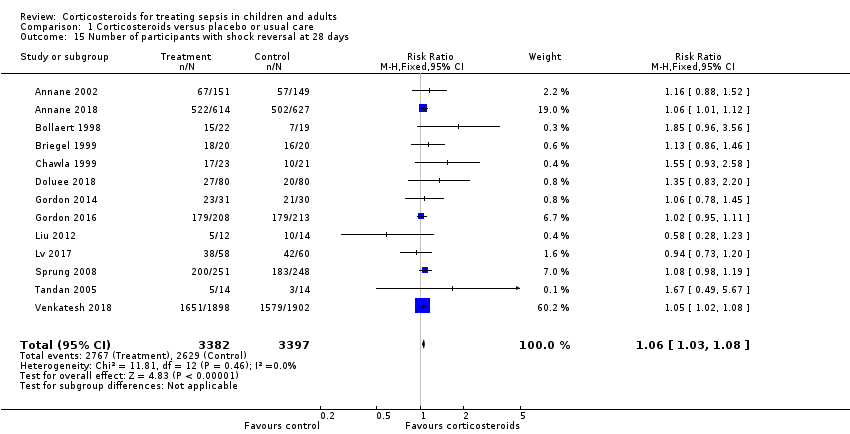
Comparison 1 Corticosteroids versus placebo or usual care, Outcome 15 Number of participants with shock reversal at 28 days.

Comparison 1 Corticosteroids versus placebo or usual care, Outcome 16 SOFA score at day 7.

Comparison 1 Corticosteroids versus placebo or usual care, Outcome 17 Length of intensive care unit stay for all participants.
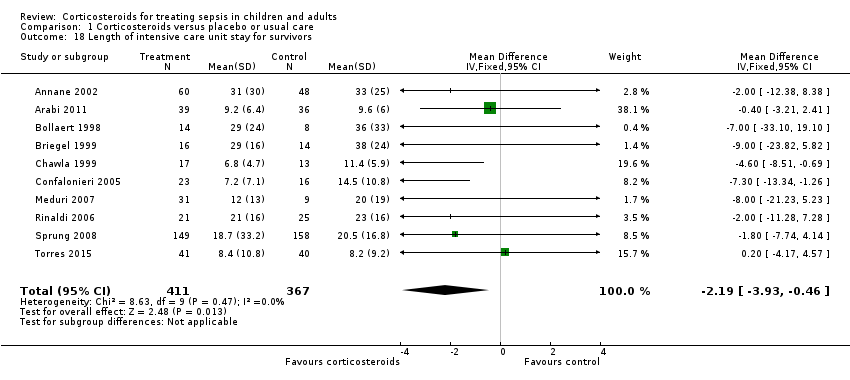
Comparison 1 Corticosteroids versus placebo or usual care, Outcome 18 Length of intensive care unit stay for survivors.

Comparison 1 Corticosteroids versus placebo or usual care, Outcome 19 Length of hospital stay for all participants.
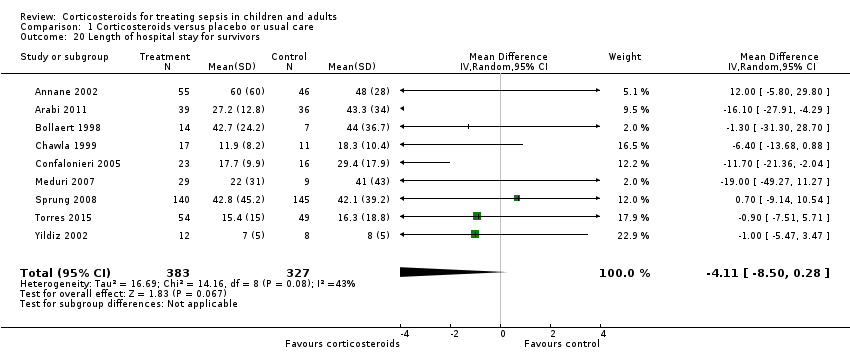
Comparison 1 Corticosteroids versus placebo or usual care, Outcome 20 Length of hospital stay for survivors.
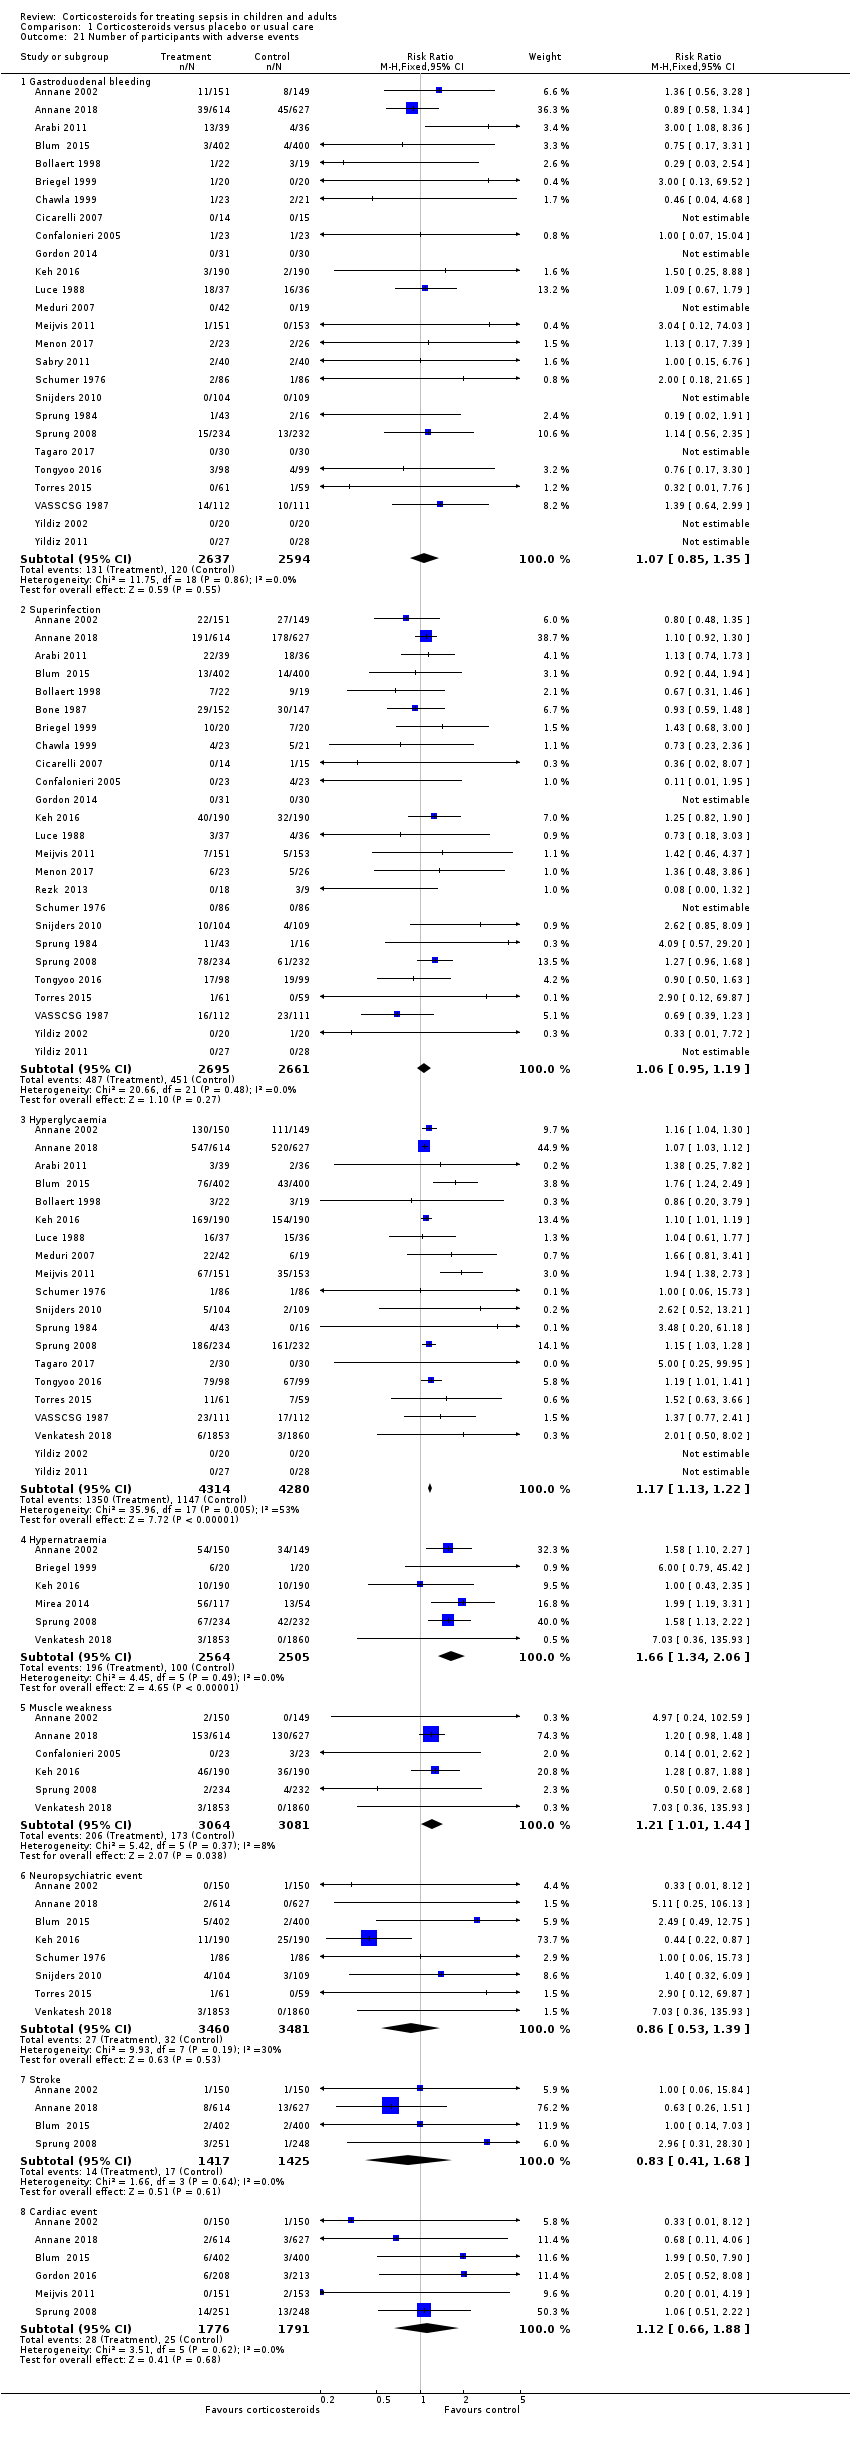
Comparison 1 Corticosteroids versus placebo or usual care, Outcome 21 Number of participants with adverse events.
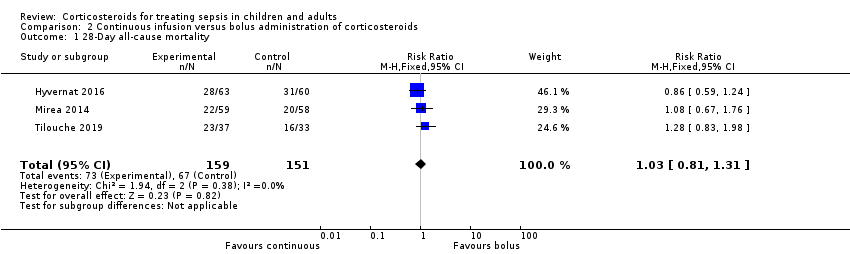
Comparison 2 Continuous infusion versus bolus administration of corticosteroids, Outcome 1 28‐Day all‐cause mortality.

Comparison 2 Continuous infusion versus bolus administration of corticosteroids, Outcome 2 90‐Day all‐cause mortality.

Comparison 2 Continuous infusion versus bolus administration of corticosteroids, Outcome 3 Long‐term mortality.

Comparison 2 Continuous infusion versus bolus administration of corticosteroids, Outcome 4 Intensive care unit mortality.

Comparison 2 Continuous infusion versus bolus administration of corticosteroids, Outcome 5 Hospital mortality.
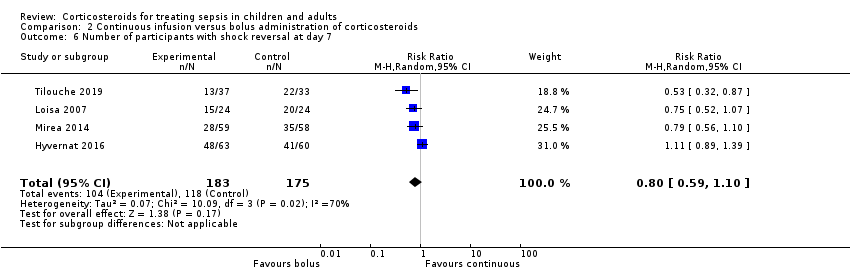
Comparison 2 Continuous infusion versus bolus administration of corticosteroids, Outcome 6 Number of participants with shock reversal at day 7.

Comparison 2 Continuous infusion versus bolus administration of corticosteroids, Outcome 7 Number of participants with shock reversal at day 28.

Comparison 2 Continuous infusion versus bolus administration of corticosteroids, Outcome 8 SOFA score at day 7.

Comparison 2 Continuous infusion versus bolus administration of corticosteroids, Outcome 9 Length of intensive care unit stay for all participants.
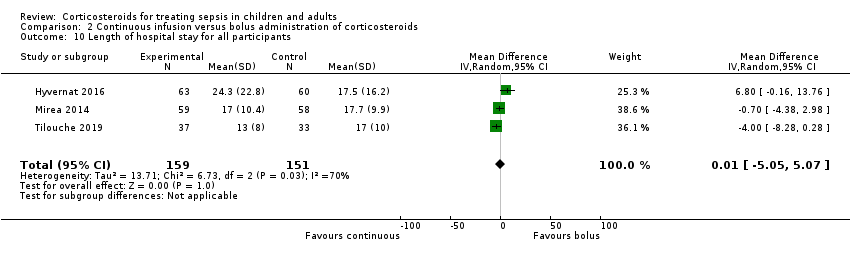
Comparison 2 Continuous infusion versus bolus administration of corticosteroids, Outcome 10 Length of hospital stay for all participants.
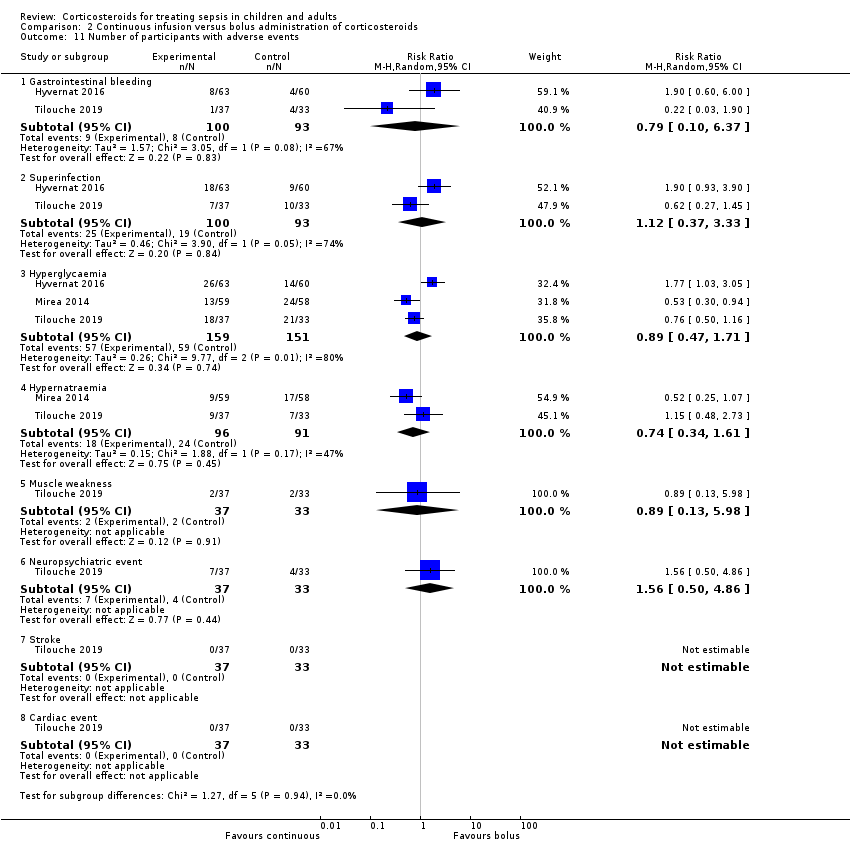
Comparison 2 Continuous infusion versus bolus administration of corticosteroids, Outcome 11 Number of participants with adverse events.
| Corticosteroids compared to placebo or usual care for treating sepsis | ||||||
| Patient or population: children and adults with sepsis | ||||||
| Outcomes | Anticipated absolute effects* (95% CI) | Relative effect | № of participants | Certainty of the evidence | Comments | |
| Risk with placebo or usual care | Risk with corticosteroids | |||||
| 28‐Day all‐cause mortalitya | Study population | RR 0.91 | 11233 | ⊕⊕⊕⊝ | Corticosteroids probably slightly reduce 28‐day all‐cause mortality | |
| 264 per 1000 | 240 per 1000 | |||||
| Long‐term mortalityc | Study population | RR 0.97 | 6236 | ⊕⊕⊝⊝ | Corticosteroids may result in little to no difference in long‐term mortality | |
| 386 per 1000 | 374 per 1000 | |||||
| Hospital mortality | Study population | RR 0.90 | 8183 | ⊕⊕⊕⊝ | Corticosteroids probably slightly reduce hospital mortality | |
| 323 per 1000 | 291 per 1000 | |||||
| Length of intensive care unit stay for all participants in days | Mean length of intensive care unit stay for all participants was 14 days | MD 1.07 lower | ‐ | 7612 | ⊕⊕⊕⊕ | Corticosteroids reduced length of intensive care unit stay for all participants |
| Length of hospital stay for all participants in days | Mean length of hospital stay for all participants was 21 days | MD 1.63 lower | ‐ | 8795 | ⊕⊕⊕⊕ | Corticosteroids result in a large reduction in length of hospital stay for all participants |
| Number of participants with adverse events ‐ superinfection (up to longest follow‐up) | Study population | RR 1.06 | 5356 | ⊕⊕⊕⊕ | Corticosteroids probably do not increase the number of participants with adverse events ‐ superinfection | |
| 169 per 1000 | 180 per 1000 | |||||
| Number of participants with adverse events ‐ muscle weakness (up to longest follow‐up) | Study population | RR 1.21 | 6145 | ⊕⊕⊕⊕ | Corticosteroids increase the number of participants with adverse events ‐ muscle weakness | |
| 56 per 1000 | 68 per 1000 | |||||
| *The risk in the intervention group (and its 95% confidence interval) is based on the assumed risk in the comparison group and the relative effect of the intervention (and its 95% CI). The unit of measure for length of stay is days. | ||||||
| GRADE Working Group grades of evidence. | ||||||
| aSensitivity analysis based on trials judged as being at low risk of bias showed an RR for dying at 28 days of 0.91 (95% CI 0.84 to 0.98; P = 0.01; 7896 participants; 17 studies; I² = 0%). bDowngraded one level for inconsistency; there was significant statistical heterogeneity. cLong‐term mortality was recorded up to six months for three trials (Annane 2018; Keh 2016; Venkatesh 2018), and up to one year for four trials (Annane 2002; Briegel 1999; Meduri 2007; Sprung 2008). dLarge 95% confidence interval overlapping the neutrality line. eUpgraded one level due to large size effects. | ||||||
| Continuous infusion compared to bolus administration of corticosteroids for children and adults with sepsis | ||||||
| Patient or population: children and adults with sepsis | ||||||
| Outcomes | Anticipated absolute effects* (95% CI) | Relative effect | № of participants | Certainty of the evidence | Comments | |
| Risk with bolus administration of corticosteroids | Risk with continuous infusion | |||||
| 28‐Day all‐cause mortality | Study population | RR 1.03 | 310 | ⊕⊝⊝⊝ | Evidence is very uncertain about the effect of continuous infusion on 28‐day all‐cause mortality | |
| 444 per 1000 | 457 per 1000 | |||||
| Long‐term mortalityc | Study population | RR 1.36 | 70 | ⊕⊝⊝⊝ | Evidence is very uncertain about the effect of continuous infusion on long‐term mortality | |
| 636 per 1000 | 865 per 1000 | |||||
| Hospital mortality | Study population | RR 0.95 | 240 | ⊕⊝⊝⊝ | Evidence is very uncertain about the effect of continuous infusion on hospital mortality | |
| 458 per 1000 | 435 per 1000 | |||||
| Length of intensive care unit stay for all participants in days | Mean length of intensive care unit stay for all participants was 13 days | MD 1.05 lower | ‐ | 310 | ⊕⊝⊝⊝ | Evidence is very uncertain about the effect of continuous infusion on length of intensive care unit stay for all participants |
| Length of hospital stay for all participants in days | Mean length of hospital stay for all participants was 17 days | MD 0.01 higher | ‐ | 310 | ⊕⊝⊝⊝ | Evidence is very uncertain about the effect of continuous infusion on length of hospital stay for all participants |
| Number of participants with adverse events ‐ superinfection (up to longest follow‐up) | Study population | RR 1.12 | 193 | ⊕⊝⊝⊝ | Evidence is very uncertain about the effect of continuous infusion on number of participants with adverse events ‐ superinfection | |
| 204 per 1000 | 229 per 1000 | |||||
| Number of participants with adverse events ‐ muscle weakness (up to longest follow‐up) | Study population | RR 0.89 | 70 | ⊕⊕⊝⊝ | Evidence suggests that continuous infusion may result in little to no difference in the number of participants with adverse events ‐ muscle weakness | |
| 61 per 1000 | 54 per 1000 | |||||
| *The risk in the intervention group (and its 95% confidence interval) is based on the assumed risk in the comparison group and the relative effect of the intervention (and its 95% CI). The unit of measure for length of stay is days. | ||||||
| GRADE Working Group grades of evidence. | ||||||
| aDowngraded one level as only one of the four trials was judged as having low risk of bias. bDowngraded one level as trials were small and the 95% confidence interval was large. dDowngraded one level as the only trial reporting this outcome was open‐labelled and at high risk of performance bias. eDowngraded one level as only one trial reported this outcome. fDowngraded one level as the observed increase in risk of dying in the long term is not consistent with treatment effects on 28‐day mortality. gDowngraded one level as results show some heterogeneity. hDowngraded two levels as heterogeneity in the results is strong. cLong‐term mortality was assessed up to six months. | ||||||
| Author | Number of trials | Primary outcome | No of patients | Estimate | 95% CI |
| 19 | 28‐Day mortality | 7035 | Sepsis: RR = 0.91 Septic shock: RR = 0.92 | 0.85 to 0.98 0.85 to 0.99 | |
| 6 | Not stated | 5689 | Only qualitative assessment | Only qualitative assessment | |
| 42 | 28‐ to 31‐day mortality | 10,194 | RR = 0.93 | 0.84 to 1.03 | |
| 22 | Short‐term mortality | 7297 | RR = 0.96 | 0.91 to 1.02 | |
| 37 | 28‐Day mortality | 9564 | RR = 0.90 | 0.82 to 0.98 |
| Outcome or subgroup title | No. of studies | No. of participants | Statistical method | Effect size |
| 1 28‐Day all‐cause mortality Show forest plot | 50 | 11233 | Risk Ratio (M‐H, Random, 95% CI) | 0.91 [0.84, 0.99] |
| 1.1 Studies reporting actual 28‐day mortality | 32 | 9387 | Risk Ratio (M‐H, Random, 95% CI) | 0.94 [0.87, 1.00] |
| 1.2 Studies reporting short‐term mortality at other timing | 18 | 1846 | Risk Ratio (M‐H, Random, 95% CI) | 0.71 [0.52, 0.95] |
| 2 28‐Day all‐cause mortality ‐ sensitivity analysis based on methodological quality Show forest plot | 38 | Risk Ratio (M‐H, Fixed, 95% CI) | Subtotals only | |
| 2.1 Adequate generation of allocation sequence | 35 | 10076 | Risk Ratio (M‐H, Fixed, 95% CI) | 0.93 [0.87, 0.99] |
| 2.2 Adequate allocation concealment | 34 | 9972 | Risk Ratio (M‐H, Fixed, 95% CI) | 0.93 [0.87, 0.99] |
| 2.3 Blinded trials | 34 | 9894 | Risk Ratio (M‐H, Fixed, 95% CI) | 0.93 [0.87, 0.99] |
| 2.4 Studies judged at low risk of bias | 17 | 7896 | Risk Ratio (M‐H, Fixed, 95% CI) | 0.91 [0.84, 0.98] |
| 3 28‐Day all‐cause mortality by subgroups based on study drug Show forest plot | 47 | 11017 | Risk Ratio (M‐H, Random, 95% CI) | 0.92 [0.84, 1.00] |
| 3.1 Hydrocortisone | 25 | 6518 | Risk Ratio (M‐H, Random, 95% CI) | 0.94 [0.83, 1.05] |
| 3.2 Hydrocortisone plus fludrocortisone | 3 | 1564 | Risk Ratio (M‐H, Random, 95% CI) | 0.87 [0.77, 0.98] |
| 3.3 Prednisone/Prednisolone | 5 | 1236 | Risk Ratio (M‐H, Random, 95% CI) | 0.97 [0.71, 1.33] |
| 3.4 Methylprednisolone/Dexamethasone | 14 | 1699 | Risk Ratio (M‐H, Random, 95% CI) | 0.81 [0.61, 1.09] |
| 4 28‐Day all‐cause mortality by subgroups based on treatment dose/duration Show forest plot | 44 | 10812 | Risk Ratio (M‐H, Fixed, 95% CI) | 0.92 [0.86, 0.97] |
| 4.1 Long course of low‐dose corticosteroids | 39 | 9902 | Risk Ratio (M‐H, Fixed, 95% CI) | 0.91 [0.86, 0.97] |
| 4.2 Short course of high‐dose corticosteroids | 5 | 910 | Risk Ratio (M‐H, Fixed, 95% CI) | 0.96 [0.80, 1.16] |
| 5 28‐Day all‐cause mortality based on mode of drug administration Show forest plot | 45 | 9978 | Risk Ratio (M‐H, Random, 95% CI) | 0.90 [0.82, 0.99] |
| 5.1 Intravenous bolus | 27 | 4749 | Risk Ratio (M‐H, Random, 95% CI) | 0.92 [0.83, 1.02] |
| 5.2 Continuous infusion | 18 | 5229 | Risk Ratio (M‐H, Random, 95% CI) | 0.84 [0.66, 1.07] |
| 6 28‐Day all‐cause mortality based on mode of drug termination Show forest plot | 47 | 10906 | Risk Ratio (M‐H, Random, 95% CI) | 0.91 [0.83, 1.00] |
| 6.1 Without taper off | 30 | 8770 | Risk Ratio (M‐H, Random, 95% CI) | 0.87 [0.78, 0.98] |
| 6.2 With taper off | 17 | 2136 | Risk Ratio (M‐H, Random, 95% CI) | 1.04 [0.92, 1.18] |
| 7 28‐Day all‐cause mortality by subgroups based on age Show forest plot | 45 | Risk Ratio (M‐H, Random, 95% CI) | Subtotals only | |
| 7.1 Adults | 40 | 10169 | Risk Ratio (M‐H, Random, 95% CI) | 0.91 [0.83, 1.00] |
| 7.2 Children | 5 | 278 | Risk Ratio (M‐H, Random, 95% CI) | 1.08 [0.56, 2.09] |
| 8 28‐Day all‐cause mortality by subgroups based on targeted population Show forest plot | 50 | Risk Ratio (M‐H, Random, 95% CI) | Subtotals only | |
| 8.1 Sepsis | 10 | 1358 | Risk Ratio (M‐H, Random, 95% CI) | 1.10 [0.89, 1.37] |
| 8.2 Septic shock only | 23 | 7428 | Risk Ratio (M‐H, Random, 95% CI) | 0.91 [0.83, 1.00] |
| 8.3 Sepsis and ARDS | 4 | 311 | Risk Ratio (M‐H, Random, 95% CI) | 0.66 [0.45, 0.98] |
| 8.4 Sepsis and community‐acquired pneumonia | 13 | 2038 | Risk Ratio (M‐H, Random, 95% CI) | 0.71 [0.50, 1.00] |
| 9 28‐Day mortality in participants with critical illness‐related corticosteroid insufficiency Show forest plot | 12 | 1079 | Risk Ratio (M‐H, Fixed, 95% CI) | 0.92 [0.82, 1.03] |
| 10 90‐Day all‐cause mortality Show forest plot | 7 | 5934 | Risk Ratio (M‐H, Fixed, 95% CI) | 0.93 [0.87, 1.00] |
| 11 Long‐term mortality Show forest plot | 7 | 6236 | Risk Ratio (M‐H, Fixed, 95% CI) | 0.97 [0.91, 1.03] |
| 12 Intensive care unit mortality Show forest plot | 18 | 7267 | Risk Ratio (M‐H, Fixed, 95% CI) | 0.89 [0.83, 0.96] |
| 13 Hospital mortality Show forest plot | 26 | 8183 | Risk Ratio (M‐H, Random, 95% CI) | 0.90 [0.82, 0.99] |
| 14 Number of participants with shock reversal at day 7 Show forest plot | 16 | 6711 | Risk Ratio (M‐H, Random, 95% CI) | 1.23 [1.13, 1.34] |
| 15 Number of participants with shock reversal at 28 days Show forest plot | 13 | 6779 | Risk Ratio (M‐H, Fixed, 95% CI) | 1.06 [1.03, 1.08] |
| 16 SOFA score at day 7 Show forest plot | 10 | 2157 | Mean Difference (IV, Random, 95% CI) | ‐1.37 [‐1.84, ‐0.90] |
| 17 Length of intensive care unit stay for all participants Show forest plot | 21 | 7612 | Mean Difference (IV, Random, 95% CI) | ‐1.07 [‐1.95, ‐0.19] |
| 18 Length of intensive care unit stay for survivors Show forest plot | 10 | 778 | Mean Difference (IV, Fixed, 95% CI) | ‐2.19 [‐3.93, ‐0.46] |
| 19 Length of hospital stay for all participants Show forest plot | 22 | 8795 | Mean Difference (IV, Random, 95% CI) | ‐1.63 [‐2.93, ‐0.33] |
| 20 Length of hospital stay for survivors Show forest plot | 9 | 710 | Mean Difference (IV, Random, 95% CI) | ‐4.11 [‐8.50, 0.28] |
| 21 Number of participants with adverse events Show forest plot | 31 | Risk Ratio (M‐H, Fixed, 95% CI) | Subtotals only | |
| 21.1 Gastroduodenal bleeding | 26 | 5231 | Risk Ratio (M‐H, Fixed, 95% CI) | 1.07 [0.85, 1.35] |
| 21.2 Superinfection | 25 | 5356 | Risk Ratio (M‐H, Fixed, 95% CI) | 1.06 [0.95, 1.19] |
| 21.3 Hyperglycaemia | 20 | 8594 | Risk Ratio (M‐H, Fixed, 95% CI) | 1.17 [1.13, 1.22] |
| 21.4 Hypernatraemia | 6 | 5069 | Risk Ratio (M‐H, Fixed, 95% CI) | 1.66 [1.34, 2.06] |
| 21.5 Muscle weakness | 6 | 6145 | Risk Ratio (M‐H, Fixed, 95% CI) | 1.21 [1.01, 1.44] |
| 21.6 Neuropsychiatric event | 8 | 6941 | Risk Ratio (M‐H, Fixed, 95% CI) | 0.86 [0.53, 1.39] |
| 21.7 Stroke | 4 | 2842 | Risk Ratio (M‐H, Fixed, 95% CI) | 0.83 [0.41, 1.68] |
| 21.8 Cardiac event | 6 | 3567 | Risk Ratio (M‐H, Fixed, 95% CI) | 1.12 [0.66, 1.88] |
| Outcome or subgroup title | No. of studies | No. of participants | Statistical method | Effect size |
| 1 28‐Day all‐cause mortality Show forest plot | 3 | 310 | Risk Ratio (M‐H, Fixed, 95% CI) | 1.03 [0.81, 1.31] |
| 2 90‐Day all‐cause mortality Show forest plot | 1 | 123 | Risk Ratio (M‐H, Fixed, 95% CI) | 0.87 [0.61, 1.22] |
| 3 Long‐term mortality Show forest plot | 1 | 70 | Risk Ratio (M‐H, Fixed, 95% CI) | 1.36 [1.02, 1.81] |
| 4 Intensive care unit mortality Show forest plot | 4 | 358 | Risk Ratio (M‐H, Fixed, 95% CI) | 1.02 [0.80, 1.29] |
| 5 Hospital mortality Show forest plot | 2 | 240 | Risk Ratio (M‐H, Fixed, 95% CI) | 0.95 [0.72, 1.25] |
| 6 Number of participants with shock reversal at day 7 Show forest plot | 4 | 358 | Risk Ratio (M‐H, Random, 95% CI) | 0.80 [0.59, 1.10] |
| 7 Number of participants with shock reversal at day 28 Show forest plot | 1 | 70 | Risk Ratio (M‐H, Random, 95% CI) | 0.78 [0.45, 1.34] |
| 8 SOFA score at day 7 Show forest plot | 3 | 260 | Mean Difference (IV, Fixed, 95% CI) | 1.00 [‐0.25, 2.26] |
| 9 Length of intensive care unit stay for all participants Show forest plot | 3 | 310 | Mean Difference (IV, Random, 95% CI) | ‐1.05 [‐4.54, 2.45] |
| 10 Length of hospital stay for all participants Show forest plot | 3 | 310 | Mean Difference (IV, Random, 95% CI) | 0.01 [‐5.05, 5.07] |
| 11 Number of participants with adverse events Show forest plot | 3 | Risk Ratio (M‐H, Random, 95% CI) | Subtotals only | |
| 11.1 Gastrointestinal bleeding | 2 | 193 | Risk Ratio (M‐H, Random, 95% CI) | 0.79 [0.10, 6.37] |
| 11.2 Superinfection | 2 | 193 | Risk Ratio (M‐H, Random, 95% CI) | 1.12 [0.37, 3.33] |
| 11.3 Hyperglycaemia | 3 | 310 | Risk Ratio (M‐H, Random, 95% CI) | 0.89 [0.47, 1.71] |
| 11.4 Hypernatraemia | 2 | 187 | Risk Ratio (M‐H, Random, 95% CI) | 0.74 [0.34, 1.61] |
| 11.5 Muscle weakness | 1 | 70 | Risk Ratio (M‐H, Random, 95% CI) | 0.89 [0.13, 5.98] |
| 11.6 Neuropsychiatric event | 1 | 70 | Risk Ratio (M‐H, Random, 95% CI) | 1.56 [0.50, 4.86] |
| 11.7 Stroke | 1 | 70 | Risk Ratio (M‐H, Random, 95% CI) | 0.0 [0.0, 0.0] |
| 11.8 Cardiac event | 1 | 70 | Risk Ratio (M‐H, Random, 95% CI) | 0.0 [0.0, 0.0] |