Kortikosteroid untuk merawat sepsis di kalangan kanak‐kanak dan orang dewasa
Abstract
Background
Sepsis occurs when an infection is complicated by organ failure. Sepsis may be complicated by impaired corticosteroid metabolism. Thus, providing corticosteroids may benefit patients. The original review was published in 2004 and was updated in 2010 and 2015 prior to this update.
Objectives
To examine the effects of corticosteroids on death in children and adults with sepsis.
Search methods
We searched CENTRAL, MEDLINE, Embase, LILACS, ClinicalTrials.gov, ISRCTN, and the WHO Clinical Trials Search Portal, on 25 July 2019. In addition, we conducted reference checking and citation searching, and contacted study authors, to identify additional studies as needed.
Selection criteria
We included randomized controlled trials (RCTs) of corticosteroids versus placebo or usual care (antimicrobials, fluid replacement, and vasopressor therapy as needed) in children and adults with sepsis. We also included RCTs of continuous infusion versus intermittent bolus of corticosteroids.
Data collection and analysis
All review authors screened and selected studies for inclusion. One review author extracted data, which was checked by the others, and by the lead author of the primary study when possible. We obtained unpublished data from the authors of some trials. We assessed the methodological quality of trials and applied GRADE to assess the certainty of evidence. Review authors did not contribute to assessment of eligibility and risk of bias, nor to data extraction, for trials they had participated in.
Main results
We included 61 trials (12,192 participants), of which six included only children, two included children and adults, and the remaining trials included only adults. Nine studies are ongoing and will be considered in future versions of this review. We judged 19 trials as being at low risk of bias.
Corticosteroids versus placebo or usual care
Compared to placebo or usual care, corticosteroids probably slightly reduce 28‐day mortality (risk ratio (RR) 0.91, 95% confidence interval (CI) 0.84 to 0.99; 11,233 participants; 50 studies; moderate‐certainty evidence). Corticosteroids may result in little to no difference in long‐term mortality (RR 0.97, 95% CI 0.91 to 1.03; 6236 participants; 7 studies; low‐certainty evidence) and probably slightly reduce hospital mortality (RR 0.90, 95% CI 0.82 to 0.99; 8183 participants; 26 trials; moderate‐certainty evidence). Corticosteroids reduced length of intensive care unit (ICU) stay for all participants (mean difference (MD) ‐1.07 days, 95% CI ‐1.95 to ‐0.19; 7612 participants; 21 studies; high‐certainty evidence) and resulted in a large reduction in length of hospital stay for all participants (MD ‐1.63 days, 95% CI ‐2.93 to ‐0.33; 8795 participants; 22 studies; high‐certainty evidence). Corticosteroids increase the risk of muscle weakness (RR 1.21, 95% CI 1.01 to 1.44; 6145 participants; 6 studies; high‐certainty evidence). Corticosteroids probably do not increase the risk of superinfection (RR 1.06, 95% CI 0.95 to 1.19; 5356 participants; 25 studies; moderate‐certainty evidence). Corticosteroids increase the risk of hypernatraemia (high‐certainty evidence) and probably increase the risk of hyperglycaemia (moderate‐certainty evidence). Moderate‐certainty evidence shows that there is probably little or no difference in gastroduodenal bleeding, stroke, or cardiac events, and low‐certainty evidence suggests that corticosteroids may result in little to no difference in neuropsychiatric events.
Continuous infusion of corticosteroids versus intermittent bolus
We are uncertain about the effects of continuous infusion of corticosteroids compared with intermittent bolus administration. Three studies reported data for this comparison, and the certainty of evidence for all outcomes was very low.
Authors' conclusions
Moderate‐certainty evidence indicates that corticosteroids probably reduce 28‐day and hospital mortality among patients with sepsis. Corticosteroids result in large reductions in ICU and hospital length of stay (high‐certainty evidence). There may be little or no difference in the risk of major complications; however, corticosteroids increase the risk of muscle weakness and hypernatraemia, and probably increase the risk of hyperglycaemia. The effects of continuous versus intermittent bolus administration of corticosteroids are uncertain.
PICOs
Ringkasan bahasa mudah
Kortikosteroid untuk merawat sepsis
Soalan ulasan
Kami mengulas bukti kesan ke atas kematian menggunakan kortikosteroid di kalangan kanak‐kanak dan orang dewasa dengan sepsis.
Latar belakang
Sepsis berlaku apabila jangkitan menjadi rumit dengan kegagalan fungsi organ. Orang mengalami pernafasan cepat, hipotensi (tekanan darah rendah), dan kekeliruan mental. Sepsis boleh mengganggu keberkesanan kortikosteroid buatan badan, yang berfungsi sebagai pertahanan utama terhadap jangkitan. Kortikosteroid telah diberikan selama beberapa dekad kepada pesakit‐pesakit dengan jangkitan yang berpunca daripada pelbagai sebab.
Tarikh carian
Bukti dalam kajian ini adalah terkini sehingga Julai 2019.
Ciri‐ciri kajian
Ulasan ini melibatkan 61 kajian (12,192 peserta). Lima puluh lapan kajian membandingkan kortikosteroid dengan tanpa kortikosteroid (plasebo atau jagaan biasa dalam 48 dan sembilan kajian); tiga kajian juga membandingkan pemberian kortikosteroid secara berterusan dengan secara bolus.
Sumber dana kajian
Tiga kajian dibiayai oleh sebuah syarikat ubat, 27 oleh organisasi awam atau melalui pembiayaan amal, dan enam oleh kedua‐dua syarikat ubat dan organisasi awam atau pembiayaan amal; 25 tidak mengisytiharkan sumber pembiayaan.
Keputusan utama
Kami telah menganalisis dua perbandingan berikut.
• Kortikosteroid berbanding plasebo/penjagaan biasa.
Kortikosteroid mungkin mengurangkan risiko kematian sebanyak 9% pada 28 hari (50 perbicaraan; 11,233 peserta), dengan kesan rawatan yang konsisten antara kanak‐kanak dan orang dewasa. Mereka juga mungkin mengurangkan sedikit risiko mati di hospital. Mungkin terdapat sedikit atau tiada kesan kortikosteroid berisiko mati dalam jangka masa panjang (lebih daripada tiga bulan), tetapi keputusan ini kurang pasti. Kortikosteroid mengakibatkan pengurangan yang besar dalam tempoh menginap di unit rawatan rapi (ICU) dan hospital. Kortikosteroid meningkatkan risiko kelemahan otot dan hipernatraemia. Mereka mungkin meningkatkan risiko hyperglycaemia. Mereka mungkin tidak meningkatkan risiko jangkitan superinfeksi. Mungkin terdapat sedikit atau tiada kesan kortikosteroid pada risiko pendarahan gastroduodenal, peristiwa neuropsychiatrik, strok, atau peristiwa jantung.
• Infusi berterusan berbanding dengan kortikosteroid bolus yang diberikan secara berselang seli .
Kami tidak pasti tentang kesan infusi kortikosteroid berterusan berbanding dengan pemberian bolus secara berselang‐seli. Tiga kajian melaporkan data untuk perbandingan ini, dan kepastian bukti untuk semua hasil adalah sangat rendah.
Kepastian bukti
• Kortikosteroid berbanding plasebo/penjagaan biasa
Kami menilai kepastian bukti untuk kadar kematian 28 hari sebagai sederhana disebabkan oleh beberapa ketidak selarasan yang berkaitan dengan perbezaan di kalangan populasi pengajian, jenis kortikosteroid dan bagaimana mereka diberikan, dan penggunaan intervensi tambahan.
• Infusi berterusan berbanding pemberian kortikosteroid bolus secara berselang seli
Kami menilai kepastian bukti untuk kematian 28 hari yang sangat rendah disebabkan oleh tidak konsisten dan tidak tepat.
Authors' conclusions
Summary of findings
| Corticosteroids compared to placebo or usual care for treating sepsis | ||||||
| Patient or population: children and adults with sepsis | ||||||
| Outcomes | Anticipated absolute effects* (95% CI) | Relative effect | № of participants | Certainty of the evidence | Comments | |
| Risk with placebo or usual care | Risk with corticosteroids | |||||
| 28‐Day all‐cause mortalitya | Study population | RR 0.91 | 11233 | ⊕⊕⊕⊝ | Corticosteroids probably slightly reduce 28‐day all‐cause mortality | |
| 264 per 1000 | 240 per 1000 | |||||
| Long‐term mortalityc | Study population | RR 0.97 | 6236 | ⊕⊕⊝⊝ | Corticosteroids may result in little to no difference in long‐term mortality | |
| 386 per 1000 | 374 per 1000 | |||||
| Hospital mortality | Study population | RR 0.90 | 8183 | ⊕⊕⊕⊝ | Corticosteroids probably slightly reduce hospital mortality | |
| 323 per 1000 | 291 per 1000 | |||||
| Length of intensive care unit stay for all participants in days | Mean length of intensive care unit stay for all participants was 14 days | MD 1.07 lower | ‐ | 7612 | ⊕⊕⊕⊕ | Corticosteroids reduced length of intensive care unit stay for all participants |
| Length of hospital stay for all participants in days | Mean length of hospital stay for all participants was 21 days | MD 1.63 lower | ‐ | 8795 | ⊕⊕⊕⊕ | Corticosteroids result in a large reduction in length of hospital stay for all participants |
| Number of participants with adverse events ‐ superinfection (up to longest follow‐up) | Study population | RR 1.06 | 5356 | ⊕⊕⊕⊕ | Corticosteroids probably do not increase the number of participants with adverse events ‐ superinfection | |
| 169 per 1000 | 180 per 1000 | |||||
| Number of participants with adverse events ‐ muscle weakness (up to longest follow‐up) | Study population | RR 1.21 | 6145 | ⊕⊕⊕⊕ | Corticosteroids increase the number of participants with adverse events ‐ muscle weakness | |
| 56 per 1000 | 68 per 1000 | |||||
| *The risk in the intervention group (and its 95% confidence interval) is based on the assumed risk in the comparison group and the relative effect of the intervention (and its 95% CI). The unit of measure for length of stay is days. | ||||||
| GRADE Working Group grades of evidence. | ||||||
| aSensitivity analysis based on trials judged as being at low risk of bias showed an RR for dying at 28 days of 0.91 (95% CI 0.84 to 0.98; P = 0.01; 7896 participants; 17 studies; I² = 0%). bDowngraded one level for inconsistency; there was significant statistical heterogeneity. cLong‐term mortality was recorded up to six months for three trials (Annane 2018; Keh 2016; Venkatesh 2018), and up to one year for four trials (Annane 2002; Briegel 1999; Meduri 2007; Sprung 2008). dLarge 95% confidence interval overlapping the neutrality line. eUpgraded one level due to large size effects. | ||||||
Background
Description of the condition
Sepsis occurs when the host response to an infection is dysregulated (Singer 2016). The dysregulated host response is usually defined by the presence of a sequential organ failure assessment (SOFA) score of 2 or higher (Singer 2016; Vincent 1996). Septic shock is a subset of sepsis in which particularly profound circulatory, cellular, and metabolic abnormalities are associated with greater risk of mortality than is sepsis alone. Patients with septic shock can be clinically identified by a vasopressor requirement to maintain mean arterial pressure of 65 mmHg or greater and serum lactate levels greater than 2 mmol/L (> 18 mg/dL) in the absence of hypovolaemia. The dysregulated response may result in systemic inflammation and organ damage, or in immune paresis and secondary infection (van der Poll 2017). In 2017, the World Health Organization estimated that around 31 million people develop sepsis each year, and about 10 million die (WHO 2018). According to a recent retrospective cohort study of adult patients admitted to 409 academic, community, and federal hospitals in the USA from 2009 to 2014, sepsis was present in 6% of adult hospitalizations (Rhee 2017). Another study of electronic health records from 27 academic hospitals in the USA reported an annual incidence of septic shock of about 19 per 1000 hospitalizations in 2014 (Kadri 2017). People with sepsis usually die from hypotension or progressive multiple organ failure (Angus 2013; Annane 2003; Annane 2005; Parrillo 1993). There is no current diagnostic test for sepsis. Its standard management includes control of the source of infection with antibiotics and surgery whenever needed, as well as control of tissue oxygenation with fluid replacement, oxygen with or without respiratory support, and vasopressors whenever needed (Rhodes 2017). No specific interventions are yet available to control immune responses to invading pathogens (Rhodes 2017). The financial burden of sepsis on the healthcare system has been calculated to be > 24 billion USD, representing 6.2% of total hospital costs in 2013 (WHO 2018). Studies in Europe and Canada estimated the daily costs of hospital care for a septic patient in 2000 to be between EUR 710 and EUR 1033 (equivalent to about USD 645 and USD 939, respectively) (WHO 2018).
Description of the intervention
Corticosteroids include the natural steroid hormones produced by adrenocortical cells and a broad variety of synthetic analogues. These substances have various effects that may be grossly classified into glucocorticoid and mineralocorticoid effects. Glucocorticoid effects include mainly regulation of carbohydrate, lipid, and protein metabolism, as well as regulation of inflammation. Mineralocorticoid effects include mainly regulation of electrolyte and water metabolism. At molecular levels, glucocorticoids have non‐genomic and genomic effects (Annane 2017a; Cain 2017). Rapid (within minutes) non‐genomic effects of glucocorticoids include a decrease in platelet aggregation, in cell adhesion, and in intracellular phosphotyrosine kinases, and they include an increase in annexin 1 externalization (Lowenberg 2005). These effects may result from the interaction of glucocorticoids with specific membrane sites (Norman 2004). Glucocorticoids have indirect genomic effects, called trans‐repression (Rhen 2005). These occur within a few hours following exposure of cells to glucocorticoids. They result from the physical interaction between the monomeric glucocorticoid‐glucocorticoid receptor (G‐GR)α complex and various nuclear transcription factors, such as nuclear factor (NF)‐κB and activator protein (AP)‐1. Subsequently, these nuclear transcription factors are sequestrated in the cytosol and cannot enter the nucleus, preventing the expression of genes encoding for most if not all pro‐inflammatory mediators. Glucocorticoids also have direct genomic effects, called transactivation. They require only a few days of cell exposure to glucocorticoids. Indeed, conformational changes (i.e. dimerization of the G‐GRα complex) are needed before this complex can migrate to the nucleus to interact with glucocorticoid‐responsive elements, that is, parts of genes encoding for regulators of termination of inflammation. Then, key anti‐inflammatory factors are up‐regulated, leading to phagocytosis, chemokinesis, and anti‐oxidative processes. The net effect of glucocorticoids involves reprogramming rather than inhibiting immune cell function (Erschen 2007). Glucocorticoids induce specific activated anti‐inflammatory monocyte subtypes that migrate quickly to inflamed tissues (Varga 2008). They prolong survival of this subtype of monocyte via A3 adenosine receptor‐triggered anti‐apoptotic effects (Barczyk 2010). Overall, these molecular mechanisms of action of glucocorticoids are appropriate for counteracting the uncontrolled inflammation that may characterize sepsis.
How the intervention might work
Researchers have explored the biological mechanisms of sepsis to investigate potential interventions. Corticosteroids have been a topic of particular focus because of their influence on the immune response (Cain 2017). In sepsis, the hypothalamic‐pituitary gland hormonal pathway to the adrenal glands stimulates corticosteroid production (Annane 2017a; Chrousos 1995; Cooper 2003; Heming 2018). These hormones affect inflammation through the production of white blood cells, cytokines (proteins that influence the immune response), and nitric oxide. In sepsis, cytokines may suppress adrenocorticotropin hormone synthesis (Annane 2017a; Polito 2011; Sharshar 2003), along with the cortisol response to exogenous adrenocorticotropin hormone (Annane 2017a; Hotta 1986; Jaattela 1991). Likewise, sepsis may be associated with alterations in scavenger receptor B1‐mediated cholesterol delivery (Cai 2008). This causes poor adrenal activity in almost half of patients (Annane 2000; Lipiner 2007; Marik 2008; Rothwell 1991), as well as possible resistance of body tissues to corticosteroids due to fewer corticosteroid receptors or receptors with lower affinity (Barnes 1995; Huang 1987; Meduri 1998a; Molijn 1995). Alteration of corticosteroid receptor numbers and in binding capacity may be related at least in part to nitric oxide (Duma 2004; Galigniana 1999). Recent work suggests that immune cells ‐ not steroid‐secreting cells ‐ are key regulators of the interaction between the immune system and the adrenals (Kanczkowski 2013). In addition, acute illness such as sepsis may be associated with decreased cortisol clearance from plasma (Boonen 2013; Melby 1958), likely resulting from altered hepatic and renal inactivation of cortisol (Boonen 2013). Early studies showed that a pharmacological dose of corticosteroids prolonged survival among animals with sepsis (Fabian 1982). More recent studies in rodents have demonstrated that lower doses of corticosteroids, for example, 0.1 mg/kg of dexamethasone, improved haemodynamic and organ function, favourably modulated the inflammatory response, and prolonged survival (di Villa Bianca 2003; Heller 2003; Tsao 2004; Vachharajani 2006). Protective effects of these glucocorticoids against sepsis may be mediated in part by the endothelial glucocorticoid receptor (Goodwin 2013). In healthy volunteers challenged with endotoxin, a low dose of corticosteroids, for example, 10 mg of prednisolone, blocked the release of pro‐inflammatory cytokines, prevented endothelial cell and neutrophil activation, and inhibited the acute phase response without altering coagulation and fibrinolysis balance (de Kruif 2007). Studies in patients with septic shock have shown that a short course of corticosteroids may result in a rebound in the systemic inflammatory response (Briegel 1994; Keh 2003). In addition, it is now recognized that increased pro‐inflammatory cytokine release can be sustained for longer than a week in patients with sepsis (Kellum 2007). Likewise, the timing of initiation of corticosteroids may be an important factor in the response to treatment. Indeed, in observational studies, short‐term mortality increased with delayed initiation of hydrocortisone (Katsenos 2014; Park 2012). For these reasons, we would anticipate that corticosteroid treatment is beneficial for patients with sepsis, and that differences in dose, timing, or duration of corticosteroid treatment may differentially affect patient response to treatment. Finally, several authors have argued that in patients with sepsis, hydrocortisone should be given as a continuous infusion rather than as intermittent boluses to reduce the risk of metabolic complications (Rhodes 2017). In sepsis trials, continuous infusion of hydrocortisone was variably associated with better outcomes or worse outcomes than intermittent intravenous boluses (Loisa 2007; Tilouche 2019).
Why it is important to do this review
Initially, researchers used high doses of corticosteroids, usually given as a single bolus, in an attempt to block potential bursts in pro‐inflammatory cytokines. Two systematic reviews and meta‐analyses of trials of corticosteroids in sepsis or in septic shock included 10 ‐ Lefering 1995 ‐ and nine ‐ Cronin 1995 ‐ randomized controlled trials (RCTs), respectively. These systematic reviews showed no significant effect on relative risk of death, gastrointestinal bleeding, or superinfection associated with the use of corticosteroids.
Subsequently, most clinicians will not recommend the use of high doses of corticosteroids in sepsis (Annane 2017b; Rhodes 2017). The potential benefits of a lower dose (≤ 400 mg hydrocortisone or equivalent per day) and a longer duration at full dose (≥ 3 days) of treatment have been investigated in numerous RCTs over the past three decades (Annane 2017b; Lamontagne 2018; Rochwerg 2018). In the past two years, clinical practice guidelines about corticosteroid use in sepsis have been released by at least five entities (Annane 2017b; Lamontagne 2018; Nishida 2018; Rhodes 2017; Tavaré 2017). All but one of the guidelines ‐ Lamontagne 2018 ‐ recommended against the use of corticosteroids in sepsis, except in patients with septic shock and a poor response to fluid replacement and vasopressor therapy. Some guidelines suggested that corticosteroids should be given as a continuous infusion rather than in intermittent boluses (Annane 2017b; Rhodes 2017). In the year 2018, five different systematic reviews and meta‐analyses addressed the effects of corticosteroids in sepsis (Allen 2018; Fang 2018; Ni 2018; Rochwerg 2018; Rygard 2018). The number of included trials was different in all reviews and ranged from 14 to 42. The risk ratio of death in the short term varied from 0.91 to 0.96, and the upper limit of the 95% confidence interval (CI) varied from 0.98 to 1.03. Another systematic review and meta‐analysis of one randomized trial and 17 observational studies examined the risk of acquired muscle weakness associated with exposure to corticosteroids in patients in the intensive care unit (ICU) (Yang 2018). This review found an odds ratio for acquired muscle weakness of 1.84 (95% CI 1.26 to 2.67) with corticosteroids compared to control.
Therefore, we aim to systematically review the effects of corticosteroids in children and adults with sepsis.
Objectives
To examine the effects of corticosteroids on death in children and adults with sepsis.
Methods
Criteria for considering studies for this review
Types of studies
We included randomized controlled trials (RCTs) with no methodological restrictions. We excluded quasi‐randomized trials (i.e. trials assigning patients to treatment arms based on systematic methods, such as alternation, assignment based on date of birth, case record number, and date of presentation).
Types of participants
We included children and adults with sepsis as defined by the Sepsis 3 criteria ‐ Singer 2016 ‐ or by the following criteria (ACCP/SCCM 1992; Vincent 2013).
-
Suspected or documented infection defined as culture or Gram stain of blood, sputum, urine, or normally sterile body fluid that is positive for a pathogenic micro‐organism; or a focus of infection identified by visual inspection (e.g. ruptured bowel with the presence of free air or bowel contents in the abdomen found at the time of surgery; wound with purulent drainage).
-
At least two symptoms of a systemic inflammatory response syndrome, such as fever (body temperature > 38°C) or hypothermia (< 36°C), tachycardia (> 90 beats per minute), tachypnoea (> 20 breaths per minute), or hyperventilation (arterial carbon dioxide tension (PaCO₂) < 32 mmHg), and abnormal white blood cell count (> 12,000 cells/mL or < 4000 cells/mL) or more than 10% immature band of neutrophils.
-
At least one sign of organ dysfunction, that is, metabolic acidosis, arterial hypoxaemia (arterial oxygen tension (PaO₂):fractional inspired oxygen (FiO₂) < 250 mmHg), oliguria (< 30 mL/h for ≥ 3 hours), coagulopathy, or encephalopathy.
Septic shock is defined by the presence of sepsis and of hypotension (persisting systolic arterial pressure < 90 mmHg) that is refractory to fluid resuscitation and requires vasopressor support (i.e. > 5 µg/kg of body weight per minute of dopamine or any dose of epinephrine or norepinephrine).
We included data from trials of community‐acquired pneumonia or acute respiratory distress syndrome (ARDS) when separate data were available for participants with sepsis, or when contact with study authors resulted in provision of the data.
Types of interventions
Corticosteroids versus placebo/usual care
Intervention
Systemic treatment was provided as any type of corticosteroid preparation (e.g. cortisone, hydrocortisone, methylprednisolone, betamethasone, dexamethasone).
Low‐dose corticosteroid treatment was defined by a total dose per day of 400 mg or less of hydrocortisone (or equivalent); otherwise, the dose of corticosteroid would be considered high. A long course for the intervention was defined by a full‐dose treatment duration of three or more days; otherwise, treatment was considered as a short course.
Control
Standard therapy was provided, which may have included antibiotics, fluid replacement, inotropic or vasopressor therapy, mechanical ventilation, or renal replacement therapy, or placebo.
Continuous infusion versus bolus administration of corticosteroids
Intervention
Continuous infusion was defined by intravenous infusion of corticosteroids with or without an initial loading dose.
Control
Bolus administration was defined by intermittent intravenous injections with duration less than 30 minutes.
Types of outcome measures
Primary outcomes
-
28‐Day all‐cause mortality
Indeed, this was the primary outcome measure in most of the RCTs on sepsis conducted since 1992 (Annane 2009b). Most studies performed before 1992 looked at 14‐day or hospital mortality rates. We used these data to compute the pooled analysis for 28‐day mortality, unless we could obtain actual 28‐day mortality rates from primary study authors.
Secondary outcomes
-
90‐Day all‐cause mortality
This was the primary outcome in the two most recent and largest trials on corticosteroids for sepsis.
-
Long‐term (longest available follow‐up beyond three months) all‐cause mortality
-
ICU all‐cause mortality
-
Hospital all‐cause mortality
In‐ICU and in‐hospital mortality outcomes provide the location of death, which adds context to the primary outcome.
-
Number of participants with shock reversal (as defined by stable haemodynamic status ≥ 24 hours after withdrawal of vasopressor therapy) at day seven and at day 28
-
Number of organs affected and severity of organ dysfunction at day seven, in individual patients, as measured by the SOFA score (Vincent 1996). This score scales from 0 (normal function) to 4 (most severe) the dysfunction of six organ systems (Respiration, Coagulation, Liver, Cardiovascular, Central nervous system, Renal). It ranges from 0 (no organ failure) to 24 (most severe organ dysfunction)
-
Length of stay in the ICU (for all participants and for survivors only). This outcome is expressed in mean (standard deviation (SD)) number of days, and is calculated by the difference between dates of ICU discharge and ICU admission, with first and last days of ICU stays counted as full ICU days regardless of the time of admission and time of discharge
-
Length of hospital stay (for all participants and for survivors only). This outcome is expressed in mean (SD) number of days, and is calculated by the difference between dates of hospital discharge and hospital admission, with first and last days of hospital stays counted as full hospital days regardless of time of admission and time of discharge
-
Adverse events (i.e. gastrointestinal bleeding, superinfection, hyperglycaemia, hypernatraemia, muscle weakness, neuropsychiatric events, stroke, cardiac events, or any other adverse effects or complications of corticosteroid treatment). Each adverse event is expressed as the number (%) of patients with at least one episode of this event, as defined in individual studies, except for hyperglycaemia and hypernatraemia. Whenever possible, hyperglycaemia was defined by values > 180 mg/dL, and hypernatraemia by values > 149 mmol/L.
Search methods for identification of studies
We attempted to identify all relevant studies regardless of language or publication status (e.g. published, unpublished, in press, in progress).
Electronic searches
We searched the Cochrane Central Register of Controlled Trials (CENTRAL; 2019 Issue 7), in the Cochrane Library, using the search terms 'sepsis', 'septic shock', 'steroids', and 'corticosteroids' (for the detailed search strategy, see Appendix 1).
We also searched (to 25 July 2019) MEDLINE ALL (Ovid SP), Embase (Ovid SP), and Latin American Caribbean Health Sciences Literature (LILACS), using the topic search terms in combination with the search strategy for identifying trials developed by Cochrane (Higgins 2011). (For detailed search strategies, see Appendix 2 (MEDLINE), Appendix 3 (Embase), and Appendix 4 (LILACS).)
Finally, we searched for ongoing RCTs (to 25 July 2019) at ClinicalTrials.gov, International Standard Randomized Controlled Trials Number (ISRCTN), and the World Health Organization (WHO) International Clinical Trials Registry Platform (ICTRP), using the search terms 'septic shock', 'sepsis', steroids', 'corticosteroids', 'adrenal cortex hormones', and 'glucocorticoids'.
Searching other resources
We checked the reference lists and citations of all trials and relevant systematic reviews identified by the electronic searches, and we contacted study authors to request additional published or unpublished data. We also searched the proceedings of annual meetings of major critical care medicine symposia, that is, Society of Critical Care Medicine, American Thoracic Society, International Symposium on Intensive Care and Emergency Medicine, American College of Chest Physicians, and European Society of Intensive Care Medicine (1998 to 2019).
Data collection and analysis
Selection of studies
All review authors checked the titles and abstracts identified during the search. All review authors examined, in full, any trial that potentially met the inclusion criteria. We decided which trials met the inclusion criteria. We resolved disagreements between review authors by discussion until we reached consensus. Review authors did not contribute to the decision for inclusion of trials in which they had participated.
One review author (DA) contacted study authors for clarification, when necessary.
Data extraction and management
One review author (DA) drew up a standard data extraction form, and four other review authors (PEB, JB, DK, YK) amended and validated the design of the form before data abstraction. Review authors (DA, PEB, JB, DK, RP, BR) independently extracted data, except those from trials in which they had participated.
One review author (DA) systematically contacted the authors of trials to request missing data when possible.
One review author (DA) and one member of this author’s research staff independently extracted and entered data into the computer. All review authors checked the accuracy of data entered against the original articles.
Assessment of risk of bias in included studies
We assessed risk of bias within individual trials as recommended by the Cochrane Handbook for Systematic Reviews of Interventions (Higgins 2011). We considered the following domains: selection bias, performance bias, detection bias, attrition bias, reporting bias, and any other bias. We judged selection bias on the basis of how the random sequence was generated, and how allocation was concealed. We judged performance bias and detection bias on the basis of who was blinded and how, among participants, caregivers, pharmacists, data collectors, outcome assessors, and data analysts (Devereaux 2001). In judging attrition bias, we considered how many participants were lost to follow‐up or were not included in analyses (and the reasons why). When available, we compared outcomes reported in trial protocols versus actual results reported, to identify potential selective reporting bias. We resolved disagreements between review authors by discussion until we reached consensus.
One review author (DA) contacted study authors for clarification, when necessary.
We assessed, independently and in duplicate (two of DA, BR, or RP), for each outcome of individual studies using a modified Cochrane risk of bias tool (Guyatt 2013), which classifies risk of bias as "low", "probably low", "probably high", or "high" for each of the following domains: sequence generation, allocation sequence concealment, blinding, selective outcome reporting, and other bias. We rated the overall risk of bias as the highest risk attributed to any criterion.
Review authors did not contribute to the assessment of risk of bias of any trial in which they had participated.
Measures of treatment effect
-
We performed intention‐to‐treat (ITT) analyses. We performed all statistical calculations using Review Manager 2014 or Stata 2015, as appropriate
-
We calculated a weighted treatment effect across trials. We expressed results as risk ratios (RRs) with 95% confidence intervals (CIs) for dichotomous outcomes, and as mean differences (MDs, 95% CIs) for continuous outcomes
Unit of analysis issues
In this review, we used data from trials in which the unit of randomization was the individual, and in which parallel groups were designed. For events that may occur repeatedly, such as receiving vasopressor therapy or staying in the ICU, we used only the first occurrence of the event.
When trials included more than two arms (e.g. comparing vs control two different corticosteroids or two different modes of administration of the same corticosteroid), we pooled data from the experimental arms for comparison of steroids versus control.
Dealing with missing data
We systematically tried to contact primary authors of original trials to obtain missing information and unpublished data. We obtained additional data from primary authors of 28 trials, including access to individual patient data for 16 trials (Appendix 5). This information is provided for each trial in the notes section of Characteristics of included studies.
For the primary outcome of this review (28‐day all‐cause mortality), we systematically contacted trial authors when needed to obtain data for participants who dropped out. When trials did not report 28‐day all‐cause mortality, and contact with trial authors failed to yield actual 28‐day mortality rates, we used available mortality data closest to 28 days.
When trials reported length of stay in the ICU or in hospital only as median and interquartile ratio (IQR), and when contact with trial authors failed to elicit means and SDs, we did not include these trials in the analysis.
Assessment of heterogeneity
We considered that evidence for significant heterogeneity was present when I² > 30%.
Assessment of reporting biases
We sought evidence of publication bias by using the funnel plot method. We used Stata 2015 to prepare a contour‐enhanced funnel plot (Peters 2008). This graphical analysis used the standard error of the log of the RR. We plotted contours illustrating the statistical significance of study effect estimates by using a two‐tailed test.
Data synthesis
We considered methods based on the random‐effects model for all analyses, except when we found no evidence for significant heterogeneity in the results (i.e. I² ≤ 30%). Indeed, we suspected that we would observe heterogeneity across studies, as they were conducted over a wide period of time (almost half a century between first and last trials) and the rationale on which studies were designed varied greatly over time, with marked differences in treatment strategies and in populations between studies conducted before and after the early 1990s.
Subgroup analysis and investigation of heterogeneity
To identify potential sources of heterogeneity, we sought, a priori, to conduct a subgroup analysis based on 'dose and duration', that is, a long course (≥ 3 days at full dose) of low‐dose (≤ 400 mg/d) hydrocortisone or equivalent. This subgroup analysis allowed evaluation of a strategy based on developments in our understanding of the role of corticosteroids in host response to sepsis, as tested in trials performed after 1992. Older trials used most often a short course (one to four bolus doses within 24 hours) of high‐dose corticosteroids (> 400 mg of hydrocortisone or equivalent), and trials conducted after 1992 used most often low‐dose corticosteroids at full dose over a longer period (≥ 3 days).
We also conducted a subgroup analysis based on the type of corticosteroids, the method of corticosteroid administration, intravenous bolus versus continuous infusion, and termination without versus with tapering off. To further explore the putative interaction between corticosteroid dose and duration and the magnitude of effect, we considered performing a meta‐regression analysis using 28‐day all‐cause mortality as the dependent variable, and dosage and duration of corticosteroids as predictors. We performed meta‐regression analyses using Stata 2015. We also tested, a priori, the interaction between baseline severity of illness and magnitude of effect in a meta‐regression analysis using mortality rates in controls as predictors. Finally, we conducted a subgroup analysis based on targeted population, sepsis, only septic shock, sepsis with ARDS, community‐acquired pneumonia, and sepsis with critical illness‐related corticosteroid insufficiency (Annane 2017a).
-
We assessed the validity of subgroup analyses on the basis of the following criteria.
-
Subgroup comparisons within rather than between studies.
-
Hypothesis preceding the analysis.
-
One of very few hypotheses.
-
Large and consistent differences across studies.
-
External evidence supporting the results (Guyatt 2008b).
-
When subgroup analyses met these criteria and were found to be statistically significant, we applied GRADE criteria to evaluate the certainty of evidence (GRADEpro GDT 2015; Guyatt 2008a).
Sensitivity analysis
We conducted sensitivity analyses based on generation of allocation sequence, concealment of allocation, and blinding, and for trials judged at low risk of bias.
'Summary of findings' table and GRADE
For assessment of the overall certainty of evidence for each outcome that included pooled data from RCTs only, we downgraded the evidence from "high certainty" by one level for serious (or by two for very serious) study limitations (according to risk of bias evaluation), indirectness of evidence, serious inconsistency (i.e. when I² > 30%), imprecision of effect estimates (large 95% confidence intervals or small treatment effects), or potential publication bias.
We exported data from Review Manager 5 to GRADEpro GDT 2015 to create 'Summary of findings' tables. We included the following patient‐centred outcomes in the 'Summary of findings' tables.
-
28‐Day all‐cause mortality.
-
In‐hospital all‐cause mortality.
-
Long‐term (longest follow‐up beyond three months) all‐cause mortality.
-
Length of stay in the ICU.
-
Length of hospital stay.
-
Number of participants with superinfection up to longest follow‐up.
-
Number of participants with muscle weakness up to longest follow‐up.
Results
Description of studies
Results of the search
Our search results are detailed in Figure 1.

Study flow diagram.
The search strategy yielded 98 trials that evaluated corticosteroids in sepsis, of which we excluded 28 trials (see Characteristics of excluded studies). Nine trials are still ongoing (see Characteristics of ongoing studies).
Included studies
Since the last update in 2015 (see Published notes), we have included 28 additional trials for a total of 61 trials (n = 12,192 participants); we have described these below (see Characteristics of included studies).
Source of information
In addition to data extracted from these publications, we obtained unpublished information from 28 trials by contacting the primary authors (Appendix 5). We did not contact the authors of 10 trials, mainly because of the absence of contact details (Characteristics of included studies). For the remaining trials, contact with study authors did not lead to the provision of additional information (Characteristics of included studies).
Trial centres
Twenty trials were multi‐centre trials (i.e. > 2 centres) (Characteristics of included studies). Twenty‐four trials were conducted in Europe, 11 in North America, 12 in Asia, five in the Middle East, five in Africa, and one in Latin America, and three multi‐national trials were conducted in North America and Africa (Slusher 1996), in Europe and the Middle East (Sprung 2008), and in Australia, New Zealand, Europe, and the Middle East (Venkatesh 2018) (Characteristics of included studies).
Age of participants
Two trials enrolled both children and adults (CSG 1963; McHardy 1972). Six trials included only children (El‐Nawawy 2017; Menon 2017; Nagy 2013; Slusher 1996; Tagaro 2017; Valoor 2009). All of the remaining trials included only adults.
Description of participants
Eleven trials included both participants with sepsis and individuals with septic shock. Four trials included participants with sepsis without shock (Fernández‐Serrano 2011; Keh 2016; Rinaldi 2006; Sabry 2011). Fifteen trials targeted participants with community‐acquired pneumonia‐related sepsis. Five trials focused on participants with ARDS and sepsis (Liu 2012; Meduri 2007; Rezk 2013; Tongyoo 2016; Zhou 2015). The remaining trials focused on participants with septic shock treated by a vasopressor. Three trials included only participants with septic shock and adrenal insufficiency as defined by a cortisol increment less than 9 µg/dL after a corticotropin bolus (Aboab 2008; Huh 2007; Tandan 2005). In 18 trials, investigators systematically performed a short corticotropin test at baseline.
Control
Comparison of corticosteroids versus placebo or usual care
Nine studies did not use a placebo and compared corticosteroid therapy versus usual care, that is, antibiotics, fluid resuscitation, and vasopressor when needed (El Ghamrawy 2006; Hu 2009; Huang 2014; Li 2016; McHardy 1972; Mirea 2014; Rinaldi 2006; Sui 2013; Zhou 2015). In one study, only one centre used a placebo (Sprung 1984). One trial that compared hydrocortisone versus hydrocortisone plus fludrocortisone did not use a placebo of fludrocortisone for technical reasons (Annane 2010). Another trial compared duration of hydrocortisone treatment (i.e. 3 days vs 7 days) and did not use a placebo (Huh 2007). The remaining trials compared corticosteroid therapy to placebo.
Comparison of continuous infusion versus intermittent intravenous boluses of corticosteroids
Three trials compared continuous infusion versus bolus administration of hydrocortisone (Hyvernat 2016; Loisa 2007; Tilouche 2019). One trial had three parallel arms including continuous infusion of 200 mg hydrocortisone daily for seven days, intravenous bolus of 50 mg hydrocortisone every six hours for seven days, and usual care (Mirea 2014).
Corticosteroid dose and treatment course
Thirty‐seven trials tested the effects of a long‐course (three or more days at full dose) of low‐dose hydrocortisone. In one trial (Huh 2007), investigators compared hydrocortisone 50 mg intravenously every six hours when given for three days versus seven days. One trial had three parallel groups including continuous infusion of 200 mg hydrocortisone per day for seven days, intravenous bolus of 50 mg hydrocortisone every six hours for seven days, and usual care (Mirea 2014). In three trials, investigators compared continuous infusion versus intermittent intravenous boluses of hydrocortisone (Hyvernat 2016; Loisa 2007; Tilouche 2019). Another trial compared seven‐day treatment with hydrocortisone versus seven‐day treatment with the combination of hydrocortisone plus fludrocortisone (Annane 2010). One trial compared a short course (two days at full dose) of low‐dose intravenous hydrocortisone (300 mg on day one and 250 mg on day two) versus placebo (CSG 1963). Another study used a cross‐over design to compare a three‐day course of low‐dose hydrocortisone versus placebo (Keh 2003).
Five trials tested the effects of a long course of low‐dose prednisone or prednisolone (Blum 2015; McHardy 1972; Snijders 2010; Yildiz 2002; Yildiz 2011).
Two trials tested the effects of a long course of low‐dose dexamethasone (Cicarelli 2007; Meijvis 2011). Two trials tested the effects of a short course (two days at full dose) of low‐dose dexamethasone (Slusher 1996; Tagaro 2017).
Eight studies tested the effects of a long course of low‐dose intravenous methylprednisolone (Fernández‐Serrano 2011; Li 2016; Meduri 2007; Nagy 2013; Rezk 2013; Sui 2013; Torres 2015; Zhou 2015).
Five trials tested the effects of a short course of a large dose of methylprednisolone (Bone 1987; Luce 1988; Schumer 1976; Sprung 1984; VASSCSG 1987), and two tested the effects of a large dose of dexamethasone (Schumer 1976; Sprung 1984).
One trial did not report the type of corticosteroids given (Kurungundla 2008).
Outcomes
Overall, data from 52 trials was used to inform 28‐day mortality rates. One trial (Mirea 2014) provided data for both comparison of corticosteroids versus placebo or usual care and comparison of continuous infusion versus bolus administration of corticosteroids. Two trials ( Hyvernat 2016;Tilouche 2019) provided data for the comparison of continuous infusion versus bolus administration of corticosteroids. Fifty trials were used in the comparison of corticosteroids versus placebo or usual care. Of these trials, 29 explicitly reported on 28‐day mortality and contact with the primary author of three additional trials led to recording of 28‐day mortality rates (Meduri 2007; Rinaldi 2006; Sprung 1984). Thus, actual 28‐day mortality rates were computed for 32 trials. For 18 additional trials, 28‐day mortality rates were extrapolated from hospital mortality rates (Aboab 2008, El Ghamrawy 2006,Fernández‐Serrano 2011, Luce 1988, McHardy 1972, Menon 2017,Nafae 2013, Schumer 1976, Slusher 1996, Torres 2015), ICU mortality rates (Hu 2009, Sabry 2011), 14‐day mortality rates (Bone 1987, VASSCSG 1987), and short term mortality rates (Kurungundla 2008, Mirea 2014, Nagy 2013, Rezk 2013).
Sixteen trials explicitly reported ICU mortality rates, and the primary authors of three additional trials reported this outcome (Chawla 1999; Rinaldi 2006; Torres 2015).
Hospital mortality rates were available for 26 trials.
Mortality rates at 90 days and in the long term were reported for seven trials.
Rates of shock reversal at day seven and at day 28 were reported in 16 and 13 trials, respectively.
Ten trials reported the numbers of dysfunctional organs, that is, SOFA scores, at day seven.
Twenty‐one trials reported length of ICU stay, and 22 reported on length of hospital stay.
Excluded studies
We excluded 28 trials (see Characteristics of excluded studies for details).
Ongoing studies
From trial registries, we identified nine additional RCTs of corticosteroids for sepsis (see Characteristics of ongoing studies). These trials are still recruiting patients, and we will follow the status of these trials to include them in a future update of the review whenever data become publicly available.
Studies awaiting classification
We found no studies awaiting classification
Risk of bias in included studies
We reported the detailed methodological quality of individual trials in the 'Risk of bias' tables in Figure 2 and Appendix 6.

Methodological quality summary: review authors' judgements about each methodological quality item for each included study.
We judged 19 trials as being at low risk of bias, that is, we assessed them as having low risk of bias for the five domains (allocation, blinding, incomplete data, selective reporting, and other potential sources of bias).
Allocation
Random sequence generation
In one trial, the method of generation of allocation sequence was based on a card system (Schumer 1976); we judged this trial to be at high risk of selection bias. For 16 trials, the method was unclear. We judged the remaining trials to have low risk of bias.
Allocation concealment
We judged the method used for allocation concealment to be at low risk of bias in all but 10 trials. One trial assigned treatment using unsealed envelopes (Schumer 1976). In another trial, investigators enrolling participants at one of the two participating centres could have foreseen the upcoming assignment, as the local ethical committee refused to accept concealed allocation (Sprung 1984). In 20 trials, study authors did not report the method used for allocation concealment.
Blinding
Blinding of participants and personnel
For 13 trials, we judged the method used for blinding of participants and personnel as having high risk of bias. Twelve trials used open‐label treatments. For one trial (Sprung 1984), the local ethical committee at one of the two centres did not permit double‐blind allocation and administration of treatment. Therefore, blinding was not possible for 40 of the 59 participants included in the trial.
Eleven additional trials did not report the method used to ensure blinding.
For the remaining trials, blinding of participants and personnel was deemed appropriate. We judged these trials to be at low risk of bias for this domain.
Blinding of outcomes assessors
In 12 trials, outcome assessors were not blinded to study treatments. We judged these trials to be at high risk of detection bias.
Twelve trials did not report any information that could be used to judge the risk of detection bias.
For the remaining trials, blinding of outcomes assessors was deemed appropriate. We judged these trials to be at low risk of bias for this domain.
Incomplete outcome data
Twenty‐eight trials explicitly provided the numbers of and reasons for withdrawals or losses to follow‐up.
Nineteen trials explicitly reported the use of intention‐to‐treat analysis (as the primary analysis) and the numbers of, and reasons for, non‐adherence to the protocol. One trial reported only use of intention‐to‐treat analysis (Luce 1988). The remaining trials provided no information about these criteria. However, the number of analysed participants matched the number of randomly assigned participants, except for 16 trials. One trial did not include one of 191 participants in the placebo group in the mortality analysis (Bone 1987). In four trials (Annane 2002; Lv 2017; Sprung 2008; Tongyoo 2016), participants withdrew their consent, and study authors did not include in the analyses one of 300, two of 120, one of 500, and nine of 206 randomly assigned participants, respectively. For two trials, contact with the primary author allowed us to obtain information on participants who were dropped out from the analysis (Oppert 2005; Rinaldi 2006). In the first study, seven randomly assigned participants (five in the corticosteroid group and two in the placebo group) were not analysed (Oppert 2005). Four of these participants (two in the corticosteroid group and two in the placebo group) were discharged alive from the ICU and then were lost to follow‐up. The three remaining participants (in the corticosteroid group) died: two before receiving hydrocortisone, and the last at study day 17. In the second study, 12 of 52 participants dropped out of the study: six in the control group and six in the corticosteroid group (Rinaldi 2006). Nine participants (four in the control group) were excluded, as they developed renal failure. Two control participants died in the ICU at day five and at day seven, respectively. Three of the corticosteroid‐treated participants died, at days 5, 6, and 28, respectively. Three other participants (two in the control group) were excluded, as they developed septic shock. All died at days 3, 5, and 6, respectively.
Two trials gave additional open‐label corticosteroids to some participants (Gordon 2014; Snijders 2010). In the first trial, five (23.3%) participants in the placebo arm were given rescue corticosteroids for treatment of life‐threatening hypotension and were considered as cross‐overs (Gordon 2014). In the second trial, 37 (17.4%) participants did not complete the full course of study treatment as a consequence of premature death of 10 participants, consent withdrawal for five participants, post‐randomization exclusion for eight participants, and additional open‐label corticosteroid treatment for 14 participants (Snijders 2010). In seven trials, from 4% to 20% were withdrawn from the primary analysis for various reasons that were explained in the trial report (Blum 2015; Fernández‐Serrano 2011; Keh 2016; Gordon 2016; Menon 2017; Tilouche 2019; Venkatesh 2018).
Selective reporting
For 34 trials, we could rule out selective reporting bias after contact with authors, full access to trial protocols, or access to individual participant data. We judged these trials to be at low risk of bias for this domain.
Seventeen trials were published before it was mandatory to register trials in an open access repository, and we have had no access to trial protocols. We judged these trials as having unclear risk of selective reporting bias. For the remaining trials, we could not obtain access to protocols, we could not find trials on an open access registry, and our attempts to contact trial authors failed.
Other potential sources of bias
One trial recruited only 500 of the 800 expected participants, mainly as the result of loss of equipoise among investigators (Sprung 2008). Another trial was halted prematurely for futility after enrolment of 75 of 150 foreseen participants (Arabi 2011).
No trials used the Sepsis 3 definition as all were designed before publication of the new definition for sepsis (Singer 2016). Thirty trials provided an explicit definition of sepsis (as defined in the Methods section of this review). Seven trials provided a definition of septic shock without referring to the need for vasopressor agents (Bone 1987; Luce 1988; Rinaldi 2006; Schumer 1976; Slusher 1996; VASSCSG 1987; Yildiz 2002). One study did not explicitly provide the definition used for sepsis (CSG 1963). Eleven trials explicitly defined sepsis due to community‐acquired pneumonia. Two trials randomly assigned participants on the basis of the presence of ARDS, and data provided in these papers confirmed the presence of sepsis (Liu 2012; Rezk 2013). In another trial on early ARDS, contact with the primary author confirmed that explicit definitions of sepsis were used (Meduri 2007).
Effects of interventions
We did not pool the data from one trial that included both children and adults (CSG 1963), one cross‐over trial (Keh 2003), one trial that compared two durations of hydrocortisone treatment (Huh 2007), and one trial that compared hydrocortisone versus the combination of hydrocortisone plus fludrocortisone (Annane 2010).
In this update, we introduced a new comparison (i.e. continuous infusion vs intermittent boluses of steroids).
Corticosteroids versus placebo or usual care
We have summarized the main results in summary of findings Table for the main comparison.
Primary outcome
28‐Day all‐cause mortality
Data for 28‐day mortality were available for 32 trials. In addition, we used data on 14‐day mortality (two trials), hospital mortality (10 trials), or ICU mortality (2 trials), or data on short‐term mortality (four trials). Thus, we computed data from 50 trials that accounted for 11,233 participants. In the treated group, 1388 of 5667 participants died by day 28 compared with 1469 of 5566 participants in the control group. Some heterogeneity was evident in the results (Chi² test = 68.06; P = 0.03; I² = 29%). The risk ratio (RR) of dying at 28 days was 0.91 (95% confidence interval (CI) 0.84 to 0.99; P = 0.04; random‐effects model; Analysis 1.1). We downgraded the certainty of evidence for this outcome from high to moderate for inconsistency (significant heterogeneity across trial results).
Differences in methodological quality across trials may have accounted for observed heterogeneity in the results. A sensitivity analysis based on trials judged as being at low risk of bias showed an RR for dying at 28 days of 0.91 (95% CI 0.84 to 0.98; P = 0.01; 7896 participants; 17 studies; I² = 0%; Analysis 1.2).
Heterogeneity across trials also may have been the result of different therapeutic regimens. Subgroup analyses based on types of corticosteroids did not suggest that this may influence the response to treatment (test for subgroup differences: Chi² = 1.48; df = 3; P = 0.69; I² = 0%; Analysis 1.3). Likewise there was no evidence that dose/duration (test for subgroup differences: Chi² = 0.29; df = 1; P = 0.59; I² = 0%; Analysis 1.4) or mode (continuous vs intermittent bolus) of corticosteroid administration (test for subgroup differences: Chi² = 0.41; df = 1; P = 0.52; I² = 0%; Analysis 1.5) influences the response to treatment. Meta‐regression analyses showed no evidence of interaction between the RR for dying at 28 days and the dose given at day 1 (P = 0.14; Figure 3), total dose (P = 0.12; Figure 4), or duration of treatment (P = 0.86). One trial of a large dose of corticosteroids was a statistical outlier and was excluded from the meta‐regression analysis (Schumer 1976).

Figure represents the results from meta‐regression of log of risk ratio of dying and the dose of corticosteroids given at day 1 and expressed as equivalent milligrams of hydrocortisone. Estimates from each study are represented by circles. Circle sizes depend on the precision of each estimate (the inverse of its within‐study variance), which is the weight given to each study in the fixed‐effect model.
Meta‐regression included 53 trials.
REML estimate of between‐study variance: tau² = .008551.
% residual variation due to heterogeneity: I² res = 28.86%.
Proportion of between‐study variance explained: Adj R² = 43.76%.

Figure represents results from meta‐regression of log of risk ratio of dying and log of cumulated dose of corticosteroids expressed as equivalent milligrams of hydrocortisone. Estimates from each study are represented by circles. Circle sizes depend on the precision of each estimate (the inverse of its within‐study variance), which is the weight given to each study in the fixed‐effect model.
Meta‐regression included 53 trials.
REML estimate of between‐study variance: tau² = .008628.
% residual variation due to heterogeneity: I² res = 28.68%.
Proportion of between‐study variance explained: Adj R² = 43.25%.
By contrast, trials in which corticosteroids were not tapered off found an RR of dying at 28 days of 0.87 (95% CI 0.78 to 0.98; 8770 participants; 30 studies; I² = 42%; random‐effects model) in favour of corticosteroids, whereas trials in which corticosteroids were tapered off found no evidence of mortality differences between groups (RR 1.04, 95% CI 0.92 to 1.18; P = 0.54; 2136 participants; 17 studies; I² = 0%) (test for subgroup differences: Chi² = 3.94; df = 1; P = 0.05; I² = 74.6%; Analysis 1.6).
Heterogeneity across trials may have resulted from factors related to participants. There was no evidence of differences in response to treatment between children and adults (test for subgroup differences: Chi² = 0.29; df = 1; P = 0.62; I² = 0%; Analysis 1.7). Subgroup analysis based on targeted populations showed non‐significant subgroup differences (test for subgroup differences: Chi² = 7.60; df = 3; P = 0.06; I² = 60.5%; Analysis 1.8). In studies of heterogeneous populations of participants with sepsis, the RR for dying at 28 days was 1.17 (95% CI 0.98 to 1.39; P = 0.09; 1358 participants; 10 studies; I² = 25%; fixed‐effect model). In studies of only participants with septic shock, the RR for dying at 28 days was 0.91 (95% CI 0.83 to 1.00; P = 0.06; 7428 participants; 23 studies; I² = 32%; random‐effects model). In studies of participants with sepsis and ARDS, the RR was 0.66 (95% CI 0.46 to 0.94; P = 0.02; 411 participants; 4 studies; I² = 8%; fixed‐effect model), and in studies of participants with sepsis and community‐acquired pneumonia, the RR was 0.69 (95% CI 0.50 to 0.96; P = 0.03; 2038 participants; 13 studies; I² = 0%; fixed‐effect model). Likewise, meta‐regression showed no evidence of interaction between the RR of dying at 28 days and severity of illness as assessed by crude mortality in the control arm (P = 0.29; Figure 5). Subgroup analysis of participants with adrenal insufficiency showed no heterogeneity in the results. Investigators reported 251 deaths among 525 participants in the treated group and 291 deaths among 554 in the placebo group. The RR for dying was 0.92 (95% CI 0.82 to 1.03; P = 0.16; 1079 participants; 12 studies; I² = 0%; fixed‐effect model; Analysis 1.9).
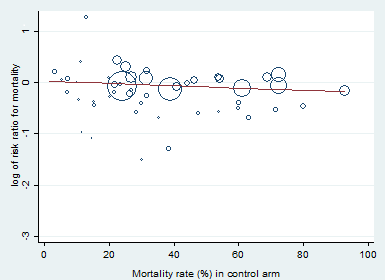
Meta‐regression of the log of the risk ratio for 28‐day mortality against actual mortality at 28 days in the control arm.
Funnel plot analysis, including all trials, suggested some asymmetry (Figure 6). Contour‐enhanced funnel plot analysis including trials of a long course of low‐dose corticosteroids suggested no significant asymmetry (Figure 7).
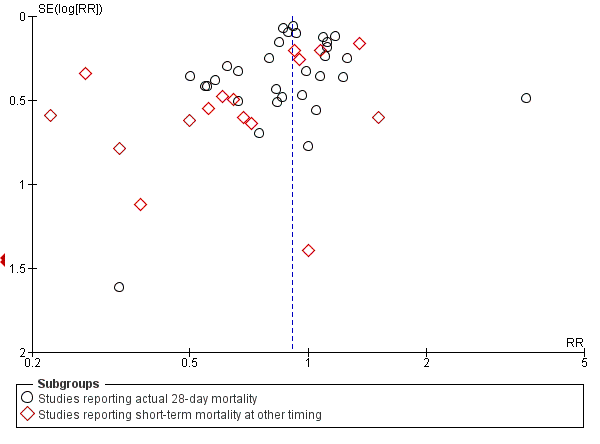
Funnel plot of comparison: 1 Steroids vs control, outcome: 1.1 28‐Day all‐cause mortality.
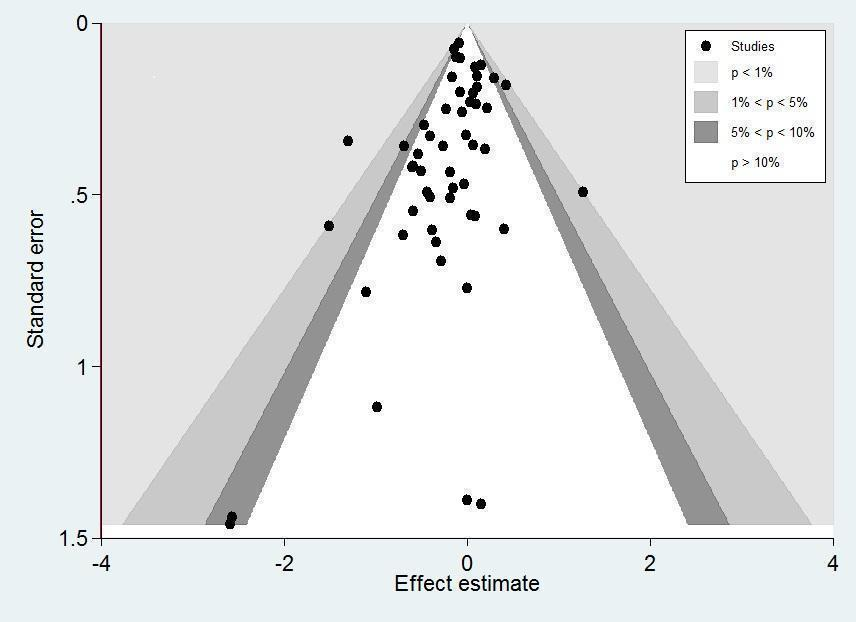
Contour‐enhanced funnel plot.
Log of risk ratio for 28‐day mortality is plotted against its standard error.
In one trial comparing hydrocortisone alone versus hydrocortisone plus fludrocortisone, the hazard ratio of death was 0.94 (95% CI 0.73 to 1.21; Annane 2010).
Secondary outcomes
90‐Day all‐cause mortality
We could extract data on 90‐day mortality from seven trials. A total of 961 of 2975 participants in the treated group and 1026 of 2959 in the control group died within 90 days. The RR of dying within 90 days was 0.93 (95% CI 0.87 to 1.00; P = 0.05; 5934 participants; 7 studies; I² = 0%; fixed‐effect model; Analysis 1.10) in favour of the corticosteroid group. This was based on moderate‐certainty evidence (lowered for imprecision).
Long‐term mortality
We could extract data on mortality beyond three months for seven trials. The RR of dying was 0.97 (95% CI 0.91 to 1.03; P = 0.29; 6236 participants; 7 studies; I² = 28%; Analysis 1.11). We downgraded the certainty of evidence to low owing to inconsistency in results and imprecision.
Intensive care unit (ICU) mortality
Data were available from 18 trials, accounting for 7267 participants. All of these trials investigated a long course of low‐dose corticosteroids. A total of 908 of 3636 participants in the treated group and 1015 of 3631 participants in the control group died in the ICU. There was little heterogeneity in the results (Chi² = 19.18; df = 17; P = 0.32; I² = 11%). The RR for dying in the ICU was 0.89 (95% CI 0.83 to 0.96; fixed ‐effect model; Analysis 1.12). This was based on high‐certainty evidence.
Hospital mortality
We could extract data on hospital mortality from 26 trials that accounted for 8183 participants. A total of 1223 of 4109 participants in the treated group compared with 1315 of 4074 in the control group died in hospital. Heterogeneity in the results was significant (Chi² = 39.58; df = 25; P = 0.03; I² = 37%). The RR for dying in hospital was 0.90 (95% CI 0.82 to 0.99; P = 0.03; random‐effects model; Analysis 1.13). We downgraded the certainty of evidence for this outcome from high to moderate for inconsistency.
Number of participants with shock reversal (as defined by stable haemodynamic status ≥ 24 hours after withdrawal of vasopressor therapy) at day 7
We could extract data from 16 trials that accounted for 6711 participants. A total of 2642 of 3361 participants in the treated group and 2168 of 3350 in the control group had shock reversed at day 7. Significant heterogeneity was evident in the results (Chi² = 43.87; df = 15; P = 0.0001; I² = 66%). The RR for having shock reversed at day 7 was 1.23 (95% CI 1.13 to 1.34; P < 0.0001; random‐effects model) in favour of the corticosteroid group (Analysis 1.14). This was based on moderate‐certainty evidence (lowered for inconsistency).
Sensitivity analysis excluding the two trials that evaluated a short course of high‐dose corticosteroids did not reduce heterogeneity in the results (RR 1.26, 95% CI 1.16 to 1.37; 6408 participants; 16 studies; I² = 59%) (Bone 1987; Sprung 1984).
In one cross‐over trial, hydrocortisone was given for three days at a dose of 240 mg per day (Keh 2003). Although this trial could not provide information on shock reversal at day 7, investigators showed that at day 3, fewer hydrocortisone patients than placebo‐treated patients required norepinephrine treatment (6/20 vs 14/20; P = 0.025).
Number of participants with shock reversal (as defined by stable haemodynamic status ≥ 24 hours after withdrawal of vasopressor therapy) at day 28
We could extract data from 13 trials, accounting for 6753 participants. A total of 2767 of 3382 participants in the treated group had shock reversed at day 28, as did 2629 of 3397 in the placebo group. No heterogeneity was evident in the results (I² = 0%). The RR for having shock reversed was 1.06 (95% CI 1.03 to 1.08; P < 0.00001) in favour of the corticosteroid group (Analysis 1.15). This was based on high‐certainty evidence.
Number of organs affected and severity of organ dysfunction at day 7, as measured by the sequential organ failure assessment (SOFA) score
Ten studies (2157 participants) reported the SOFA score at seven days post randomization. The mean difference (MD) in the SOFA score at day 7 was ‐1.37 (95% CI ‐1.84 to ‐0.90; P < 0.00001; random‐effects model) in favour of corticosteroids. Moderate heterogeneity across studies was noted (Chi² = 17.03; df = 9; P = 0.05; I² = 47%; Analysis 1.16). This was based on moderate‐certainty evidence (lowered for inconsistency).
In one study (Briegel 1999), corticosteroid treatment was associated with a non‐significant (P = 0.18) trend toward earlier resolution of organ dysfunction.
Length of stay in the intensive care unit
For all participants
In 21 trials (7612 participants), the MD for ICU length of stay for all participants was ‐1.07 days (95% CI ‐1.95 to ‐0.19; P = 0.02; random‐effects model) in favour of the corticosteroid group, with some heterogeneity evident across studies (Chi² = 31.49; df = 20; P = 0.05; I² = 36%; Analysis 1.17). We judged the certainty of evidence for this outcome as high. There was some heterogeneity in the results. However, the treatment effect was large.
For survivors only
We could extract data from 10 trials on 778 ICU survivors. The MD for ICU length of stay among these survivors was ‐2.19 days (95% CI ‐3.93 to ‐0.46; P = 0.01; fixed‐effect model). No heterogeneity was evident across studies (Chi² test = 8.63; P= 0.47; I² = 0%; Analysis 1.18).
Length of hospital stay
For all participants
From 22 trials (8795 participants), we could extract data on all participants. We noted heterogeneity in the results (heterogeneity: Chi² = 51.44; df = 201; P = 0.0002; I² = 59%). The MD for length of hospital stay for all participants was ‐1.63 days (95% CI ‐2.93 to ‐0.33 ; P = 0.01; random‐effects model; Analysis 1.19). We judged the certainty of evidence for this outcome as high. There was some heterogeneity in the results. However, the treatment effect was large.
For survivors only
We could extract data for hospital survivors from nine studies (710 participants). We noted some heterogeneity in the results (I² = 43%). No evidence suggested a difference between the two groups (MD ‐4.11 days, 95% CI ‐8.50 to 0.28; P = 0.07; random‐effects model; Analysis 1.20).
Adverse events
Gastroduodenal bleeding
We could extract data from 25 trials (5171 participants). A total of 131 of 2607 participants in the treated group and 120 of 2564 in the control group had an episode of gastroduodenal bleeding. We noted no heterogeneity in the results (I² = 0%). The RR for having gastroduodenal bleeding was 1.07 (95% CI 0.85 to 1.35; P = 0.55; fixed‐effect model; Analysis 1.21). We judged this to be based on moderate‐certainty evidence (lowered due to imprecision).
Superinfection
We could extract data from 25 trials (5356 participants). A total of 487 of 2695 participants in the treated group and 451 of 2661 participants in the control group had an episode of nosocomial infection. We noted no heterogeneity in the results (Chi² = 20.66; df = 21; P = 0.48; I² = 0%). The RR for superinfection was 1.06 (95% CI 0.95 to 1.19; P = 0.27; fixed‐effect model; Analysis 1.21). We judged the certainty of evidence as moderate for this outcome (lowered for imprecision).
Hyperglycaemia
The number of participants who presented with hyperglycaemia was reported for 20 trials (8594 participants). There was heterogeneity in the results (Chi² = 35.96; df = 17; P = 0.005; I² = 53%). The RR for hyperglycaemia was 1.20 (95% CI 1.10 to 1.31; P < 0.00001; random‐effects model; Analysis 1.21). This was based on moderate‐certainty evidence (lowered for inconsistency).
One trial comparing tight glucose control versus standard care found no benefit in normalizing blood glucose levels among corticosteroid‐treated septic shock participants (Annane 2010).
Hypernatraemia
The number of participants who presented with hypernatraemia was reported for six trials (5069 participants). We noted no heterogeneity in the results (Chi² = 4.45; df = 5; P = 0.49; I² = 0%). The RR for hypernatraemia was 1.66 (95% CI 1.34 to 2.06; P < 0.00001; fixed‐effect model; Analysis 1.21). This was based on high‐certainty evidence.
Muscle weakness
The number of participants who presented with muscle weakness was reported for six trials (6145 participants). There was little to no heterogeneity in the results (Chi² = 5.42; df = 5; P = 0.37; I² = 8%). The RR for muscle weakness was 1.21 (95% CI 1.01 to 1.44; P = 0.04; fixed‐effect model; Analysis 1.21) in favour of the control group. We judged the certainty of evidence as high for this outcome.
Neuropsychiatric events
The number of participants who presented with neuropsychiatric events was reported for eight trials (6941 participants). There was some heterogeneity in the results (Chi² = 9.93; df = 7; P = 0.19; I² = 30%). The RR for neuropsychiatric events was 1.15 (95% CI 0.52 to 2.57; P = 0.73; random‐effects model; Analysis 1.21). This was based on low‐certainty evidence (lowered for imprecision and inconsistency).
Stroke
The number of participants who presented with stroke was reported for four trials (2842 participants). There was no heterogeneity in the results (Chi² = 1.66; df = 3; P = 0.64; I² = 0%). The RR for stroke was 0.83 (95% CI 0.41 to 1.68; P = 0.73; fixed‐effect model; Analysis 1.21). This was based on moderate‐certainty evidence (lowered for imprecision).
Cardiac events
The number of participants who presented with cardiac events was reported for six trials (3567 participants). There was no heterogeneity in the results (Chi² = 3.51; df = 5; P = 0.62; I² = 0%). The RR for acute coronary events was 1.12 (95% CI 0.66 to 1.88; P = 0.68; fixed‐effect model; Analysis 1.21). This was based on moderate‐certainty evidence (lowered for imprecision).
Continuous infusion versus intermittent bolus of corticosteroids
We have summarized the main results in Table 1.
| Continuous infusion compared to bolus administration of corticosteroids for children and adults with sepsis | ||||||
| Patient or population: children and adults with sepsis | ||||||
| Outcomes | Anticipated absolute effects* (95% CI) | Relative effect | № of participants | Certainty of the evidence | Comments | |
| Risk with bolus administration of corticosteroids | Risk with continuous infusion | |||||
| 28‐Day all‐cause mortality | Study population | RR 1.03 | 310 | ⊕⊝⊝⊝ | Evidence is very uncertain about the effect of continuous infusion on 28‐day all‐cause mortality | |
| 444 per 1000 | 457 per 1000 | |||||
| Long‐term mortalityc | Study population | RR 1.36 | 70 | ⊕⊝⊝⊝ | Evidence is very uncertain about the effect of continuous infusion on long‐term mortality | |
| 636 per 1000 | 865 per 1000 | |||||
| Hospital mortality | Study population | RR 0.95 | 240 | ⊕⊝⊝⊝ | Evidence is very uncertain about the effect of continuous infusion on hospital mortality | |
| 458 per 1000 | 435 per 1000 | |||||
| Length of intensive care unit stay for all participants in days | Mean length of intensive care unit stay for all participants was 13 days | MD 1.05 lower | ‐ | 310 | ⊕⊝⊝⊝ | Evidence is very uncertain about the effect of continuous infusion on length of intensive care unit stay for all participants |
| Length of hospital stay for all participants in days | Mean length of hospital stay for all participants was 17 days | MD 0.01 higher | ‐ | 310 | ⊕⊝⊝⊝ | Evidence is very uncertain about the effect of continuous infusion on length of hospital stay for all participants |
| Number of participants with adverse events ‐ superinfection (up to longest follow‐up) | Study population | RR 1.12 | 193 | ⊕⊝⊝⊝ | Evidence is very uncertain about the effect of continuous infusion on number of participants with adverse events ‐ superinfection | |
| 204 per 1000 | 229 per 1000 | |||||
| Number of participants with adverse events ‐ muscle weakness (up to longest follow‐up) | Study population | RR 0.89 | 70 | ⊕⊕⊝⊝ | Evidence suggests that continuous infusion may result in little to no difference in the number of participants with adverse events ‐ muscle weakness | |
| 61 per 1000 | 54 per 1000 | |||||
| *The risk in the intervention group (and its 95% confidence interval) is based on the assumed risk in the comparison group and the relative effect of the intervention (and its 95% CI). The unit of measure for length of stay is days. | ||||||
| GRADE Working Group grades of evidence. | ||||||
aDowngraded one level as only one of the four trials was judged as having low risk of bias.
bDowngraded one level as trials were small and the 95% confidence interval was large.
dDowngraded one level as the only trial reporting this outcome was open‐labelled and at high risk of performance bias.
eDowngraded one level as only one trial reported this outcome.
fDowngraded one level as the observed increase in risk of dying in the long term is not consistent with treatment effects on 28‐day mortality.
gDowngraded one level as results show some heterogeneity.
hDowngraded two levels as heterogeneity in the results is strong.
cLong‐term mortality was assessed up to six months.
Primary outcome
28‐Day all‐cause mortality
Data for 28‐day mortality were available for three trials accounting for 310 participants. There was no heterogeneity in the results (Chi² = 1.94; df = 2; P = 0.38; I² = 0%). A total of 73 of 159 participants in the continuous infusion group and 67 of 151 participants in the intermittent bolus group died at 28 days. The RR of dying at 28 days was 1.03 (95% CI 0.81 to 1.31; P = 0.82; fixed‐effect model; Analysis 2.1) in favour of the intermittent bolus group. We downgraded the certainty of evidence to very low due to high risk of bias in all except one trial and due to imprecision.
Secondary outcomes
90‐Day all‐cause mortality
Data for 90‐day mortality were available for only one trial (Hyvernat 2016). This trial provided no evidence of a difference between groups for 90‐day all‐cause mortality (RR 0.87, 95% CI 0.61 to 1.22; Analysis 2.2). We judged this to be very low‐certainty evidence (with very high risk of bias and imprecision).
Long‐term mortality
In one trial that reported mortality at one year, the RR of dying was 1.36 (95% CI 1.02 to 1.81; 70 participants; Analysis 2.3) (Tilouche 2019). We downgraded the certainty of evidence to very low owing to the fact that data were available from only one small trial that was at high risk of performance and detection bias.
Intensive care unit mortality
We could extract data from four trials. We found no evidence of a difference between the two groups (RR 1.02, 95% CI 0.80 to 1.29; 358 participants; I² = 0%; fixed‐effect model; Analysis 2.4). This was based on very low‐certainty evidence (with very high risk of bias and imprecision).
In‐hospital mortality
We could extract data from two trials. We found no evidence of a difference between the two groups (RR 0.95, 95% CI 0.72 to 1.25; P = 0.70; 240 participants; 4 studies; I² = 0%; fixed‐effect model; Analysis 2.5). We downgraded the certainty of evidence to very low owing to imprecision and risk of bias in one study.
Number of participants with shock reversal (as defined by stable haemodynamic status ≥ 24 hours after withdrawal of vasopressor therapy) at day 7
We could extract data about shock reversal from four trials (358 participants). The results showed heterogeneity (Chi² = 10.09; df = 3; P = 0.02; I² = 70%). A total of 104 of 183 participants in the continuous infusion group and 118 of 175 participants in the intermittent bolus group had shock reversal. The RR of shock reversal was 0.80 (95% CI 0.59 to 1.10; P = 0.17; random‐effects model; Analysis 2.6). This was based on very low‐certainty evidence (due to risk of bias, imprecision, and inconsistency).
Number of participants with shock reversal (as defined by stable haemodynamic status ≥ 24 hours after withdrawal of vasopressor therapy) at 28 days
Data were available from one trial (Tilouche 2019). The RR of having shock reversed by 28 days was 0.78 (95% CI 0.45 to 1.34; 70 participants; Analysis 2.7). This was based on very low‐certainty evidence (due to risk of bias and very severe imprecision).
Number of organs affected and severity of organ dysfunction at day 7, as measured by the sequential organ failure assessment (SOFA) score
The SOFA score at day 7 was available for three trials. The mean difference between groups for the SOFA score was 1.00 (95% CI ‐0.25 to 2.26; 260 participants; I² = 7%; fixed‐effect model; Analysis 2.8). This was based on very low‐certainty evidence (due to risk of bias and very severe imprecision).
Length of stay in the intensive care unit
For all participants
We could extract data about length of stay in the ICU for three trials. We found no evidence of a difference between groups (MD ‐1.05 days, 95% CI ‐4.54 to 2.45; P = .56; 310 participants; I² = 67%; random‐effects model; Analysis 2.9). We downgraded the certainty of evidence to very low owing to inconsistency, imprecision, and high risk of bias in two studies.
For survivors only
No trial provided data for length of ICU stay among survivors only.
Length of stay in the hospital
For all participants
We could extract data about length of stay in the hospital from three trials. We found no evidence of a difference between groups (MD 0.01 days, 95% CI ‐5.05 to 5.07; P = 1.00; 310 participants; I² = 70%; random‐effects model; Analysis 2.10). We downgraded the certainty of evidence to very low owing to inconsistency, imprecision, and high risk of bias in two studies.
For survivors only
No trial provided data for length of hospital stay among survivors only.
Adverse events
Gastroduodenal bleeding
Data from two trials suggest no evidence of a difference between groups in the risk of gastroduodenal bleeding (RR 0.79, 95% CI 0.10 to 6.37; P = 0.83; 193 participants; I² = 67%; random‐effects model; Analysis 2.11). This was based on very low‐certainty evidence (due to risk of bias, inconsistency, and very severe imprecision).
Superinfection
Data from two trials suggest no evidence of a difference between groups in the risk of superinfection (RR 1.12, 95% CI 0.37 to 3.33; P = 0.84; 193 participants; I² = 74%; random‐effects model; Analysis 2.11). We downgraded the certainty of evidence to very low owing to inconsistency, imprecision, and high risk of bias in one of the studies.
Hyperglycaemia
Data from three trials suggest no evidence of a difference between groups in the number of patients with at least one episode of hyperglycaemia (RR 0.89, 95% CI 0.47 to 1.71; P = 0.74; 310 participants; I² = 80%; random‐effects model; Analysis 2.11). This was based on very low‐certainty evidence (due to risk of bias, inconsistency, and imprecision).
Two trials reported mean blood glucose levels. One trial found slightly lower mean blood glucose levels in the continuous infusion group when compared to the intermittent boluses group (6.4 ± 0.7 mmol/L vs 6.2 ± 0.7; P = 0.04) (Loisa 2007). Another trial found no statistically significant difference between these groups (9.± 2.5 mmol/L vs 8.5 ± 6.0; P = 0.55) (Hyvernat 2016). In addition, three trials found that managing hyperglycaemia required higher doses of insulin in continuous infusion versus bolus administration. The MDs for insulin dose were 12.92 (95% CI ‐15.43 to 41.27) (Hyvernat 2016), ‐5.00 (95% CI ‐28.50 to 18.50) (Loisa 2007), and 7.57 (95% CI 4.07 to 11.07) (Tilouche 2019).
Hypernatremia
Data from two trials suggest no evidence of a difference between groups (RR 0.74, 95% CI 0.34 to 1.61; P = 0.45; 187 participants; I² = 47%; random‐effects model; Analysis 2.11). This was based on very low‐certainty evidence (due to risk of bias, inconsistency, and imprecision).
Muscle weakness
Only one trial reported data about muscle weakness (Tilouche 2019). This trial provided no evidence of a difference in this outcome between groups (RR 0.89, 95% CI 0.13 to 5.98). We downgraded the certainty of evidence to very low as this outcome was available from only one trial that was at high risk of performance and detection bias.
Neuropsychiatric events
Only one trial reported data about neuropsychiatric events (Tilouche 2019). This trial provided no evidence of a difference in this outcome between groups (RR 1.56, 95% CI 0.50 to 4.86). This was based on very low‐certainty evidence (due to risk of bias, inconsistency, and very severe imprecision).
Stroke
One trial reported that this outcome did not occur during patient follow‐up (Tilouche 2019). The other trials did not report information about this outcome.
Cardiac events
One trial reported that this outcome did not occur during patient follow‐up (Analysis 2.11) (Tilouche 2019). The other trials did not report information about this outcome.
Discussion
Summary of main results
Effects of corticosteroids on mortality
Overall, this review suggests that in sepsis, corticosteroids reduce all‐cause mortality at 28 days and at 90 days, as well as mortality at intensive care unit (ICU) and hospital discharge. For these outcomes, results show some heterogeneity.
Sensitivity analysis based on trials judged as being at low risk of bias found a significant reduction in 28‐day all‐cause mortality with corticosteroids.
Subgroup analysis based on the specific study drug used did not find significant subgroup differences, although treatment effects on 28‐day mortality might be greater with the combination of hydrocortisone and fludrocortisone. Only one trial directly compared hydrocortisone alone to hydrocortisone and fludrocortisone and found a non‐statistically significant 3% absolute reduction in in‐hospital mortality in favour of the combination (Annane 2010). Meta‐regression and subgroup analyses based on treatment modalities show that dose and duration did not influence response to corticosteroids. Nevertheless, most trials published in the past two decades provided a long course (> 72 hours at full dose) of low‐dose (< 400 mg per day of hydrocortisone equivalent) corticosteroids. Researchers provided no evidence of subgroup differences based on continuous infusion versus intermittent bolus administration of corticosteroids. Likewise, trials that directly compared continuous infusion versus intermittent bolus of corticosteroids reported no evidence of a difference between groups in mortality at 28 days, at 90 days, in the long term, and at ICU and hospital discharge. Subgroup analysis based on modalities for stopping corticosteroids suggests that survival benefit from corticosteroids was greater without versus with tapering off.
Subgroup analyses based on factors related to participants suggest that age (children vs adults) did not influence patients' response to corticosteroids. Patients with septic shock, those with acute respiratory distress syndrome (ARDS), and those with community‐acquired pneumonia may be more likely to derive a survival benefit from corticosteroids than patients with less severe sepsis, although subgroup differences were barely statistically significant. Analysis of trials including patients with critical illness‐related corticosteroid insufficiency (CIRCI) did not show a significant reduction in the risk of death at 28 days. However, studies did not use the same definition for adrenal insufficiency. Additional studies are needed to determine the best diagnostic tool for CIRCI (Annane 2017b).
Effects of corticosteroids on morbidity outcomes
The beneficial effects of corticosteroids on mortality may be related to favourable effects of this treatment on the duration of shock. Indeed, this review shows that treatment with corticosteroids resulted in a substantial reduction in shock duration, with fewer patients remaining on vasopressor therapy by day 7 and by day 28. Treatment with corticosteroids may attenuate the severity of inflammation (Confalonieri 2005; Keh 2003; Mikami 2007; Oppert 2005; Rinaldi 2006), as well as the intensity and duration of organ system failure (Briegel 1999; Confalonieri 2005; Keh 2003; Oppert 2005; Sprung 2008), as shown in this review by a marked decrease in sequential organ failure assessment (SOFA) score at day 7. In addition, subsequent to favourable effects on cardiovascular and other organ functions, corticosteroid therapy resulted in substantial shortening of ICU and hospital length of stay.
These favourable effects of corticosteroids on sepsis‐related morbidity were not influenced by modalities of treatment administration, as was found in trials that directly compared continuous infusion versus intermittent boluses of corticosteroids.
Tolerance of corticosteroids
Finally, this review also found no evidence of an effect of corticosteroids on rates of gastroduodenal bleeding or superinfection, nor on the proportion of patients with neuropsychiatric events, stroke, or cardiac events. Corticosteroids were associated with increased risk for developing hyperglycaemia and hypernatraemia, and for developing acquired muscle weakness.
Evidence from four trials that compared continuous infusion versus intermittent bolus of corticosteroids does not show significant differences in rates of hyperglycaemia, mean blood glucose levels, or the need for higher insulin doses when corticosteroids were administered as continuous infusion. One trial including 509 corticosteroid‐treated patients with septic shock reported no benefit for normalizing blood glucose levels (Annane 2010). The rates of any other serious adverse events were not significantly different between continuous infusion and intermittent bolus administration of corticosteroids.
Overall completeness and applicability of evidence
We identified 61 trials addressing the question of corticosteroids versus control for sepsis. These trials accounted for a large population (i.e. 12,192 participants). Most of the eligible trials contributed to the primary outcome for this review. In addition, four trials provided information on direct comparison of continuous infusion versus intermittent bolus administration of corticosteroids. We found no evidence of publication bias.
Owing to the large number of trials, and to the large size of some individual trials, we could investigate all foreseen outcomes. We found mild heterogeneity in results for the primary outcome, which we explored through sensitivity analyses, subgroup analyses, and meta‐regression analyses. Although subgroup analyses represent a between‐study ‐ not a within‐study ‐ hypothesis, we thought its validity was acceptable according to proposed criteria (Guyatt 2008b). First, we defined the hypothesis for an interaction between practical modalities of administration and effects of corticosteroids on mortality a priori. Second, we conducted subgroup analyses based on only two factors (i.e. modalities of drug administration and population). Third, findings show that the treatment effect was consistent in terms of 28‐day, ICU, hospital, 90‐day, and long‐term mortality (risk ratios (RRs) 0.91, 0.89, 0.90, 0.93, and 0.97, respectively). Fourth, strong external evidence supports these results. Experimental and human studies have shown that a dose of 400 mg or less of hydrocortisone or equivalent can reverse the systemic inflammatory response, endothelial activation, and coagulation disorders secondary to infection (Annane 2005; Heming 2018), thus arguing against the use of higher doses. Moreover, at these low doses, corticosteroids have been shown to improve rather than suppress innate immunity in patients with septic shock (Kaufman 2008). It is now established that sepsis results in a sustained pro‐inflammatory state, arguing against a short course of treatment (Angus 2013; Kellum 2007; van der Poll 2017).
Review authors noted some variation in the routine use of corticosteroids in sepsis. A survey of 542 US critical care physicians found that 83% do not routinely use corticosteroids in adults with sepsis, contrasting with 81% reporting common use of corticosteroids for septic shock (Bruno 2012). The findings of this review suggest that treatment effects on mortality may be greater in sepsis with versus without shock. Roughly one out of three respondents to the survey believed that corticosteroids reduce mortality in septic shock, whereas 27% did not and 45% were unsure. Hydrocortisone was the most common corticosteroid prescribed (93%), with a median dosage of 200 mg/d and administration via intermittent intravenous injection.
Quality of the evidence
We judged the certainty of evidence for 28‐day mortality as moderate rather than high because of some inconsistency across trials that was related in part to differences in study populations and to differences in the types of corticosteroids used and the ways in which corticosteroids were given.
Potential biases in the review process
For this review, we performed a comprehensive search of the literature with no restriction on language, so we can assume that the risk of missing important trials was very limited. Slight asymmetry in the funnel plot for the primary outcome of this review may suggest some publication bias. However, potential sources of an asymmetrical funnel plot also include selection biases, poor methodological quality of smaller studies, true heterogeneity, artefacts, and chance (Egger 1997). Visual inspection of the funnel plot suggests a small‐study effect (i.e. among small studies, the positive ones are more likely to be published). Nevertheless, our thorough search strategy and the need to enrol studies in public clinical trial registries may have decreased the risk of missing any randomized controlled trials. True heterogeneity seems to be a more plausible explanation for the observed asymmetrical funnel plot. Indeed, the effects of corticosteroids on mortality may be proportionate to the basal risk of death, and the two large trials that did not find survival benefit ‐ Sprung 2008 and Venkatesh 2018 ‐ included patients at lower risk of death than was seen in the two large trials that found a survival benefit ‐ Annane 2002 and Annane 2018. Finally, the asymmetrical funnel plot may have been due to chance.
One trial used a cross‐over design (Keh 2003), and we could obtain none of the foreseen outcomes for this review. This trial concluded that prolonged treatment with a low dose of hydrocortisone improved haemodynamic and immune outcomes. Another trial compared three days versus seven days of hydrocortisone therapy and provided no evidence of differences in outcomes between patients treated for three days or seven days (Huh 2007). However, this trial had some limitations, including lack of blinding and small sample size. We considered that pooling the results of remaining trials in a meta‐analysis was acceptable.
Three trials were published only as an abstract (Chawla 1999; Mirea 2014; Tandan 2005). Nevertheless, the primary investigators for these studies provided sufficient unpublished data for review authors to compute the primary outcome and several secondary outcomes for this review, allowing us to include these trials in the meta‐analysis. Both published and unpublished data were available for 28 trials (Appendix 5), and the primary author for each trial validated the data extraction form. For four studies, contact with the primary investigator yielded no additional data (Luce 1988; Meijvis 2011; Rezk 2013; Snijders 2010).
We chose to convert outcome measures that correspond to censored data into dichotomous variables, that is, the proportion of participants with a particular event after one week and after four weeks, or at ICU or hospital discharge.
Agreements and disagreements with other studies or reviews
Findings in this review that a short course of high‐dose corticosteroids provides no benefit for patients with sepsis are in line with reports from previous systematic reviews (Cronin 1995; Lefering 1995), as well as with current international guidelines (Annane 2017b; Rhodes 2017).
We found scarce data that could not allow conclusions on the effects of corticosteroids in children with sepsis, in keeping with a recent systematic review (Menon 2013). Nevertheless, we found no evidence of a difference in response to corticosteroids between children and adults.
The beneficial effects of corticosteroids on shock reversal in patients with septic shock are consistent across recent systematic reviews (Allen 2018; Fang 2018; Kalil 2011; Moran 2010; Ni 2018; Rochwerg 2018; Rygard 2018; Sherwin 2012). The survival benefit derived from corticosteroids for patients with sepsis was suggested by some previous authors (Allen 2018; Fang 2018; Moran 2010; Ni 2018; Rochwerg 2018), but not by others (Table 2) (Kalil 2011; Rygard 2018; Sherwin 2012). Nevertheless, this systematic review included trials that were not included in previous systematic reviews, as they were published only recently or were published in a non‐English language. The current review included non‐published information for a large number of trials after contact was made with original study authors, resulting in inclusion of qualitatively and quantitatively better data than were provided previously.
| Author | Number of trials | Primary outcome | No of patients | Estimate | 95% CI |
| 19 | 28‐Day mortality | 7035 | Sepsis: RR = 0.91 Septic shock: RR = 0.92 | 0.85 to 0.98 0.85 to 0.99 | |
| 6 | Not stated | 5689 | Only qualitative assessment | Only qualitative assessment | |
| 42 | 28‐ to 31‐day mortality | 10,194 | RR = 0.93 | 0.84 to 1.03 | |
| 22 | Short‐term mortality | 7297 | RR = 0.96 | 0.91 to 1.02 | |
| 37 | 28‐Day mortality | 9564 | RR = 0.90 | 0.82 to 0.98 |
A recent network meta‐analysis suggests that hydrocortisone was more likely than methylprednisolone to achieve shock reversal (Gibbison 2017).
Methodological quality summary: review authors' judgements about each methodological quality item for each included study.
Figure represents the results from meta‐regression of log of risk ratio of dying and the dose of corticosteroids given at day 1 and expressed as equivalent milligrams of hydrocortisone. Estimates from each study are represented by circles. Circle sizes depend on the precision of each estimate (the inverse of its within‐study variance), which is the weight given to each study in the fixed‐effect model.
Meta‐regression included 53 trials.
REML estimate of between‐study variance: tau² = .008551.
% residual variation due to heterogeneity: I² res = 28.86%.
Proportion of between‐study variance explained: Adj R² = 43.76%.
Figure represents results from meta‐regression of log of risk ratio of dying and log of cumulated dose of corticosteroids expressed as equivalent milligrams of hydrocortisone. Estimates from each study are represented by circles. Circle sizes depend on the precision of each estimate (the inverse of its within‐study variance), which is the weight given to each study in the fixed‐effect model.
Meta‐regression included 53 trials.
REML estimate of between‐study variance: tau² = .008628.
% residual variation due to heterogeneity: I² res = 28.68%.
Proportion of between‐study variance explained: Adj R² = 43.25%.
Meta‐regression of the log of the risk ratio for 28‐day mortality against actual mortality at 28 days in the control arm.
Funnel plot of comparison: 1 Steroids vs control, outcome: 1.1 28‐Day all‐cause mortality.
Contour‐enhanced funnel plot.
Log of risk ratio for 28‐day mortality is plotted against its standard error.

Comparison 1 Corticosteroids versus placebo or usual care, Outcome 1 28‐Day all‐cause mortality.

Comparison 1 Corticosteroids versus placebo or usual care, Outcome 2 28‐Day all‐cause mortality ‐ sensitivity analysis based on methodological quality.

Comparison 1 Corticosteroids versus placebo or usual care, Outcome 3 28‐Day all‐cause mortality by subgroups based on study drug.

Comparison 1 Corticosteroids versus placebo or usual care, Outcome 4 28‐Day all‐cause mortality by subgroups based on treatment dose/duration.

Comparison 1 Corticosteroids versus placebo or usual care, Outcome 5 28‐Day all‐cause mortality based on mode of drug administration.

Comparison 1 Corticosteroids versus placebo or usual care, Outcome 6 28‐Day all‐cause mortality based on mode of drug termination.

Comparison 1 Corticosteroids versus placebo or usual care, Outcome 7 28‐Day all‐cause mortality by subgroups based on age.

Comparison 1 Corticosteroids versus placebo or usual care, Outcome 8 28‐Day all‐cause mortality by subgroups based on targeted population.

Comparison 1 Corticosteroids versus placebo or usual care, Outcome 9 28‐Day mortality in participants with critical illness‐related corticosteroid insufficiency.

Comparison 1 Corticosteroids versus placebo or usual care, Outcome 10 90‐Day all‐cause mortality.

Comparison 1 Corticosteroids versus placebo or usual care, Outcome 11 Long‐term mortality.

Comparison 1 Corticosteroids versus placebo or usual care, Outcome 12 Intensive care unit mortality.

Comparison 1 Corticosteroids versus placebo or usual care, Outcome 13 Hospital mortality.

Comparison 1 Corticosteroids versus placebo or usual care, Outcome 14 Number of participants with shock reversal at day 7.

Comparison 1 Corticosteroids versus placebo or usual care, Outcome 15 Number of participants with shock reversal at 28 days.

Comparison 1 Corticosteroids versus placebo or usual care, Outcome 16 SOFA score at day 7.

Comparison 1 Corticosteroids versus placebo or usual care, Outcome 17 Length of intensive care unit stay for all participants.

Comparison 1 Corticosteroids versus placebo or usual care, Outcome 18 Length of intensive care unit stay for survivors.

Comparison 1 Corticosteroids versus placebo or usual care, Outcome 19 Length of hospital stay for all participants.

Comparison 1 Corticosteroids versus placebo or usual care, Outcome 20 Length of hospital stay for survivors.

Comparison 1 Corticosteroids versus placebo or usual care, Outcome 21 Number of participants with adverse events.

Comparison 2 Continuous infusion versus bolus administration of corticosteroids, Outcome 1 28‐Day all‐cause mortality.

Comparison 2 Continuous infusion versus bolus administration of corticosteroids, Outcome 2 90‐Day all‐cause mortality.

Comparison 2 Continuous infusion versus bolus administration of corticosteroids, Outcome 3 Long‐term mortality.

Comparison 2 Continuous infusion versus bolus administration of corticosteroids, Outcome 4 Intensive care unit mortality.

Comparison 2 Continuous infusion versus bolus administration of corticosteroids, Outcome 5 Hospital mortality.

Comparison 2 Continuous infusion versus bolus administration of corticosteroids, Outcome 6 Number of participants with shock reversal at day 7.

Comparison 2 Continuous infusion versus bolus administration of corticosteroids, Outcome 7 Number of participants with shock reversal at day 28.

Comparison 2 Continuous infusion versus bolus administration of corticosteroids, Outcome 8 SOFA score at day 7.

Comparison 2 Continuous infusion versus bolus administration of corticosteroids, Outcome 9 Length of intensive care unit stay for all participants.

Comparison 2 Continuous infusion versus bolus administration of corticosteroids, Outcome 10 Length of hospital stay for all participants.

Comparison 2 Continuous infusion versus bolus administration of corticosteroids, Outcome 11 Number of participants with adverse events.
| Corticosteroids compared to placebo or usual care for treating sepsis | ||||||
| Patient or population: children and adults with sepsis | ||||||
| Outcomes | Anticipated absolute effects* (95% CI) | Relative effect | № of participants | Certainty of the evidence | Comments | |
| Risk with placebo or usual care | Risk with corticosteroids | |||||
| 28‐Day all‐cause mortalitya | Study population | RR 0.91 | 11233 | ⊕⊕⊕⊝ | Corticosteroids probably slightly reduce 28‐day all‐cause mortality | |
| 264 per 1000 | 240 per 1000 | |||||
| Long‐term mortalityc | Study population | RR 0.97 | 6236 | ⊕⊕⊝⊝ | Corticosteroids may result in little to no difference in long‐term mortality | |
| 386 per 1000 | 374 per 1000 | |||||
| Hospital mortality | Study population | RR 0.90 | 8183 | ⊕⊕⊕⊝ | Corticosteroids probably slightly reduce hospital mortality | |
| 323 per 1000 | 291 per 1000 | |||||
| Length of intensive care unit stay for all participants in days | Mean length of intensive care unit stay for all participants was 14 days | MD 1.07 lower | ‐ | 7612 | ⊕⊕⊕⊕ | Corticosteroids reduced length of intensive care unit stay for all participants |
| Length of hospital stay for all participants in days | Mean length of hospital stay for all participants was 21 days | MD 1.63 lower | ‐ | 8795 | ⊕⊕⊕⊕ | Corticosteroids result in a large reduction in length of hospital stay for all participants |
| Number of participants with adverse events ‐ superinfection (up to longest follow‐up) | Study population | RR 1.06 | 5356 | ⊕⊕⊕⊕ | Corticosteroids probably do not increase the number of participants with adverse events ‐ superinfection | |
| 169 per 1000 | 180 per 1000 | |||||
| Number of participants with adverse events ‐ muscle weakness (up to longest follow‐up) | Study population | RR 1.21 | 6145 | ⊕⊕⊕⊕ | Corticosteroids increase the number of participants with adverse events ‐ muscle weakness | |
| 56 per 1000 | 68 per 1000 | |||||
| *The risk in the intervention group (and its 95% confidence interval) is based on the assumed risk in the comparison group and the relative effect of the intervention (and its 95% CI). The unit of measure for length of stay is days. | ||||||
| GRADE Working Group grades of evidence. | ||||||
| aSensitivity analysis based on trials judged as being at low risk of bias showed an RR for dying at 28 days of 0.91 (95% CI 0.84 to 0.98; P = 0.01; 7896 participants; 17 studies; I² = 0%). bDowngraded one level for inconsistency; there was significant statistical heterogeneity. cLong‐term mortality was recorded up to six months for three trials (Annane 2018; Keh 2016; Venkatesh 2018), and up to one year for four trials (Annane 2002; Briegel 1999; Meduri 2007; Sprung 2008). dLarge 95% confidence interval overlapping the neutrality line. eUpgraded one level due to large size effects. | ||||||
| Continuous infusion compared to bolus administration of corticosteroids for children and adults with sepsis | ||||||
| Patient or population: children and adults with sepsis | ||||||
| Outcomes | Anticipated absolute effects* (95% CI) | Relative effect | № of participants | Certainty of the evidence | Comments | |
| Risk with bolus administration of corticosteroids | Risk with continuous infusion | |||||
| 28‐Day all‐cause mortality | Study population | RR 1.03 | 310 | ⊕⊝⊝⊝ | Evidence is very uncertain about the effect of continuous infusion on 28‐day all‐cause mortality | |
| 444 per 1000 | 457 per 1000 | |||||
| Long‐term mortalityc | Study population | RR 1.36 | 70 | ⊕⊝⊝⊝ | Evidence is very uncertain about the effect of continuous infusion on long‐term mortality | |
| 636 per 1000 | 865 per 1000 | |||||
| Hospital mortality | Study population | RR 0.95 | 240 | ⊕⊝⊝⊝ | Evidence is very uncertain about the effect of continuous infusion on hospital mortality | |
| 458 per 1000 | 435 per 1000 | |||||
| Length of intensive care unit stay for all participants in days | Mean length of intensive care unit stay for all participants was 13 days | MD 1.05 lower | ‐ | 310 | ⊕⊝⊝⊝ | Evidence is very uncertain about the effect of continuous infusion on length of intensive care unit stay for all participants |
| Length of hospital stay for all participants in days | Mean length of hospital stay for all participants was 17 days | MD 0.01 higher | ‐ | 310 | ⊕⊝⊝⊝ | Evidence is very uncertain about the effect of continuous infusion on length of hospital stay for all participants |
| Number of participants with adverse events ‐ superinfection (up to longest follow‐up) | Study population | RR 1.12 | 193 | ⊕⊝⊝⊝ | Evidence is very uncertain about the effect of continuous infusion on number of participants with adverse events ‐ superinfection | |
| 204 per 1000 | 229 per 1000 | |||||
| Number of participants with adverse events ‐ muscle weakness (up to longest follow‐up) | Study population | RR 0.89 | 70 | ⊕⊕⊝⊝ | Evidence suggests that continuous infusion may result in little to no difference in the number of participants with adverse events ‐ muscle weakness | |
| 61 per 1000 | 54 per 1000 | |||||
| *The risk in the intervention group (and its 95% confidence interval) is based on the assumed risk in the comparison group and the relative effect of the intervention (and its 95% CI). The unit of measure for length of stay is days. | ||||||
| GRADE Working Group grades of evidence. | ||||||
| aDowngraded one level as only one of the four trials was judged as having low risk of bias. bDowngraded one level as trials were small and the 95% confidence interval was large. dDowngraded one level as the only trial reporting this outcome was open‐labelled and at high risk of performance bias. eDowngraded one level as only one trial reported this outcome. fDowngraded one level as the observed increase in risk of dying in the long term is not consistent with treatment effects on 28‐day mortality. gDowngraded one level as results show some heterogeneity. hDowngraded two levels as heterogeneity in the results is strong. cLong‐term mortality was assessed up to six months. | ||||||
| Author | Number of trials | Primary outcome | No of patients | Estimate | 95% CI |
| 19 | 28‐Day mortality | 7035 | Sepsis: RR = 0.91 Septic shock: RR = 0.92 | 0.85 to 0.98 0.85 to 0.99 | |
| 6 | Not stated | 5689 | Only qualitative assessment | Only qualitative assessment | |
| 42 | 28‐ to 31‐day mortality | 10,194 | RR = 0.93 | 0.84 to 1.03 | |
| 22 | Short‐term mortality | 7297 | RR = 0.96 | 0.91 to 1.02 | |
| 37 | 28‐Day mortality | 9564 | RR = 0.90 | 0.82 to 0.98 |
| Outcome or subgroup title | No. of studies | No. of participants | Statistical method | Effect size |
| 1 28‐Day all‐cause mortality Show forest plot | 50 | 11233 | Risk Ratio (M‐H, Random, 95% CI) | 0.91 [0.84, 0.99] |
| 1.1 Studies reporting actual 28‐day mortality | 32 | 9387 | Risk Ratio (M‐H, Random, 95% CI) | 0.94 [0.87, 1.00] |
| 1.2 Studies reporting short‐term mortality at other timing | 18 | 1846 | Risk Ratio (M‐H, Random, 95% CI) | 0.71 [0.52, 0.95] |
| 2 28‐Day all‐cause mortality ‐ sensitivity analysis based on methodological quality Show forest plot | 38 | Risk Ratio (M‐H, Fixed, 95% CI) | Subtotals only | |
| 2.1 Adequate generation of allocation sequence | 35 | 10076 | Risk Ratio (M‐H, Fixed, 95% CI) | 0.93 [0.87, 0.99] |
| 2.2 Adequate allocation concealment | 34 | 9972 | Risk Ratio (M‐H, Fixed, 95% CI) | 0.93 [0.87, 0.99] |
| 2.3 Blinded trials | 34 | 9894 | Risk Ratio (M‐H, Fixed, 95% CI) | 0.93 [0.87, 0.99] |
| 2.4 Studies judged at low risk of bias | 17 | 7896 | Risk Ratio (M‐H, Fixed, 95% CI) | 0.91 [0.84, 0.98] |
| 3 28‐Day all‐cause mortality by subgroups based on study drug Show forest plot | 47 | 11017 | Risk Ratio (M‐H, Random, 95% CI) | 0.92 [0.84, 1.00] |
| 3.1 Hydrocortisone | 25 | 6518 | Risk Ratio (M‐H, Random, 95% CI) | 0.94 [0.83, 1.05] |
| 3.2 Hydrocortisone plus fludrocortisone | 3 | 1564 | Risk Ratio (M‐H, Random, 95% CI) | 0.87 [0.77, 0.98] |
| 3.3 Prednisone/Prednisolone | 5 | 1236 | Risk Ratio (M‐H, Random, 95% CI) | 0.97 [0.71, 1.33] |
| 3.4 Methylprednisolone/Dexamethasone | 14 | 1699 | Risk Ratio (M‐H, Random, 95% CI) | 0.81 [0.61, 1.09] |
| 4 28‐Day all‐cause mortality by subgroups based on treatment dose/duration Show forest plot | 44 | 10812 | Risk Ratio (M‐H, Fixed, 95% CI) | 0.92 [0.86, 0.97] |
| 4.1 Long course of low‐dose corticosteroids | 39 | 9902 | Risk Ratio (M‐H, Fixed, 95% CI) | 0.91 [0.86, 0.97] |
| 4.2 Short course of high‐dose corticosteroids | 5 | 910 | Risk Ratio (M‐H, Fixed, 95% CI) | 0.96 [0.80, 1.16] |
| 5 28‐Day all‐cause mortality based on mode of drug administration Show forest plot | 45 | 9978 | Risk Ratio (M‐H, Random, 95% CI) | 0.90 [0.82, 0.99] |
| 5.1 Intravenous bolus | 27 | 4749 | Risk Ratio (M‐H, Random, 95% CI) | 0.92 [0.83, 1.02] |
| 5.2 Continuous infusion | 18 | 5229 | Risk Ratio (M‐H, Random, 95% CI) | 0.84 [0.66, 1.07] |
| 6 28‐Day all‐cause mortality based on mode of drug termination Show forest plot | 47 | 10906 | Risk Ratio (M‐H, Random, 95% CI) | 0.91 [0.83, 1.00] |
| 6.1 Without taper off | 30 | 8770 | Risk Ratio (M‐H, Random, 95% CI) | 0.87 [0.78, 0.98] |
| 6.2 With taper off | 17 | 2136 | Risk Ratio (M‐H, Random, 95% CI) | 1.04 [0.92, 1.18] |
| 7 28‐Day all‐cause mortality by subgroups based on age Show forest plot | 45 | Risk Ratio (M‐H, Random, 95% CI) | Subtotals only | |
| 7.1 Adults | 40 | 10169 | Risk Ratio (M‐H, Random, 95% CI) | 0.91 [0.83, 1.00] |
| 7.2 Children | 5 | 278 | Risk Ratio (M‐H, Random, 95% CI) | 1.08 [0.56, 2.09] |
| 8 28‐Day all‐cause mortality by subgroups based on targeted population Show forest plot | 50 | Risk Ratio (M‐H, Random, 95% CI) | Subtotals only | |
| 8.1 Sepsis | 10 | 1358 | Risk Ratio (M‐H, Random, 95% CI) | 1.10 [0.89, 1.37] |
| 8.2 Septic shock only | 23 | 7428 | Risk Ratio (M‐H, Random, 95% CI) | 0.91 [0.83, 1.00] |
| 8.3 Sepsis and ARDS | 4 | 311 | Risk Ratio (M‐H, Random, 95% CI) | 0.66 [0.45, 0.98] |
| 8.4 Sepsis and community‐acquired pneumonia | 13 | 2038 | Risk Ratio (M‐H, Random, 95% CI) | 0.71 [0.50, 1.00] |
| 9 28‐Day mortality in participants with critical illness‐related corticosteroid insufficiency Show forest plot | 12 | 1079 | Risk Ratio (M‐H, Fixed, 95% CI) | 0.92 [0.82, 1.03] |
| 10 90‐Day all‐cause mortality Show forest plot | 7 | 5934 | Risk Ratio (M‐H, Fixed, 95% CI) | 0.93 [0.87, 1.00] |
| 11 Long‐term mortality Show forest plot | 7 | 6236 | Risk Ratio (M‐H, Fixed, 95% CI) | 0.97 [0.91, 1.03] |
| 12 Intensive care unit mortality Show forest plot | 18 | 7267 | Risk Ratio (M‐H, Fixed, 95% CI) | 0.89 [0.83, 0.96] |
| 13 Hospital mortality Show forest plot | 26 | 8183 | Risk Ratio (M‐H, Random, 95% CI) | 0.90 [0.82, 0.99] |
| 14 Number of participants with shock reversal at day 7 Show forest plot | 16 | 6711 | Risk Ratio (M‐H, Random, 95% CI) | 1.23 [1.13, 1.34] |
| 15 Number of participants with shock reversal at 28 days Show forest plot | 13 | 6779 | Risk Ratio (M‐H, Fixed, 95% CI) | 1.06 [1.03, 1.08] |
| 16 SOFA score at day 7 Show forest plot | 10 | 2157 | Mean Difference (IV, Random, 95% CI) | ‐1.37 [‐1.84, ‐0.90] |
| 17 Length of intensive care unit stay for all participants Show forest plot | 21 | 7612 | Mean Difference (IV, Random, 95% CI) | ‐1.07 [‐1.95, ‐0.19] |
| 18 Length of intensive care unit stay for survivors Show forest plot | 10 | 778 | Mean Difference (IV, Fixed, 95% CI) | ‐2.19 [‐3.93, ‐0.46] |
| 19 Length of hospital stay for all participants Show forest plot | 22 | 8795 | Mean Difference (IV, Random, 95% CI) | ‐1.63 [‐2.93, ‐0.33] |
| 20 Length of hospital stay for survivors Show forest plot | 9 | 710 | Mean Difference (IV, Random, 95% CI) | ‐4.11 [‐8.50, 0.28] |
| 21 Number of participants with adverse events Show forest plot | 31 | Risk Ratio (M‐H, Fixed, 95% CI) | Subtotals only | |
| 21.1 Gastroduodenal bleeding | 26 | 5231 | Risk Ratio (M‐H, Fixed, 95% CI) | 1.07 [0.85, 1.35] |
| 21.2 Superinfection | 25 | 5356 | Risk Ratio (M‐H, Fixed, 95% CI) | 1.06 [0.95, 1.19] |
| 21.3 Hyperglycaemia | 20 | 8594 | Risk Ratio (M‐H, Fixed, 95% CI) | 1.17 [1.13, 1.22] |
| 21.4 Hypernatraemia | 6 | 5069 | Risk Ratio (M‐H, Fixed, 95% CI) | 1.66 [1.34, 2.06] |
| 21.5 Muscle weakness | 6 | 6145 | Risk Ratio (M‐H, Fixed, 95% CI) | 1.21 [1.01, 1.44] |
| 21.6 Neuropsychiatric event | 8 | 6941 | Risk Ratio (M‐H, Fixed, 95% CI) | 0.86 [0.53, 1.39] |
| 21.7 Stroke | 4 | 2842 | Risk Ratio (M‐H, Fixed, 95% CI) | 0.83 [0.41, 1.68] |
| 21.8 Cardiac event | 6 | 3567 | Risk Ratio (M‐H, Fixed, 95% CI) | 1.12 [0.66, 1.88] |
| Outcome or subgroup title | No. of studies | No. of participants | Statistical method | Effect size |
| 1 28‐Day all‐cause mortality Show forest plot | 3 | 310 | Risk Ratio (M‐H, Fixed, 95% CI) | 1.03 [0.81, 1.31] |
| 2 90‐Day all‐cause mortality Show forest plot | 1 | 123 | Risk Ratio (M‐H, Fixed, 95% CI) | 0.87 [0.61, 1.22] |
| 3 Long‐term mortality Show forest plot | 1 | 70 | Risk Ratio (M‐H, Fixed, 95% CI) | 1.36 [1.02, 1.81] |
| 4 Intensive care unit mortality Show forest plot | 4 | 358 | Risk Ratio (M‐H, Fixed, 95% CI) | 1.02 [0.80, 1.29] |
| 5 Hospital mortality Show forest plot | 2 | 240 | Risk Ratio (M‐H, Fixed, 95% CI) | 0.95 [0.72, 1.25] |
| 6 Number of participants with shock reversal at day 7 Show forest plot | 4 | 358 | Risk Ratio (M‐H, Random, 95% CI) | 0.80 [0.59, 1.10] |
| 7 Number of participants with shock reversal at day 28 Show forest plot | 1 | 70 | Risk Ratio (M‐H, Random, 95% CI) | 0.78 [0.45, 1.34] |
| 8 SOFA score at day 7 Show forest plot | 3 | 260 | Mean Difference (IV, Fixed, 95% CI) | 1.00 [‐0.25, 2.26] |
| 9 Length of intensive care unit stay for all participants Show forest plot | 3 | 310 | Mean Difference (IV, Random, 95% CI) | ‐1.05 [‐4.54, 2.45] |
| 10 Length of hospital stay for all participants Show forest plot | 3 | 310 | Mean Difference (IV, Random, 95% CI) | 0.01 [‐5.05, 5.07] |
| 11 Number of participants with adverse events Show forest plot | 3 | Risk Ratio (M‐H, Random, 95% CI) | Subtotals only | |
| 11.1 Gastrointestinal bleeding | 2 | 193 | Risk Ratio (M‐H, Random, 95% CI) | 0.79 [0.10, 6.37] |
| 11.2 Superinfection | 2 | 193 | Risk Ratio (M‐H, Random, 95% CI) | 1.12 [0.37, 3.33] |
| 11.3 Hyperglycaemia | 3 | 310 | Risk Ratio (M‐H, Random, 95% CI) | 0.89 [0.47, 1.71] |
| 11.4 Hypernatraemia | 2 | 187 | Risk Ratio (M‐H, Random, 95% CI) | 0.74 [0.34, 1.61] |
| 11.5 Muscle weakness | 1 | 70 | Risk Ratio (M‐H, Random, 95% CI) | 0.89 [0.13, 5.98] |
| 11.6 Neuropsychiatric event | 1 | 70 | Risk Ratio (M‐H, Random, 95% CI) | 1.56 [0.50, 4.86] |
| 11.7 Stroke | 1 | 70 | Risk Ratio (M‐H, Random, 95% CI) | 0.0 [0.0, 0.0] |
| 11.8 Cardiac event | 1 | 70 | Risk Ratio (M‐H, Random, 95% CI) | 0.0 [0.0, 0.0] |