| 1 28‐Day all‐cause mortality Show forest plot | 27 | 3176 | Risk Ratio (M‐H, Random, 95% CI) | 0.87 [0.76, 1.00] |
|
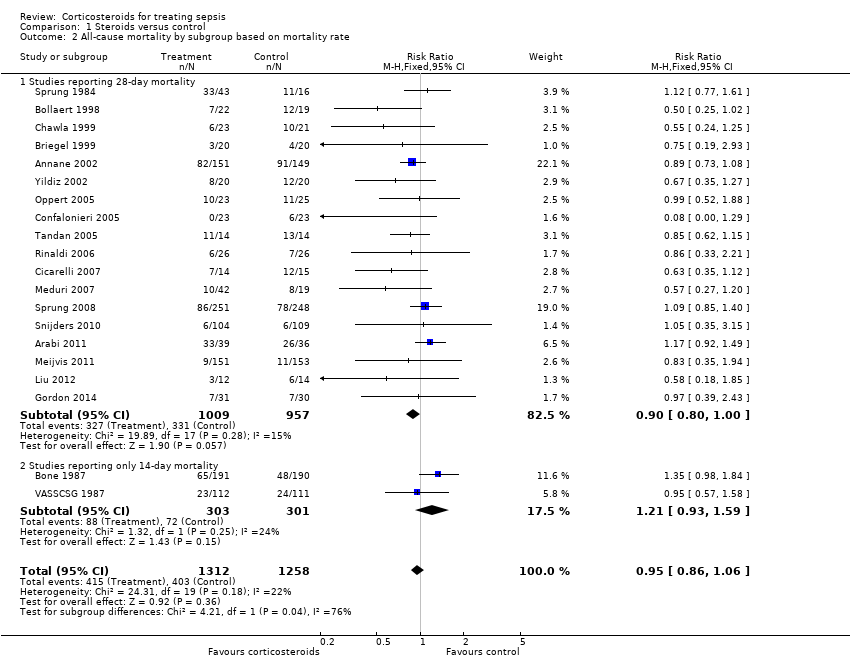
| 2 All‐cause mortality by subgroup based on mortality rate Show forest plot | 20 | 2570 | Risk Ratio (M‐H, Fixed, 95% CI) | 0.95 [0.86, 1.06] |
|
| 2.1 Studies reporting 28‐day mortality | 18 | 1966 | Risk Ratio (M‐H, Fixed, 95% CI) | 0.90 [0.80, 1.00] |
| 2.2 Studies reporting only 14‐day mortality | 2 | 604 | Risk Ratio (M‐H, Fixed, 95% CI) | 1.21 [0.93, 1.59] |
| 3 28‐Day all‐cause mortality by subgroups based on methodological quality Show forest plot | 20 | | Risk Ratio (M‐H, Random, 95% CI) | Subtotals only |
|
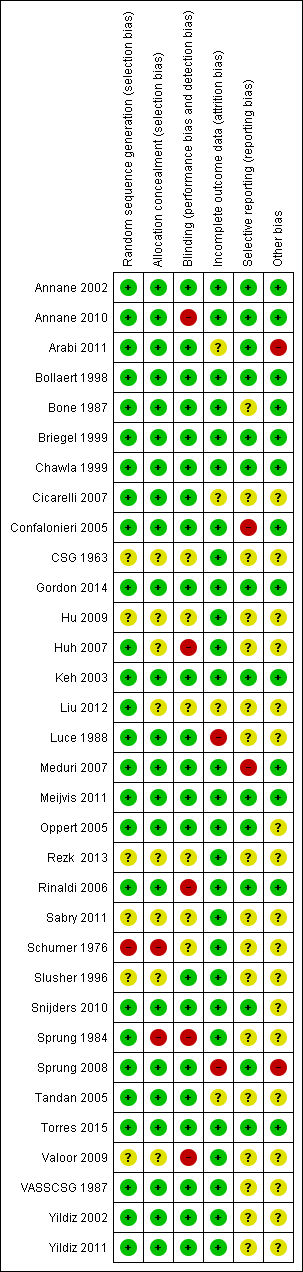
| 3.1 Adequate generation of allocation sequence | 19 | 2342 | Risk Ratio (M‐H, Random, 95% CI) | 0.97 [0.86, 1.10] |
| 3.2 Adequate allocation concealment | 18 | 2283 | Risk Ratio (M‐H, Random, 95% CI) | 0.96 [0.84, 1.09] |
| 3.3 Blinded trials | 18 | 2259 | Risk Ratio (M‐H, Random, 95% CI) | 0.95 [0.84, 1.08] |
| 4 28‐Day all‐cause mortality by subgroups based on treatment dose/duration Show forest plot | 27 | | Risk Ratio (M‐H, Fixed, 95% CI) | Subtotals only |
|
| 4.1 Long course of low‐dose corticosteroids | 22 | 2266 | Risk Ratio (M‐H, Fixed, 95% CI) | 0.87 [0.78, 0.97] |
| 4.2 Short course of high‐dose corticosteroids | 5 | 910 | Risk Ratio (M‐H, Fixed, 95% CI) | 0.96 [0.80, 1.16] |
| 5 28‐Day all‐cause mortality by subgroups based on targeted population Show forest plot | 26 | | Risk Ratio (M‐H, Fixed, 95% CI) | Subtotals only |
|
| 5.1 Sepsis | 6 | 826 | Risk Ratio (M‐H, Fixed, 95% CI) | 1.11 [0.91, 1.34] |
| 5.2 Septic shock only | 12 | 1444 | Risk Ratio (M‐H, Fixed, 95% CI) | 0.88 [0.78, 0.99] |
| 5.3 Sepsis and ARDS | 3 | 114 | Risk Ratio (M‐H, Fixed, 95% CI) | 0.46 [0.25, 0.85] |
| 5.4 Sepsis and community‐acquired pneumonia | 5 | 763 | Risk Ratio (M‐H, Fixed, 95% CI) | 0.62 [0.38, 1.02] |
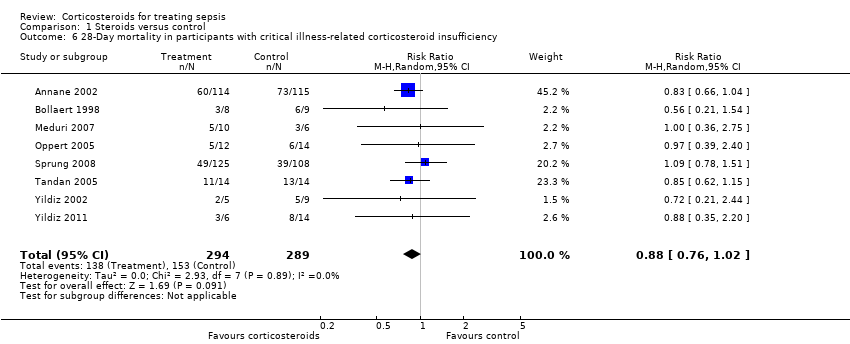
| 6 28‐Day mortality in participants with critical illness‐related corticosteroid insufficiency Show forest plot | 8 | 583 | Risk Ratio (M‐H, Random, 95% CI) | 0.88 [0.76, 1.02] |
|
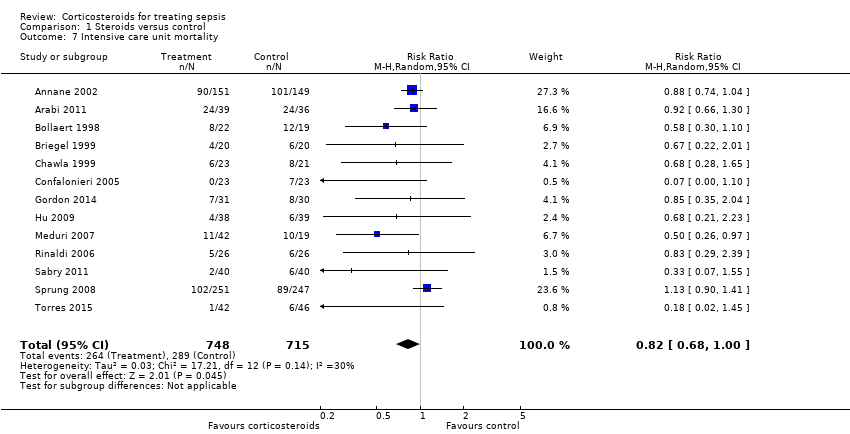
| 7 Intensive care unit mortality Show forest plot | 13 | 1463 | Risk Ratio (M‐H, Random, 95% CI) | 0.82 [0.68, 1.00] |
|
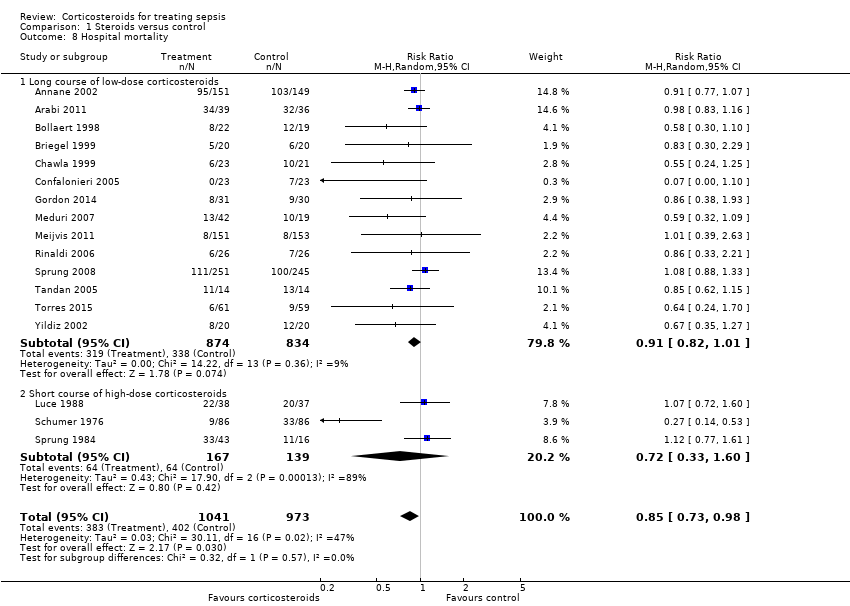
| 8 Hospital mortality Show forest plot | 17 | 2014 | Risk Ratio (M‐H, Random, 95% CI) | 0.85 [0.73, 0.98] |
|
| 8.1 Long course of low‐dose corticosteroids | 14 | 1708 | Risk Ratio (M‐H, Random, 95% CI) | 0.91 [0.82, 1.01] |
| 8.2 Short course of high‐dose corticosteroids | 3 | 306 | Risk Ratio (M‐H, Random, 95% CI) | 0.72 [0.33, 1.60] |
| 9 Number of participants with shock reversal at day 7 Show forest plot | 12 | 1561 | Risk Ratio (M‐H, Random, 95% CI) | 1.31 [1.14, 1.51] |
|
| 9.1 Shock reversal at day 7 in trials on long course of low‐dose corticosteroids | 10 | 1258 | Risk Ratio (M‐H, Random, 95% CI) | 1.34 [1.22, 1.46] |
| 9.2 Shock reversal at day 7 in trials on short course of high‐dose corticosteroids | 2 | 303 | Risk Ratio (M‐H, Random, 95% CI) | 1.07 [0.64, 1.79] |
| 10 Number of participants with shock reversal at 28 days Show forest plot | 7 | 1013 | Risk Ratio (M‐H, Random, 95% CI) | 1.11 [1.02, 1.21] |
|
| 11 SOFA score at day 7 Show forest plot | 8 | 1132 | Mean Difference (IV, Random, 95% CI) | ‐1.53 [‐2.04, ‐1.03] |
|
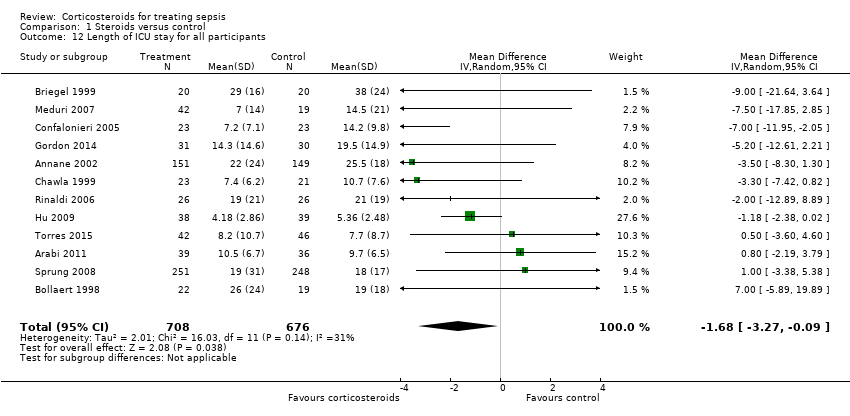
| 12 Length of ICU stay for all participants Show forest plot | 12 | 1384 | Mean Difference (IV, Random, 95% CI) | ‐1.68 [‐3.27, ‐0.09] |
|
| 13 Length of ICU stay for survivors Show forest plot | 10 | 778 | Mean Difference (IV, Fixed, 95% CI) | ‐2.19 [‐3.93, ‐0.46] |
|
| 14 Length of hospital stay for all participants Show forest plot | 12 | 1802 | Mean Difference (IV, Random, 95% CI) | ‐0.97 [‐2.55, 0.61] |
|
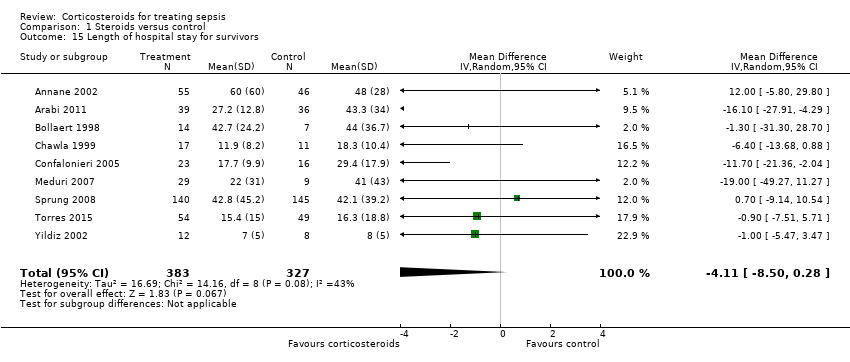
| 15 Length of hospital stay for survivors Show forest plot | 9 | 710 | Mean Difference (IV, Random, 95% CI) | ‐4.11 [‐8.50, 0.28] |
|
| 16 Number of participants with adverse events Show forest plot | 21 | | Risk Ratio (M‐H, Fixed, 95% CI) | Subtotals only |
|
| 16.1 Gastroduodenal bleeding | 19 | 2382 | Risk Ratio (M‐H, Fixed, 95% CI) | 1.24 [0.92, 1.67] |
| 16.2 Superinfections | 19 | 2567 | Risk Ratio (M‐H, Fixed, 95% CI) | 1.02 [0.87, 1.20] |
| 16.3 Hyperglycaemia | 13 | 2081 | Risk Ratio (M‐H, Fixed, 95% CI) | 1.26 [1.16, 1.37] |
| 16.4 Hypernatraemia | 3 | 805 | Risk Ratio (M‐H, Fixed, 95% CI) | 1.64 [1.28, 2.09] |
| 16.5 Neuromuscular weakness | 3 | 811 | Risk Ratio (M‐H, Fixed, 95% CI) | 0.62 [0.21, 1.88] |