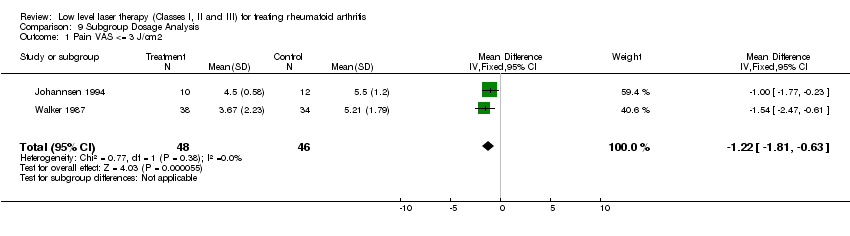
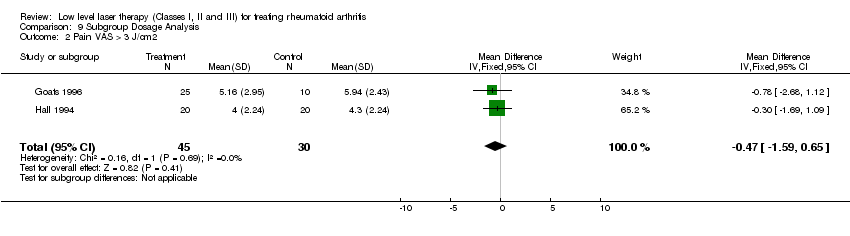
| 1 Pain Show forest plot | 4 | | Mean Difference (IV, Fixed, 95% CI) | Subtotals only |
|
| 1.1 Wavelength < 660 nm | 1 | 72 | Mean Difference (IV, Fixed, 95% CI) | ‐1.54 [‐2.47, ‐0.61] |
| 1.2 Wavelength 820, 830 nm | 2 | 62 | Mean Difference (IV, Fixed, 95% CI) | ‐0.84 [‐1.51, ‐0.16] |
| 1.3 Wavelength 650‐950 nm | 1 | 35 | Mean Difference (IV, Fixed, 95% CI) | ‐0.78 [‐2.68, 1.12] |
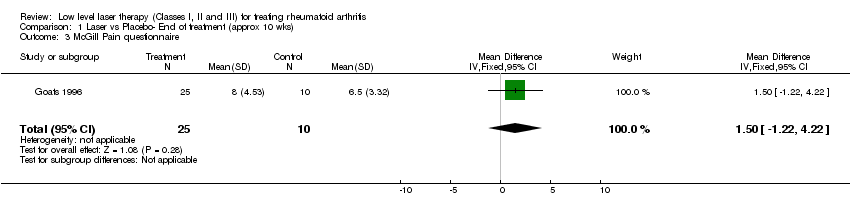
| 2 McGill Pain questionnaire Show forest plot | 1 | | Mean Difference (IV, Fixed, 95% CI) | Subtotals only |
|
| 2.1 Wavelength < 660 nm | 0 | 0 | Mean Difference (IV, Fixed, 95% CI) | 0.0 [0.0, 0.0] |
| 2.2 Wavelength 820, 830 nm | 0 | 0 | Mean Difference (IV, Fixed, 95% CI) | 0.0 [0.0, 0.0] |
| 2.3 Wavelength 650‐950 nm | 1 | 35 | Mean Difference (IV, Fixed, 95% CI) | 1.5 [‐1.22, 4.22] |
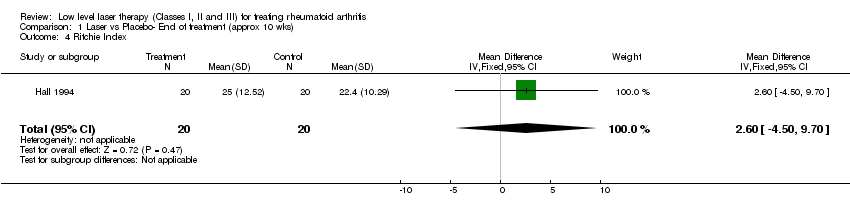
| 3 Ritchie Index Show forest plot | 1 | | Mean Difference (IV, Fixed, 95% CI) | Subtotals only |
|
| 3.1 Wavelength < 660 nm | 0 | 0 | Mean Difference (IV, Fixed, 95% CI) | 0.0 [0.0, 0.0] |
| 3.2 Wavelength 820, 830 nm | 1 | 40 | Mean Difference (IV, Fixed, 95% CI) | 2.60 [‐4.50, 9.70] |
| 3.3 Wavelength 650‐950 nm | 0 | 0 | Mean Difference (IV, Fixed, 95% CI) | 0.0 [0.0, 0.0] |
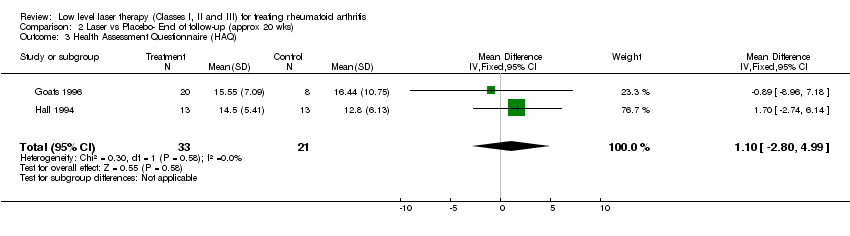
| 4 Health Assessment Questionnaire (HAQ) Show forest plot | 2 | | Mean Difference (IV, Fixed, 95% CI) | Subtotals only |
|
| 4.1 Wavelength < 660 nm | 0 | 0 | Mean Difference (IV, Fixed, 95% CI) | 0.0 [0.0, 0.0] |
| 4.2 Wavelength 820, 830 nm | 1 | 40 | Mean Difference (IV, Fixed, 95% CI) | 1.25 [‐2.09, 4.59] |
| 4.3 Wavelength 650‐950 nm | 1 | 35 | Mean Difference (IV, Fixed, 95% CI) | ‐0.18 [‐6.39, 6.03] |
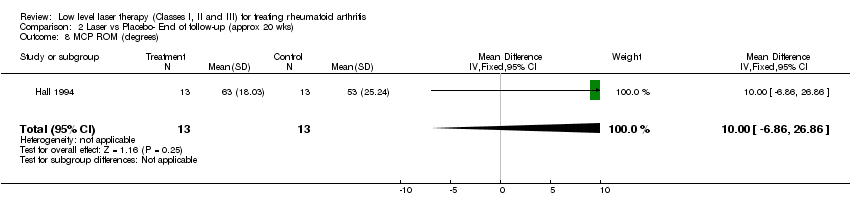
| 5 MCP ROM (degrees) Show forest plot | 1 | | Mean Difference (IV, Fixed, 95% CI) | Subtotals only |
|
| 5.1 Wavelength < 660 nm | 0 | 0 | Mean Difference (IV, Fixed, 95% CI) | 0.0 [0.0, 0.0] |
| 5.2 Wavelength 820, 830 nm | 1 | 40 | Mean Difference (IV, Fixed, 95% CI) | ‐0.5 [‐15.99, 14.99] |
| 5.3 Wavelength 650‐950 nm | 0 | 0 | Mean Difference (IV, Fixed, 95% CI) | 0.0 [0.0, 0.0] |
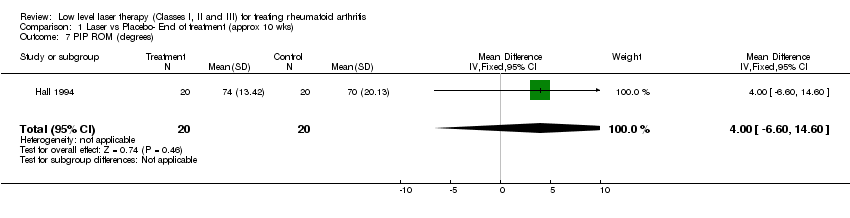
| 6 PIP ROM (degrees) Show forest plot | 1 | | Mean Difference (IV, Fixed, 95% CI) | Subtotals only |
|
| 6.1 Wavelength < 660 nm | 0 | 0 | Mean Difference (IV, Fixed, 95% CI) | 0.0 [0.0, 0.0] |
| 6.2 Wavelength 820, 830 nm | 1 | 40 | Mean Difference (IV, Fixed, 95% CI) | 4.0 [‐6.60, 14.60] |
| 6.3 Wavelength 650‐950 nm | 0 | 0 | Mean Difference (IV, Fixed, 95% CI) | 0.0 [0.0, 0.0] |
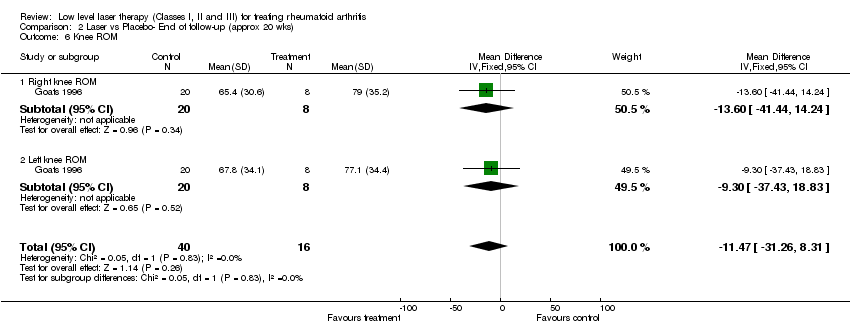
| 7 Left knee Range of motion Show forest plot | 1 | | Mean Difference (IV, Fixed, 95% CI) | Subtotals only |
|
| 7.1 Wavelength < 660 nm | 0 | 0 | Mean Difference (IV, Fixed, 95% CI) | 0.0 [0.0, 0.0] |
| 7.2 Wavelength 820, 830 nm | 0 | 0 | Mean Difference (IV, Fixed, 95% CI) | 0.0 [0.0, 0.0] |
| 7.3 Wavelength 650‐950 nm | 1 | 35 | Mean Difference (IV, Fixed, 95% CI) | ‐23.60 [‐43.47, ‐3.73] |
| 8 Right knee ROM Show forest plot | 1 | | Mean Difference (IV, Fixed, 95% CI) | Subtotals only |
|
| 8.1 Wavelength < 660 nm | 0 | 0 | Mean Difference (IV, Fixed, 95% CI) | 0.0 [0.0, 0.0] |
| 8.2 Wavelength 820, 830 nm | 0 | 0 | Mean Difference (IV, Fixed, 95% CI) | 0.0 [0.0, 0.0] |
| 8.3 Wavelength 650‐950 nm | 1 | 35 | Mean Difference (IV, Fixed, 95% CI) | ‐12.90 [‐31.98, 6.18] |
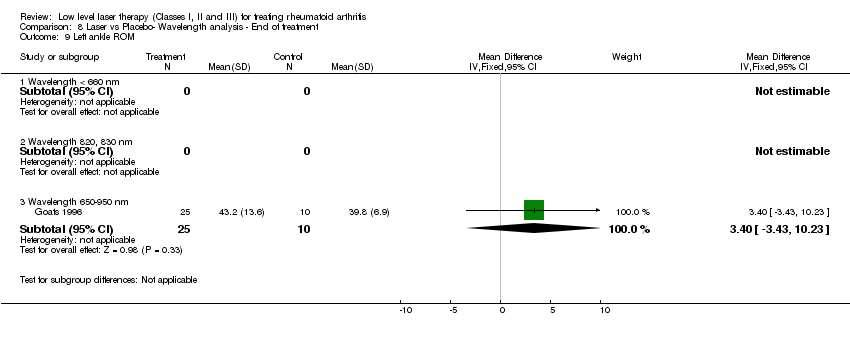
| 9 Left ankle ROM Show forest plot | 1 | | Mean Difference (IV, Fixed, 95% CI) | Subtotals only |
|
| 9.1 Wavelength < 660 nm | 0 | 0 | Mean Difference (IV, Fixed, 95% CI) | 0.0 [0.0, 0.0] |
| 9.2 Wavelength 820, 830 nm | 0 | 0 | Mean Difference (IV, Fixed, 95% CI) | 0.0 [0.0, 0.0] |
| 9.3 Wavelength 650‐950 nm | 1 | 35 | Mean Difference (IV, Fixed, 95% CI) | 3.40 [‐3.43, 10.23] |
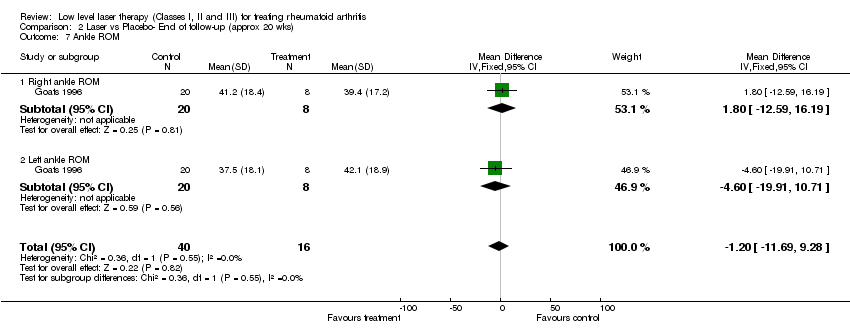
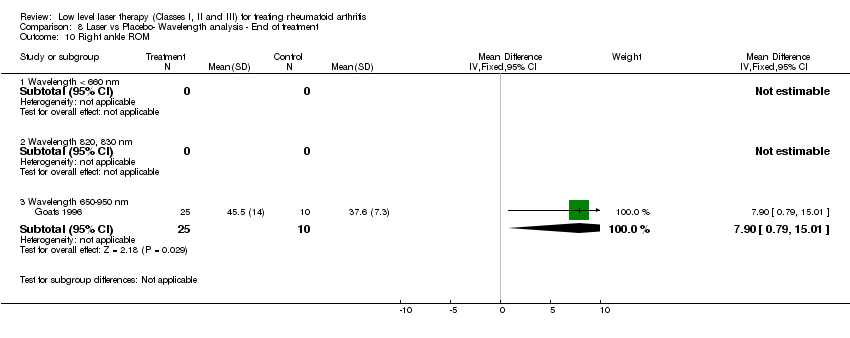
| 10 Right ankle ROM Show forest plot | 1 | | Mean Difference (IV, Fixed, 95% CI) | Subtotals only |
|
| 10.1 Wavelength < 660 nm | 0 | 0 | Mean Difference (IV, Fixed, 95% CI) | 0.0 [0.0, 0.0] |
| 10.2 Wavelength 820, 830 nm | 0 | 0 | Mean Difference (IV, Fixed, 95% CI) | 0.0 [0.0, 0.0] |
| 10.3 Wavelength 650‐950 nm | 1 | 35 | Mean Difference (IV, Fixed, 95% CI) | 7.90 [0.79, 15.01] |
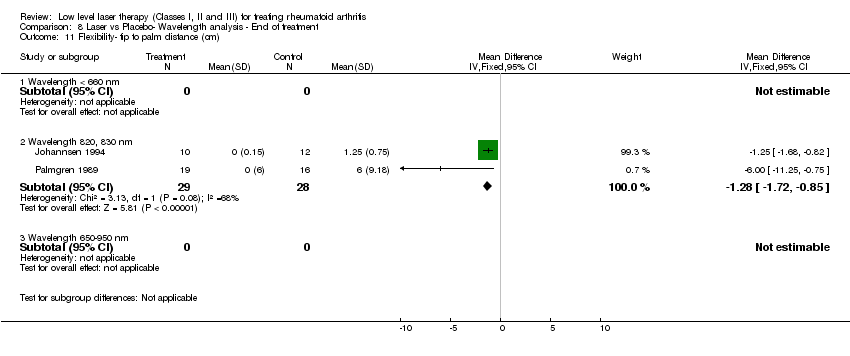
| 11 Flexibility‐ tip to palm distance (cm) Show forest plot | 2 | | Mean Difference (IV, Fixed, 95% CI) | Subtotals only |
|
| 11.1 Wavelength < 660 nm | 0 | 0 | Mean Difference (IV, Fixed, 95% CI) | 0.0 [0.0, 0.0] |
| 11.2 Wavelength 820, 830 nm | 2 | 57 | Mean Difference (IV, Fixed, 95% CI) | ‐1.28 [‐1.72, ‐0.85] |
| 11.3 Wavelength 650‐950 nm | 0 | 0 | Mean Difference (IV, Fixed, 95% CI) | 0.0 [0.0, 0.0] |
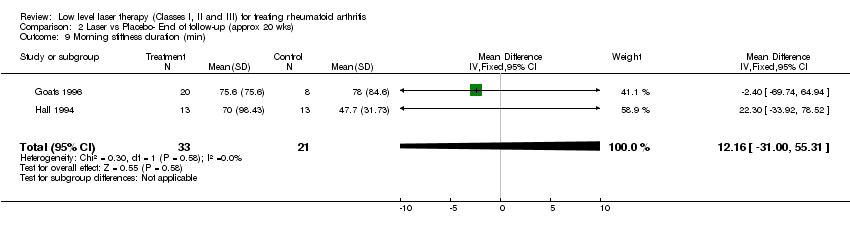
| 12 Morning stiffness duration (min) Show forest plot | 3 | | Mean Difference (IV, Fixed, 95% CI) | Subtotals only |
|
| 12.1 Wavelength < 660 nm | 0 | 0 | Mean Difference (IV, Fixed, 95% CI) | 0.0 [0.0, 0.0] |
| 12.2 Wavelength 820, 830 nm | 2 | 75 | Mean Difference (IV, Fixed, 95% CI) | ‐30.65 [‐55.71, ‐5.58] |
| 12.3 Wavelength 650‐950 nm | 1 | 35 | Mean Difference (IV, Fixed, 95% CI) | 40.80 [‐75.05, 156.65] |
| 13 Morning stiffness not improved Show forest plot | 1 | | Risk Ratio (M‐H, Fixed, 95% CI) | Subtotals only |
|
| 13.1 Wavelength < 660 nm | 0 | 0 | Risk Ratio (M‐H, Fixed, 95% CI) | 0.0 [0.0, 0.0] |
| 13.2 Wavelength 820, 830 nm | 1 | 22 | Risk Ratio (M‐H, Fixed, 95% CI) | 0.76 [0.49, 1.19] |
| 13.3 Wavelength 650‐950 nm | 0 | 0 | Risk Ratio (M‐H, Fixed, 95% CI) | 0.0 [0.0, 0.0] |
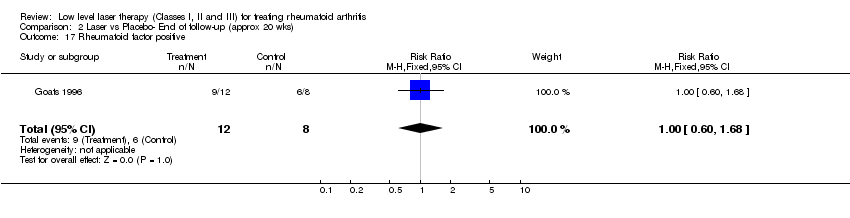
| 14 Rheumatoid factor positive Show forest plot | 1 | | Risk Ratio (M‐H, Fixed, 95% CI) | Subtotals only |
|
| 14.1 Wavelength < 660 nm | 0 | 0 | Risk Ratio (M‐H, Fixed, 95% CI) | 0.0 [0.0, 0.0] |
| 14.2 Wavelength 820, 830 nm | 0 | 0 | Risk Ratio (M‐H, Fixed, 95% CI) | 0.0 [0.0, 0.0] |
| 14.3 Wavelength 650‐950 nm | 1 | 35 | Risk Ratio (M‐H, Fixed, 95% CI) | 0.9 [0.61, 1.34] |
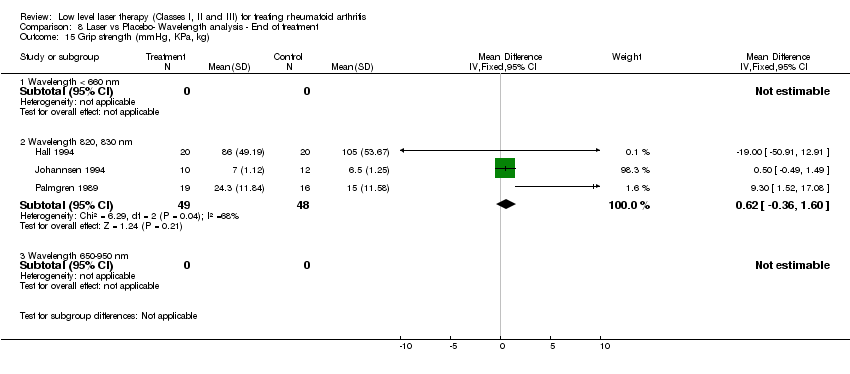
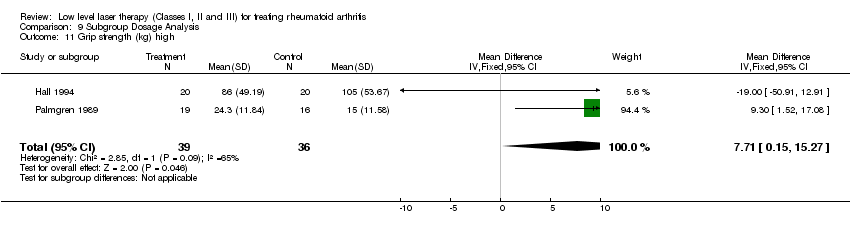
| 15 Grip strength (mmHg, KPa, kg) Show forest plot | 3 | | Mean Difference (IV, Fixed, 95% CI) | Subtotals only |
|
| 15.1 Wavelength < 660 nm | 0 | 0 | Mean Difference (IV, Fixed, 95% CI) | 0.0 [0.0, 0.0] |
| 15.2 Wavelength 820, 830 nm | 3 | 97 | Mean Difference (IV, Fixed, 95% CI) | 0.62 [‐0.36, 1.60] |
| 15.3 Wavelength 650‐950 nm | 0 | 0 | Mean Difference (IV, Fixed, 95% CI) | 0.0 [0.0, 0.0] |
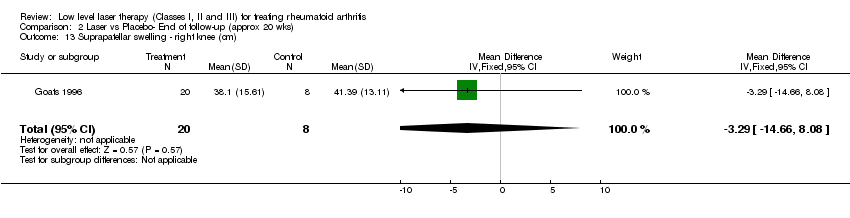
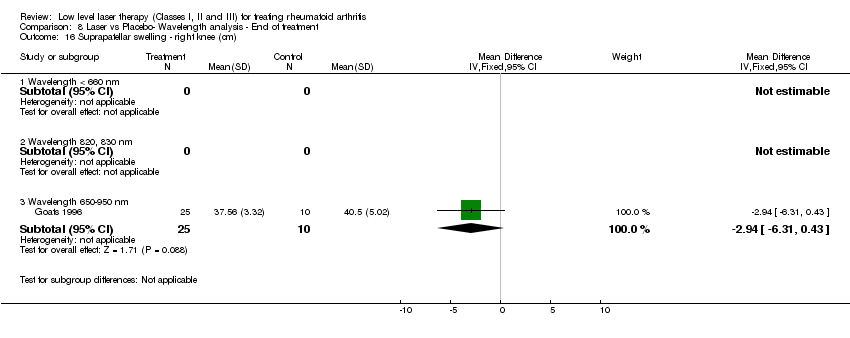
| 16 Suprapatellar swelling ‐ right knee (cm) Show forest plot | 1 | | Mean Difference (IV, Fixed, 95% CI) | Subtotals only |
|
| 16.1 Wavelength < 660 nm | 0 | 0 | Mean Difference (IV, Fixed, 95% CI) | 0.0 [0.0, 0.0] |
| 16.2 Wavelength 820, 830 nm | 0 | 0 | Mean Difference (IV, Fixed, 95% CI) | 0.0 [0.0, 0.0] |
| 16.3 Wavelength 650‐950 nm | 1 | 35 | Mean Difference (IV, Fixed, 95% CI) | ‐2.94 [‐6.31, 0.43] |
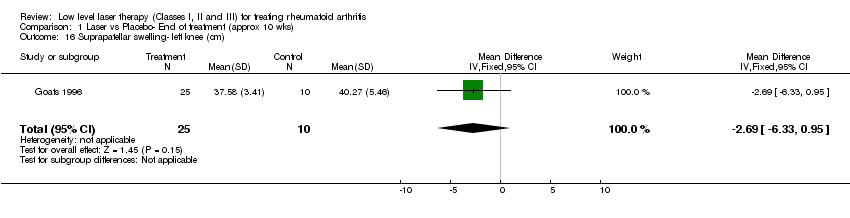
| 17 Suprapatellar swelling‐ left knee (cm) Show forest plot | 1 | | Mean Difference (IV, Fixed, 95% CI) | Subtotals only |
|
| 17.1 Wavelength < 660 nm | 0 | 0 | Mean Difference (IV, Fixed, 95% CI) | 0.0 [0.0, 0.0] |
| 17.2 Wavelength 820, 830 nm | 0 | 0 | Mean Difference (IV, Fixed, 95% CI) | 0.0 [0.0, 0.0] |
| 17.3 Wavelength 650‐950 nm | 1 | 35 | Mean Difference (IV, Fixed, 95% CI) | ‐2.69 [‐6.33, 0.95] |
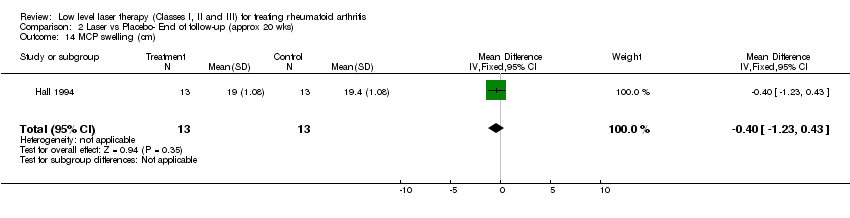
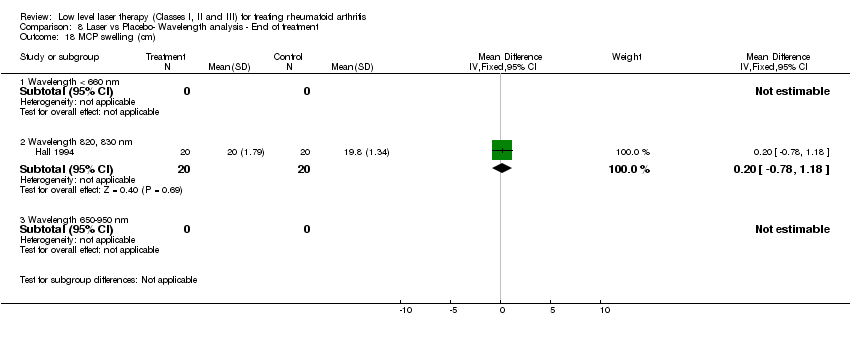
| 18 MCP swelling (cm) Show forest plot | 1 | | Mean Difference (IV, Fixed, 95% CI) | Subtotals only |
|
| 18.1 Wavelength < 660 nm | 0 | 0 | Mean Difference (IV, Fixed, 95% CI) | 0.0 [0.0, 0.0] |
| 18.2 Wavelength 820, 830 nm | 1 | 40 | Mean Difference (IV, Fixed, 95% CI) | 0.20 [‐0.78, 1.18] |
| 18.3 Wavelength 650‐950 nm | 0 | 0 | Mean Difference (IV, Fixed, 95% CI) | 0.0 [0.0, 0.0] |
| 19 PIP swelling (cm) Show forest plot | 2 | | Mean Difference (IV, Fixed, 95% CI) | Subtotals only |
|
| 19.1 Wavelength < 660 nm | 0 | 0 | Mean Difference (IV, Fixed, 95% CI) | 0.0 [0.0, 0.0] |
| 19.2 Wavelength 820, 830 nm | 2 | 75 | Mean Difference (IV, Fixed, 95% CI) | 0.53 [‐1.12, 2.18] |
| 19.3 Wavelength 650‐950 nm | 0 | 0 | Mean Difference (IV, Fixed, 95% CI) | 0.0 [0.0, 0.0] |
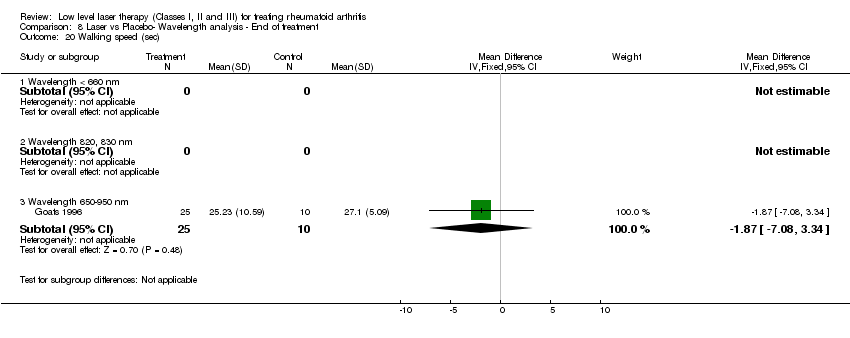
| 20 Walking speed (sec) Show forest plot | 1 | | Mean Difference (IV, Fixed, 95% CI) | Subtotals only |
|
| 20.1 Wavelength < 660 nm | 0 | 0 | Mean Difference (IV, Fixed, 95% CI) | 0.0 [0.0, 0.0] |
| 20.2 Wavelength 820, 830 nm | 0 | 0 | Mean Difference (IV, Fixed, 95% CI) | 0.0 [0.0, 0.0] |
| 20.3 Wavelength 650‐950 nm | 1 | 35 | Mean Difference (IV, Fixed, 95% CI) | ‐1.87 [‐7.08, 3.34] |
| 21 Fibrinogen Show forest plot | 1 | | Mean Difference (IV, Fixed, 95% CI) | Subtotals only |
|
| 21.1 Wavelength < 660 nm | 0 | 0 | Mean Difference (IV, Fixed, 95% CI) | 0.0 [0.0, 0.0] |
| 21.2 Wavelength 820, 830 nm | 1 | 35 | Mean Difference (IV, Fixed, 95% CI) | 1.5 [‐0.00, 3.00] |
| 21.3 Wavelength 650‐950 nm | 0 | 0 | Mean Difference (IV, Fixed, 95% CI) | 0.0 [0.0, 0.0] |
| 22 Leukocytes Show forest plot | 1 | | Mean Difference (IV, Fixed, 95% CI) | Subtotals only |
|
| 22.1 Wavelength < 660 nm | 0 | 0 | Mean Difference (IV, Fixed, 95% CI) | 0.0 [0.0, 0.0] |
| 22.2 Wavelength 820, 830 nm | 1 | 35 | Mean Difference (IV, Fixed, 95% CI) | 1.60 [0.62, 2.58] |
| 22.3 Wavelength 650‐950 nm | 0 | 0 | Mean Difference (IV, Fixed, 95% CI) | 0.0 [0.0, 0.0] |
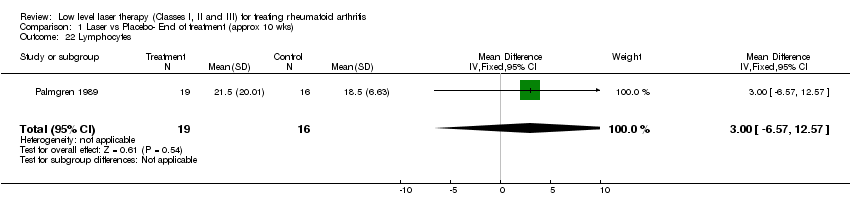
| 23 Lymphocytes Show forest plot | 1 | | Mean Difference (IV, Fixed, 95% CI) | Subtotals only |
|
| 23.1 Wavelength < 660 nm | 0 | 0 | Mean Difference (IV, Fixed, 95% CI) | 0.0 [0.0, 0.0] |
| 23.2 Wavelength 820, 830 nm | 1 | 35 | Mean Difference (IV, Fixed, 95% CI) | 3.0 [‐6.57, 12.57] |
| 23.3 Wavelength 650‐950 nm | 0 | 0 | Mean Difference (IV, Fixed, 95% CI) | 0.0 [0.0, 0.0] |
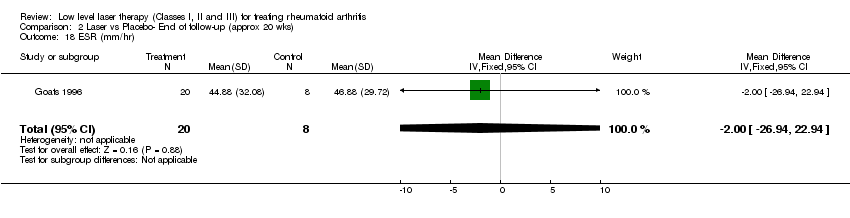
| 24 ESR (mm/hr) Show forest plot | 3 | | Mean Difference (IV, Fixed, 95% CI) | Subtotals only |
|
| 24.1 Wavelength < 660 nm | 0 | 0 | Mean Difference (IV, Fixed, 95% CI) | 0.0 [0.0, 0.0] |
| 24.2 Wavelength 820, 830 nm | 2 | 57 | Mean Difference (IV, Fixed, 95% CI) | ‐11.12 [‐16.21, ‐6.04] |
| 24.3 Wavelength 650‐950 nm | 1 | 35 | Mean Difference (IV, Fixed, 95% CI) | 8.27 [‐13.18, 29.72] |
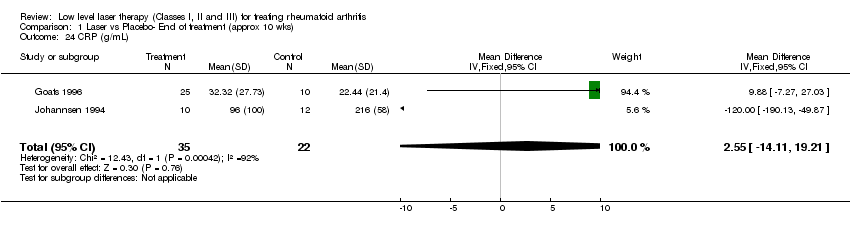
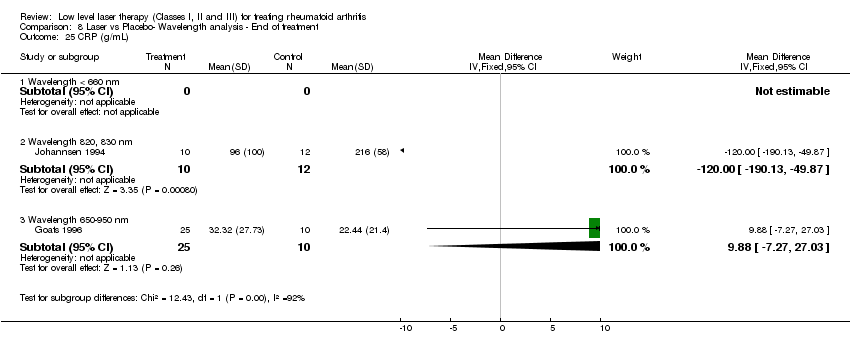
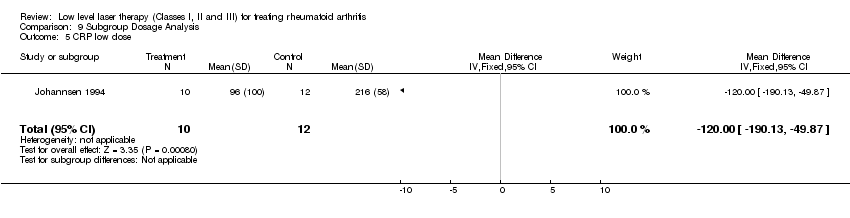
| 25 CRP (g/mL) Show forest plot | 2 | | Mean Difference (IV, Fixed, 95% CI) | Subtotals only |
|
| 25.1 Wavelength < 660 nm | 0 | 0 | Mean Difference (IV, Fixed, 95% CI) | 0.0 [0.0, 0.0] |
| 25.2 Wavelength 820, 830 nm | 1 | 22 | Mean Difference (IV, Fixed, 95% CI) | ‐120.0 [‐190.13, ‐49.87] |
| 25.3 Wavelength 650‐950 nm | 1 | 35 | Mean Difference (IV, Fixed, 95% CI) | 9.88 [‐7.27, 27.03] |
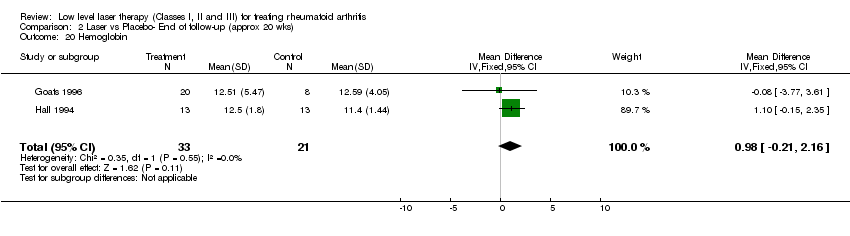
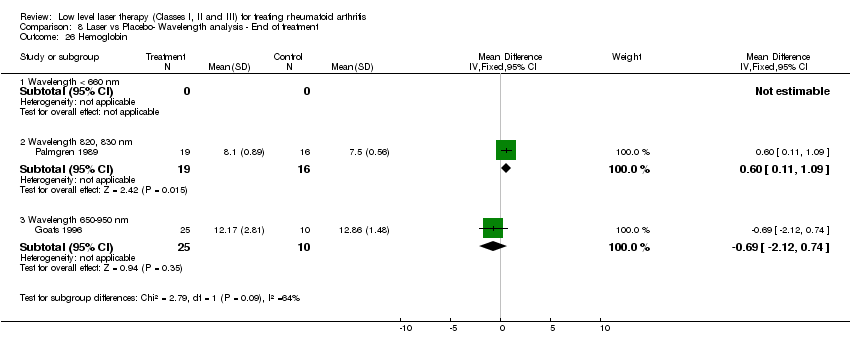
| 26 Hemoglobin Show forest plot | 2 | | Mean Difference (IV, Fixed, 95% CI) | Subtotals only |
|
| 26.1 Wavelength < 660 nm | 0 | 0 | Mean Difference (IV, Fixed, 95% CI) | 0.0 [0.0, 0.0] |
| 26.2 Wavelength 820, 830 nm | 1 | 35 | Mean Difference (IV, Fixed, 95% CI) | 0.60 [0.11, 1.09] |
| 26.3 Wavelength 650‐950 nm | 1 | 35 | Mean Difference (IV, Fixed, 95% CI) | ‐0.69 [‐2.12, 0.74] |
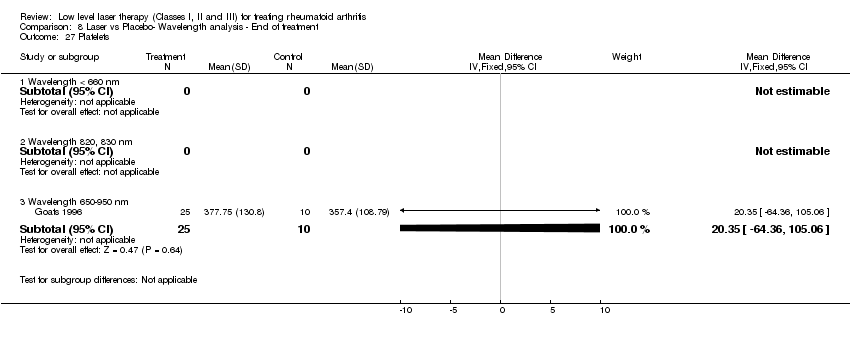
| 27 Platelets Show forest plot | 1 | | Mean Difference (IV, Fixed, 95% CI) | Subtotals only |
|
| 27.1 Wavelength < 660 nm | 0 | 0 | Mean Difference (IV, Fixed, 95% CI) | 0.0 [0.0, 0.0] |
| 27.2 Wavelength 820, 830 nm | 0 | 0 | Mean Difference (IV, Fixed, 95% CI) | 0.0 [0.0, 0.0] |
| 27.3 Wavelength 650‐950 nm | 1 | 35 | Mean Difference (IV, Fixed, 95% CI) | 20.35 [‐64.36, 105.06] |