Terapia con láser de baja intensidad (clases I, II y III) para el tratamiento de la artritis reumatoide
Referencias
Referencias de los estudios incluidos en esta revisión
Referencias de los estudios excluidos de esta revisión
Referencias adicionales
Characteristics of studies
Characteristics of included studies [ordered by study ID]
Ir a:
| Methods | Randomized Double‐blind | |
| Participants | Patients with active RA and symmetrical involvement of the metacarpophalangeal joint of the index. No change in other therapy was accepted during the study. | |
| Interventions | Patients were randomized to therapy on the MP joint of the right and left index with laser or placebo. Therapy was given on 3 alternate days a week for 3 consecutive weeks followed by an observation time of 4 weeks. Laser: He‐Ne | |
| Outcomes | Pain (VAS) | |
| Notes | Quality Jadad's | |
| Methods | Randomized | |
| Participants | Patients with RA affecting 2 or more of tibio‐femoral, talocrural, subtalar, midtarsal or MCP joints | |
| Interventions | Gr1: Laser: Ga‐As‐Al | |
| Outcomes | Pain (VAS 10 cm) | |
| Notes | Quality Jadad's: 2/5 | |
| Methods | Randomized | |
| Participants | Patients with RA, Steinbrocker functional class II or III, and active synovitis of some or all of the MCP and PIP joints | |
| Interventions | Laser: Ga‐As‐Al | |
| Outcomes | Pain (10 cm VAS) | |
| Notes | Quality Jadad's: 3/5 | |
| Methods | Randomized | |
| Participants | Participants with RA, Steinbrocker functional class I or II | |
| Interventions | Laser: GaAsAl | |
| Outcomes | Joint tenderness | |
| Notes | Quality Jadad's: 5/5 | |
| Methods | Randomized | |
| Participants | Patients with classic RA, Steinbrocker functional class between I and III | |
| Interventions | Laser: GaAlAs | |
| Outcomes | Joint swelling | |
| Notes | Quality Jadad's: 3/5 | |
| Methods | Partially blinded | |
| Participants | Participants with RA, defined by the American Rheumatism Association (ARA) | |
| Interventions | Laser: He‐Ne Placebo: Sham apparatus with no light, subjects closed eyes | |
| Outcomes | Pain (10 cm visual analogue scale) | |
| Notes | Quality Jadad's: 1/5 | |
Characteristics of excluded studies [ordered by study ID]
Ir a:
| Study | Reason for exclusion |
| Only abstract available | |
| Literature Review | |
| No control group | |
| Foreign language | |
| Literature Review | |
| Literature Review | |
| Patients with juvenile RA; no control group | |
| Insufficient statistical data | |
| Insufficient statistical data | |
| No control group | |
| Foreign language | |
| Although reported as double‐blind in the abstract, a reply from the authors indicated that this trial was not randomized | |
| Abstract only available in English; Article was in Russian | |
| Abstract only available in English; Article was in Russian | |
| Foreign language | |
| Insufficient statistical data | |
| Duplicate of Walker 1987 |
Data and analyses
| Outcome or subgroup title | No. of studies | No. of participants | Statistical method | Effect size |
| 1 Pain (Visual Analogue Scale 10 cm) Show forest plot | 3 | 147 | Mean Difference (IV, Fixed, 95% CI) | ‐1.10 [‐1.82, ‐0.39] |
| Analysis 1.1  Comparison 1 Laser vs Placebo‐ End of treatment (approx 10 wks), Outcome 1 Pain (Visual Analogue Scale 10 cm). | ||||
| 2 Pain (0‐12 scale) Show forest plot | 1 | 22 | Mean Difference (IV, Fixed, 95% CI) | ‐1.0 [‐1.77, ‐0.23] |
| Analysis 1.2  Comparison 1 Laser vs Placebo‐ End of treatment (approx 10 wks), Outcome 2 Pain (0‐12 scale). | ||||
| 3 McGill Pain questionnaire Show forest plot | 1 | 35 | Mean Difference (IV, Fixed, 95% CI) | 1.5 [‐1.22, 4.22] |
| Analysis 1.3  Comparison 1 Laser vs Placebo‐ End of treatment (approx 10 wks), Outcome 3 McGill Pain questionnaire. | ||||
| 4 Ritchie Index Show forest plot | 1 | 40 | Mean Difference (IV, Fixed, 95% CI) | 2.60 [‐4.50, 9.70] |
| Analysis 1.4  Comparison 1 Laser vs Placebo‐ End of treatment (approx 10 wks), Outcome 4 Ritchie Index. | ||||
| 5 Health Assessment Questionnaire (HAQ) Show forest plot | 2 | 75 | Mean Difference (IV, Fixed, 95% CI) | 0.93 [‐2.01, 3.87] |
| Analysis 1.5  Comparison 1 Laser vs Placebo‐ End of treatment (approx 10 wks), Outcome 5 Health Assessment Questionnaire (HAQ). | ||||
| 6 MCP ROM (degrees) Show forest plot | 1 | 40 | Mean Difference (IV, Fixed, 95% CI) | ‐0.5 [‐15.99, 14.99] |
| Analysis 1.6  Comparison 1 Laser vs Placebo‐ End of treatment (approx 10 wks), Outcome 6 MCP ROM (degrees). | ||||
| 7 PIP ROM (degrees) Show forest plot | 1 | 40 | Mean Difference (IV, Fixed, 95% CI) | 4.0 [‐6.60, 14.60] |
| Analysis 1.7  Comparison 1 Laser vs Placebo‐ End of treatment (approx 10 wks), Outcome 7 PIP ROM (degrees). | ||||
| 8 Knee ROM Show forest plot | 1 | 70 | Mean Difference (IV, Fixed, 95% CI) | ‐18.03 [‐31.80, ‐4.27] |
| Analysis 1.8  Comparison 1 Laser vs Placebo‐ End of treatment (approx 10 wks), Outcome 8 Knee ROM. | ||||
| 8.1 Right knee ROM | 1 | 35 | Mean Difference (IV, Fixed, 95% CI) | ‐12.90 [‐31.98, 6.18] |
| 8.2 Left knee ROM | 1 | 35 | Mean Difference (IV, Fixed, 95% CI) | ‐23.60 [‐43.47, ‐3.73] |
| 9 Ankle ROM Show forest plot | 1 | 70 | Mean Difference (IV, Fixed, 95% CI) | 4.60 [‐0.33, 9.53] |
| Analysis 1.9  Comparison 1 Laser vs Placebo‐ End of treatment (approx 10 wks), Outcome 9 Ankle ROM. | ||||
| 9.1 Right ankle ROM | 1 | 35 | Mean Difference (IV, Fixed, 95% CI) | 5.90 [‐1.21, 13.01] |
| 9.2 Left ankle ROM | 1 | 35 | Mean Difference (IV, Fixed, 95% CI) | 3.40 [‐3.43, 10.23] |
| 10 Flexibility‐ tip to palm distance (cm) Show forest plot | 2 | 57 | Mean Difference (IV, Fixed, 95% CI) | ‐1.28 [‐1.72, ‐0.85] |
| Analysis 1.10  Comparison 1 Laser vs Placebo‐ End of treatment (approx 10 wks), Outcome 10 Flexibility‐ tip to palm distance (cm). | ||||
| 11 Morning stiffness duration (min) Show forest plot | 3 | 110 | Mean Difference (IV, Fixed, 95% CI) | ‐27.45 [‐51.95, ‐2.95] |
| Analysis 1.11  Comparison 1 Laser vs Placebo‐ End of treatment (approx 10 wks), Outcome 11 Morning stiffness duration (min). | ||||
| 12 Morning stiffness not improved Show forest plot | 1 | 22 | Risk Ratio (M‐H, Fixed, 95% CI) | 0.76 [0.49, 1.19] |
| Analysis 1.12  Comparison 1 Laser vs Placebo‐ End of treatment (approx 10 wks), Outcome 12 Morning stiffness not improved. | ||||
| 13 Rheumatoid factor positive Show forest plot | 1 | 35 | Risk Ratio (M‐H, Fixed, 95% CI) | 0.9 [0.61, 1.34] |
| Analysis 1.13  Comparison 1 Laser vs Placebo‐ End of treatment (approx 10 wks), Outcome 13 Rheumatoid factor positive. | ||||
| 14 Grip strength Show forest plot | 3 | 97 | Mean Difference (IV, Fixed, 95% CI) | 0.62 [‐0.36, 1.60] |
| Analysis 1.14  Comparison 1 Laser vs Placebo‐ End of treatment (approx 10 wks), Outcome 14 Grip strength. | ||||
| 14.1 Grip strength (mmHg) | 2 | 75 | Mean Difference (IV, Fixed, 95% CI) | 7.71 [0.15, 15.27] |
| 14.2 Grip strength (kg) | 1 | 22 | Mean Difference (IV, Fixed, 95% CI) | 0.5 [‐0.49, 1.49] |
| 15 Suprapatellar swelling ‐ right knee (cm) Show forest plot | 1 | 35 | Mean Difference (IV, Fixed, 95% CI) | ‐2.94 [‐6.31, 0.43] |
| Analysis 1.15  Comparison 1 Laser vs Placebo‐ End of treatment (approx 10 wks), Outcome 15 Suprapatellar swelling ‐ right knee (cm). | ||||
| 16 Suprapatellar swelling‐ left knee (cm) Show forest plot | 1 | 35 | Mean Difference (IV, Fixed, 95% CI) | ‐2.69 [‐6.33, 0.95] |
| Analysis 1.16  Comparison 1 Laser vs Placebo‐ End of treatment (approx 10 wks), Outcome 16 Suprapatellar swelling‐ left knee (cm). | ||||
| 17 MCP swelling (cm) Show forest plot | 1 | 40 | Mean Difference (IV, Fixed, 95% CI) | 0.20 [‐0.78, 1.18] |
| Analysis 1.17  Comparison 1 Laser vs Placebo‐ End of treatment (approx 10 wks), Outcome 17 MCP swelling (cm). | ||||
| 18 PIP swelling (cm) Show forest plot | 2 | 75 | Mean Difference (IV, Fixed, 95% CI) | 0.53 [‐1.12, 2.18] |
| Analysis 1.18  Comparison 1 Laser vs Placebo‐ End of treatment (approx 10 wks), Outcome 18 PIP swelling (cm). | ||||
| 19 Walking speed (sec) Show forest plot | 1 | 35 | Mean Difference (IV, Fixed, 95% CI) | ‐1.87 [‐7.08, 3.34] |
| Analysis 1.19  Comparison 1 Laser vs Placebo‐ End of treatment (approx 10 wks), Outcome 19 Walking speed (sec). | ||||
| 20 Fibrinogen Show forest plot | 1 | 35 | Mean Difference (IV, Fixed, 95% CI) | 1.5 [‐0.00, 3.00] |
| Analysis 1.20  Comparison 1 Laser vs Placebo‐ End of treatment (approx 10 wks), Outcome 20 Fibrinogen. | ||||
| 21 Leukocytes Show forest plot | 1 | 35 | Mean Difference (IV, Fixed, 95% CI) | 1.60 [0.62, 2.58] |
| Analysis 1.21  Comparison 1 Laser vs Placebo‐ End of treatment (approx 10 wks), Outcome 21 Leukocytes. | ||||
| 22 Lymphocytes Show forest plot | 1 | 35 | Mean Difference (IV, Fixed, 95% CI) | 3.0 [‐6.57, 12.57] |
| Analysis 1.22  Comparison 1 Laser vs Placebo‐ End of treatment (approx 10 wks), Outcome 22 Lymphocytes. | ||||
| 23 ESR (mm/hr) Show forest plot | 3 | 92 | Mean Difference (IV, Fixed, 95% CI) | ‐10.09 [‐15.04, ‐5.15] |
| Analysis 1.23  Comparison 1 Laser vs Placebo‐ End of treatment (approx 10 wks), Outcome 23 ESR (mm/hr). | ||||
| 24 CRP (g/mL) Show forest plot | 2 | 57 | Mean Difference (IV, Fixed, 95% CI) | 2.55 [‐14.11, 19.21] |
| Analysis 1.24  Comparison 1 Laser vs Placebo‐ End of treatment (approx 10 wks), Outcome 24 CRP (g/mL). | ||||
| 25 Hemoglobin Show forest plot | 2 | 70 | Mean Difference (IV, Fixed, 95% CI) | 0.47 [0.01, 0.93] |
| Analysis 1.25  Comparison 1 Laser vs Placebo‐ End of treatment (approx 10 wks), Outcome 25 Hemoglobin. | ||||
| 26 Platelets Show forest plot | 1 | 35 | Mean Difference (IV, Fixed, 95% CI) | 20.35 [‐64.36, 105.06] |
| Analysis 1.26  Comparison 1 Laser vs Placebo‐ End of treatment (approx 10 wks), Outcome 26 Platelets. | ||||
| Outcome or subgroup title | No. of studies | No. of participants | Statistical method | Effect size |
| 1 Pain Show forest plot | 2 | 54 | Mean Difference (IV, Fixed, 95% CI) | 0.06 [‐1.24, 1.36] |
| Analysis 2.1  Comparison 2 Laser vs Placebo‐ End of follow‐up (approx 20 wks), Outcome 1 Pain. | ||||
| 1.1 Pain (10 cm visual analogue scale) | 2 | 54 | Mean Difference (IV, Fixed, 95% CI) | 0.06 [‐1.24, 1.36] |
| 2 McGill Pain questionnaire Show forest plot | 1 | 28 | Mean Difference (IV, Fixed, 95% CI) | 1.39 [‐2.23, 5.01] |
| Analysis 2.2  Comparison 2 Laser vs Placebo‐ End of follow‐up (approx 20 wks), Outcome 2 McGill Pain questionnaire. | ||||
| 3 Health Assessment Questionnaire (HAQ) Show forest plot | 2 | 54 | Mean Difference (IV, Fixed, 95% CI) | 1.10 [‐2.80, 4.99] |
| Analysis 2.3  Comparison 2 Laser vs Placebo‐ End of follow‐up (approx 20 wks), Outcome 3 Health Assessment Questionnaire (HAQ). | ||||
| 4 Ritchie Index Show forest plot | 1 | 26 | Mean Difference (IV, Fixed, 95% CI) | 3.30 [‐5.74, 12.34] |
| Analysis 2.4  Comparison 2 Laser vs Placebo‐ End of follow‐up (approx 20 wks), Outcome 4 Ritchie Index. | ||||
| 5 PIP ROM (degrees) Show forest plot | 1 | 26 | Mean Difference (IV, Fixed, 95% CI) | 2.0 [‐16.30, 20.30] |
| Analysis 2.5  Comparison 2 Laser vs Placebo‐ End of follow‐up (approx 20 wks), Outcome 5 PIP ROM (degrees). | ||||
| 6 Knee ROM Show forest plot | 1 | 56 | Mean Difference (IV, Fixed, 95% CI) | ‐11.47 [‐31.26, 8.31] |
| Analysis 2.6  Comparison 2 Laser vs Placebo‐ End of follow‐up (approx 20 wks), Outcome 6 Knee ROM. | ||||
| 6.1 Right knee ROM | 1 | 28 | Mean Difference (IV, Fixed, 95% CI) | ‐13.60 [‐41.44, 14.24] |
| 6.2 Left knee ROM | 1 | 28 | Mean Difference (IV, Fixed, 95% CI) | ‐9.30 [‐37.43, 18.83] |
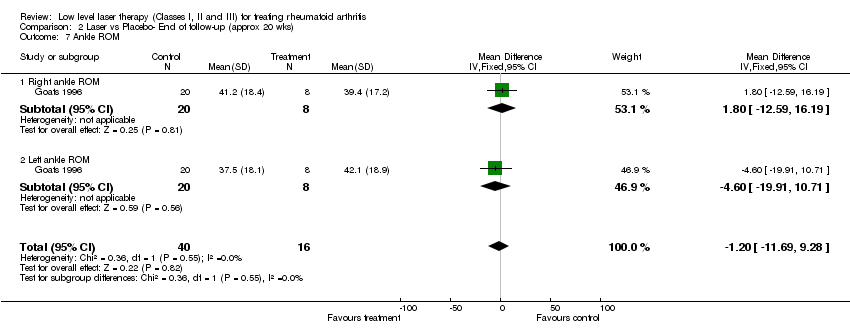
| 7 Ankle ROM Show forest plot | 1 | 56 | Mean Difference (IV, Fixed, 95% CI) | ‐1.20 [‐11.69, 9.28] |
| Analysis 2.7  Comparison 2 Laser vs Placebo‐ End of follow‐up (approx 20 wks), Outcome 7 Ankle ROM. | ||||
| 7.1 Right ankle ROM | 1 | 28 | Mean Difference (IV, Fixed, 95% CI) | 1.80 [‐12.59, 16.19] |
| 7.2 Left ankle ROM | 1 | 28 | Mean Difference (IV, Fixed, 95% CI) | ‐4.60 [‐19.91, 10.71] |
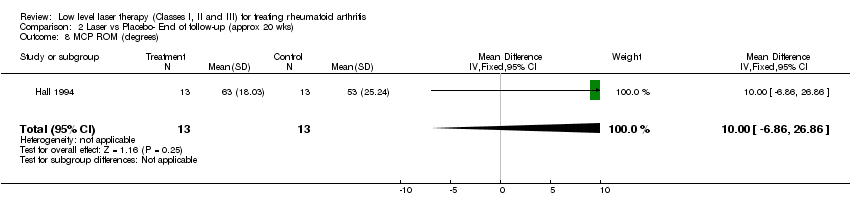
| 8 MCP ROM (degrees) Show forest plot | 1 | 26 | Mean Difference (IV, Fixed, 95% CI) | 10.0 [‐6.86, 26.86] |
| Analysis 2.8  Comparison 2 Laser vs Placebo‐ End of follow‐up (approx 20 wks), Outcome 8 MCP ROM (degrees). | ||||
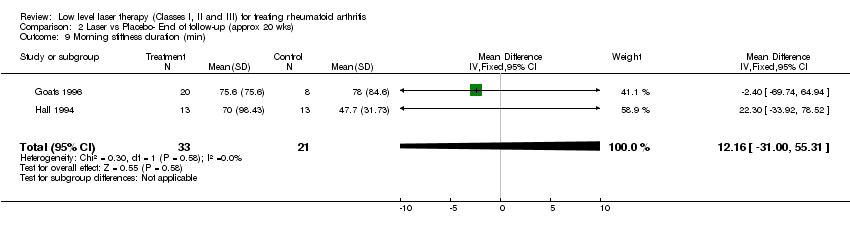
| 9 Morning stiffness duration (min) Show forest plot | 2 | 54 | Mean Difference (IV, Fixed, 95% CI) | 12.16 [‐31.00, 55.31] |
| Analysis 2.9  Comparison 2 Laser vs Placebo‐ End of follow‐up (approx 20 wks), Outcome 9 Morning stiffness duration (min). | ||||
| 10 Walking speed (sec) Show forest plot | 1 | 28 | Mean Difference (IV, Fixed, 95% CI) | ‐1.91 [‐12.60, 8.78] |
| Analysis 2.10  Comparison 2 Laser vs Placebo‐ End of follow‐up (approx 20 wks), Outcome 10 Walking speed (sec). | ||||
| 11 Grip strength Show forest plot | 1 | 26 | Mean Difference (IV, Fixed, 95% CI) | ‐29.0 [‐61.44, 3.44] |
| Analysis 2.11  Comparison 2 Laser vs Placebo‐ End of follow‐up (approx 20 wks), Outcome 11 Grip strength. | ||||
| 11.1 Grip strength (mmHg) | 1 | 26 | Mean Difference (IV, Fixed, 95% CI) | ‐29.0 [‐61.44, 3.44] |
| 11.2 Grip strength (kg) | 0 | 0 | Mean Difference (IV, Fixed, 95% CI) | 0.0 [0.0, 0.0] |
| 12 Suprapatellar swelling‐ left knee (cm) Show forest plot | 1 | 28 | Mean Difference (IV, Fixed, 95% CI) | ‐2.89 [‐14.38, 8.60] |
| Analysis 2.12  Comparison 2 Laser vs Placebo‐ End of follow‐up (approx 20 wks), Outcome 12 Suprapatellar swelling‐ left knee (cm). | ||||
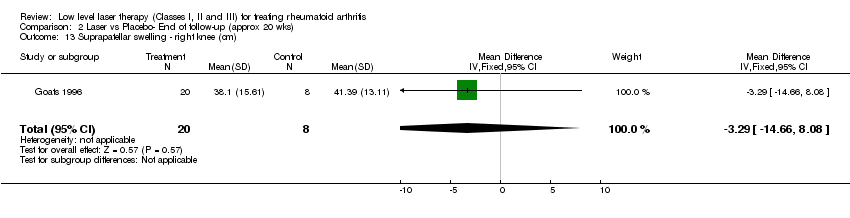
| 13 Suprapatellar swelling ‐ right knee (cm) Show forest plot | 1 | 28 | Mean Difference (IV, Fixed, 95% CI) | ‐3.29 [‐14.66, 8.08] |
| Analysis 2.13  Comparison 2 Laser vs Placebo‐ End of follow‐up (approx 20 wks), Outcome 13 Suprapatellar swelling ‐ right knee (cm). | ||||
| 14 MCP swelling (cm) Show forest plot | 1 | 26 | Mean Difference (IV, Fixed, 95% CI) | ‐0.40 [‐1.23, 0.43] |
| Analysis 2.14  Comparison 2 Laser vs Placebo‐ End of follow‐up (approx 20 wks), Outcome 14 MCP swelling (cm). | ||||
| 15 PIP swelling (cm) Show forest plot | 1 | 26 | Mean Difference (IV, Fixed, 95% CI) | 0.90 [‐1.88, 3.68] |
| Analysis 2.15  Comparison 2 Laser vs Placebo‐ End of follow‐up (approx 20 wks), Outcome 15 PIP swelling (cm). | ||||
| 16 Thermographic index Show forest plot | 1 | 26 | Mean Difference (IV, Fixed, 95% CI) | 0.60 [‐0.11, 1.31] |
| Analysis 2.16  Comparison 2 Laser vs Placebo‐ End of follow‐up (approx 20 wks), Outcome 16 Thermographic index. | ||||
| 17 Rheumatoid factor positive Show forest plot | 1 | 20 | Risk Ratio (M‐H, Fixed, 95% CI) | 1.0 [0.60, 1.68] |
| Analysis 2.17  Comparison 2 Laser vs Placebo‐ End of follow‐up (approx 20 wks), Outcome 17 Rheumatoid factor positive. | ||||
| 18 ESR (mm/hr) Show forest plot | 1 | 28 | Mean Difference (IV, Fixed, 95% CI) | ‐2.0 [‐26.94, 22.94] |
| Analysis 2.18  Comparison 2 Laser vs Placebo‐ End of follow‐up (approx 20 wks), Outcome 18 ESR (mm/hr). | ||||
| 19 CRP (g/mL) Show forest plot | 2 | 54 | Mean Difference (IV, Fixed, 95% CI) | ‐4.21 [‐20.25, 11.83] |
| Analysis 2.19  Comparison 2 Laser vs Placebo‐ End of follow‐up (approx 20 wks), Outcome 19 CRP (g/mL). | ||||
| 20 Hemoglobin Show forest plot | 2 | 54 | Mean Difference (IV, Fixed, 95% CI) | 0.98 [‐0.21, 2.16] |
| Analysis 2.20  Comparison 2 Laser vs Placebo‐ End of follow‐up (approx 20 wks), Outcome 20 Hemoglobin. | ||||
| 21 Platelets Show forest plot | 2 | 54 | Mean Difference (IV, Fixed, 95% CI) | 32.68 [‐37.76, 103.11] |
| Analysis 2.21  Comparison 2 Laser vs Placebo‐ End of follow‐up (approx 20 wks), Outcome 21 Platelets. | ||||
| Outcome or subgroup title | No. of studies | No. of participants | Statistical method | Effect size |
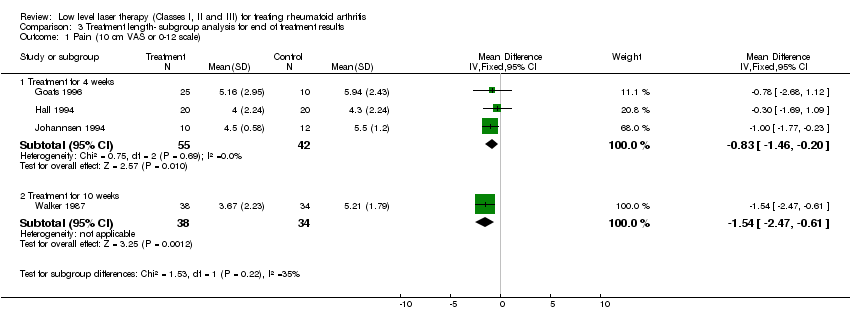
| 1 Pain (10 cm VAS or 0‐12 scale) Show forest plot | 4 | Mean Difference (IV, Fixed, 95% CI) | Subtotals only | |
| Analysis 3.1  Comparison 3 Treatment length‐ subgroup analysis for end of treatment results, Outcome 1 Pain (10 cm VAS or 0‐12 scale). | ||||
| 1.1 Treatment for 4 weeks | 3 | 97 | Mean Difference (IV, Fixed, 95% CI) | ‐0.83 [‐1.46, ‐0.20] |
| 1.2 Treatment for 10 weeks | 1 | 72 | Mean Difference (IV, Fixed, 95% CI) | ‐1.54 [‐2.47, ‐0.61] |
| Outcome or subgroup title | No. of studies | No. of participants | Statistical method | Effect size |
| 1 Pain (10 cm VAS or 0‐12 scale) Show forest plot | 2 | Mean Difference (IV, Fixed, 95% CI) | Subtotals only | |
| Analysis 4.1  Comparison 4 Treatment length‐ subgroup analysis for end of follow up results, Outcome 1 Pain (10 cm VAS or 0‐12 scale). | ||||
| 1.1 Treatment for 4 weeks | 2 | 54 | Mean Difference (IV, Fixed, 95% CI) | 0.06 [‐1.24, 1.36] |
| 1.2 Treatment for 10 weeks | 0 | 0 | Mean Difference (IV, Fixed, 95% CI) | 0.0 [0.0, 0.0] |
| Outcome or subgroup title | No. of studies | No. of participants | Statistical method | Effect size |
| 1 Pain at end of treatment Show forest plot | 4 | 169 | Mean Difference (IV, Fixed, 95% CI) | ‐1.05 [‐1.58, ‐0.53] |
| Analysis 5.1  Comparison 5 Methodologic quality: low (<3) vs high (=> 3), Outcome 1 Pain at end of treatment. | ||||
| 1.1 Low quality (<3) | 2 | 107 | Mean Difference (IV, Fixed, 95% CI) | ‐1.39 [‐2.23, ‐0.56] |
| 1.2 High quality (=> 3) | 2 | 62 | Mean Difference (IV, Fixed, 95% CI) | ‐0.84 [‐1.51, ‐0.16] |
| Outcome or subgroup title | No. of studies | No. of participants | Statistical method | Effect size |
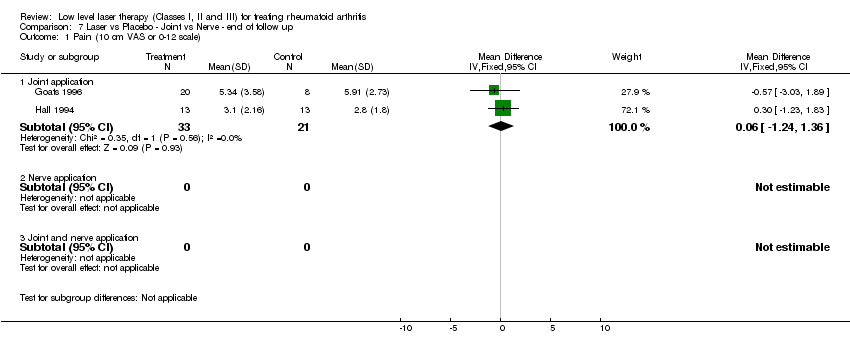
| 1 Pain (10 cm VAS or 0‐12 scale) Show forest plot | 4 | Mean Difference (IV, Fixed, 95% CI) | Subtotals only | |
| Analysis 6.1  Comparison 6 Laser vs Placebo ‐ Joint vs Nerve ‐ end of treatment, Outcome 1 Pain (10 cm VAS or 0‐12 scale). | ||||
| 1.1 Joint application | 3 | 97 | Mean Difference (IV, Fixed, 95% CI) | ‐0.83 [‐1.46, ‐0.20] |
| 1.2 Nerve application | 0 | 0 | Mean Difference (IV, Fixed, 95% CI) | 0.0 [0.0, 0.0] |
| 1.3 Joint and nerve application | 1 | 72 | Mean Difference (IV, Fixed, 95% CI) | ‐1.54 [‐2.47, ‐0.61] |
| Outcome or subgroup title | No. of studies | No. of participants | Statistical method | Effect size |
| 1 Pain (10 cm VAS or 0‐12 scale) Show forest plot | 2 | Mean Difference (IV, Fixed, 95% CI) | Subtotals only | |
| Analysis 7.1  Comparison 7 Laser vs Placebo ‐ Joint vs Nerve ‐ end of follow up, Outcome 1 Pain (10 cm VAS or 0‐12 scale). | ||||
| 1.1 Joint application | 2 | 54 | Mean Difference (IV, Fixed, 95% CI) | 0.06 [‐1.24, 1.36] |
| 1.2 Nerve application | 0 | 0 | Mean Difference (IV, Fixed, 95% CI) | 0.0 [0.0, 0.0] |
| 1.3 Joint and nerve application | 0 | 0 | Mean Difference (IV, Fixed, 95% CI) | 0.0 [0.0, 0.0] |
| Outcome or subgroup title | No. of studies | No. of participants | Statistical method | Effect size |
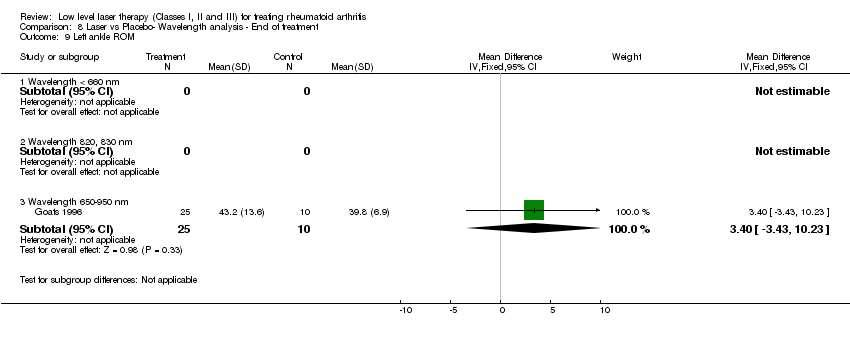
| 1 Pain Show forest plot | 4 | Mean Difference (IV, Fixed, 95% CI) | Subtotals only | |
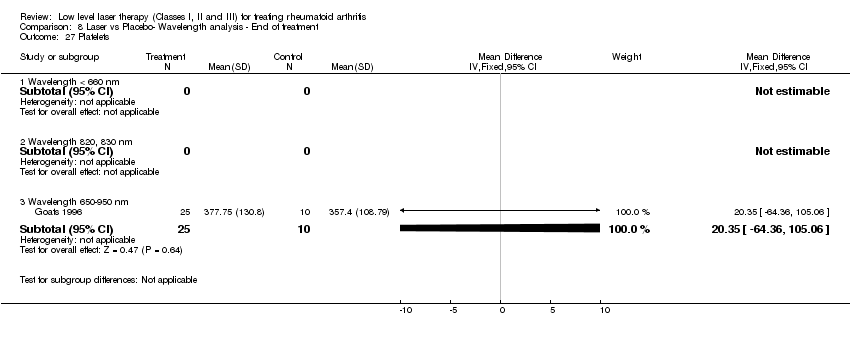
| Analysis 8.1  Comparison 8 Laser vs Placebo‐ Wavelength analysis ‐ End of treatment, Outcome 1 Pain. | ||||
| 1.1 Wavelength < 660 nm | 1 | 72 | Mean Difference (IV, Fixed, 95% CI) | ‐1.54 [‐2.47, ‐0.61] |
| 1.2 Wavelength 820, 830 nm | 2 | 62 | Mean Difference (IV, Fixed, 95% CI) | ‐0.84 [‐1.51, ‐0.16] |
| 1.3 Wavelength 650‐950 nm | 1 | 35 | Mean Difference (IV, Fixed, 95% CI) | ‐0.78 [‐2.68, 1.12] |
| 2 McGill Pain questionnaire Show forest plot | 1 | Mean Difference (IV, Fixed, 95% CI) | Subtotals only | |
| Analysis 8.2  Comparison 8 Laser vs Placebo‐ Wavelength analysis ‐ End of treatment, Outcome 2 McGill Pain questionnaire. | ||||
| 2.1 Wavelength < 660 nm | 0 | 0 | Mean Difference (IV, Fixed, 95% CI) | 0.0 [0.0, 0.0] |
| 2.2 Wavelength 820, 830 nm | 0 | 0 | Mean Difference (IV, Fixed, 95% CI) | 0.0 [0.0, 0.0] |
| 2.3 Wavelength 650‐950 nm | 1 | 35 | Mean Difference (IV, Fixed, 95% CI) | 1.5 [‐1.22, 4.22] |
| 3 Ritchie Index Show forest plot | 1 | Mean Difference (IV, Fixed, 95% CI) | Subtotals only | |
| Analysis 8.3  Comparison 8 Laser vs Placebo‐ Wavelength analysis ‐ End of treatment, Outcome 3 Ritchie Index. | ||||
| 3.1 Wavelength < 660 nm | 0 | 0 | Mean Difference (IV, Fixed, 95% CI) | 0.0 [0.0, 0.0] |
| 3.2 Wavelength 820, 830 nm | 1 | 40 | Mean Difference (IV, Fixed, 95% CI) | 2.60 [‐4.50, 9.70] |
| 3.3 Wavelength 650‐950 nm | 0 | 0 | Mean Difference (IV, Fixed, 95% CI) | 0.0 [0.0, 0.0] |
| 4 Health Assessment Questionnaire (HAQ) Show forest plot | 2 | Mean Difference (IV, Fixed, 95% CI) | Subtotals only | |
| Analysis 8.4  Comparison 8 Laser vs Placebo‐ Wavelength analysis ‐ End of treatment, Outcome 4 Health Assessment Questionnaire (HAQ). | ||||
| 4.1 Wavelength < 660 nm | 0 | 0 | Mean Difference (IV, Fixed, 95% CI) | 0.0 [0.0, 0.0] |
| 4.2 Wavelength 820, 830 nm | 1 | 40 | Mean Difference (IV, Fixed, 95% CI) | 1.25 [‐2.09, 4.59] |
| 4.3 Wavelength 650‐950 nm | 1 | 35 | Mean Difference (IV, Fixed, 95% CI) | ‐0.18 [‐6.39, 6.03] |
| 5 MCP ROM (degrees) Show forest plot | 1 | Mean Difference (IV, Fixed, 95% CI) | Subtotals only | |
| Analysis 8.5  Comparison 8 Laser vs Placebo‐ Wavelength analysis ‐ End of treatment, Outcome 5 MCP ROM (degrees). | ||||
| 5.1 Wavelength < 660 nm | 0 | 0 | Mean Difference (IV, Fixed, 95% CI) | 0.0 [0.0, 0.0] |
| 5.2 Wavelength 820, 830 nm | 1 | 40 | Mean Difference (IV, Fixed, 95% CI) | ‐0.5 [‐15.99, 14.99] |
| 5.3 Wavelength 650‐950 nm | 0 | 0 | Mean Difference (IV, Fixed, 95% CI) | 0.0 [0.0, 0.0] |
| 6 PIP ROM (degrees) Show forest plot | 1 | Mean Difference (IV, Fixed, 95% CI) | Subtotals only | |
| Analysis 8.6  Comparison 8 Laser vs Placebo‐ Wavelength analysis ‐ End of treatment, Outcome 6 PIP ROM (degrees). | ||||
| 6.1 Wavelength < 660 nm | 0 | 0 | Mean Difference (IV, Fixed, 95% CI) | 0.0 [0.0, 0.0] |
| 6.2 Wavelength 820, 830 nm | 1 | 40 | Mean Difference (IV, Fixed, 95% CI) | 4.0 [‐6.60, 14.60] |
| 6.3 Wavelength 650‐950 nm | 0 | 0 | Mean Difference (IV, Fixed, 95% CI) | 0.0 [0.0, 0.0] |
| 7 Left knee Range of motion Show forest plot | 1 | Mean Difference (IV, Fixed, 95% CI) | Subtotals only | |
| Analysis 8.7  Comparison 8 Laser vs Placebo‐ Wavelength analysis ‐ End of treatment, Outcome 7 Left knee Range of motion. | ||||
| 7.1 Wavelength < 660 nm | 0 | 0 | Mean Difference (IV, Fixed, 95% CI) | 0.0 [0.0, 0.0] |
| 7.2 Wavelength 820, 830 nm | 0 | 0 | Mean Difference (IV, Fixed, 95% CI) | 0.0 [0.0, 0.0] |
| 7.3 Wavelength 650‐950 nm | 1 | 35 | Mean Difference (IV, Fixed, 95% CI) | ‐23.60 [‐43.47, ‐3.73] |
| 8 Right knee ROM Show forest plot | 1 | Mean Difference (IV, Fixed, 95% CI) | Subtotals only | |
| Analysis 8.8  Comparison 8 Laser vs Placebo‐ Wavelength analysis ‐ End of treatment, Outcome 8 Right knee ROM. | ||||
| 8.1 Wavelength < 660 nm | 0 | 0 | Mean Difference (IV, Fixed, 95% CI) | 0.0 [0.0, 0.0] |
| 8.2 Wavelength 820, 830 nm | 0 | 0 | Mean Difference (IV, Fixed, 95% CI) | 0.0 [0.0, 0.0] |
| 8.3 Wavelength 650‐950 nm | 1 | 35 | Mean Difference (IV, Fixed, 95% CI) | ‐12.90 [‐31.98, 6.18] |
| 9 Left ankle ROM Show forest plot | 1 | Mean Difference (IV, Fixed, 95% CI) | Subtotals only | |
| Analysis 8.9  Comparison 8 Laser vs Placebo‐ Wavelength analysis ‐ End of treatment, Outcome 9 Left ankle ROM. | ||||
| 9.1 Wavelength < 660 nm | 0 | 0 | Mean Difference (IV, Fixed, 95% CI) | 0.0 [0.0, 0.0] |
| 9.2 Wavelength 820, 830 nm | 0 | 0 | Mean Difference (IV, Fixed, 95% CI) | 0.0 [0.0, 0.0] |
| 9.3 Wavelength 650‐950 nm | 1 | 35 | Mean Difference (IV, Fixed, 95% CI) | 3.40 [‐3.43, 10.23] |
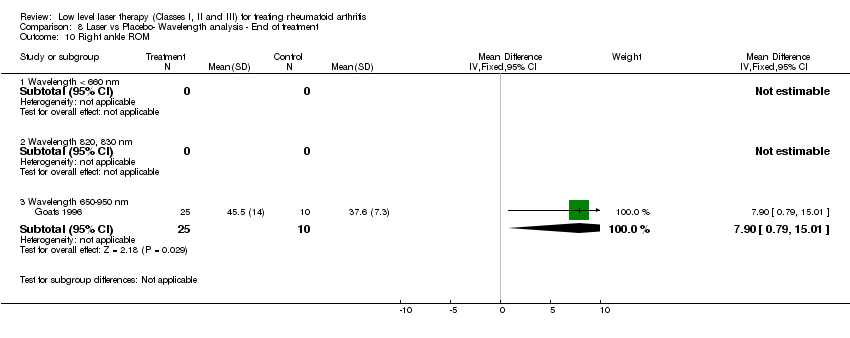
| 10 Right ankle ROM Show forest plot | 1 | Mean Difference (IV, Fixed, 95% CI) | Subtotals only | |
| Analysis 8.10  Comparison 8 Laser vs Placebo‐ Wavelength analysis ‐ End of treatment, Outcome 10 Right ankle ROM. | ||||
| 10.1 Wavelength < 660 nm | 0 | 0 | Mean Difference (IV, Fixed, 95% CI) | 0.0 [0.0, 0.0] |
| 10.2 Wavelength 820, 830 nm | 0 | 0 | Mean Difference (IV, Fixed, 95% CI) | 0.0 [0.0, 0.0] |
| 10.3 Wavelength 650‐950 nm | 1 | 35 | Mean Difference (IV, Fixed, 95% CI) | 7.90 [0.79, 15.01] |
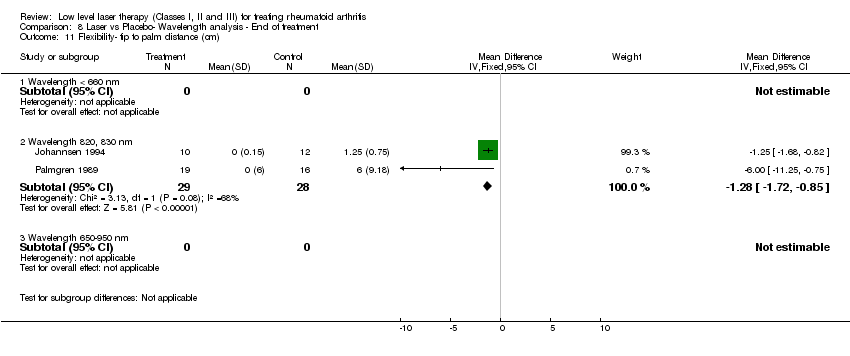
| 11 Flexibility‐ tip to palm distance (cm) Show forest plot | 2 | Mean Difference (IV, Fixed, 95% CI) | Subtotals only | |
| Analysis 8.11  Comparison 8 Laser vs Placebo‐ Wavelength analysis ‐ End of treatment, Outcome 11 Flexibility‐ tip to palm distance (cm). | ||||
| 11.1 Wavelength < 660 nm | 0 | 0 | Mean Difference (IV, Fixed, 95% CI) | 0.0 [0.0, 0.0] |
| 11.2 Wavelength 820, 830 nm | 2 | 57 | Mean Difference (IV, Fixed, 95% CI) | ‐1.28 [‐1.72, ‐0.85] |
| 11.3 Wavelength 650‐950 nm | 0 | 0 | Mean Difference (IV, Fixed, 95% CI) | 0.0 [0.0, 0.0] |
| 12 Morning stiffness duration (min) Show forest plot | 3 | Mean Difference (IV, Fixed, 95% CI) | Subtotals only | |
| Analysis 8.12  Comparison 8 Laser vs Placebo‐ Wavelength analysis ‐ End of treatment, Outcome 12 Morning stiffness duration (min). | ||||
| 12.1 Wavelength < 660 nm | 0 | 0 | Mean Difference (IV, Fixed, 95% CI) | 0.0 [0.0, 0.0] |
| 12.2 Wavelength 820, 830 nm | 2 | 75 | Mean Difference (IV, Fixed, 95% CI) | ‐30.65 [‐55.71, ‐5.58] |
| 12.3 Wavelength 650‐950 nm | 1 | 35 | Mean Difference (IV, Fixed, 95% CI) | 40.80 [‐75.05, 156.65] |
| 13 Morning stiffness not improved Show forest plot | 1 | Risk Ratio (M‐H, Fixed, 95% CI) | Subtotals only | |
| Analysis 8.13  Comparison 8 Laser vs Placebo‐ Wavelength analysis ‐ End of treatment, Outcome 13 Morning stiffness not improved. | ||||
| 13.1 Wavelength < 660 nm | 0 | 0 | Risk Ratio (M‐H, Fixed, 95% CI) | 0.0 [0.0, 0.0] |
| 13.2 Wavelength 820, 830 nm | 1 | 22 | Risk Ratio (M‐H, Fixed, 95% CI) | 0.76 [0.49, 1.19] |
| 13.3 Wavelength 650‐950 nm | 0 | 0 | Risk Ratio (M‐H, Fixed, 95% CI) | 0.0 [0.0, 0.0] |
| 14 Rheumatoid factor positive Show forest plot | 1 | Risk Ratio (M‐H, Fixed, 95% CI) | Subtotals only | |
| Analysis 8.14  Comparison 8 Laser vs Placebo‐ Wavelength analysis ‐ End of treatment, Outcome 14 Rheumatoid factor positive. | ||||
| 14.1 Wavelength < 660 nm | 0 | 0 | Risk Ratio (M‐H, Fixed, 95% CI) | 0.0 [0.0, 0.0] |
| 14.2 Wavelength 820, 830 nm | 0 | 0 | Risk Ratio (M‐H, Fixed, 95% CI) | 0.0 [0.0, 0.0] |
| 14.3 Wavelength 650‐950 nm | 1 | 35 | Risk Ratio (M‐H, Fixed, 95% CI) | 0.9 [0.61, 1.34] |
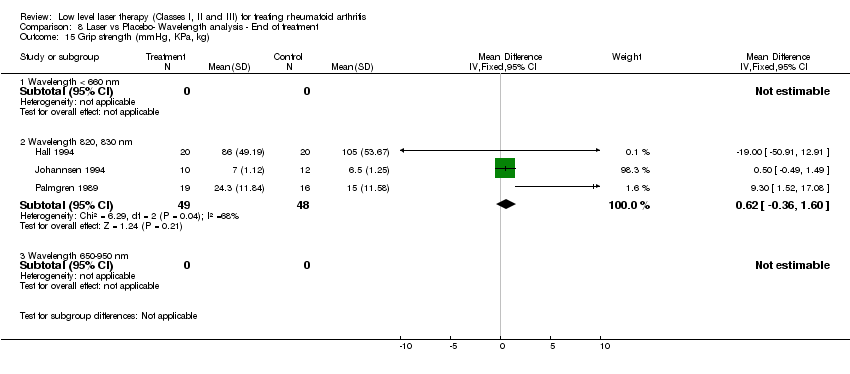
| 15 Grip strength (mmHg, KPa, kg) Show forest plot | 3 | Mean Difference (IV, Fixed, 95% CI) | Subtotals only | |
| Analysis 8.15  Comparison 8 Laser vs Placebo‐ Wavelength analysis ‐ End of treatment, Outcome 15 Grip strength (mmHg, KPa, kg). | ||||
| 15.1 Wavelength < 660 nm | 0 | 0 | Mean Difference (IV, Fixed, 95% CI) | 0.0 [0.0, 0.0] |
| 15.2 Wavelength 820, 830 nm | 3 | 97 | Mean Difference (IV, Fixed, 95% CI) | 0.62 [‐0.36, 1.60] |
| 15.3 Wavelength 650‐950 nm | 0 | 0 | Mean Difference (IV, Fixed, 95% CI) | 0.0 [0.0, 0.0] |
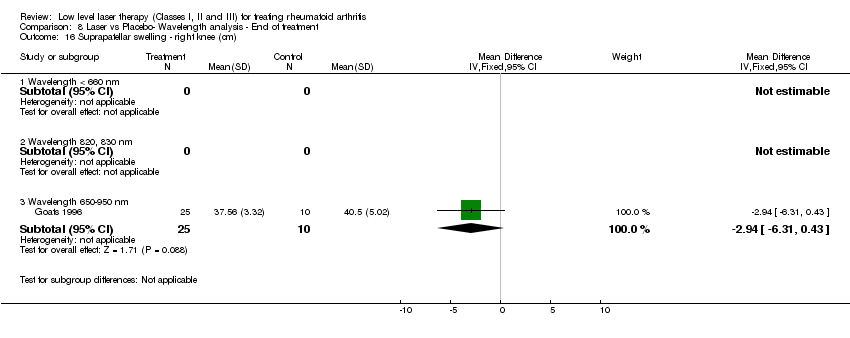
| 16 Suprapatellar swelling ‐ right knee (cm) Show forest plot | 1 | Mean Difference (IV, Fixed, 95% CI) | Subtotals only | |
| Analysis 8.16  Comparison 8 Laser vs Placebo‐ Wavelength analysis ‐ End of treatment, Outcome 16 Suprapatellar swelling ‐ right knee (cm). | ||||
| 16.1 Wavelength < 660 nm | 0 | 0 | Mean Difference (IV, Fixed, 95% CI) | 0.0 [0.0, 0.0] |
| 16.2 Wavelength 820, 830 nm | 0 | 0 | Mean Difference (IV, Fixed, 95% CI) | 0.0 [0.0, 0.0] |
| 16.3 Wavelength 650‐950 nm | 1 | 35 | Mean Difference (IV, Fixed, 95% CI) | ‐2.94 [‐6.31, 0.43] |
| 17 Suprapatellar swelling‐ left knee (cm) Show forest plot | 1 | Mean Difference (IV, Fixed, 95% CI) | Subtotals only | |
| Analysis 8.17  Comparison 8 Laser vs Placebo‐ Wavelength analysis ‐ End of treatment, Outcome 17 Suprapatellar swelling‐ left knee (cm). | ||||
| 17.1 Wavelength < 660 nm | 0 | 0 | Mean Difference (IV, Fixed, 95% CI) | 0.0 [0.0, 0.0] |
| 17.2 Wavelength 820, 830 nm | 0 | 0 | Mean Difference (IV, Fixed, 95% CI) | 0.0 [0.0, 0.0] |
| 17.3 Wavelength 650‐950 nm | 1 | 35 | Mean Difference (IV, Fixed, 95% CI) | ‐2.69 [‐6.33, 0.95] |
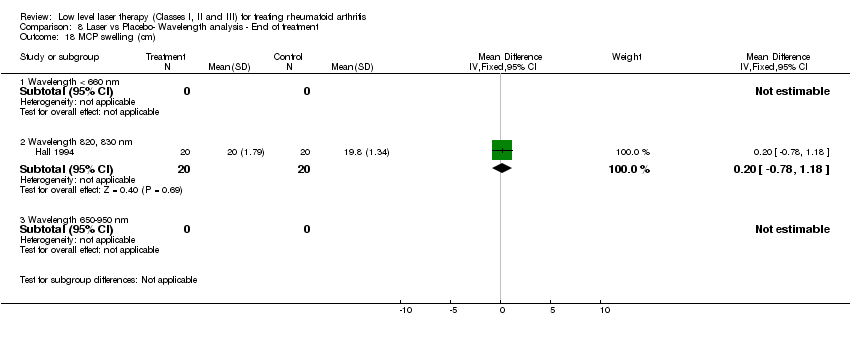
| 18 MCP swelling (cm) Show forest plot | 1 | Mean Difference (IV, Fixed, 95% CI) | Subtotals only | |
| Analysis 8.18  Comparison 8 Laser vs Placebo‐ Wavelength analysis ‐ End of treatment, Outcome 18 MCP swelling (cm). | ||||
| 18.1 Wavelength < 660 nm | 0 | 0 | Mean Difference (IV, Fixed, 95% CI) | 0.0 [0.0, 0.0] |
| 18.2 Wavelength 820, 830 nm | 1 | 40 | Mean Difference (IV, Fixed, 95% CI) | 0.20 [‐0.78, 1.18] |
| 18.3 Wavelength 650‐950 nm | 0 | 0 | Mean Difference (IV, Fixed, 95% CI) | 0.0 [0.0, 0.0] |
| 19 PIP swelling (cm) Show forest plot | 2 | Mean Difference (IV, Fixed, 95% CI) | Subtotals only | |
| Analysis 8.19  Comparison 8 Laser vs Placebo‐ Wavelength analysis ‐ End of treatment, Outcome 19 PIP swelling (cm). | ||||
| 19.1 Wavelength < 660 nm | 0 | 0 | Mean Difference (IV, Fixed, 95% CI) | 0.0 [0.0, 0.0] |
| 19.2 Wavelength 820, 830 nm | 2 | 75 | Mean Difference (IV, Fixed, 95% CI) | 0.53 [‐1.12, 2.18] |
| 19.3 Wavelength 650‐950 nm | 0 | 0 | Mean Difference (IV, Fixed, 95% CI) | 0.0 [0.0, 0.0] |
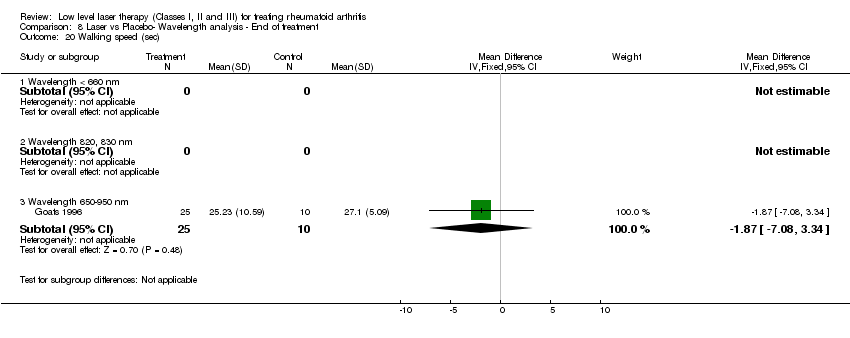
| 20 Walking speed (sec) Show forest plot | 1 | Mean Difference (IV, Fixed, 95% CI) | Subtotals only | |
| Analysis 8.20  Comparison 8 Laser vs Placebo‐ Wavelength analysis ‐ End of treatment, Outcome 20 Walking speed (sec). | ||||
| 20.1 Wavelength < 660 nm | 0 | 0 | Mean Difference (IV, Fixed, 95% CI) | 0.0 [0.0, 0.0] |
| 20.2 Wavelength 820, 830 nm | 0 | 0 | Mean Difference (IV, Fixed, 95% CI) | 0.0 [0.0, 0.0] |
| 20.3 Wavelength 650‐950 nm | 1 | 35 | Mean Difference (IV, Fixed, 95% CI) | ‐1.87 [‐7.08, 3.34] |
| 21 Fibrinogen Show forest plot | 1 | Mean Difference (IV, Fixed, 95% CI) | Subtotals only | |
| Analysis 8.21  Comparison 8 Laser vs Placebo‐ Wavelength analysis ‐ End of treatment, Outcome 21 Fibrinogen. | ||||
| 21.1 Wavelength < 660 nm | 0 | 0 | Mean Difference (IV, Fixed, 95% CI) | 0.0 [0.0, 0.0] |
| 21.2 Wavelength 820, 830 nm | 1 | 35 | Mean Difference (IV, Fixed, 95% CI) | 1.5 [‐0.00, 3.00] |
| 21.3 Wavelength 650‐950 nm | 0 | 0 | Mean Difference (IV, Fixed, 95% CI) | 0.0 [0.0, 0.0] |
| 22 Leukocytes Show forest plot | 1 | Mean Difference (IV, Fixed, 95% CI) | Subtotals only | |
| Analysis 8.22  Comparison 8 Laser vs Placebo‐ Wavelength analysis ‐ End of treatment, Outcome 22 Leukocytes. | ||||
| 22.1 Wavelength < 660 nm | 0 | 0 | Mean Difference (IV, Fixed, 95% CI) | 0.0 [0.0, 0.0] |
| 22.2 Wavelength 820, 830 nm | 1 | 35 | Mean Difference (IV, Fixed, 95% CI) | 1.60 [0.62, 2.58] |
| 22.3 Wavelength 650‐950 nm | 0 | 0 | Mean Difference (IV, Fixed, 95% CI) | 0.0 [0.0, 0.0] |
| 23 Lymphocytes Show forest plot | 1 | Mean Difference (IV, Fixed, 95% CI) | Subtotals only | |
| Analysis 8.23  Comparison 8 Laser vs Placebo‐ Wavelength analysis ‐ End of treatment, Outcome 23 Lymphocytes. | ||||
| 23.1 Wavelength < 660 nm | 0 | 0 | Mean Difference (IV, Fixed, 95% CI) | 0.0 [0.0, 0.0] |
| 23.2 Wavelength 820, 830 nm | 1 | 35 | Mean Difference (IV, Fixed, 95% CI) | 3.0 [‐6.57, 12.57] |
| 23.3 Wavelength 650‐950 nm | 0 | 0 | Mean Difference (IV, Fixed, 95% CI) | 0.0 [0.0, 0.0] |
| 24 ESR (mm/hr) Show forest plot | 3 | Mean Difference (IV, Fixed, 95% CI) | Subtotals only | |
| Analysis 8.24  Comparison 8 Laser vs Placebo‐ Wavelength analysis ‐ End of treatment, Outcome 24 ESR (mm/hr). | ||||
| 24.1 Wavelength < 660 nm | 0 | 0 | Mean Difference (IV, Fixed, 95% CI) | 0.0 [0.0, 0.0] |
| 24.2 Wavelength 820, 830 nm | 2 | 57 | Mean Difference (IV, Fixed, 95% CI) | ‐11.12 [‐16.21, ‐6.04] |
| 24.3 Wavelength 650‐950 nm | 1 | 35 | Mean Difference (IV, Fixed, 95% CI) | 8.27 [‐13.18, 29.72] |
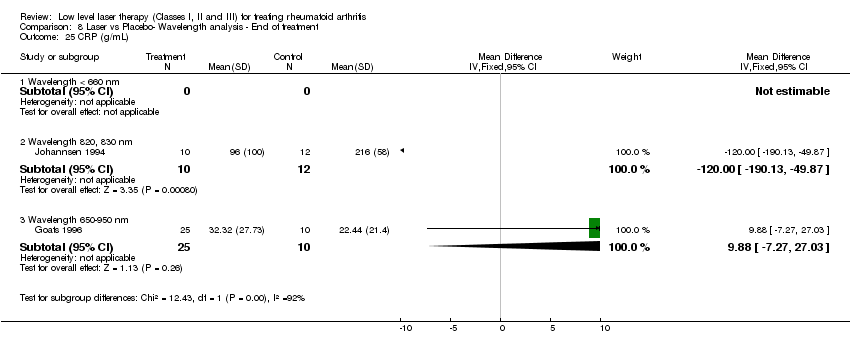
| 25 CRP (g/mL) Show forest plot | 2 | Mean Difference (IV, Fixed, 95% CI) | Subtotals only | |
| Analysis 8.25  Comparison 8 Laser vs Placebo‐ Wavelength analysis ‐ End of treatment, Outcome 25 CRP (g/mL). | ||||
| 25.1 Wavelength < 660 nm | 0 | 0 | Mean Difference (IV, Fixed, 95% CI) | 0.0 [0.0, 0.0] |
| 25.2 Wavelength 820, 830 nm | 1 | 22 | Mean Difference (IV, Fixed, 95% CI) | ‐120.0 [‐190.13, ‐49.87] |
| 25.3 Wavelength 650‐950 nm | 1 | 35 | Mean Difference (IV, Fixed, 95% CI) | 9.88 [‐7.27, 27.03] |
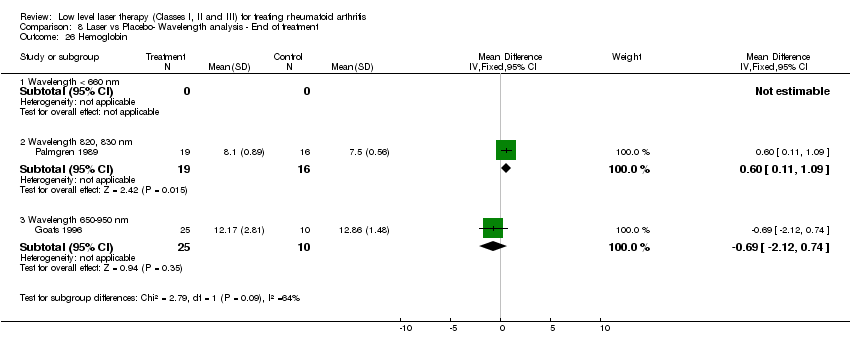
| 26 Hemoglobin Show forest plot | 2 | Mean Difference (IV, Fixed, 95% CI) | Subtotals only | |
| Analysis 8.26  Comparison 8 Laser vs Placebo‐ Wavelength analysis ‐ End of treatment, Outcome 26 Hemoglobin. | ||||
| 26.1 Wavelength < 660 nm | 0 | 0 | Mean Difference (IV, Fixed, 95% CI) | 0.0 [0.0, 0.0] |
| 26.2 Wavelength 820, 830 nm | 1 | 35 | Mean Difference (IV, Fixed, 95% CI) | 0.60 [0.11, 1.09] |
| 26.3 Wavelength 650‐950 nm | 1 | 35 | Mean Difference (IV, Fixed, 95% CI) | ‐0.69 [‐2.12, 0.74] |
| 27 Platelets Show forest plot | 1 | Mean Difference (IV, Fixed, 95% CI) | Subtotals only | |
| Analysis 8.27  Comparison 8 Laser vs Placebo‐ Wavelength analysis ‐ End of treatment, Outcome 27 Platelets. | ||||
| 27.1 Wavelength < 660 nm | 0 | 0 | Mean Difference (IV, Fixed, 95% CI) | 0.0 [0.0, 0.0] |
| 27.2 Wavelength 820, 830 nm | 0 | 0 | Mean Difference (IV, Fixed, 95% CI) | 0.0 [0.0, 0.0] |
| 27.3 Wavelength 650‐950 nm | 1 | 35 | Mean Difference (IV, Fixed, 95% CI) | 20.35 [‐64.36, 105.06] |
| Outcome or subgroup title | No. of studies | No. of participants | Statistical method | Effect size |
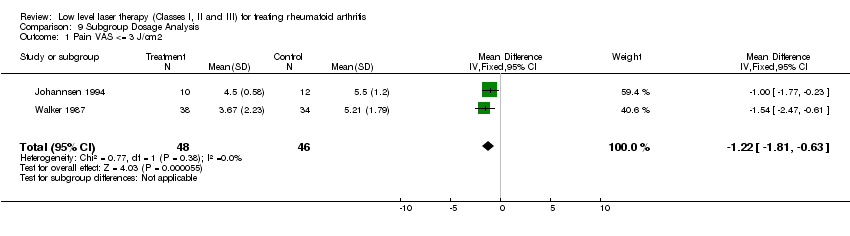
| 1 Pain VAS <= 3 J/cm2 Show forest plot | 2 | 94 | Mean Difference (IV, Fixed, 95% CI) | ‐1.22 [‐1.81, ‐0.63] |
| Analysis 9.1  Comparison 9 Subgroup Dosage Analysis, Outcome 1 Pain VAS <= 3 J/cm2. | ||||
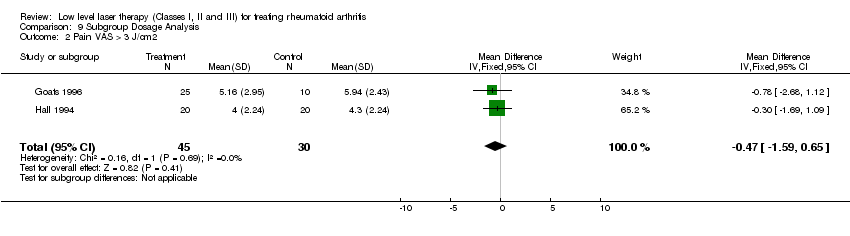
| 2 Pain VAS > 3 J/cm2 Show forest plot | 2 | 75 | Mean Difference (IV, Fixed, 95% CI) | ‐0.47 [‐1.59, 0.65] |
| Analysis 9.2  Comparison 9 Subgroup Dosage Analysis, Outcome 2 Pain VAS > 3 J/cm2. | ||||
| 3 ESR low dose Show forest plot | 1 | 22 | Mean Difference (IV, Fixed, 95% CI) | ‐20.0 [‐28.69, ‐11.31] |
| Analysis 9.3  Comparison 9 Subgroup Dosage Analysis, Outcome 3 ESR low dose. | ||||
| 4 ESR high dose Show forest plot | 2 | 70 | Mean Difference (IV, Fixed, 95% CI) | ‐5.34 [‐11.35, 0.68] |
| Analysis 9.4  Comparison 9 Subgroup Dosage Analysis, Outcome 4 ESR high dose. | ||||
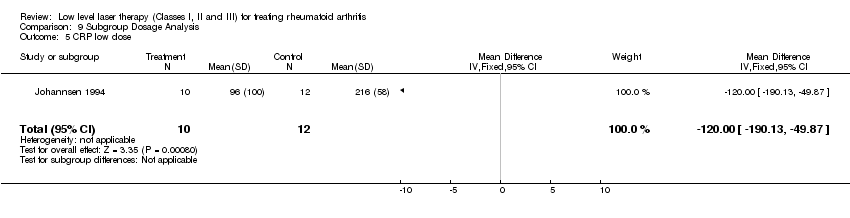
| 5 CRP low dose Show forest plot | 1 | 22 | Mean Difference (IV, Fixed, 95% CI) | ‐120.0 [‐190.13, ‐49.87] |
| Analysis 9.5  Comparison 9 Subgroup Dosage Analysis, Outcome 5 CRP low dose. | ||||
| 6 CRP high dose Show forest plot | 1 | 35 | Mean Difference (IV, Fixed, 95% CI) | 9.88 [‐7.27, 27.03] |
| Analysis 9.6  Comparison 9 Subgroup Dosage Analysis, Outcome 6 CRP high dose. | ||||
| 7 HAQ high dose Show forest plot | 2 | 75 | Mean Difference (IV, Fixed, 95% CI) | 0.93 [‐2.01, 3.87] |
| Analysis 9.7  Comparison 9 Subgroup Dosage Analysis, Outcome 7 HAQ high dose. | ||||
| 8 Hemoglobin high dose Show forest plot | 2 | 70 | Mean Difference (IV, Fixed, 95% CI) | 0.47 [0.01, 0.93] |
| Analysis 9.8  Comparison 9 Subgroup Dosage Analysis, Outcome 8 Hemoglobin high dose. | ||||
| 9 Morning stiffness (hours) high dose Show forest plot | 3 | 110 | Mean Difference (IV, Fixed, 95% CI) | ‐27.45 [‐51.95, ‐2.95] |
| Analysis 9.9  Comparison 9 Subgroup Dosage Analysis, Outcome 9 Morning stiffness (hours) high dose. | ||||
| 10 Grip strength (kg) low Show forest plot | 1 | 22 | Mean Difference (IV, Fixed, 95% CI) | 0.5 [‐0.49, 1.49] |
| Analysis 9.10  Comparison 9 Subgroup Dosage Analysis, Outcome 10 Grip strength (kg) low. | ||||
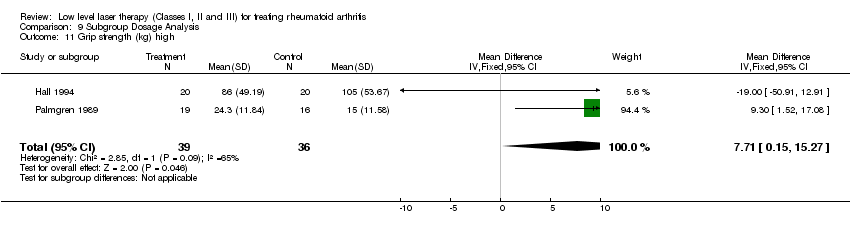
| 11 Grip strength (kg) high Show forest plot | 2 | 75 | Mean Difference (IV, Fixed, 95% CI) | 7.71 [0.15, 15.27] |
| Analysis 9.11  Comparison 9 Subgroup Dosage Analysis, Outcome 11 Grip strength (kg) high. | ||||
| 12 MCP swelling (cm) low Show forest plot | 2 | 75 | Mean Difference (IV, Fixed, 95% CI) | 0.53 [‐1.12, 2.18] |
| Analysis 9.12  Comparison 9 Subgroup Dosage Analysis, Outcome 12 MCP swelling (cm) low. | ||||
| 13 Flexibility tip to palm (cm) low Show forest plot | 1 | 22 | Mean Difference (IV, Fixed, 95% CI) | ‐1.25 [‐1.68, ‐0.82] |
| Analysis 9.13  Comparison 9 Subgroup Dosage Analysis, Outcome 13 Flexibility tip to palm (cm) low. | ||||
| 14 Flexibility tip to palm high dose Show forest plot | 1 | 35 | Mean Difference (IV, Fixed, 95% CI) | ‐6.0 [‐11.25, ‐0.75] |
| Analysis 9.14  Comparison 9 Subgroup Dosage Analysis, Outcome 14 Flexibility tip to palm high dose. | ||||
| Outcome or subgroup title | No. of studies | No. of participants | Statistical method | Effect size |
| 1 Number of patients improved in pain relief Show forest plot | 1 | 34 | Risk Ratio (M‐H, Fixed, 95% CI) | 13.0 [0.79, 214.05] |
| Analysis 10.1  Comparison 10 Laser vs Placebo‐ contralateral control (End of treatment), Outcome 1 Number of patients improved in pain relief. | ||||
| 2 Number of patients improved in morning stiffness Show forest plot | 1 | 34 | Risk Ratio (M‐H, Fixed, 95% CI) | 4.0 [0.50, 32.20] |
| Analysis 10.2  Comparison 10 Laser vs Placebo‐ contralateral control (End of treatment), Outcome 2 Number of patients improved in morning stiffness. | ||||

Comparison 1 Laser vs Placebo‐ End of treatment (approx 10 wks), Outcome 1 Pain (Visual Analogue Scale 10 cm).

Comparison 1 Laser vs Placebo‐ End of treatment (approx 10 wks), Outcome 2 Pain (0‐12 scale).
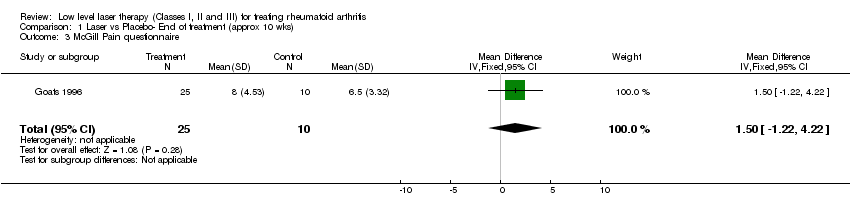
Comparison 1 Laser vs Placebo‐ End of treatment (approx 10 wks), Outcome 3 McGill Pain questionnaire.
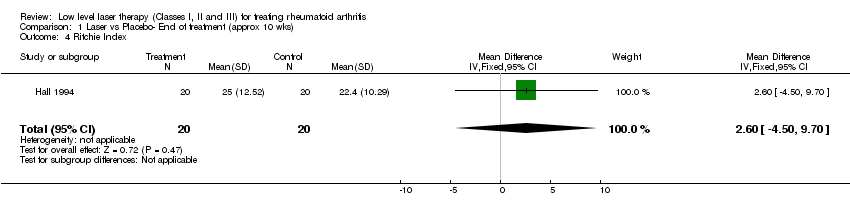
Comparison 1 Laser vs Placebo‐ End of treatment (approx 10 wks), Outcome 4 Ritchie Index.

Comparison 1 Laser vs Placebo‐ End of treatment (approx 10 wks), Outcome 5 Health Assessment Questionnaire (HAQ).

Comparison 1 Laser vs Placebo‐ End of treatment (approx 10 wks), Outcome 6 MCP ROM (degrees).
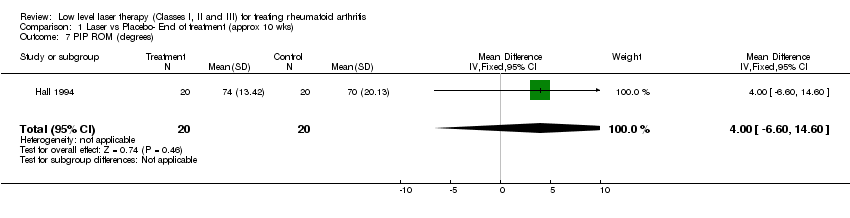
Comparison 1 Laser vs Placebo‐ End of treatment (approx 10 wks), Outcome 7 PIP ROM (degrees).

Comparison 1 Laser vs Placebo‐ End of treatment (approx 10 wks), Outcome 8 Knee ROM.

Comparison 1 Laser vs Placebo‐ End of treatment (approx 10 wks), Outcome 9 Ankle ROM.

Comparison 1 Laser vs Placebo‐ End of treatment (approx 10 wks), Outcome 10 Flexibility‐ tip to palm distance (cm).

Comparison 1 Laser vs Placebo‐ End of treatment (approx 10 wks), Outcome 11 Morning stiffness duration (min).

Comparison 1 Laser vs Placebo‐ End of treatment (approx 10 wks), Outcome 12 Morning stiffness not improved.

Comparison 1 Laser vs Placebo‐ End of treatment (approx 10 wks), Outcome 13 Rheumatoid factor positive.

Comparison 1 Laser vs Placebo‐ End of treatment (approx 10 wks), Outcome 14 Grip strength.

Comparison 1 Laser vs Placebo‐ End of treatment (approx 10 wks), Outcome 15 Suprapatellar swelling ‐ right knee (cm).
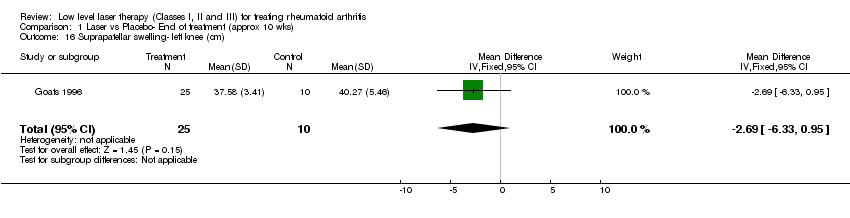
Comparison 1 Laser vs Placebo‐ End of treatment (approx 10 wks), Outcome 16 Suprapatellar swelling‐ left knee (cm).

Comparison 1 Laser vs Placebo‐ End of treatment (approx 10 wks), Outcome 17 MCP swelling (cm).

Comparison 1 Laser vs Placebo‐ End of treatment (approx 10 wks), Outcome 18 PIP swelling (cm).

Comparison 1 Laser vs Placebo‐ End of treatment (approx 10 wks), Outcome 19 Walking speed (sec).

Comparison 1 Laser vs Placebo‐ End of treatment (approx 10 wks), Outcome 20 Fibrinogen.

Comparison 1 Laser vs Placebo‐ End of treatment (approx 10 wks), Outcome 21 Leukocytes.
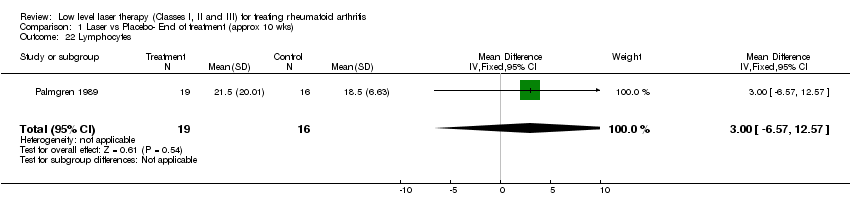
Comparison 1 Laser vs Placebo‐ End of treatment (approx 10 wks), Outcome 22 Lymphocytes.

Comparison 1 Laser vs Placebo‐ End of treatment (approx 10 wks), Outcome 23 ESR (mm/hr).
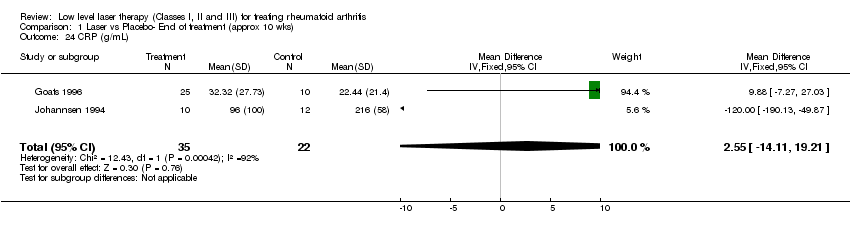
Comparison 1 Laser vs Placebo‐ End of treatment (approx 10 wks), Outcome 24 CRP (g/mL).

Comparison 1 Laser vs Placebo‐ End of treatment (approx 10 wks), Outcome 25 Hemoglobin.

Comparison 1 Laser vs Placebo‐ End of treatment (approx 10 wks), Outcome 26 Platelets.

Comparison 2 Laser vs Placebo‐ End of follow‐up (approx 20 wks), Outcome 1 Pain.

Comparison 2 Laser vs Placebo‐ End of follow‐up (approx 20 wks), Outcome 2 McGill Pain questionnaire.
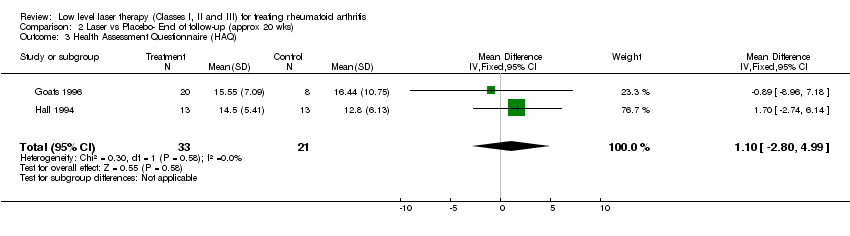
Comparison 2 Laser vs Placebo‐ End of follow‐up (approx 20 wks), Outcome 3 Health Assessment Questionnaire (HAQ).

Comparison 2 Laser vs Placebo‐ End of follow‐up (approx 20 wks), Outcome 4 Ritchie Index.

Comparison 2 Laser vs Placebo‐ End of follow‐up (approx 20 wks), Outcome 5 PIP ROM (degrees).
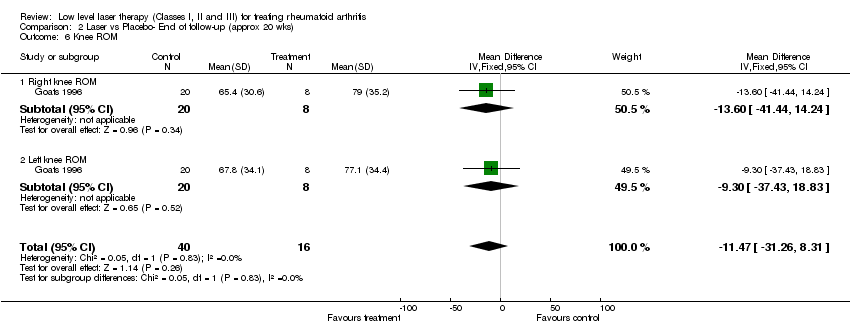
Comparison 2 Laser vs Placebo‐ End of follow‐up (approx 20 wks), Outcome 6 Knee ROM.
Comparison 2 Laser vs Placebo‐ End of follow‐up (approx 20 wks), Outcome 7 Ankle ROM.
Comparison 2 Laser vs Placebo‐ End of follow‐up (approx 20 wks), Outcome 8 MCP ROM (degrees).
Comparison 2 Laser vs Placebo‐ End of follow‐up (approx 20 wks), Outcome 9 Morning stiffness duration (min).

Comparison 2 Laser vs Placebo‐ End of follow‐up (approx 20 wks), Outcome 10 Walking speed (sec).

Comparison 2 Laser vs Placebo‐ End of follow‐up (approx 20 wks), Outcome 11 Grip strength.

Comparison 2 Laser vs Placebo‐ End of follow‐up (approx 20 wks), Outcome 12 Suprapatellar swelling‐ left knee (cm).
Comparison 2 Laser vs Placebo‐ End of follow‐up (approx 20 wks), Outcome 13 Suprapatellar swelling ‐ right knee (cm).
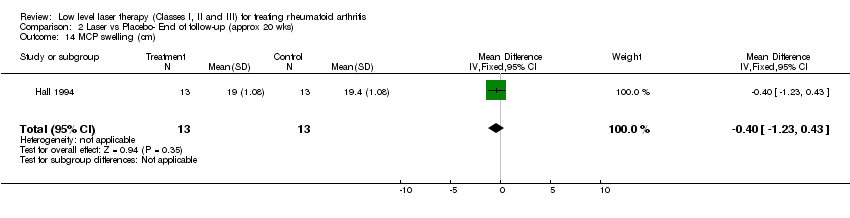
Comparison 2 Laser vs Placebo‐ End of follow‐up (approx 20 wks), Outcome 14 MCP swelling (cm).

Comparison 2 Laser vs Placebo‐ End of follow‐up (approx 20 wks), Outcome 15 PIP swelling (cm).
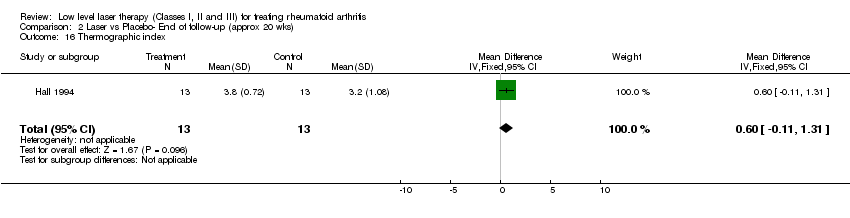
Comparison 2 Laser vs Placebo‐ End of follow‐up (approx 20 wks), Outcome 16 Thermographic index.
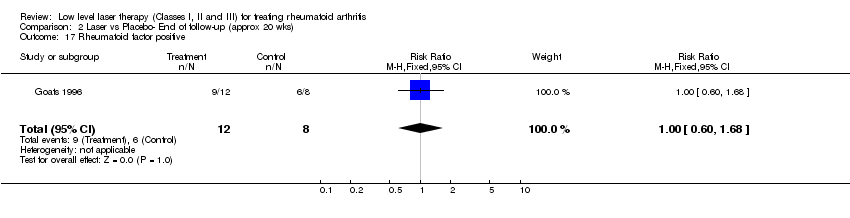
Comparison 2 Laser vs Placebo‐ End of follow‐up (approx 20 wks), Outcome 17 Rheumatoid factor positive.
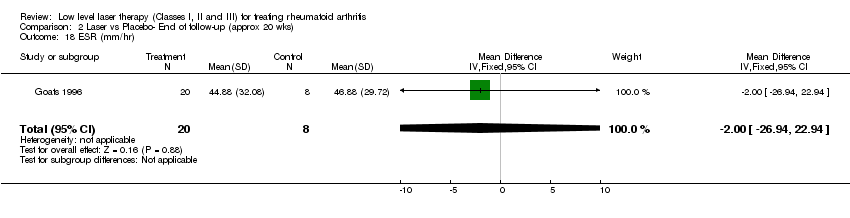
Comparison 2 Laser vs Placebo‐ End of follow‐up (approx 20 wks), Outcome 18 ESR (mm/hr).

Comparison 2 Laser vs Placebo‐ End of follow‐up (approx 20 wks), Outcome 19 CRP (g/mL).
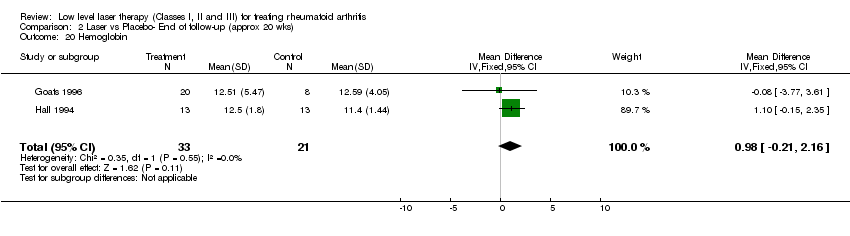
Comparison 2 Laser vs Placebo‐ End of follow‐up (approx 20 wks), Outcome 20 Hemoglobin.

Comparison 2 Laser vs Placebo‐ End of follow‐up (approx 20 wks), Outcome 21 Platelets.
Comparison 3 Treatment length‐ subgroup analysis for end of treatment results, Outcome 1 Pain (10 cm VAS or 0‐12 scale).

Comparison 4 Treatment length‐ subgroup analysis for end of follow up results, Outcome 1 Pain (10 cm VAS or 0‐12 scale).

Comparison 5 Methodologic quality: low (<3) vs high (=> 3), Outcome 1 Pain at end of treatment.

Comparison 6 Laser vs Placebo ‐ Joint vs Nerve ‐ end of treatment, Outcome 1 Pain (10 cm VAS or 0‐12 scale).
Comparison 7 Laser vs Placebo ‐ Joint vs Nerve ‐ end of follow up, Outcome 1 Pain (10 cm VAS or 0‐12 scale).

Comparison 8 Laser vs Placebo‐ Wavelength analysis ‐ End of treatment, Outcome 1 Pain.

Comparison 8 Laser vs Placebo‐ Wavelength analysis ‐ End of treatment, Outcome 2 McGill Pain questionnaire.

Comparison 8 Laser vs Placebo‐ Wavelength analysis ‐ End of treatment, Outcome 3 Ritchie Index.

Comparison 8 Laser vs Placebo‐ Wavelength analysis ‐ End of treatment, Outcome 4 Health Assessment Questionnaire (HAQ).

Comparison 8 Laser vs Placebo‐ Wavelength analysis ‐ End of treatment, Outcome 5 MCP ROM (degrees).

Comparison 8 Laser vs Placebo‐ Wavelength analysis ‐ End of treatment, Outcome 6 PIP ROM (degrees).

Comparison 8 Laser vs Placebo‐ Wavelength analysis ‐ End of treatment, Outcome 7 Left knee Range of motion.

Comparison 8 Laser vs Placebo‐ Wavelength analysis ‐ End of treatment, Outcome 8 Right knee ROM.
Comparison 8 Laser vs Placebo‐ Wavelength analysis ‐ End of treatment, Outcome 9 Left ankle ROM.
Comparison 8 Laser vs Placebo‐ Wavelength analysis ‐ End of treatment, Outcome 10 Right ankle ROM.
Comparison 8 Laser vs Placebo‐ Wavelength analysis ‐ End of treatment, Outcome 11 Flexibility‐ tip to palm distance (cm).

Comparison 8 Laser vs Placebo‐ Wavelength analysis ‐ End of treatment, Outcome 12 Morning stiffness duration (min).

Comparison 8 Laser vs Placebo‐ Wavelength analysis ‐ End of treatment, Outcome 13 Morning stiffness not improved.

Comparison 8 Laser vs Placebo‐ Wavelength analysis ‐ End of treatment, Outcome 14 Rheumatoid factor positive.
Comparison 8 Laser vs Placebo‐ Wavelength analysis ‐ End of treatment, Outcome 15 Grip strength (mmHg, KPa, kg).
Comparison 8 Laser vs Placebo‐ Wavelength analysis ‐ End of treatment, Outcome 16 Suprapatellar swelling ‐ right knee (cm).

Comparison 8 Laser vs Placebo‐ Wavelength analysis ‐ End of treatment, Outcome 17 Suprapatellar swelling‐ left knee (cm).
Comparison 8 Laser vs Placebo‐ Wavelength analysis ‐ End of treatment, Outcome 18 MCP swelling (cm).

Comparison 8 Laser vs Placebo‐ Wavelength analysis ‐ End of treatment, Outcome 19 PIP swelling (cm).
Comparison 8 Laser vs Placebo‐ Wavelength analysis ‐ End of treatment, Outcome 20 Walking speed (sec).

Comparison 8 Laser vs Placebo‐ Wavelength analysis ‐ End of treatment, Outcome 21 Fibrinogen.

Comparison 8 Laser vs Placebo‐ Wavelength analysis ‐ End of treatment, Outcome 22 Leukocytes.

Comparison 8 Laser vs Placebo‐ Wavelength analysis ‐ End of treatment, Outcome 23 Lymphocytes.

Comparison 8 Laser vs Placebo‐ Wavelength analysis ‐ End of treatment, Outcome 24 ESR (mm/hr).
Comparison 8 Laser vs Placebo‐ Wavelength analysis ‐ End of treatment, Outcome 25 CRP (g/mL).
Comparison 8 Laser vs Placebo‐ Wavelength analysis ‐ End of treatment, Outcome 26 Hemoglobin.
Comparison 8 Laser vs Placebo‐ Wavelength analysis ‐ End of treatment, Outcome 27 Platelets.
Comparison 9 Subgroup Dosage Analysis, Outcome 1 Pain VAS <= 3 J/cm2.
Comparison 9 Subgroup Dosage Analysis, Outcome 2 Pain VAS > 3 J/cm2.

Comparison 9 Subgroup Dosage Analysis, Outcome 3 ESR low dose.

Comparison 9 Subgroup Dosage Analysis, Outcome 4 ESR high dose.
Comparison 9 Subgroup Dosage Analysis, Outcome 5 CRP low dose.

Comparison 9 Subgroup Dosage Analysis, Outcome 6 CRP high dose.

Comparison 9 Subgroup Dosage Analysis, Outcome 7 HAQ high dose.

Comparison 9 Subgroup Dosage Analysis, Outcome 8 Hemoglobin high dose.

Comparison 9 Subgroup Dosage Analysis, Outcome 9 Morning stiffness (hours) high dose.

Comparison 9 Subgroup Dosage Analysis, Outcome 10 Grip strength (kg) low.
Comparison 9 Subgroup Dosage Analysis, Outcome 11 Grip strength (kg) high.

Comparison 9 Subgroup Dosage Analysis, Outcome 12 MCP swelling (cm) low.

Comparison 9 Subgroup Dosage Analysis, Outcome 13 Flexibility tip to palm (cm) low.

Comparison 9 Subgroup Dosage Analysis, Outcome 14 Flexibility tip to palm high dose.

Comparison 10 Laser vs Placebo‐ contralateral control (End of treatment), Outcome 1 Number of patients improved in pain relief.

Comparison 10 Laser vs Placebo‐ contralateral control (End of treatment), Outcome 2 Number of patients improved in morning stiffness.
| Outcome or subgroup title | No. of studies | No. of participants | Statistical method | Effect size |
| 1 Pain (Visual Analogue Scale 10 cm) Show forest plot | 3 | 147 | Mean Difference (IV, Fixed, 95% CI) | ‐1.10 [‐1.82, ‐0.39] |
| 2 Pain (0‐12 scale) Show forest plot | 1 | 22 | Mean Difference (IV, Fixed, 95% CI) | ‐1.0 [‐1.77, ‐0.23] |
| 3 McGill Pain questionnaire Show forest plot | 1 | 35 | Mean Difference (IV, Fixed, 95% CI) | 1.5 [‐1.22, 4.22] |
| 4 Ritchie Index Show forest plot | 1 | 40 | Mean Difference (IV, Fixed, 95% CI) | 2.60 [‐4.50, 9.70] |
| 5 Health Assessment Questionnaire (HAQ) Show forest plot | 2 | 75 | Mean Difference (IV, Fixed, 95% CI) | 0.93 [‐2.01, 3.87] |
| 6 MCP ROM (degrees) Show forest plot | 1 | 40 | Mean Difference (IV, Fixed, 95% CI) | ‐0.5 [‐15.99, 14.99] |
| 7 PIP ROM (degrees) Show forest plot | 1 | 40 | Mean Difference (IV, Fixed, 95% CI) | 4.0 [‐6.60, 14.60] |
| 8 Knee ROM Show forest plot | 1 | 70 | Mean Difference (IV, Fixed, 95% CI) | ‐18.03 [‐31.80, ‐4.27] |
| 8.1 Right knee ROM | 1 | 35 | Mean Difference (IV, Fixed, 95% CI) | ‐12.90 [‐31.98, 6.18] |
| 8.2 Left knee ROM | 1 | 35 | Mean Difference (IV, Fixed, 95% CI) | ‐23.60 [‐43.47, ‐3.73] |
| 9 Ankle ROM Show forest plot | 1 | 70 | Mean Difference (IV, Fixed, 95% CI) | 4.60 [‐0.33, 9.53] |
| 9.1 Right ankle ROM | 1 | 35 | Mean Difference (IV, Fixed, 95% CI) | 5.90 [‐1.21, 13.01] |
| 9.2 Left ankle ROM | 1 | 35 | Mean Difference (IV, Fixed, 95% CI) | 3.40 [‐3.43, 10.23] |
| 10 Flexibility‐ tip to palm distance (cm) Show forest plot | 2 | 57 | Mean Difference (IV, Fixed, 95% CI) | ‐1.28 [‐1.72, ‐0.85] |
| 11 Morning stiffness duration (min) Show forest plot | 3 | 110 | Mean Difference (IV, Fixed, 95% CI) | ‐27.45 [‐51.95, ‐2.95] |
| 12 Morning stiffness not improved Show forest plot | 1 | 22 | Risk Ratio (M‐H, Fixed, 95% CI) | 0.76 [0.49, 1.19] |
| 13 Rheumatoid factor positive Show forest plot | 1 | 35 | Risk Ratio (M‐H, Fixed, 95% CI) | 0.9 [0.61, 1.34] |
| 14 Grip strength Show forest plot | 3 | 97 | Mean Difference (IV, Fixed, 95% CI) | 0.62 [‐0.36, 1.60] |
| 14.1 Grip strength (mmHg) | 2 | 75 | Mean Difference (IV, Fixed, 95% CI) | 7.71 [0.15, 15.27] |
| 14.2 Grip strength (kg) | 1 | 22 | Mean Difference (IV, Fixed, 95% CI) | 0.5 [‐0.49, 1.49] |
| 15 Suprapatellar swelling ‐ right knee (cm) Show forest plot | 1 | 35 | Mean Difference (IV, Fixed, 95% CI) | ‐2.94 [‐6.31, 0.43] |
| 16 Suprapatellar swelling‐ left knee (cm) Show forest plot | 1 | 35 | Mean Difference (IV, Fixed, 95% CI) | ‐2.69 [‐6.33, 0.95] |
| 17 MCP swelling (cm) Show forest plot | 1 | 40 | Mean Difference (IV, Fixed, 95% CI) | 0.20 [‐0.78, 1.18] |
| 18 PIP swelling (cm) Show forest plot | 2 | 75 | Mean Difference (IV, Fixed, 95% CI) | 0.53 [‐1.12, 2.18] |
| 19 Walking speed (sec) Show forest plot | 1 | 35 | Mean Difference (IV, Fixed, 95% CI) | ‐1.87 [‐7.08, 3.34] |
| 20 Fibrinogen Show forest plot | 1 | 35 | Mean Difference (IV, Fixed, 95% CI) | 1.5 [‐0.00, 3.00] |
| 21 Leukocytes Show forest plot | 1 | 35 | Mean Difference (IV, Fixed, 95% CI) | 1.60 [0.62, 2.58] |
| 22 Lymphocytes Show forest plot | 1 | 35 | Mean Difference (IV, Fixed, 95% CI) | 3.0 [‐6.57, 12.57] |
| 23 ESR (mm/hr) Show forest plot | 3 | 92 | Mean Difference (IV, Fixed, 95% CI) | ‐10.09 [‐15.04, ‐5.15] |
| 24 CRP (g/mL) Show forest plot | 2 | 57 | Mean Difference (IV, Fixed, 95% CI) | 2.55 [‐14.11, 19.21] |
| 25 Hemoglobin Show forest plot | 2 | 70 | Mean Difference (IV, Fixed, 95% CI) | 0.47 [0.01, 0.93] |
| 26 Platelets Show forest plot | 1 | 35 | Mean Difference (IV, Fixed, 95% CI) | 20.35 [‐64.36, 105.06] |
| Outcome or subgroup title | No. of studies | No. of participants | Statistical method | Effect size |
| 1 Pain Show forest plot | 2 | 54 | Mean Difference (IV, Fixed, 95% CI) | 0.06 [‐1.24, 1.36] |
| 1.1 Pain (10 cm visual analogue scale) | 2 | 54 | Mean Difference (IV, Fixed, 95% CI) | 0.06 [‐1.24, 1.36] |
| 2 McGill Pain questionnaire Show forest plot | 1 | 28 | Mean Difference (IV, Fixed, 95% CI) | 1.39 [‐2.23, 5.01] |
| 3 Health Assessment Questionnaire (HAQ) Show forest plot | 2 | 54 | Mean Difference (IV, Fixed, 95% CI) | 1.10 [‐2.80, 4.99] |
| 4 Ritchie Index Show forest plot | 1 | 26 | Mean Difference (IV, Fixed, 95% CI) | 3.30 [‐5.74, 12.34] |
| 5 PIP ROM (degrees) Show forest plot | 1 | 26 | Mean Difference (IV, Fixed, 95% CI) | 2.0 [‐16.30, 20.30] |
| 6 Knee ROM Show forest plot | 1 | 56 | Mean Difference (IV, Fixed, 95% CI) | ‐11.47 [‐31.26, 8.31] |
| 6.1 Right knee ROM | 1 | 28 | Mean Difference (IV, Fixed, 95% CI) | ‐13.60 [‐41.44, 14.24] |
| 6.2 Left knee ROM | 1 | 28 | Mean Difference (IV, Fixed, 95% CI) | ‐9.30 [‐37.43, 18.83] |
| 7 Ankle ROM Show forest plot | 1 | 56 | Mean Difference (IV, Fixed, 95% CI) | ‐1.20 [‐11.69, 9.28] |
| 7.1 Right ankle ROM | 1 | 28 | Mean Difference (IV, Fixed, 95% CI) | 1.80 [‐12.59, 16.19] |
| 7.2 Left ankle ROM | 1 | 28 | Mean Difference (IV, Fixed, 95% CI) | ‐4.60 [‐19.91, 10.71] |
| 8 MCP ROM (degrees) Show forest plot | 1 | 26 | Mean Difference (IV, Fixed, 95% CI) | 10.0 [‐6.86, 26.86] |
| 9 Morning stiffness duration (min) Show forest plot | 2 | 54 | Mean Difference (IV, Fixed, 95% CI) | 12.16 [‐31.00, 55.31] |
| 10 Walking speed (sec) Show forest plot | 1 | 28 | Mean Difference (IV, Fixed, 95% CI) | ‐1.91 [‐12.60, 8.78] |
| 11 Grip strength Show forest plot | 1 | 26 | Mean Difference (IV, Fixed, 95% CI) | ‐29.0 [‐61.44, 3.44] |
| 11.1 Grip strength (mmHg) | 1 | 26 | Mean Difference (IV, Fixed, 95% CI) | ‐29.0 [‐61.44, 3.44] |
| 11.2 Grip strength (kg) | 0 | 0 | Mean Difference (IV, Fixed, 95% CI) | 0.0 [0.0, 0.0] |
| 12 Suprapatellar swelling‐ left knee (cm) Show forest plot | 1 | 28 | Mean Difference (IV, Fixed, 95% CI) | ‐2.89 [‐14.38, 8.60] |
| 13 Suprapatellar swelling ‐ right knee (cm) Show forest plot | 1 | 28 | Mean Difference (IV, Fixed, 95% CI) | ‐3.29 [‐14.66, 8.08] |
| 14 MCP swelling (cm) Show forest plot | 1 | 26 | Mean Difference (IV, Fixed, 95% CI) | ‐0.40 [‐1.23, 0.43] |
| 15 PIP swelling (cm) Show forest plot | 1 | 26 | Mean Difference (IV, Fixed, 95% CI) | 0.90 [‐1.88, 3.68] |
| 16 Thermographic index Show forest plot | 1 | 26 | Mean Difference (IV, Fixed, 95% CI) | 0.60 [‐0.11, 1.31] |
| 17 Rheumatoid factor positive Show forest plot | 1 | 20 | Risk Ratio (M‐H, Fixed, 95% CI) | 1.0 [0.60, 1.68] |
| 18 ESR (mm/hr) Show forest plot | 1 | 28 | Mean Difference (IV, Fixed, 95% CI) | ‐2.0 [‐26.94, 22.94] |
| 19 CRP (g/mL) Show forest plot | 2 | 54 | Mean Difference (IV, Fixed, 95% CI) | ‐4.21 [‐20.25, 11.83] |
| 20 Hemoglobin Show forest plot | 2 | 54 | Mean Difference (IV, Fixed, 95% CI) | 0.98 [‐0.21, 2.16] |
| 21 Platelets Show forest plot | 2 | 54 | Mean Difference (IV, Fixed, 95% CI) | 32.68 [‐37.76, 103.11] |
| Outcome or subgroup title | No. of studies | No. of participants | Statistical method | Effect size |
| 1 Pain (10 cm VAS or 0‐12 scale) Show forest plot | 4 | Mean Difference (IV, Fixed, 95% CI) | Subtotals only | |
| 1.1 Treatment for 4 weeks | 3 | 97 | Mean Difference (IV, Fixed, 95% CI) | ‐0.83 [‐1.46, ‐0.20] |
| 1.2 Treatment for 10 weeks | 1 | 72 | Mean Difference (IV, Fixed, 95% CI) | ‐1.54 [‐2.47, ‐0.61] |
| Outcome or subgroup title | No. of studies | No. of participants | Statistical method | Effect size |
| 1 Pain (10 cm VAS or 0‐12 scale) Show forest plot | 2 | Mean Difference (IV, Fixed, 95% CI) | Subtotals only | |
| 1.1 Treatment for 4 weeks | 2 | 54 | Mean Difference (IV, Fixed, 95% CI) | 0.06 [‐1.24, 1.36] |
| 1.2 Treatment for 10 weeks | 0 | 0 | Mean Difference (IV, Fixed, 95% CI) | 0.0 [0.0, 0.0] |
| Outcome or subgroup title | No. of studies | No. of participants | Statistical method | Effect size |
| 1 Pain at end of treatment Show forest plot | 4 | 169 | Mean Difference (IV, Fixed, 95% CI) | ‐1.05 [‐1.58, ‐0.53] |
| 1.1 Low quality (<3) | 2 | 107 | Mean Difference (IV, Fixed, 95% CI) | ‐1.39 [‐2.23, ‐0.56] |
| 1.2 High quality (=> 3) | 2 | 62 | Mean Difference (IV, Fixed, 95% CI) | ‐0.84 [‐1.51, ‐0.16] |
| Outcome or subgroup title | No. of studies | No. of participants | Statistical method | Effect size |
| 1 Pain (10 cm VAS or 0‐12 scale) Show forest plot | 4 | Mean Difference (IV, Fixed, 95% CI) | Subtotals only | |
| 1.1 Joint application | 3 | 97 | Mean Difference (IV, Fixed, 95% CI) | ‐0.83 [‐1.46, ‐0.20] |
| 1.2 Nerve application | 0 | 0 | Mean Difference (IV, Fixed, 95% CI) | 0.0 [0.0, 0.0] |
| 1.3 Joint and nerve application | 1 | 72 | Mean Difference (IV, Fixed, 95% CI) | ‐1.54 [‐2.47, ‐0.61] |
| Outcome or subgroup title | No. of studies | No. of participants | Statistical method | Effect size |
| 1 Pain (10 cm VAS or 0‐12 scale) Show forest plot | 2 | Mean Difference (IV, Fixed, 95% CI) | Subtotals only | |
| 1.1 Joint application | 2 | 54 | Mean Difference (IV, Fixed, 95% CI) | 0.06 [‐1.24, 1.36] |
| 1.2 Nerve application | 0 | 0 | Mean Difference (IV, Fixed, 95% CI) | 0.0 [0.0, 0.0] |
| 1.3 Joint and nerve application | 0 | 0 | Mean Difference (IV, Fixed, 95% CI) | 0.0 [0.0, 0.0] |
| Outcome or subgroup title | No. of studies | No. of participants | Statistical method | Effect size |
| 1 Pain Show forest plot | 4 | Mean Difference (IV, Fixed, 95% CI) | Subtotals only | |
| 1.1 Wavelength < 660 nm | 1 | 72 | Mean Difference (IV, Fixed, 95% CI) | ‐1.54 [‐2.47, ‐0.61] |
| 1.2 Wavelength 820, 830 nm | 2 | 62 | Mean Difference (IV, Fixed, 95% CI) | ‐0.84 [‐1.51, ‐0.16] |
| 1.3 Wavelength 650‐950 nm | 1 | 35 | Mean Difference (IV, Fixed, 95% CI) | ‐0.78 [‐2.68, 1.12] |
| 2 McGill Pain questionnaire Show forest plot | 1 | Mean Difference (IV, Fixed, 95% CI) | Subtotals only | |
| 2.1 Wavelength < 660 nm | 0 | 0 | Mean Difference (IV, Fixed, 95% CI) | 0.0 [0.0, 0.0] |
| 2.2 Wavelength 820, 830 nm | 0 | 0 | Mean Difference (IV, Fixed, 95% CI) | 0.0 [0.0, 0.0] |
| 2.3 Wavelength 650‐950 nm | 1 | 35 | Mean Difference (IV, Fixed, 95% CI) | 1.5 [‐1.22, 4.22] |
| 3 Ritchie Index Show forest plot | 1 | Mean Difference (IV, Fixed, 95% CI) | Subtotals only | |
| 3.1 Wavelength < 660 nm | 0 | 0 | Mean Difference (IV, Fixed, 95% CI) | 0.0 [0.0, 0.0] |
| 3.2 Wavelength 820, 830 nm | 1 | 40 | Mean Difference (IV, Fixed, 95% CI) | 2.60 [‐4.50, 9.70] |
| 3.3 Wavelength 650‐950 nm | 0 | 0 | Mean Difference (IV, Fixed, 95% CI) | 0.0 [0.0, 0.0] |
| 4 Health Assessment Questionnaire (HAQ) Show forest plot | 2 | Mean Difference (IV, Fixed, 95% CI) | Subtotals only | |
| 4.1 Wavelength < 660 nm | 0 | 0 | Mean Difference (IV, Fixed, 95% CI) | 0.0 [0.0, 0.0] |
| 4.2 Wavelength 820, 830 nm | 1 | 40 | Mean Difference (IV, Fixed, 95% CI) | 1.25 [‐2.09, 4.59] |
| 4.3 Wavelength 650‐950 nm | 1 | 35 | Mean Difference (IV, Fixed, 95% CI) | ‐0.18 [‐6.39, 6.03] |
| 5 MCP ROM (degrees) Show forest plot | 1 | Mean Difference (IV, Fixed, 95% CI) | Subtotals only | |
| 5.1 Wavelength < 660 nm | 0 | 0 | Mean Difference (IV, Fixed, 95% CI) | 0.0 [0.0, 0.0] |
| 5.2 Wavelength 820, 830 nm | 1 | 40 | Mean Difference (IV, Fixed, 95% CI) | ‐0.5 [‐15.99, 14.99] |
| 5.3 Wavelength 650‐950 nm | 0 | 0 | Mean Difference (IV, Fixed, 95% CI) | 0.0 [0.0, 0.0] |
| 6 PIP ROM (degrees) Show forest plot | 1 | Mean Difference (IV, Fixed, 95% CI) | Subtotals only | |
| 6.1 Wavelength < 660 nm | 0 | 0 | Mean Difference (IV, Fixed, 95% CI) | 0.0 [0.0, 0.0] |
| 6.2 Wavelength 820, 830 nm | 1 | 40 | Mean Difference (IV, Fixed, 95% CI) | 4.0 [‐6.60, 14.60] |
| 6.3 Wavelength 650‐950 nm | 0 | 0 | Mean Difference (IV, Fixed, 95% CI) | 0.0 [0.0, 0.0] |
| 7 Left knee Range of motion Show forest plot | 1 | Mean Difference (IV, Fixed, 95% CI) | Subtotals only | |
| 7.1 Wavelength < 660 nm | 0 | 0 | Mean Difference (IV, Fixed, 95% CI) | 0.0 [0.0, 0.0] |
| 7.2 Wavelength 820, 830 nm | 0 | 0 | Mean Difference (IV, Fixed, 95% CI) | 0.0 [0.0, 0.0] |
| 7.3 Wavelength 650‐950 nm | 1 | 35 | Mean Difference (IV, Fixed, 95% CI) | ‐23.60 [‐43.47, ‐3.73] |
| 8 Right knee ROM Show forest plot | 1 | Mean Difference (IV, Fixed, 95% CI) | Subtotals only | |
| 8.1 Wavelength < 660 nm | 0 | 0 | Mean Difference (IV, Fixed, 95% CI) | 0.0 [0.0, 0.0] |
| 8.2 Wavelength 820, 830 nm | 0 | 0 | Mean Difference (IV, Fixed, 95% CI) | 0.0 [0.0, 0.0] |
| 8.3 Wavelength 650‐950 nm | 1 | 35 | Mean Difference (IV, Fixed, 95% CI) | ‐12.90 [‐31.98, 6.18] |
| 9 Left ankle ROM Show forest plot | 1 | Mean Difference (IV, Fixed, 95% CI) | Subtotals only | |
| 9.1 Wavelength < 660 nm | 0 | 0 | Mean Difference (IV, Fixed, 95% CI) | 0.0 [0.0, 0.0] |
| 9.2 Wavelength 820, 830 nm | 0 | 0 | Mean Difference (IV, Fixed, 95% CI) | 0.0 [0.0, 0.0] |
| 9.3 Wavelength 650‐950 nm | 1 | 35 | Mean Difference (IV, Fixed, 95% CI) | 3.40 [‐3.43, 10.23] |
| 10 Right ankle ROM Show forest plot | 1 | Mean Difference (IV, Fixed, 95% CI) | Subtotals only | |
| 10.1 Wavelength < 660 nm | 0 | 0 | Mean Difference (IV, Fixed, 95% CI) | 0.0 [0.0, 0.0] |
| 10.2 Wavelength 820, 830 nm | 0 | 0 | Mean Difference (IV, Fixed, 95% CI) | 0.0 [0.0, 0.0] |
| 10.3 Wavelength 650‐950 nm | 1 | 35 | Mean Difference (IV, Fixed, 95% CI) | 7.90 [0.79, 15.01] |
| 11 Flexibility‐ tip to palm distance (cm) Show forest plot | 2 | Mean Difference (IV, Fixed, 95% CI) | Subtotals only | |
| 11.1 Wavelength < 660 nm | 0 | 0 | Mean Difference (IV, Fixed, 95% CI) | 0.0 [0.0, 0.0] |
| 11.2 Wavelength 820, 830 nm | 2 | 57 | Mean Difference (IV, Fixed, 95% CI) | ‐1.28 [‐1.72, ‐0.85] |
| 11.3 Wavelength 650‐950 nm | 0 | 0 | Mean Difference (IV, Fixed, 95% CI) | 0.0 [0.0, 0.0] |
| 12 Morning stiffness duration (min) Show forest plot | 3 | Mean Difference (IV, Fixed, 95% CI) | Subtotals only | |
| 12.1 Wavelength < 660 nm | 0 | 0 | Mean Difference (IV, Fixed, 95% CI) | 0.0 [0.0, 0.0] |
| 12.2 Wavelength 820, 830 nm | 2 | 75 | Mean Difference (IV, Fixed, 95% CI) | ‐30.65 [‐55.71, ‐5.58] |
| 12.3 Wavelength 650‐950 nm | 1 | 35 | Mean Difference (IV, Fixed, 95% CI) | 40.80 [‐75.05, 156.65] |
| 13 Morning stiffness not improved Show forest plot | 1 | Risk Ratio (M‐H, Fixed, 95% CI) | Subtotals only | |
| 13.1 Wavelength < 660 nm | 0 | 0 | Risk Ratio (M‐H, Fixed, 95% CI) | 0.0 [0.0, 0.0] |
| 13.2 Wavelength 820, 830 nm | 1 | 22 | Risk Ratio (M‐H, Fixed, 95% CI) | 0.76 [0.49, 1.19] |
| 13.3 Wavelength 650‐950 nm | 0 | 0 | Risk Ratio (M‐H, Fixed, 95% CI) | 0.0 [0.0, 0.0] |
| 14 Rheumatoid factor positive Show forest plot | 1 | Risk Ratio (M‐H, Fixed, 95% CI) | Subtotals only | |
| 14.1 Wavelength < 660 nm | 0 | 0 | Risk Ratio (M‐H, Fixed, 95% CI) | 0.0 [0.0, 0.0] |
| 14.2 Wavelength 820, 830 nm | 0 | 0 | Risk Ratio (M‐H, Fixed, 95% CI) | 0.0 [0.0, 0.0] |
| 14.3 Wavelength 650‐950 nm | 1 | 35 | Risk Ratio (M‐H, Fixed, 95% CI) | 0.9 [0.61, 1.34] |
| 15 Grip strength (mmHg, KPa, kg) Show forest plot | 3 | Mean Difference (IV, Fixed, 95% CI) | Subtotals only | |
| 15.1 Wavelength < 660 nm | 0 | 0 | Mean Difference (IV, Fixed, 95% CI) | 0.0 [0.0, 0.0] |
| 15.2 Wavelength 820, 830 nm | 3 | 97 | Mean Difference (IV, Fixed, 95% CI) | 0.62 [‐0.36, 1.60] |
| 15.3 Wavelength 650‐950 nm | 0 | 0 | Mean Difference (IV, Fixed, 95% CI) | 0.0 [0.0, 0.0] |
| 16 Suprapatellar swelling ‐ right knee (cm) Show forest plot | 1 | Mean Difference (IV, Fixed, 95% CI) | Subtotals only | |
| 16.1 Wavelength < 660 nm | 0 | 0 | Mean Difference (IV, Fixed, 95% CI) | 0.0 [0.0, 0.0] |
| 16.2 Wavelength 820, 830 nm | 0 | 0 | Mean Difference (IV, Fixed, 95% CI) | 0.0 [0.0, 0.0] |
| 16.3 Wavelength 650‐950 nm | 1 | 35 | Mean Difference (IV, Fixed, 95% CI) | ‐2.94 [‐6.31, 0.43] |
| 17 Suprapatellar swelling‐ left knee (cm) Show forest plot | 1 | Mean Difference (IV, Fixed, 95% CI) | Subtotals only | |
| 17.1 Wavelength < 660 nm | 0 | 0 | Mean Difference (IV, Fixed, 95% CI) | 0.0 [0.0, 0.0] |
| 17.2 Wavelength 820, 830 nm | 0 | 0 | Mean Difference (IV, Fixed, 95% CI) | 0.0 [0.0, 0.0] |
| 17.3 Wavelength 650‐950 nm | 1 | 35 | Mean Difference (IV, Fixed, 95% CI) | ‐2.69 [‐6.33, 0.95] |
| 18 MCP swelling (cm) Show forest plot | 1 | Mean Difference (IV, Fixed, 95% CI) | Subtotals only | |
| 18.1 Wavelength < 660 nm | 0 | 0 | Mean Difference (IV, Fixed, 95% CI) | 0.0 [0.0, 0.0] |
| 18.2 Wavelength 820, 830 nm | 1 | 40 | Mean Difference (IV, Fixed, 95% CI) | 0.20 [‐0.78, 1.18] |
| 18.3 Wavelength 650‐950 nm | 0 | 0 | Mean Difference (IV, Fixed, 95% CI) | 0.0 [0.0, 0.0] |
| 19 PIP swelling (cm) Show forest plot | 2 | Mean Difference (IV, Fixed, 95% CI) | Subtotals only | |
| 19.1 Wavelength < 660 nm | 0 | 0 | Mean Difference (IV, Fixed, 95% CI) | 0.0 [0.0, 0.0] |
| 19.2 Wavelength 820, 830 nm | 2 | 75 | Mean Difference (IV, Fixed, 95% CI) | 0.53 [‐1.12, 2.18] |
| 19.3 Wavelength 650‐950 nm | 0 | 0 | Mean Difference (IV, Fixed, 95% CI) | 0.0 [0.0, 0.0] |
| 20 Walking speed (sec) Show forest plot | 1 | Mean Difference (IV, Fixed, 95% CI) | Subtotals only | |
| 20.1 Wavelength < 660 nm | 0 | 0 | Mean Difference (IV, Fixed, 95% CI) | 0.0 [0.0, 0.0] |
| 20.2 Wavelength 820, 830 nm | 0 | 0 | Mean Difference (IV, Fixed, 95% CI) | 0.0 [0.0, 0.0] |
| 20.3 Wavelength 650‐950 nm | 1 | 35 | Mean Difference (IV, Fixed, 95% CI) | ‐1.87 [‐7.08, 3.34] |
| 21 Fibrinogen Show forest plot | 1 | Mean Difference (IV, Fixed, 95% CI) | Subtotals only | |
| 21.1 Wavelength < 660 nm | 0 | 0 | Mean Difference (IV, Fixed, 95% CI) | 0.0 [0.0, 0.0] |
| 21.2 Wavelength 820, 830 nm | 1 | 35 | Mean Difference (IV, Fixed, 95% CI) | 1.5 [‐0.00, 3.00] |
| 21.3 Wavelength 650‐950 nm | 0 | 0 | Mean Difference (IV, Fixed, 95% CI) | 0.0 [0.0, 0.0] |
| 22 Leukocytes Show forest plot | 1 | Mean Difference (IV, Fixed, 95% CI) | Subtotals only | |
| 22.1 Wavelength < 660 nm | 0 | 0 | Mean Difference (IV, Fixed, 95% CI) | 0.0 [0.0, 0.0] |
| 22.2 Wavelength 820, 830 nm | 1 | 35 | Mean Difference (IV, Fixed, 95% CI) | 1.60 [0.62, 2.58] |
| 22.3 Wavelength 650‐950 nm | 0 | 0 | Mean Difference (IV, Fixed, 95% CI) | 0.0 [0.0, 0.0] |
| 23 Lymphocytes Show forest plot | 1 | Mean Difference (IV, Fixed, 95% CI) | Subtotals only | |
| 23.1 Wavelength < 660 nm | 0 | 0 | Mean Difference (IV, Fixed, 95% CI) | 0.0 [0.0, 0.0] |
| 23.2 Wavelength 820, 830 nm | 1 | 35 | Mean Difference (IV, Fixed, 95% CI) | 3.0 [‐6.57, 12.57] |
| 23.3 Wavelength 650‐950 nm | 0 | 0 | Mean Difference (IV, Fixed, 95% CI) | 0.0 [0.0, 0.0] |
| 24 ESR (mm/hr) Show forest plot | 3 | Mean Difference (IV, Fixed, 95% CI) | Subtotals only | |
| 24.1 Wavelength < 660 nm | 0 | 0 | Mean Difference (IV, Fixed, 95% CI) | 0.0 [0.0, 0.0] |
| 24.2 Wavelength 820, 830 nm | 2 | 57 | Mean Difference (IV, Fixed, 95% CI) | ‐11.12 [‐16.21, ‐6.04] |
| 24.3 Wavelength 650‐950 nm | 1 | 35 | Mean Difference (IV, Fixed, 95% CI) | 8.27 [‐13.18, 29.72] |
| 25 CRP (g/mL) Show forest plot | 2 | Mean Difference (IV, Fixed, 95% CI) | Subtotals only | |
| 25.1 Wavelength < 660 nm | 0 | 0 | Mean Difference (IV, Fixed, 95% CI) | 0.0 [0.0, 0.0] |
| 25.2 Wavelength 820, 830 nm | 1 | 22 | Mean Difference (IV, Fixed, 95% CI) | ‐120.0 [‐190.13, ‐49.87] |
| 25.3 Wavelength 650‐950 nm | 1 | 35 | Mean Difference (IV, Fixed, 95% CI) | 9.88 [‐7.27, 27.03] |
| 26 Hemoglobin Show forest plot | 2 | Mean Difference (IV, Fixed, 95% CI) | Subtotals only | |
| 26.1 Wavelength < 660 nm | 0 | 0 | Mean Difference (IV, Fixed, 95% CI) | 0.0 [0.0, 0.0] |
| 26.2 Wavelength 820, 830 nm | 1 | 35 | Mean Difference (IV, Fixed, 95% CI) | 0.60 [0.11, 1.09] |
| 26.3 Wavelength 650‐950 nm | 1 | 35 | Mean Difference (IV, Fixed, 95% CI) | ‐0.69 [‐2.12, 0.74] |
| 27 Platelets Show forest plot | 1 | Mean Difference (IV, Fixed, 95% CI) | Subtotals only | |
| 27.1 Wavelength < 660 nm | 0 | 0 | Mean Difference (IV, Fixed, 95% CI) | 0.0 [0.0, 0.0] |
| 27.2 Wavelength 820, 830 nm | 0 | 0 | Mean Difference (IV, Fixed, 95% CI) | 0.0 [0.0, 0.0] |
| 27.3 Wavelength 650‐950 nm | 1 | 35 | Mean Difference (IV, Fixed, 95% CI) | 20.35 [‐64.36, 105.06] |
| Outcome or subgroup title | No. of studies | No. of participants | Statistical method | Effect size |
| 1 Pain VAS <= 3 J/cm2 Show forest plot | 2 | 94 | Mean Difference (IV, Fixed, 95% CI) | ‐1.22 [‐1.81, ‐0.63] |
| 2 Pain VAS > 3 J/cm2 Show forest plot | 2 | 75 | Mean Difference (IV, Fixed, 95% CI) | ‐0.47 [‐1.59, 0.65] |
| 3 ESR low dose Show forest plot | 1 | 22 | Mean Difference (IV, Fixed, 95% CI) | ‐20.0 [‐28.69, ‐11.31] |
| 4 ESR high dose Show forest plot | 2 | 70 | Mean Difference (IV, Fixed, 95% CI) | ‐5.34 [‐11.35, 0.68] |
| 5 CRP low dose Show forest plot | 1 | 22 | Mean Difference (IV, Fixed, 95% CI) | ‐120.0 [‐190.13, ‐49.87] |
| 6 CRP high dose Show forest plot | 1 | 35 | Mean Difference (IV, Fixed, 95% CI) | 9.88 [‐7.27, 27.03] |
| 7 HAQ high dose Show forest plot | 2 | 75 | Mean Difference (IV, Fixed, 95% CI) | 0.93 [‐2.01, 3.87] |
| 8 Hemoglobin high dose Show forest plot | 2 | 70 | Mean Difference (IV, Fixed, 95% CI) | 0.47 [0.01, 0.93] |
| 9 Morning stiffness (hours) high dose Show forest plot | 3 | 110 | Mean Difference (IV, Fixed, 95% CI) | ‐27.45 [‐51.95, ‐2.95] |
| 10 Grip strength (kg) low Show forest plot | 1 | 22 | Mean Difference (IV, Fixed, 95% CI) | 0.5 [‐0.49, 1.49] |
| 11 Grip strength (kg) high Show forest plot | 2 | 75 | Mean Difference (IV, Fixed, 95% CI) | 7.71 [0.15, 15.27] |
| 12 MCP swelling (cm) low Show forest plot | 2 | 75 | Mean Difference (IV, Fixed, 95% CI) | 0.53 [‐1.12, 2.18] |
| 13 Flexibility tip to palm (cm) low Show forest plot | 1 | 22 | Mean Difference (IV, Fixed, 95% CI) | ‐1.25 [‐1.68, ‐0.82] |
| 14 Flexibility tip to palm high dose Show forest plot | 1 | 35 | Mean Difference (IV, Fixed, 95% CI) | ‐6.0 [‐11.25, ‐0.75] |
| Outcome or subgroup title | No. of studies | No. of participants | Statistical method | Effect size |
| 1 Number of patients improved in pain relief Show forest plot | 1 | 34 | Risk Ratio (M‐H, Fixed, 95% CI) | 13.0 [0.79, 214.05] |
| 2 Number of patients improved in morning stiffness Show forest plot | 1 | 34 | Risk Ratio (M‐H, Fixed, 95% CI) | 4.0 [0.50, 32.20] |