| 1 Vertebral fractures Show forest plot | 2 | | Odds Ratio (M‐H, Fixed, 95% CI) | Subtotals only |
|
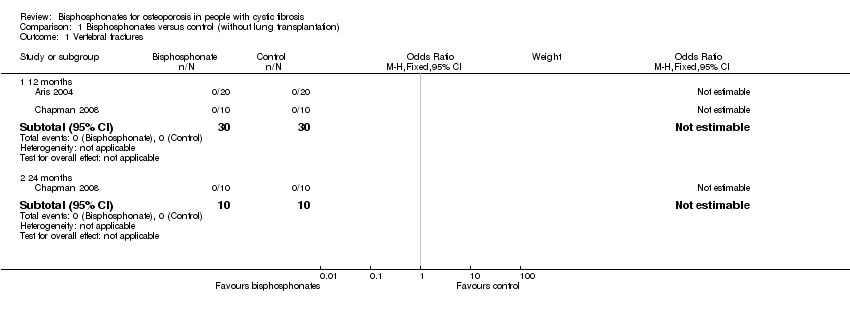
| 1.1 12 months | 2 | 60 | Odds Ratio (M‐H, Fixed, 95% CI) | 0.0 [0.0, 0.0] |
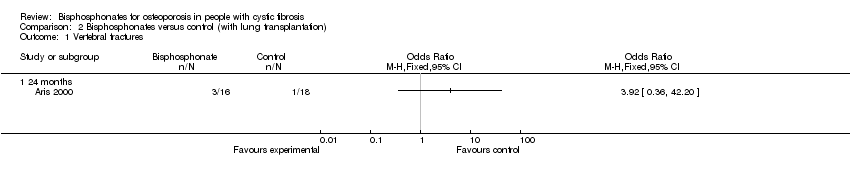
| 1.2 24 months | 1 | 20 | Odds Ratio (M‐H, Fixed, 95% CI) | 0.0 [0.0, 0.0] |
| 2 Non‐vertebral fractures Show forest plot | 2 | | Odds Ratio (M‐H, Fixed, 95% CI) | Subtotals only |
|
| 2.1 12 months | 2 | 60 | Odds Ratio (M‐H, Fixed, 95% CI) | 2.11 [0.18, 25.35] |
| 2.2 24 months | 1 | 20 | Odds Ratio (M‐H, Fixed, 95% CI) | 0.0 [0.0, 0.0] |
| 3 Total Fractures Show forest plot | 2 | | Odds Ratio (M‐H, Fixed, 95% CI) | Subtotals only |
|
| 3.1 12 months | 2 | 60 | Odds Ratio (M‐H, Fixed, 95% CI) | 2.11 [0.18, 25.35] |
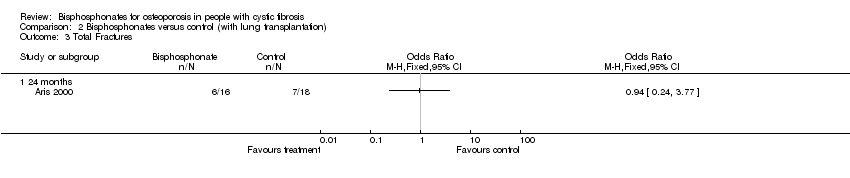
| 3.2 24 months | 1 | 20 | Odds Ratio (M‐H, Fixed, 95% CI) | 0.0 [0.0, 0.0] |
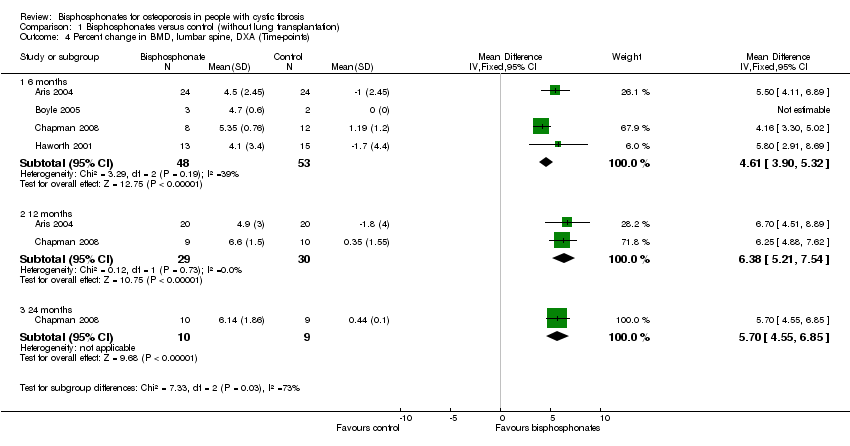
| 4 Percent change in BMD, lumbar spine, DXA (Time‐points) Show forest plot | 4 | | Mean Difference (IV, Fixed, 95% CI) | Subtotals only |
|
| 4.1 6 months | 4 | 101 | Mean Difference (IV, Fixed, 95% CI) | 4.61 [3.90, 5.32] |
| 4.2 12 months | 2 | 59 | Mean Difference (IV, Fixed, 95% CI) | 6.38 [5.21, 7.54] |
| 4.3 24 months | 1 | 19 | Mean Difference (IV, Fixed, 95% CI) | 5.70 [4.55, 6.85] |
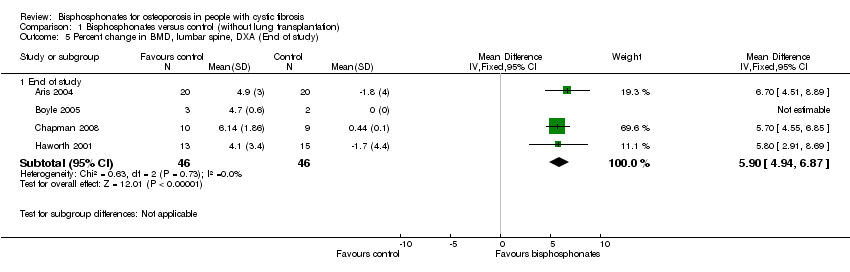
| 5 Percent change in BMD, lumbar spine, DXA (End of study) Show forest plot | 4 | | Mean Difference (IV, Fixed, 95% CI) | Subtotals only |
|
| 5.1 End of study | 4 | 92 | Mean Difference (IV, Fixed, 95% CI) | 5.90 [4.94, 6.87] |
| 6 Percent change in BMD, total hip / femur, DXA (Time‐points) Show forest plot | 3 | | Mean Difference (IV, Random, 95% CI) | Subtotals only |
|
| 6.1 6 months | 3 | 96 | Mean Difference (IV, Random, 95% CI) | 3.35 [1.63, 5.07] |
| 6.2 12 months | 2 | 59 | Mean Difference (IV, Random, 95% CI) | 4.84 [2.73, 6.96] |
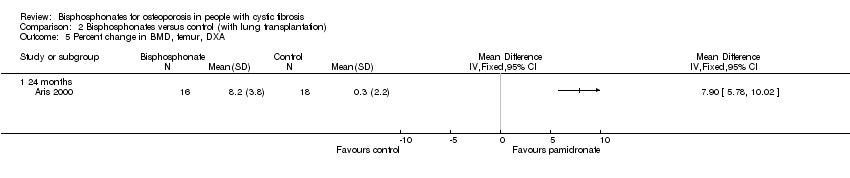
| 6.3 24 months | 1 | 19 | Mean Difference (IV, Random, 95% CI) | 6.73 [5.51, 7.95] |
| 7 Percent change in BMD, total hip/femur, DXA (End of study) Show forest plot | 3 | | Mean Difference (IV, Random, 95% CI) | Subtotals only |
|
| 7.1 End of study | 3 | 87 | Mean Difference (IV, Random, 95% CI) | 4.58 [1.92, 7.24] |
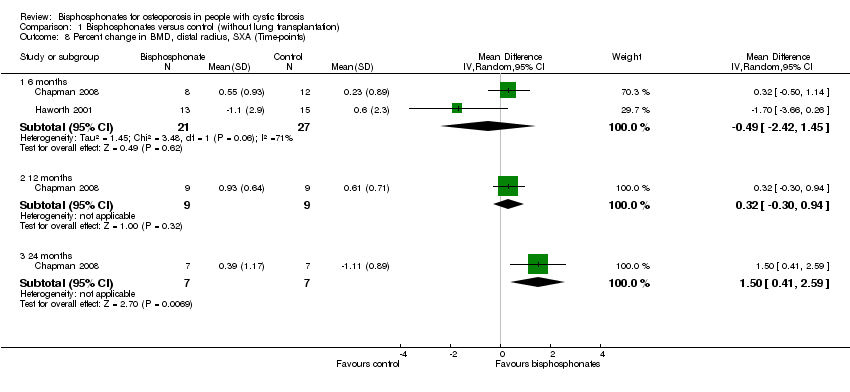
| 8 Percent change in BMD, distal radius, SXA (Time‐points) Show forest plot | 2 | | Mean Difference (IV, Random, 95% CI) | Subtotals only |
|
| 8.1 6 months | 2 | 48 | Mean Difference (IV, Random, 95% CI) | ‐0.49 [‐2.42, 1.45] |
| 8.2 12 months | 1 | 18 | Mean Difference (IV, Random, 95% CI) | 0.32 [‐0.30, 0.94] |
| 8.3 24 months | 1 | 14 | Mean Difference (IV, Random, 95% CI) | 1.5 [0.41, 2.59] |
| 9 Percent change in BMD, distal radius, SXA (End of study) Show forest plot | 2 | | Mean Difference (IV, Random, 95% CI) | Subtotals only |
|
| 9.1 End of study | 2 | 42 | Mean Difference (IV, Random, 95% CI) | 0.01 [‐3.12, 3.14] |
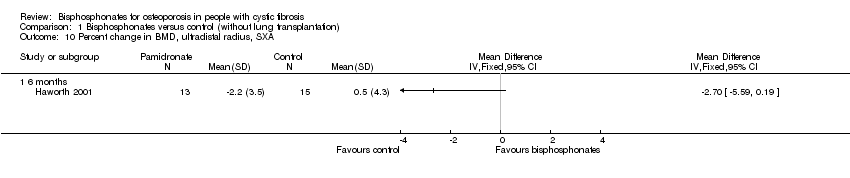
| 10 Percent change in BMD, ultradistal radius, SXA Show forest plot | 1 | | Mean Difference (IV, Fixed, 95% CI) | Totals not selected |
|
| 10.1 6 months | 1 | | Mean Difference (IV, Fixed, 95% CI) | 0.0 [0.0, 0.0] |
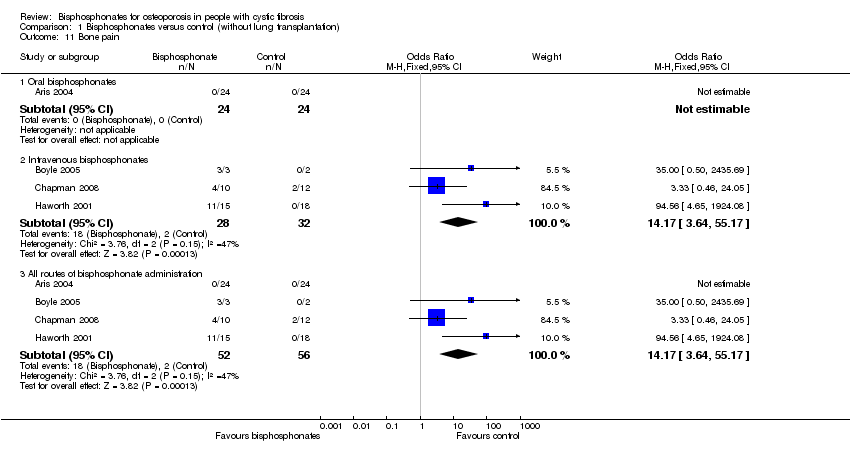
| 11 Bone pain Show forest plot | 4 | | Odds Ratio (M‐H, Fixed, 95% CI) | Subtotals only |
|
| 11.1 Oral bisphosphonates | 1 | 48 | Odds Ratio (M‐H, Fixed, 95% CI) | 0.0 [0.0, 0.0] |
| 11.2 Intravenous bisphosphonates | 3 | 60 | Odds Ratio (M‐H, Fixed, 95% CI) | 14.17 [3.64, 55.17] |
| 11.3 All routes of bisphosphonate administration | 4 | 108 | Odds Ratio (M‐H, Fixed, 95% CI) | 14.17 [3.64, 55.17] |
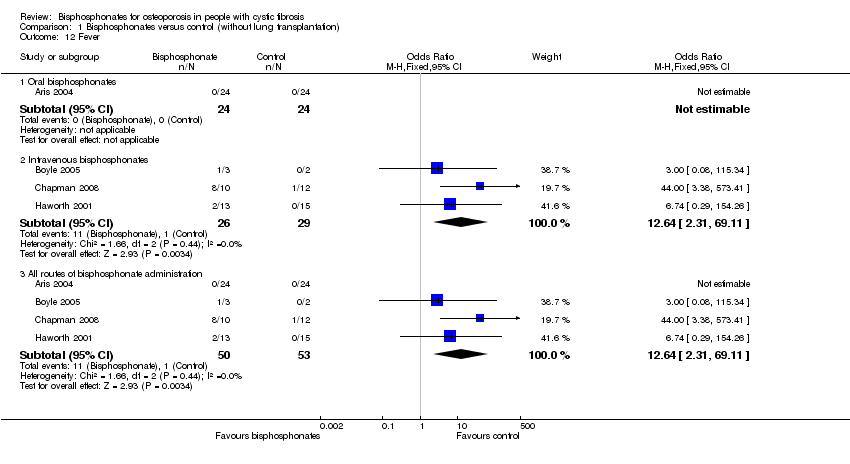
| 12 Fever Show forest plot | 4 | | Odds Ratio (M‐H, Fixed, 95% CI) | Subtotals only |
|
| 12.1 Oral bisphosphonates | 1 | 48 | Odds Ratio (M‐H, Fixed, 95% CI) | 0.0 [0.0, 0.0] |
| 12.2 Intravenous bisphosphonates | 3 | 55 | Odds Ratio (M‐H, Fixed, 95% CI) | 12.64 [2.31, 69.11] |
| 12.3 All routes of bisphosphonate administration | 4 | 103 | Odds Ratio (M‐H, Fixed, 95% CI) | 12.64 [2.31, 69.11] |
| 13 Withdrawals, due to adverse events Show forest plot | 3 | | Odds Ratio (M‐H, Fixed, 95% CI) | Subtotals only |
|
| 13.1 6 months | 2 | 53 | Odds Ratio (M‐H, Fixed, 95% CI) | 3.95 [0.14, 108.09] |
| 13.2 12 months | 2 | 70 | Odds Ratio (M‐H, Fixed, 95% CI) | 7.35 [0.31, 173.13] |
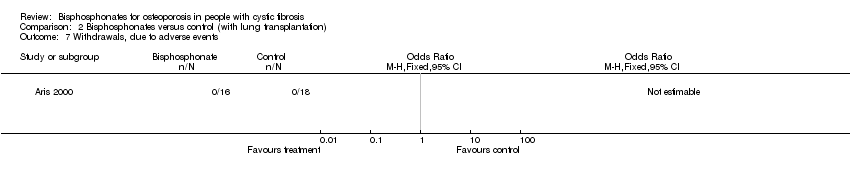
| 13.3 24 months | 1 | 22 | Odds Ratio (M‐H, Fixed, 95% CI) | 7.35 [0.31, 173.13] |
| 14 Withdrawals, total Show forest plot | 3 | | Odds Ratio (M‐H, Fixed, 95% CI) | Subtotals only |
|
| 14.1 6 months | 2 | 53 | Odds Ratio (M‐H, Fixed, 95% CI) | 2.83 [0.39, 20.73] |
| 14.2 12 months | 2 | 70 | Odds Ratio (M‐H, Fixed, 95% CI) | 1.08 [0.31, 3.73] |
| 14.3 24 months | 1 | 22 | Odds Ratio (M‐H, Fixed, 95% CI) | 0.43 [0.07, 2.50] |
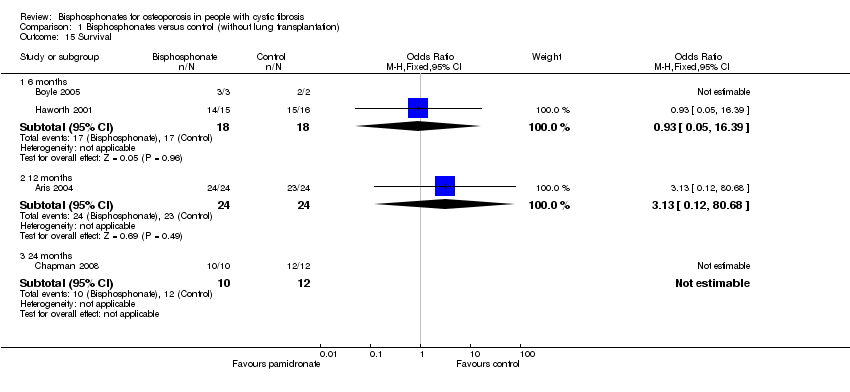
| 15 Survival Show forest plot | 4 | | Odds Ratio (M‐H, Fixed, 95% CI) | Subtotals only |
|
| 15.1 6 months | 2 | 36 | Odds Ratio (M‐H, Fixed, 95% CI) | 0.93 [0.05, 16.39] |
| 15.2 12 months | 1 | 48 | Odds Ratio (M‐H, Fixed, 95% CI) | 3.13 [0.12, 80.68] |
| 15.3 24 months | 1 | 22 | Odds Ratio (M‐H, Fixed, 95% CI) | 0.0 [0.0, 0.0] |