Tratamiento de antibióticos antipseudomonas intravenosos simples versus combinados para personas con fibrosis quística
Información
- DOI:
- https://doi.org/10.1002/14651858.CD002007.pub4Copiar DOI

- Base de datos:
-
- Cochrane Database of Systematic Reviews
- Versión publicada:
-
- 01 diciembre 2016see what's new
- Tipo:
-
- Intervention
- Etapa:
-
- Review
- Grupo Editorial Cochrane:
-
Grupo Cochrane de Fibrosis quística y enfermedades genéticas
- Copyright:
-
- Copyright © 2016 The Cochrane Collaboration. Published by John Wiley & Sons, Ltd.
Cifras del artículo
Altmetric:
Citado por:
Autores
Contributions of authors
Dr. Anton Tan assisted in the assessment of trial quality and extraction of data up until 2013.
Dr. Heather Elphick performed the updates and acts as guarantor of the review. Dr Alison Scott joined the author team as a co‐author from the update in 2016.
Sources of support
Internal sources
-
No sources of support supplied
External sources
-
National Institute for Health Research, UK.
This systematic review was supported by the National Institute for Health Research, via Cochrane Infrastructure funding to the Cochrane Cystic Fibrosis and Genetic Disorders Group.
Declarations of interest
Dr Heather Elphick has no interests to declare.
Dr Alison Scott has no interests to declare.
Acknowledgements
We would like to thank Dr A. Tan for his previous contributions to this review.
Version history
| Published | Title | Stage | Authors | Version |
| 2021 Jun 23 | Single versus combination intravenous anti‐pseudomonal antibiotic therapy for people with cystic fibrosis | Review | Poppy Holland, Nikki Jahnke | |
| 2016 Dec 01 | Single versus combination intravenous anti‐pseudomonal antibiotic therapy for people with cystic fibrosis | Review | Heather E Elphick, Alison Scott | |
| 2014 Apr 30 | Single versus combination intravenous antibiotic therapy for people with cystic fibrosis | Review | Heather E Elphick, Nikki Jahnke | |
| 2005 Apr 20 | Single versus combination intravenous antibiotic therapy for people with cystic fibrosis | Review | Heather E Elphick, Anton A Tan | |
| 2001 Jan 22 | Single versus combination intravenous antibiotic therapy for people with cystic fibrosis | Review | Heather E Elphick, Anton A Tan | |
Notes
Description of the pharmacological properties of the antibiotics used in the studies included in the review (Kucers 1997).
1. Beta‐Lactams
a. Carbenicillin
Carbenicillin is a semisynthetic penicillin derived from the penicillin nucleus 6 APA and can only be administered parenterally. Its most important feature is its activity against Pseudomonas aeruginosa due to its ability to penetrate the outer cell membrane of the bacteria and is less susceptible than other beta‐lactam antibiotics to at least one beta‐lactamase produced by Pseudomonas aeruginosa. It is also active against other gram positive and negative aerobic organisms including Staphylococcus aureus and Haemophilus influenzae. Principal side effects include hypersensitivity, drug fever and rarely convulsions and effects on platelet function.
b. Ticarcillin
Ticarcillin is very similar to carbenicillin but is at least twice as active against Pseudomonas aeruginosa. It has now replaced carbenicillin for clinical use. As ticarcillin is used in a lower dosage than carbenicillin, it causes fewer side effects, but can be associated with eosinophilia and urticaria.
c. Piperacillin
Piperacillin and azlocillin are semisynthetic penicillins, referred to as 'newer anti‐pseudomonal penicillins' and are considerably more active in vitro than carbenicillin and ticarcillin against Pseudomonas aeruginosa due to their ability to pass through the layers of the cell envelope to reach the enzyme penicillin‐binding protein PBP3, which is responsible for septum formation during bacterial growth and cell division. Piperacillin is not however clinically superior and development of resistant strains have been observed. Piperacillin also has activity against Burkholderia cepacia, Haemophilus influenzae, Staphylococcus aureus and other gram negative organisms. Main side effects are similar to those of carbenicillin.
d. Azlocillin
Azlocillin is a ureido‐penicillin and is similar to piperacillin in its activity against Pseudomonas aeruginosa and acts synergistically with aminoglycosides. Azlocillin‐resistant Pseudomonas aeruginosa strains are uncommon. It has some activity against Haemophilus influenzae.
e. Ceftazidime
Ceftazidime is a third generation cephalosporin, resistant to the usual beta‐lactamases of most gram negative bacteria and its activity against Pseudomonas aeruginosa is one of its most important properties. Ceftazidime‐resistant strains have been described. Ceftazidime can only be administered parenterally and acts in a similar way to penicillin G on the bacterial cell wall and shows an affinity for PBP3. Ceftazidime has low toxicity with a low incidence of hypersensitivity, eosinophilia and reversible elevations in liver enzymes.
2. Aminoglycosides
a. Gentamicin
Gentamicin is an aminoglycoside antibiotic which has particular activity against gram‐negative organisms. Its usefulness has decreased since the mid‐1970s because of the emergence of bacterial resistance. Gentamicin inhibits bacterial growth by inhibiting protein synthesis in a manner similar to streptomycin. It probably also interacts with the cell envelope of some gram‐negative bacilli such as Pseudomonas aeruginosa, resulting in lysis of the cell. Gentamicin has also been shown to inhibit the activity of the extracellular proteases secreted by Pseudomonas aeruginosa, enzymes which contribute to pathogenicity. The major side effects seen with gentamicin are ototoxicity in the form of both cochlear and vestibular toxicity with high prolonged serum levels of the drug and nephrotoxicity due to damage to the proximal tubules, characterised by excretion of casts, oliguria, proteinuria and elevated urea and creatinine. Other side effects include neuromuscular blockade, hypersensitivity reactions and haematological effects.
b. Tobramycin
Tobramycin is an aminoglycoside antibiotic with a similar mode of action to gentamicin but its advantages include greater intrinsic activity against Pseudomonas aeruginosa, activity against some gentamicin‐resistant strains and lesser nephrotoxicity and therefore is often used in preference to gentamicin. The efficacy and safety of tobramycin given as a once‐daily infusion in cystic fibrosis are currently under evaluation.
c. Sisomycin
Sisomycin is another aminoglycoside with similar antimicrobial spectrum to gentamicin. Sisomycin is more active than gentamicin, but less active than tobramycin against Pseudomonas aeruginosa. It has had limited clinical trials and has been available commercially in Europe but not in the UK, USA or Australia. The toxicity is about the same as that of gentamicin.
Keywords
MeSH
Medical Subject Headings (MeSH) Keywords
- Aminoglycosides [administration & dosage];
- Anti‐Bacterial Agents [*administration & dosage];
- Bacterial Infections [*drug therapy];
- Cephalosporins [administration & dosage];
- Cystic Fibrosis [*complications];
- Drug Therapy, Combination [methods];
- Injections, Intravenous;
- Pseudomonas Infections [*drug therapy];
- Pseudomonas aeruginosa;
- Randomized Controlled Trials as Topic;
- Respiratory Tract Infections [*drug therapy];
- beta‐Lactams [administration & dosage];
Medical Subject Headings Check Words
Humans;
PICO

Comparison 1 Single versus combination, symptomatic regimen, Outcome 1 Mean FEV1 at end of course (% pred).

Comparison 1 Single versus combination, symptomatic regimen, Outcome 2 Mean FVC at end of course (% pred).
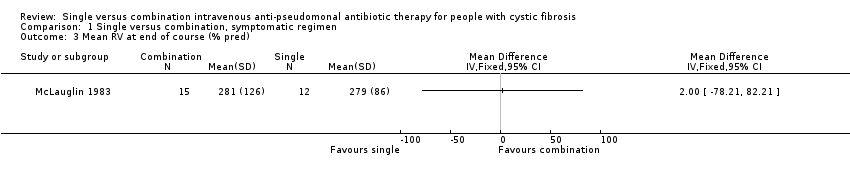
Comparison 1 Single versus combination, symptomatic regimen, Outcome 3 Mean RV at end of course (% pred).
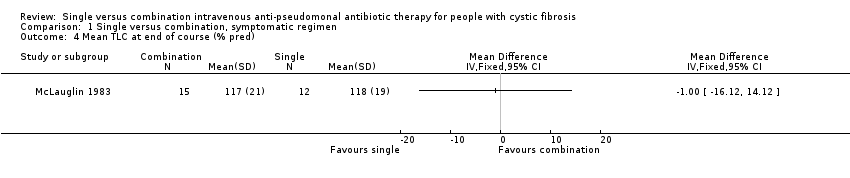
Comparison 1 Single versus combination, symptomatic regimen, Outcome 4 Mean TLC at end of course (% pred).

Comparison 1 Single versus combination, symptomatic regimen, Outcome 5 Mean RV/TLC at end of course (% pred).

Comparison 1 Single versus combination, symptomatic regimen, Outcome 6 Mean PFR at end of course (% pred).
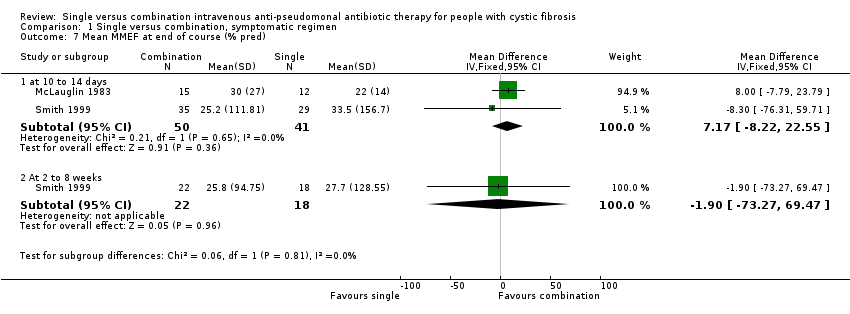
Comparison 1 Single versus combination, symptomatic regimen, Outcome 7 Mean MMEF at end of course (% pred).

Comparison 1 Single versus combination, symptomatic regimen, Outcome 8 Mean Schwachman score at end of course.
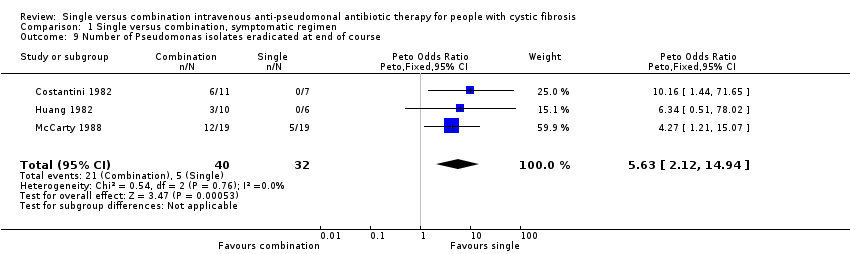
Comparison 1 Single versus combination, symptomatic regimen, Outcome 9 Number of Pseudomonas isolates eradicated at end of course.

Comparison 1 Single versus combination, symptomatic regimen, Outcome 10 Mean change Pseudomonas density in cfu/g at end of course.

Comparison 1 Single versus combination, symptomatic regimen, Outcome 11 Number adverse events.
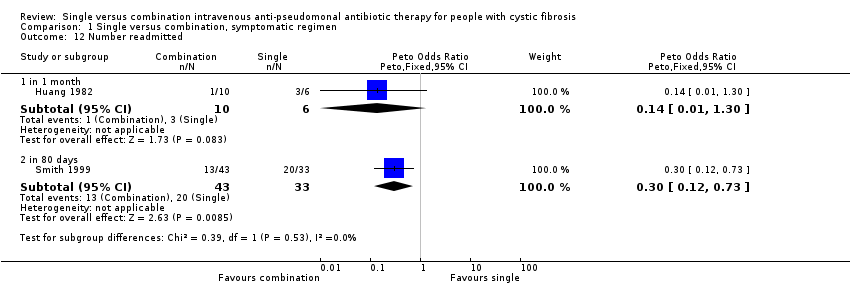
Comparison 1 Single versus combination, symptomatic regimen, Outcome 12 Number readmitted.

Comparison 1 Single versus combination, symptomatic regimen, Outcome 13 Mean time to next course of antibiotics (weeks).

Comparison 1 Single versus combination, symptomatic regimen, Outcome 14 Mean WBC count at end of course.

Comparison 1 Single versus combination, symptomatic regimen, Outcome 15 Number resistant strains.
| Outcome or subgroup title | No. of studies | No. of participants | Statistical method | Effect size |
| 1 Mean FEV1 at end of course (% pred) Show forest plot | 2 | Mean Difference (IV, Fixed, 95% CI) | Subtotals only | |
| 1.1 at 10 to 14 days | 2 | 93 | Mean Difference (IV, Fixed, 95% CI) | 5.25 [‐9.14, 19.64] |
| 1.2 at 2 to 8 weeks | 1 | 41 | Mean Difference (IV, Fixed, 95% CI) | 0.5 [‐57.36, 58.36] |
| 2 Mean FVC at end of course (% pred) Show forest plot | 2 | Mean Difference (IV, Fixed, 95% CI) | Subtotals only | |
| 2.1 at 10 to 14 days | 2 | 93 | Mean Difference (IV, Fixed, 95% CI) | 1.84 [‐11.44, 15.12] |
| 2.2 at 2 to 8 weeks | 1 | 41 | Mean Difference (IV, Fixed, 95% CI) | 6.90 [‐50.50, 64.30] |
| 3 Mean RV at end of course (% pred) Show forest plot | 1 | Mean Difference (IV, Fixed, 95% CI) | Totals not selected | |
| 4 Mean TLC at end of course (% pred) Show forest plot | 1 | Mean Difference (IV, Fixed, 95% CI) | Totals not selected | |
| 5 Mean RV/TLC at end of course (% pred) Show forest plot | 1 | Mean Difference (IV, Fixed, 95% CI) | Subtotals only | |
| 5.1 at 2 weeks | 1 | 64 | Mean Difference (IV, Fixed, 95% CI) | ‐1.40 [‐40.68, 37.88] |
| 5.2 At 2 to 8 weeks | 1 | 40 | Mean Difference (IV, Fixed, 95% CI) | ‐5.20 [‐54.27, 43.87] |
| 6 Mean PFR at end of course (% pred) Show forest plot | 2 | Mean Difference (IV, Fixed, 95% CI) | Subtotals only | |
| 6.1 at 10 to 14 days | 2 | 91 | Mean Difference (IV, Fixed, 95% CI) | 3.21 [‐11.49, 17.91] |
| 6.2 At 2 to 8 weeks | 1 | 40 | Mean Difference (IV, Fixed, 95% CI) | 2.30 [‐60.90, 65.50] |
| 7 Mean MMEF at end of course (% pred) Show forest plot | 2 | Mean Difference (IV, Fixed, 95% CI) | Subtotals only | |
| 7.1 at 10 to 14 days | 2 | 91 | Mean Difference (IV, Fixed, 95% CI) | 7.17 [‐8.22, 22.55] |
| 7.2 At 2 to 8 weeks | 1 | 40 | Mean Difference (IV, Fixed, 95% CI) | ‐1.90 [‐73.27, 69.47] |
| 8 Mean Schwachman score at end of course Show forest plot | 1 | Mean Difference (IV, Fixed, 95% CI) | Totals not selected | |
| 9 Number of Pseudomonas isolates eradicated at end of course Show forest plot | 3 | 72 | Peto Odds Ratio (Peto, Fixed, 95% CI) | 5.63 [2.12, 14.94] |
| 10 Mean change Pseudomonas density in cfu/g at end of course Show forest plot | 1 | Mean Difference (IV, Fixed, 95% CI) | Totals not selected | |
| 11 Number adverse events Show forest plot | 2 | Peto Odds Ratio (Peto, Fixed, 95% CI) | Subtotals only | |
| 11.1 local erythema / irritation | 2 | 131 | Peto Odds Ratio (Peto, Fixed, 95% CI) | 0.46 [0.09, 2.36] |
| 11.2 generalised rash | 1 | 20 | Peto Odds Ratio (Peto, Fixed, 95% CI) | 6.16 [0.12, 316.67] |
| 11.3 fever | 1 | 20 | Peto Odds Ratio (Peto, Fixed, 95% CI) | 0.81 [0.05, 14.14] |
| 11.4 renal impairment (increased creatinine by 50%) | 1 | 80 | Peto Odds Ratio (Peto, Fixed, 95% CI) | 1.54 [0.15, 15.56] |
| 11.5 auditory impairment | 1 | 76 | Peto Odds Ratio (Peto, Fixed, 95% CI) | 5.86 [0.11, 305.44] |
| 11.6 proteinuria | 1 | 63 | Peto Odds Ratio (Peto, Fixed, 95% CI) | 3.62 [0.68, 19.30] |
| 12 Number readmitted Show forest plot | 2 | Peto Odds Ratio (Peto, Fixed, 95% CI) | Subtotals only | |
| 12.1 in 1 month | 1 | 16 | Peto Odds Ratio (Peto, Fixed, 95% CI) | 0.14 [0.01, 1.30] |
| 12.2 in 80 days | 1 | 76 | Peto Odds Ratio (Peto, Fixed, 95% CI) | 0.30 [0.12, 0.73] |
| 13 Mean time to next course of antibiotics (weeks) Show forest plot | 1 | Mean Difference (IV, Fixed, 95% CI) | Totals not selected | |
| 14 Mean WBC count at end of course Show forest plot | 1 | Mean Difference (IV, Fixed, 95% CI) | Totals not selected | |
| 15 Number resistant strains Show forest plot | 2 | Peto Odds Ratio (Peto, Fixed, 95% CI) | Subtotals only | |
| 15.1 at baseline | 2 | 140 | Peto Odds Ratio (Peto, Fixed, 95% CI) | 0.83 [0.38, 1.82] |
| 15.2 at end of course | 2 | 99 | Peto Odds Ratio (Peto, Fixed, 95% CI) | 2.44 [0.94, 6.32] |
| 15.3 at 2 to 8 weeks | 2 | 76 | Peto Odds Ratio (Peto, Fixed, 95% CI) | 0.44 [0.17, 1.14] |
| 15.4 Difference between baseline and 2 to 8 weeks | 1 | 29 | Peto Odds Ratio (Peto, Fixed, 95% CI) | 0.27 [0.06, 1.18] |