Tratamiento de antibióticos antipseudomonas intravenosos simples versus combinados para personas con fibrosis quística
Resumen
Antecedentes
La elección del antibiótico y el uso de una terapia única o combinada son áreas controvertidas en el tratamiento de la infección respiratoria debida a Pseudomonas aeruginosa en la fibrosis quística (FQ). Entre las ventajas de la terapia combinada figuran una mayor gama de modos de acción, la posible sinergia y reducción de los organismos resistentes; entre las ventajas de la monoterapia figuran el menor coste, la facilidad de administración y la reducción de la toxicidad relacionada con los fármacos. La evidencia actual no proporciona una respuesta clara y el uso de la terapia de antibióticos por vía intravenosa en la fibrosis quística requiere una mayor evaluación. Ésta es una actualización de una revisión publicada anteriormente.
Objetivos
Evaluar la eficacia de la terapia antibiótica antipseudomonas intravenosa única comparada con combinada para tratar a las personas con fibrosis quística.
Métodos de búsqueda
Se realizaron búsquedas en el registro de ensayos del Grupo Cochrane de Fibrosis Quística (Cochrane Cystic Fibrosis and Genetic Disorders Group) que incluían referencias identificadas de búsquedas exhaustivas en bases de datos electrónicas o búsquedas manuales de revistas relevantes y libros de resúmenes de actas de congresos.
Búsqueda más reciente en el registro de ensayos del Grupo: 14 de octubre de 2016.
Criterios de selección
Ensayos controlados aleatorios (ECA) que comparan un único antibiótico antipseudomonas intravenoso con una combinación de ese antibiótico más un segundo antibiótico antipseudomonas en personas con FQ.
Obtención y análisis de los datos
Dos autores de la revisión, de forma independiente, evaluaron la calidad de los ensayos y extrajeron los datos.
Resultados principales
Se identificaron 45 ensayos, de los cuales se incluyeron ocho (356 participantes) que comparaban un único agente antipseudomonas con una combinación del mismo antibiótico y otro.
Hubo una amplia variación en los antibióticos individuales utilizados en cada ensayo. En total, los ensayos incluyeron siete comparaciones de un antibiótico betalactámico (relacionado con la penicilina o cefalosporina de tercera generación) con una combinación de betalactámico‐aminoglucósido y tres comparaciones de un aminoglucósido con una combinación de betalactámico‐aminoglucósido. Estos dos grupos de ensayos se analizaron como subgrupos separados.
Hubo una considerable heterogeneidad entre estos ensayos, lo que provocó dificultades en la realización de la revisión y la interpretación de los resultados. El metanálisis no mostró ninguna diferencia significativa entre la monoterapia y la terapia combinada, en lo que respecta a la función pulmonar, las puntuaciones de los síntomas, los efectos adversos y las medidas de los resultados bacteriológicos.
Estos resultados deben interpretarse con precaución. Seis de los ensayos incluidos se publicaron entre 1977 y 1988; se trataba de ensayos unicéntricos con fallos en el proceso de aleatorización y un tamaño de muestra pequeño. En conjunto, la calidad metodológica fue mala.
Conclusiones de los autores
Los resultados de esta revisión no son concluyentes. La revisión plantea importantes cuestiones metodológicas. Es necesario un ECA que debe estar bien diseñado en términos de asignación aleatoria adecuada, cegamiento, potencia y seguimiento a largo plazo. Es necesario estandarizar los resultados con un método coherente de presentación de informes, a fin de validar la agrupación de los resultados de múltiples ensayos.
PICOs
Resumen en términos sencillos
Una comparación de farmacoterapia intravenosas simples y combinadas para personas con fibrosis quística infectadas con Pseudomonas aeruginosa
Pregunta de la revisión
Se revisó la evidencia sobre los diferentes efectos del uso de un único antibiótico intravenoso (administrado directamente en una vena) en comparación con el uso de una combinación de antibióticos intravenosos en personas con fibrosis quística infectadas con Pseudomonas aeruginosa.
Antecedentes
La fibrosis quística es una enfermedad genética grave que afecta las células de las glándulas exocrinas (glándulas del sudor y otras). Las personas con fibrosis quística tienen un mayor riesgo de infecciones pulmonares crónicas, a menudo debido a la bacteria llamada Pseudomonas aeruginosa. Reciben antibióticos, ya sea un solo fármaco o una combinación de diferentes fármacos, por inyección para tratar estas infecciones. Tanto la elección del antibiótico como el uso de la terapia simple o combinada varían. Se buscaron ensayos controlados aleatorizados que compararan un único antibiótico intravenoso con una combinación de ese antibiótico más otro en personas con fibrosis quística. Esta es una versión actualizada de la revisión.
Fecha de la búsqueda
La evidencia está actualizada hasta: 14 de octubre de 2016.
Características de los estudios
Se incluyeron ocho ensayos con un total de 356 participantes. Seis de ellos se publicaron antes de 1988, cada una de ellos se realizó en un solo centro y utilizaban una serie de fármacos diferentes. Estos factores dificultaron la combinación y el análisis de los resultados.
Resultados clave
No se encontraron diferencias entre las dos terapias en cuanto a la función pulmonar, las puntuaciones de los síntomas, los efectos secundarios ni las medidas de los resultados bacteriológicos. Se concluye que no hay suficiente evidencia para comparar las diferentes terapias. Se necesitan más investigaciones, en particular sobre los efectos secundarios del tratamiento.
Calidad de la evidencia
Seis de los ensayos incluidos eran bastante antiguos (se publicaron entre 1977 y 1988). No incluían a muchas personas y tenían fallos en la forma en que las personas que participaban eran asignadas a los diferentes grupos de tratamiento. En general, la calidad del diseño de los ensayos era mala.
Authors' conclusions
Background
Description of the condition
Cystic fibrosis (CF) is the most common life‐limiting inherited disorder affecting white populations, with chronic, progressive lung disease being the major cause of morbidity and shortened survival. The continuous cycle of infection and inflammation is responsible for the severe airway damage and loss of respiratory function (Cantin 1995; Konstan 1997).
Recurrent infection, in particular with Pseudomonas aeruginosa (P aeruginosa) is the main feature of the lung involvement in CF. Administration of intravenous (IV) antibiotic therapy for a period of around two weeks is standard practice for treatment of pulmonary infections in most CF centres. Some studies have shown this approach to be effective in improving sputum colony counts (Regelmann 1990). Regular, elective IV therapy, as well as other interventions such as early treatment and cohorting have been shown to have a beneficial effect on the prevalence of P aeruginosa (Frederiksen 1999). However, this relationship was not demonstrated in a small study by Wolter (Wolter 1999). The inconsistency of these results suggests that the use of this therapy requires further evaluation.
Description of the intervention
Currently, treatment of chronic P aeruginosa infection in people with CF usually involves one of the following strategies. One approach is to use IV antibiotics to treat people with CF only when they become acutely unwell, on the grounds of clinical, radiological or pulmonary function parameters (subsequently referred to as symptomatic regimen). Alternatively, chronic infection may be treated with elective IV antibiotics at regular intervals (e.g. three‐monthly) (Hoiby 1993), to try to prevent long‐term deterioration (subsequently referred to as elective regimen). Trials using either of these strategies will be considered for this review, if the same strategy was used for treatment and comparison groups.
Choice of antibiotic, single or combined therapy and the duration of treatment are controversial areas in the treatment of infection with IV antibiotics in CF. Current practice in the UK is variable, with one study from 1993 showed 80% choosing a combination and 20% using monotherapy (Taylor 1993). However, more recently it was reported that monotherapy is now used in only 1 out of 23 centres in the UK who replied to a postal survey (Tan 2002).
How the intervention might work
Most centres perceive dual or combination IV antibiotic therapy in CF to be more effective than single therapy. It has been suggested that a clinic policy of using monotherapy with a beta‐lactam antibiotic may be responsible for the emergence of resistant strains of P aeruginosa (Cheng 1996). Use of a beta‐lactam alone offers advantages for the individual because of ease of administration and avoidance of the need to measure aminoglycoside levels.
Why it is important to do this review
Intravenous antibiotic therapy may have contributed to improved survival among people with CF; however, the multiple use of potent and highly selective antibiotics may increase the likelihood of adverse effects and lead to the development of resistant strains of organisms (Levy 1998). This version of the review is an update of previous review versions (Elphick 2002; Elphick 2005; Elphick 2014).
Objectives
1. To assess the effectiveness of single compared to combination IV anti‐pseudomonal antibiotic therapy in the treatment of people with CF.
2. To assess whether the use of combination IV anti‐pseudomonal antibiotic therapy leads to an increase in adverse effects or the development of resistant strains of organisms in CF.
Methods
Criteria for considering studies for this review
Types of studies
Randomised controlled trials. Trials in which individuals are treated according to a symptomatic or an elective regimen (see above) were included if the only difference between the treatment and comparison group is whether the participants receive single or combination antibiotic therapy. Trials where quasi‐randomisation methods such as alternation were used were included, when there was sufficient evidence that the treatment and comparison groups were comparable in terms of clinical status.
Types of participants
Children and adults with defined CF diagnosed clinically and by sweat or genetic testing including all ages and all degrees of severity.
Types of interventions
Any single IV anti‐pseudomonal antibiotic compared to a combination of two or more IV anti‐pseudomonal antibiotics. Trials comparing a single anti‐pseudomonal agent to a combination of the same antibiotic and one other anti‐pseudomonal agent (drug A versus drug A plus drug B) were included. Trials which compared a single anti‐pseudomonal antibiotic agent with a combination of two further anti‐pseudomonal antibiotics (drug A versus drug B plus drug C) were not included.
Types of outcome measures
We aimed to assess whether a combination of IV anti‐pseudomonal antibiotics is more effective than a single IV anti‐pseudomonal antibiotic for the following outcomes:
-
subjective improvement;
-
clinical improvement;
-
bacteriological improvement;
-
adverse effects.
Short‐term results
(i.e. at end of course of antibiotics)
Primary outcomes
-
Clinical improvement
-
improvement in spirometric lung function (e.g. forced expiratory volume in one second (FEV1) and forced vital capacity (FVC))
-
-
Bacteriological improvement
-
improvement in quantitative bacteriology of sputum
-
-
Adverse effects to antibiotics, e.g. renal and auditory impairment, serum sickness and sensitivity reactions
Secondary outcomes
-
Subjective improvement
-
quality of life assessment, in terms of measures of the individual's well‐being
-
-
Clinical improvement
-
nutritional status as noted by weight gain, body mass index, z score or other indices of nutritional state
-
additional treatment required
-
duration of hospitalisation
-
time to next course of IV antibiotics
-
chest X‐ray (CXR) scores
-
improvement in symptoms
-
-
Bacteriological improvement
-
Changes in inflammatory markers (in sputum or blood)
-
Long‐term results
(measured at 6 to 12 months after course of antibiotics; if long‐term outcomes are measured at other time intervals, consideration will be given to these also)
Primary outcomes
-
Clinical improvement
-
prevention of deterioration of lung function
-
-
Bacteriological change
-
development of antibiotic‐resistant strains ofP aeruginosa and other organisms
-
-
Adverse effects to antibiotics, e.g. renal and auditory impairment, serum sickness and sensitivity reactions
Secondary outcomes
-
Subjective improvement
-
quality of life assessment
-
-
Clinical improvement
-
number of courses of IV antibiotics in the following year
-
Search methods for identification of studies
Relevant trials were identified from the Group's Cystic Fibrosis Trials Register using the terms: antibiotics AND intravenous.
The Cystic Fibrosis Trials Register is compiled from electronic searches of the Cochrane Central Register of Controlled Trials (Clinical Trials) (updated each new issue of the Cochrane Library), weekly searches of MEDLINE, a search of Embase to 1995 and the prospective handsearching of two journals ‐ Pediatric Pulmonology and the Journal of Cystic Fibrosis. Unpublished work is identified by searching the abstract books of three major cystic fibrosis conferences: the International Cystic Fibrosis Conference; the European Cystic Fibrosis Conference and the North American Cystic Fibrosis Conference. For full details of all searching activities for the register, please see the relevant sections of the Cystic Fibrosis and Genetic Disorders Group Module.
Date of the most recent search of the Group's CF Trials Register: 14 October 2016.
Data collection and analysis
Selection of studies
Two authors from different centres independently reviewed all trials to select which were to be included in the review. If disagreement arose on the suitability of a trial for inclusion in the review, the authors reached a consensus by discussion.
Data extraction and management
Each author independently extracted data using standard data acquisition forms. If disagreement arose on the quality of a trial, the authors reached a consensus by discussion.
If there had been sufficient numbers of trials using quasi‐randomisation methods, then the authors would have analysed this group separately.
The authors grouped data into short‐term results and long‐term results. They defined short‐term results as those at the end of the course of antibiotics; they considered long‐term results to be 6 to 12 months after the course of antibiotics. The authors will also consider other time intervals for long‐term outcomes if these are reported.
For binary outcome measures the authors recorded the number of events and the number of participants for each group. For continuous outcomes, the authors recorded either the mean change from baseline for each group or mean post‐treatment or intervention values and the standard deviation or standard error for each group.
Assessment of risk of bias in included studies
In order to establish a risk of bias for each trial, the authors independently assessed the methodological quality of each trial. In particular, authors examined details of the randomisation method (generation and concealment of allocation), the degree of blinding in the trial, whether intention‐to‐treat analyses were possible from the available data and if the investigators recorded the number of participants lost to follow up or subsequently excluded from the trial.
Measures of treatment effect
For binary outcome measures, the authors calculated a pooled estimate of the treatment effect for each outcome across trials using the Peto odds ratio with 95% confidence intervals (CIs) where appropriate. For continuous outcomes, the authors calculated a pooled estimate of treatment effect by calculating the mean difference with 95% CIs.
Unit of analysis issues
One trial included in the review was of cross‐over design (Pedersen 1986). Ideally when conducting a meta‐analysis combining results from cross‐over trials the authors would have liked to use the inverse variance methods that are recommended by Elbourne (Elbourne 2002). However, due to restrictions on the data that were available from the included trial, the only method that they have been able to use was to treat the cross‐over trial as if it was a parallel trial (assuming a correlation of zero as the most conservative estimate). Elbourne says that this approach produces conservative results as it does not take into account within‐patient correlation (Elbourne 2002). Also each participant appears in both the treatment and control group, so the two groups are not independent.
Dealing with missing data
In order to allow an intention‐to‐treat analysis, the authors collected data on the number of participants with each outcome event by allocated treatment group, irrespective of compliance and whether or not the participant was later thought to be ineligible or otherwise excluded from treatment or follow up.
Assessment of heterogeneity
The authors tested for heterogeneity between trial results using a standard Chi2 test.
Data synthesis
The authors analysed the data using a fixed‐effect model. In future updates, if they identify a moderate to high degree of heterogeneity, they plan to analyse the data using a random‐effects model.
Subgroup analysis and investigation of heterogeneity
If there were sufficient trials, the authors planned to carry out subgroup analyses of adults separately from children; of participants on a symptomatic regimen separately from those on an elective regimen; and also of those who were colonised with P aeruginosa (i.e. those people with CF who are sputum positive on three consecutive occasions) separately from those who were not colonised.
Sensitivity analysis
The authors planned to perform a sensitivity analysis based on the methodological quality of the trials.
Results
Description of studies
Results of the search
A total of 45 trials were identified by the searches. No trials were found through contact with pharmaceutical companies. We included eight trials in the review and excluded 37 trials.
Included studies
Eight trials (including 356 participants) were included in this review; of these three were published only as abstracts from conference proceedings (Costantini 1982; Huang 1982; Master 1997).
Seven trials were stated to be randomised controlled trials (Costantini 1982; Huang 1982; Master 1997; McCarty 1988; McLauglin 1983; Pedersen 1986; Smith 1999). The method of randomisation was stated in only one of these, in which it was described as "computer‐generated" (Smith 1999). In the remaining trial, treatment was assigned as an alternate allocation with good evidence of similar groups at baseline (Parry 1977). This trial was included as a quasi‐randomised trial.
In seven of the eight trials, participants were included during an exacerbation of symptoms (symptomatic regimen) in a parallel group design (Costantini 1982; Huang 1982; Master 1997; McCarty 1988; McLauglin 1983; Parry 1977; Smith 1999). In the remaining trial, participants were treated using a three‐monthly elective regimen and were re‐entered into the trial during consecutive courses of antibiotics in a cross‐over design (Pedersen 1986). In five of the trials, evidence of P aeruginosa in the sputum was an inclusion requirement (Costantini 1982; Master 1997; Parry 1977; Pedersen 1986; Smith 1999); of the remaining three trials, one stated that 98% had P aeruginosa (McLauglin 1983).
Criteria for diagnosis of CF were stated in only one of the eight trials (Smith 1999). Sample sizes varied from 14 to 83 participants, with a total of 356 participants recruited. All trials either stated that they included both adults and children, or did not state the age range. No trial looked at the effects of single versus combination antibiotic therapy in children alone. One trial included 17 children, but included three children twice, giving a total of 20 treatment courses (McCarty 1988).
There was a wide variation in the individual antibiotics used in each trial (seePublished notes: Description of pharmacological properties of antibiotics used). Two trials made two comparisons, therefore, in total, the eight trials included seven comparisons of a beta‐lactam antibiotic (penicillin‐related or third generation cephalosporin) to a beta‐lactam‐aminoglycoside combination and three comparisons of an aminoglycoside to a beta‐lactam‐aminoglycoside combination. These two groups of trials were analysed as separate subgroups.
Two trials compared two single agents with the combination of the same two antibiotics: carbenicillin versus sisomycin versus carbenicillin and sisomycin (Costantini 1982); ticarcillin versus gentamicin versus ticarcillin and gentamicin (Parry 1977). One other trial looked at an aminoglycoside as the single agent: tobramycin versus tobramycin and ceftazidime (Master 1997). Of the remaining five trials, one studied ceftazidime as the single agent (ceftazidime and tobramycin (Pedersen 1986)) and the remaining four compared an agent from the penicillin group of antibiotics: piperacillin (McCarty 1988); ticarcillin (Huang 1982); azlocillin (McLauglin 1983; Smith 1999) with a combination of that agent with tobramycin.
Outcomes were studied at the end of the treatment course in all trials. Treatment duration varied from 10 to 14 days. Three trials included a follow‐up period, which varied from two to eight weeks (McLauglin 1983; Smith 1999) to six months for the cross‐over trial (Pedersen 1986).
Excluded studies
A total of 37 trials were excluded. Eleven trials compared a single antibiotic agent with the existing combination of two other antibiotics (drug A versus drug B plus drug C) (Balsamo 1986; Beaudry 1980; Bosso 1988; Church 1997; De Boeck 1989; De Boeck 1999; Gold 1985; Jewett 1985; Permin 1983; Stack 1985; Wesley 1988). Fourteen trials compared different dosage regimens of the same antibiotic (Adeboyeku 2011; Al‐Ansari 2006; Aminimanizani 2002; Beringer 2012; Conway 1997; Hubert 2009; Keel 2011; McCabe 2013; Prayle 2013; Noah 2010; Riethmueller 2009; Semykin 2010; Turner 2013; Whitehead 2002). One trial was excluded as it compared two single drugs (Levy 1982) and another trial as it compared two different combinations of antibiotics (Blumer 2005). One trial compared intravenous antibiotics administered in hospital compared to at home (Donati 1987) and another trial looked at an eradication regimen (Kenny 2009). Five further trials were excluded as allocation was not by randomisation and because there were marked differences in baseline characteristics between the treatment and comparison groups (Hoogkamp 1983; Hyatt 1981; Krause 1979; Nelson 1985; Roberts 1993). Two trials were excluded as they evaluated tools to assess treatment response (Hatziagorou 2013; Kuni 1992).
One trial included 30 participants. However, 17 of these received more than one course of treatment (Padoan 1987). In total, 40 courses of treatment took place (20 in each intervention group). The trial was cross‐over in design; but re‐randomisation took place between courses of treatment, resulting in some participants possibly receiving two or more courses of the same treatment, or a mixture of different treatments. Since the number of participants receiving each treatment was unclear, results could not be included in the analysis of this review and therefore the trial was excluded. Individual patient data are being requested from the authors of this trial so that data from this trial may be included in future updates (Padoan 1987).
Risk of bias in included studies
In order to assess the risk of bias in the trials, the methodological quality of each trial was assessed using criteria described by Schulz (Schulz 1995). For each trial the following were assessed: concealment of allocation schedule; generation of allocation sequences; inclusion in the analysis of all randomised participants; and double‐blinding.
Allocation
One trial stated that treatment was allocated to participants using a computer‐generated randomisation (Smith 1999); and one trial was stratified for age and disease severity during randomisation (Master 1997). We assessed these trials as having a low risk of bias. Five trials stated that allocation was randomised, but did not specify the method of generation, so we rated the risk of bias in each of these as unclear (Costantini 1982; Huang 1982; McCarty 1988; McLauglin 1983; Pedersen 1986). One trial used alternation but does not discuss how the first participant was randomised to their treatment group and we assessed this as inadequate, thus having a high risk of bias (Parry 1977).
Four trials were assessed as adequate, Master stated that the code was only broken on completion of the study (Master 1997); another trial stated they used sequentially numbered envelopes (McCarty 1988); a further trial employed sealed envelopes prepared by pharmacy (McLauglin 1983); and the fourth trial stated central randomisation (Smith 1999). We judged these trials to have a low risk of bias. We assessed one trial as inadequate, since the investigators used alternate allocation and so we judged this to have a high risk of bias (Parry 1977). We included this trial as a quasi‐randomised trial. In the remaining three trials the method of allocation concealment was unclear and so we judged these to have an unclear risk of bias (Costantini 1982; Huang 1982; Pedersen 1986).
Blinding
Five of the trials were described as double‐blinded (Huang 1982; Master 1997; McLauglin 1983; Smith 1999). In each trial, saline was used for the placebo injection. We judged these trials to have a low risk of bias. One trial did not explicitly state that blinding had taken place, but did state that both interventions were given with the same volume and in the same way, so it can be assumed that there was some degree of blinding leading to a low risk of bias (Pedersen 1986). Two further trials stated that no blinding had taken place, thus we deemed these to have a potential risk of bias (McCarty 1988; Parry 1977); and in the remaining trial it was not clear whether blinding had taken place and we judge this to have an unclear risk of bias (Costantini 1982).
Incomplete outcome data
An intention‐to‐treat analysis was not stated in any of the included trials. In four, however, there appeared to be no withdrawals (Costantini 1982; Huang 1982; McCarty 1988; Parry 1977). In one trial, seven of the 41 participants did not complete the trial, six from the single therapy group and one from the combination group (reasons given) (McLauglin 1983) and another described reasons why three participants out of a cohort of 20 withdrew (Pedersen 1986). One trial published a flow chart showing numbers randomized and included or excluded (with reasons) at each stage in paper (Master 1997). A further trial gave the numbers and reasons for withdrawals in a table (Smith 1999).
Effects of interventions
Only those primary and secondary outcomes of this review, which were reported within the included studies, are listed below. No trial included follow up for longer than six months.
Single compared to combination therapy
Pooling of results was difficult because of missing data, differences in method of expression of the results and missing standard deviations.
Primary outcomes
1. Clinical improvement
a. Effect on lung function
Seven of the eight trials included lung function as an outcome measure. However, there was great variety between the trials in the tests used, the time at measurement and the method of expression of the results.
Although the outcome measure given in our protocol was improvement in spirometric lung function, no trial included these data. Two trials measured mean FEV1 and FVC at the end of the treatment course, expressed as per cent predicted (McLauglin 1983; Smith 1999). These trials were randomised and gave baseline data, clearly stating that there was no significant difference between the single and combination treatment groups at baseline. We therefore analysed these outcomes.
One trial did compare mean change in FEV1 and FVC, expressed as per cent predicted, but did not include standard deviations (SD) in the results, so we could not include the data (Master 1997). No data were given in a further three trials (Huang 1982; McCarty 1988; Parry 1977) and one trial expressed the results in terms of a median and range (Pedersen 1986).
There were no significant differences between the single and combination treatment groups in the lung function parameters, which we were able to include.
b. Effect on clinical scores
Measures of change in clinical status were used in most trials. In all but two, either no data or measure of variance were given. One trial measured mean Schwachman score at the end of treatment (McLauglin 1983). This was a randomised trial with no significant difference between the groups at baseline. There was no significant difference between single and combination groups for this parameter.
2. Bacteriological improvement
a. Effect on sputum bacteriology
One trial reported change in sputum P aeruginosa density in colony forming units per gram (cfu/g) (Smith 1999). This trial showed a significant decrease in P aeruginosa density in both treatment groups, at the end of treatment, with a greater decrease in the combination group. The mean difference in the mean change in density was ‐1.60 (95% confidence interval (CI) ‐9.51 to 6.31), i.e. the mean decrease in P aeruginosa density was 1.6 cfu/g greater in the combination treatment group than for the single treatment group. However, on follow up, the density of P aeruginosa in the sputum was similar in both groups.
3. Effect on adverse events
Three trials reported adverse events (Master 1997; McCarty 1988; Smith 1999). The most commonly reported were: local erythema at the injection site; generalised rash; fever; renal impairment and proteinuria; auditory impairment; and hypersensitivity reaction, with no differences found between treatment groups.
Secondary outcomes
2. Clinical improvement
c. Hospitalisation
Two trials measured the number of participants readmitted to hospital within given time periods of one month (Huang 1982) and 80 days (Smith 1999). Huang found no significant difference between the two groups (Huang 1982). The results from the Smith trial favoured combination therapy with a Peto odds ratio of 0.30 (95% CI 0.12 to 0.73) (Smith 1999).
d. Effect on time to next course of antibiotics
Only one trial reported the effect on the time to next course of antibiotics (McLauglin 1983). There was no significant difference between the two groups.
3. Bacteriological improvement
a. Effect on inflammatory markers
One trial reported blood or sputum markers of inflammation (Smith 1999). This trial reported mean white blood cell (WBC) count at the end of the antibiotic course and involved treatment groups with similar baseline characteristics. There was no significant difference between the groups.
b. Effect on antibiotic resistant strains of P aeruginosa
Six of the eight trials examined sputum for drug sensitivity at the beginning of the trial; five of these defined sensitivity in terms of minimum inhibitory concentration (MIC). One trial found that the disc diffusion method did not identify resistant strains (Smith 1999). The trials varied in their definitions of resistance, e.g. resistance to tobramycin was defined as MIC greater than 8 μg/ml in one trial (McLauglin 1983) and as MIC greater than 32 μg/ml in another (Master 1997). No trial used antibiotic sensitivity in their entry criteria. In one trial, the bacteria were clearly sensitive to the antibiotics used (Pedersen 1986). This trial gave mean MIC values at baseline and the end of the treatment course and found no significant change. Parry stated MIC values for all the isolates for ticarcillin and carbenicillin, but did not define antibiotic resistance (Parry 1977). This trial found that the median MIC value for ticarcillin at the end of treatment was same as the pre‐treatment value (3.1 μg/ml). One further trial stated that there was no significant difference between the single and combination groups at the beginning of the treatment period, and that emergence of resistance was not seen with any isolate (McCarty 1988). The two remaining trials gave the number or per cent of bacterial sensitivity, but did not comment on whether the two groups were significantly different at baseline (Costantini 1982; Huang 1982).
In the two trials included in the analysis, the number of participants developing resistant strains of P aeruginosa at baseline, end of treatment and follow up at between two and eight weeks was reported (McLauglin 1983; Smith 1999). For completeness, we have shown each of these analyses on the forest plot, as well as the difference between baseline and follow up in two of the trials. The second trial could not be represented in the latter analysis, as the total numbers of participants changed from baseline to follow up (Smith 1999). McLaughlin classified bacteria as resistant to tobramycin if the MIC was greater than 8 μg/ml and to azlocillin if the MIC was greater than 125 μg/ml (McLauglin 1983). Smith defined resistance to tobramycin if the MIC was greater than 8 μg/ml and for azlocillin, if the MIC was greater than 100 μg/ml (Smith 1999).
The result of the analysis showed that the difference between the single and combination therapy groups was not significant at baseline or at the end of the treatment course. At two to eight weeks follow up, both trials individually showed an increase in the number of participants with resistant strains of P aeruginosa with single therapy, but the aggregated results showed that the difference was not significant. However, the aggregation of the studies at follow up included a relatively small number of participants, with a total of 40 participants in each group. Calculation of the difference between the numbers of participants with resistant strains from baseline to two to eight weeks post‐treatment also favoured combination treatment, although the difference was not significant.
Symptomatic compared to elective regimen
One trial studied outcomes at the end of an elective course of antibiotics and again after a second course three months later, using a cross‐over design (Pedersen 1986). Results were expressed as median and range in all outcomes and therefore meta‐analysis using RevMan within this review was not possible.
Beta‐lactam versus beta‐lactam‐aminoglycoside combination compared to aminoglycoside versus beta‐lactam‐aminoglycoside combination
Insufficient data on outcome measures were given in all of the three comparisons of aminoglycoside with aminoglycoside‐beta‐lactam combination therapy and therefore meta‐analysis using RevMan within this review was not possible (Costantini 1982; Master 1997; Parry 1977).
Discussion
Choice of anti‐pseudomonal antibiotic and the use of single or combined therapy are controversial areas in the treatment of respiratory infection in cystic fibrosis (CF). Current practice is variable. Advantages of combination therapy include a wider range of modes of action, possible synergy and reduction of resistant organisms; whereas advantages of monotherapy include lower cost and reduction of drug‐related toxicity. From the perspective of the individual with CF, the use of a beta‐lactam alone offers such advantages as ease of administration and no requirement for blood sampling to measure aminoglycoside levels. Current evidence does not provide a clear answer and, therefore, the use of intravenous (IV) antibiotic therapy in CF requires further evaluation.
This review has found eight trials that examined the effect of single compared to combination IV anti‐pseudomonal antibiotic therapy for acute exacerbations in CF. There was considerable heterogeneity amongst these trials, which led to difficulties in performing the review and interpreting the results. We were unable to perform adequate meta‐analysis for most outcome measures. The overall results showed that there was no significant difference between monotherapy and combination therapy in terms of clinical outcome measures, such as lung function and symptom scores, or in terms of bacteriological outcomes.
These results should be interpreted with caution. All but two of the included trials were published between 1977 and 1988; these were single‐centre trials with flaws in the randomisation process. Furthermore, the sample sizes were too small to have the power to detect a difference between the two groups. Three of the eight trials were not published as full papers. Overall, the methodological quality was poor: only one trial was considered to have adequate randomisation allocation and concealment (Smith 1999); only four were double‐blinded; and none stated any intention‐to‐treat analysis. The review raises some interesting methodological issues, including the difficulties of pooling results from a number of small trials that are of poor quality.
The trials were very heterogeneous in terms of design, drugs used, duration of treatment and follow up and outcome measures. The combinations of antibiotics in each trial were different and therefore we aggregated the two groups according to the class of antibiotics: beta‐lactams and aminoglycosides. Inconsistencies in expression of results and statistical reporting made meta‐analysis impossible in most cases and individual patient data would need to be collected from authors to clarify these issues. It was disappointing that only four trials included data that were possible to analyse. Most of the outcome measures analysed included data from only one or two trials. Due to the small number of trials, it was not possible to examine for effects of trial quality, type of antibiotic or treatment regimen using sensitivity and subgroup analyses.
In our protocol we stated that we would like to compare the differences between adults and children. This was not possible, as no trial looked at children alone. No trial looked specifically at quality of life scores. There were no long‐term outcome measures such as the development of resistant bacterial strains or side effects, such as ototoxicity to aminoglycosides. This may be relevant particularly to children, in whom there is emerging evidence of ototoxicity due to chronic use of aminoglycosides (Katbamna 1998; Mulherin 1991). Only four trials stated that they had looked for adverse effects; therefore there may have been side effects that have not been identified. The longest follow up in this systematic review was six months, but the majority of trials did not have any follow up after the acute course of antibiotics. Potential problems with development of drug‐resistant bacteria, which may shorten long‐term survival, may not be detected in trials of such short duration covered by this review.
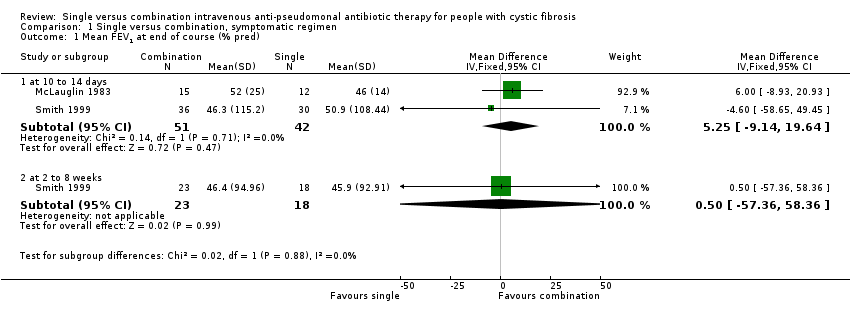
Comparison 1 Single versus combination, symptomatic regimen, Outcome 1 Mean FEV1 at end of course (% pred).

Comparison 1 Single versus combination, symptomatic regimen, Outcome 2 Mean FVC at end of course (% pred).
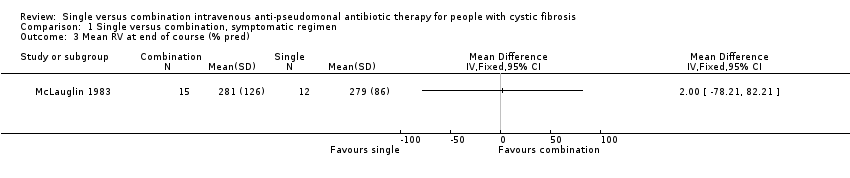
Comparison 1 Single versus combination, symptomatic regimen, Outcome 3 Mean RV at end of course (% pred).

Comparison 1 Single versus combination, symptomatic regimen, Outcome 4 Mean TLC at end of course (% pred).
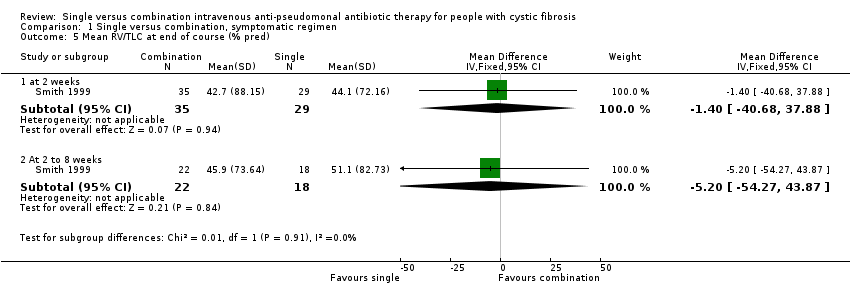
Comparison 1 Single versus combination, symptomatic regimen, Outcome 5 Mean RV/TLC at end of course (% pred).

Comparison 1 Single versus combination, symptomatic regimen, Outcome 6 Mean PFR at end of course (% pred).

Comparison 1 Single versus combination, symptomatic regimen, Outcome 7 Mean MMEF at end of course (% pred).
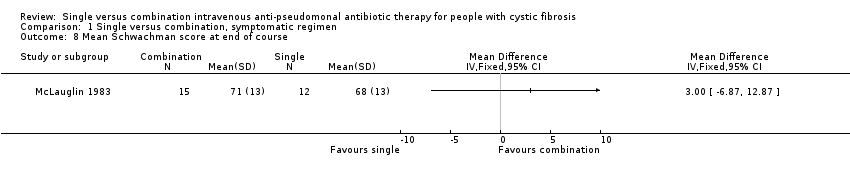
Comparison 1 Single versus combination, symptomatic regimen, Outcome 8 Mean Schwachman score at end of course.

Comparison 1 Single versus combination, symptomatic regimen, Outcome 9 Number of Pseudomonas isolates eradicated at end of course.

Comparison 1 Single versus combination, symptomatic regimen, Outcome 10 Mean change Pseudomonas density in cfu/g at end of course.

Comparison 1 Single versus combination, symptomatic regimen, Outcome 11 Number adverse events.

Comparison 1 Single versus combination, symptomatic regimen, Outcome 12 Number readmitted.

Comparison 1 Single versus combination, symptomatic regimen, Outcome 13 Mean time to next course of antibiotics (weeks).
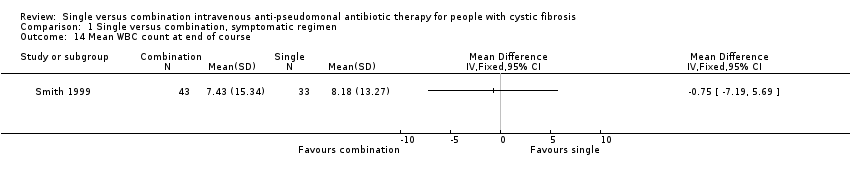
Comparison 1 Single versus combination, symptomatic regimen, Outcome 14 Mean WBC count at end of course.

Comparison 1 Single versus combination, symptomatic regimen, Outcome 15 Number resistant strains.
| Outcome or subgroup title | No. of studies | No. of participants | Statistical method | Effect size |
| 1 Mean FEV1 at end of course (% pred) Show forest plot | 2 | Mean Difference (IV, Fixed, 95% CI) | Subtotals only | |
| 1.1 at 10 to 14 days | 2 | 93 | Mean Difference (IV, Fixed, 95% CI) | 5.25 [‐9.14, 19.64] |
| 1.2 at 2 to 8 weeks | 1 | 41 | Mean Difference (IV, Fixed, 95% CI) | 0.5 [‐57.36, 58.36] |
| 2 Mean FVC at end of course (% pred) Show forest plot | 2 | Mean Difference (IV, Fixed, 95% CI) | Subtotals only | |
| 2.1 at 10 to 14 days | 2 | 93 | Mean Difference (IV, Fixed, 95% CI) | 1.84 [‐11.44, 15.12] |
| 2.2 at 2 to 8 weeks | 1 | 41 | Mean Difference (IV, Fixed, 95% CI) | 6.90 [‐50.50, 64.30] |
| 3 Mean RV at end of course (% pred) Show forest plot | 1 | Mean Difference (IV, Fixed, 95% CI) | Totals not selected | |
| 4 Mean TLC at end of course (% pred) Show forest plot | 1 | Mean Difference (IV, Fixed, 95% CI) | Totals not selected | |
| 5 Mean RV/TLC at end of course (% pred) Show forest plot | 1 | Mean Difference (IV, Fixed, 95% CI) | Subtotals only | |
| 5.1 at 2 weeks | 1 | 64 | Mean Difference (IV, Fixed, 95% CI) | ‐1.40 [‐40.68, 37.88] |
| 5.2 At 2 to 8 weeks | 1 | 40 | Mean Difference (IV, Fixed, 95% CI) | ‐5.20 [‐54.27, 43.87] |
| 6 Mean PFR at end of course (% pred) Show forest plot | 2 | Mean Difference (IV, Fixed, 95% CI) | Subtotals only | |
| 6.1 at 10 to 14 days | 2 | 91 | Mean Difference (IV, Fixed, 95% CI) | 3.21 [‐11.49, 17.91] |
| 6.2 At 2 to 8 weeks | 1 | 40 | Mean Difference (IV, Fixed, 95% CI) | 2.30 [‐60.90, 65.50] |
| 7 Mean MMEF at end of course (% pred) Show forest plot | 2 | Mean Difference (IV, Fixed, 95% CI) | Subtotals only | |
| 7.1 at 10 to 14 days | 2 | 91 | Mean Difference (IV, Fixed, 95% CI) | 7.17 [‐8.22, 22.55] |
| 7.2 At 2 to 8 weeks | 1 | 40 | Mean Difference (IV, Fixed, 95% CI) | ‐1.90 [‐73.27, 69.47] |
| 8 Mean Schwachman score at end of course Show forest plot | 1 | Mean Difference (IV, Fixed, 95% CI) | Totals not selected | |
| 9 Number of Pseudomonas isolates eradicated at end of course Show forest plot | 3 | 72 | Peto Odds Ratio (Peto, Fixed, 95% CI) | 5.63 [2.12, 14.94] |
| 10 Mean change Pseudomonas density in cfu/g at end of course Show forest plot | 1 | Mean Difference (IV, Fixed, 95% CI) | Totals not selected | |
| 11 Number adverse events Show forest plot | 2 | Peto Odds Ratio (Peto, Fixed, 95% CI) | Subtotals only | |
| 11.1 local erythema / irritation | 2 | 131 | Peto Odds Ratio (Peto, Fixed, 95% CI) | 0.46 [0.09, 2.36] |
| 11.2 generalised rash | 1 | 20 | Peto Odds Ratio (Peto, Fixed, 95% CI) | 6.16 [0.12, 316.67] |
| 11.3 fever | 1 | 20 | Peto Odds Ratio (Peto, Fixed, 95% CI) | 0.81 [0.05, 14.14] |
| 11.4 renal impairment (increased creatinine by 50%) | 1 | 80 | Peto Odds Ratio (Peto, Fixed, 95% CI) | 1.54 [0.15, 15.56] |
| 11.5 auditory impairment | 1 | 76 | Peto Odds Ratio (Peto, Fixed, 95% CI) | 5.86 [0.11, 305.44] |
| 11.6 proteinuria | 1 | 63 | Peto Odds Ratio (Peto, Fixed, 95% CI) | 3.62 [0.68, 19.30] |
| 12 Number readmitted Show forest plot | 2 | Peto Odds Ratio (Peto, Fixed, 95% CI) | Subtotals only | |
| 12.1 in 1 month | 1 | 16 | Peto Odds Ratio (Peto, Fixed, 95% CI) | 0.14 [0.01, 1.30] |
| 12.2 in 80 days | 1 | 76 | Peto Odds Ratio (Peto, Fixed, 95% CI) | 0.30 [0.12, 0.73] |
| 13 Mean time to next course of antibiotics (weeks) Show forest plot | 1 | Mean Difference (IV, Fixed, 95% CI) | Totals not selected | |
| 14 Mean WBC count at end of course Show forest plot | 1 | Mean Difference (IV, Fixed, 95% CI) | Totals not selected | |
| 15 Number resistant strains Show forest plot | 2 | Peto Odds Ratio (Peto, Fixed, 95% CI) | Subtotals only | |
| 15.1 at baseline | 2 | 140 | Peto Odds Ratio (Peto, Fixed, 95% CI) | 0.83 [0.38, 1.82] |
| 15.2 at end of course | 2 | 99 | Peto Odds Ratio (Peto, Fixed, 95% CI) | 2.44 [0.94, 6.32] |
| 15.3 at 2 to 8 weeks | 2 | 76 | Peto Odds Ratio (Peto, Fixed, 95% CI) | 0.44 [0.17, 1.14] |
| 15.4 Difference between baseline and 2 to 8 weeks | 1 | 29 | Peto Odds Ratio (Peto, Fixed, 95% CI) | 0.27 [0.06, 1.18] |