| 1 Mean FEV1 at end of course (% pred) Show forest plot | 2 | | Mean Difference (IV, Fixed, 95% CI) | Subtotals only |
|
| 1.1 at 10 to 14 days | 2 | 93 | Mean Difference (IV, Fixed, 95% CI) | 5.25 [‐9.14, 19.64] |
| 1.2 at 2 to 8 weeks | 1 | 41 | Mean Difference (IV, Fixed, 95% CI) | 0.5 [‐57.36, 58.36] |
| 2 Mean FVC at end of course (% pred) Show forest plot | 2 | | Mean Difference (IV, Fixed, 95% CI) | Subtotals only |
|
| 2.1 at 10 to 14 days | 2 | 93 | Mean Difference (IV, Fixed, 95% CI) | 1.84 [‐11.44, 15.12] |
| 2.2 at 2 to 8 weeks | 1 | 41 | Mean Difference (IV, Fixed, 95% CI) | 6.90 [‐50.50, 64.30] |
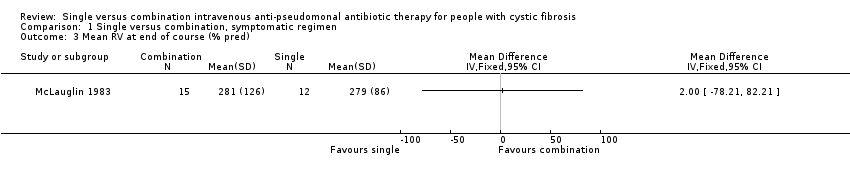
| 3 Mean RV at end of course (% pred) Show forest plot | 1 | | Mean Difference (IV, Fixed, 95% CI) | Totals not selected |
|
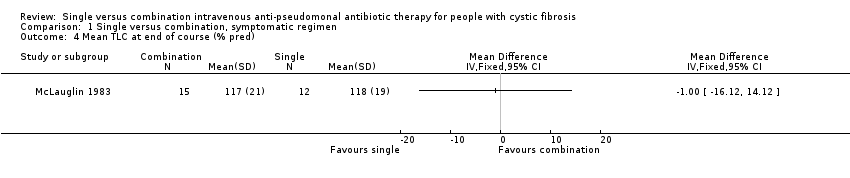
| 4 Mean TLC at end of course (% pred) Show forest plot | 1 | | Mean Difference (IV, Fixed, 95% CI) | Totals not selected |
|
| 5 Mean RV/TLC at end of course (% pred) Show forest plot | 1 | | Mean Difference (IV, Fixed, 95% CI) | Subtotals only |
|
| 5.1 at 2 weeks | 1 | 64 | Mean Difference (IV, Fixed, 95% CI) | ‐1.40 [‐40.68, 37.88] |
| 5.2 At 2 to 8 weeks | 1 | 40 | Mean Difference (IV, Fixed, 95% CI) | ‐5.20 [‐54.27, 43.87] |
| 6 Mean PFR at end of course (% pred) Show forest plot | 2 | | Mean Difference (IV, Fixed, 95% CI) | Subtotals only |
|
| 6.1 at 10 to 14 days | 2 | 91 | Mean Difference (IV, Fixed, 95% CI) | 3.21 [‐11.49, 17.91] |
| 6.2 At 2 to 8 weeks | 1 | 40 | Mean Difference (IV, Fixed, 95% CI) | 2.30 [‐60.90, 65.50] |
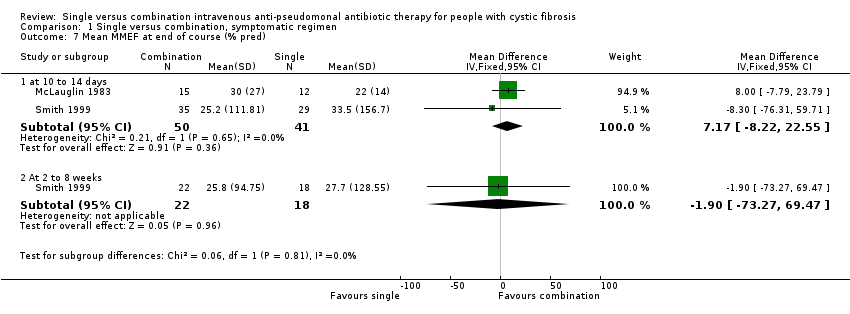
| 7 Mean MMEF at end of course (% pred) Show forest plot | 2 | | Mean Difference (IV, Fixed, 95% CI) | Subtotals only |
|
| 7.1 at 10 to 14 days | 2 | 91 | Mean Difference (IV, Fixed, 95% CI) | 7.17 [‐8.22, 22.55] |
| 7.2 At 2 to 8 weeks | 1 | 40 | Mean Difference (IV, Fixed, 95% CI) | ‐1.90 [‐73.27, 69.47] |
| 8 Mean Schwachman score at end of course Show forest plot | 1 | | Mean Difference (IV, Fixed, 95% CI) | Totals not selected |
|
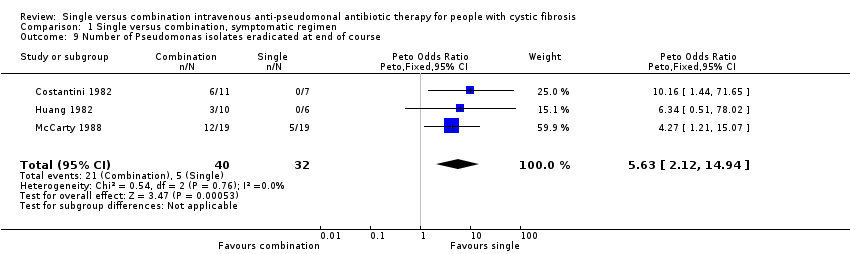
| 9 Number of Pseudomonas isolates eradicated at end of course Show forest plot | 3 | 72 | Peto Odds Ratio (Peto, Fixed, 95% CI) | 5.63 [2.12, 14.94] |
|
| 10 Mean change Pseudomonas density in cfu/g at end of course Show forest plot | 1 | | Mean Difference (IV, Fixed, 95% CI) | Totals not selected |
|
| 11 Number adverse events Show forest plot | 2 | | Peto Odds Ratio (Peto, Fixed, 95% CI) | Subtotals only |
|
| 11.1 local erythema / irritation | 2 | 131 | Peto Odds Ratio (Peto, Fixed, 95% CI) | 0.46 [0.09, 2.36] |
| 11.2 generalised rash | 1 | 20 | Peto Odds Ratio (Peto, Fixed, 95% CI) | 6.16 [0.12, 316.67] |
| 11.3 fever | 1 | 20 | Peto Odds Ratio (Peto, Fixed, 95% CI) | 0.81 [0.05, 14.14] |
| 11.4 renal impairment (increased creatinine by 50%) | 1 | 80 | Peto Odds Ratio (Peto, Fixed, 95% CI) | 1.54 [0.15, 15.56] |
| 11.5 auditory impairment | 1 | 76 | Peto Odds Ratio (Peto, Fixed, 95% CI) | 5.86 [0.11, 305.44] |
| 11.6 proteinuria | 1 | 63 | Peto Odds Ratio (Peto, Fixed, 95% CI) | 3.62 [0.68, 19.30] |
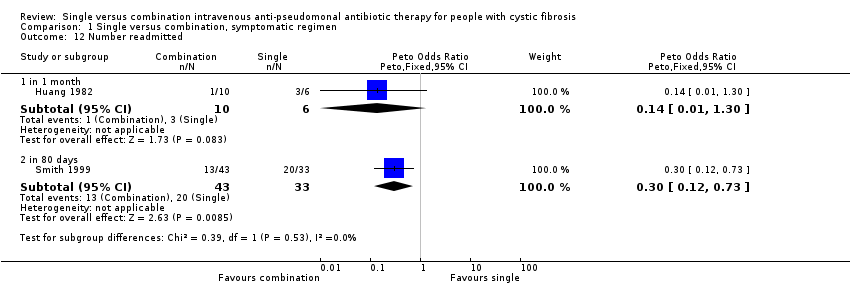
| 12 Number readmitted Show forest plot | 2 | | Peto Odds Ratio (Peto, Fixed, 95% CI) | Subtotals only |
|
| 12.1 in 1 month | 1 | 16 | Peto Odds Ratio (Peto, Fixed, 95% CI) | 0.14 [0.01, 1.30] |
| 12.2 in 80 days | 1 | 76 | Peto Odds Ratio (Peto, Fixed, 95% CI) | 0.30 [0.12, 0.73] |
| 13 Mean time to next course of antibiotics (weeks) Show forest plot | 1 | | Mean Difference (IV, Fixed, 95% CI) | Totals not selected |
|
| 14 Mean WBC count at end of course Show forest plot | 1 | | Mean Difference (IV, Fixed, 95% CI) | Totals not selected |
|
| 15 Number resistant strains Show forest plot | 2 | | Peto Odds Ratio (Peto, Fixed, 95% CI) | Subtotals only |
|
| 15.1 at baseline | 2 | 140 | Peto Odds Ratio (Peto, Fixed, 95% CI) | 0.83 [0.38, 1.82] |
| 15.2 at end of course | 2 | 99 | Peto Odds Ratio (Peto, Fixed, 95% CI) | 2.44 [0.94, 6.32] |
| 15.3 at 2 to 8 weeks | 2 | 76 | Peto Odds Ratio (Peto, Fixed, 95% CI) | 0.44 [0.17, 1.14] |
| 15.4 Difference between baseline and 2 to 8 weeks | 1 | 29 | Peto Odds Ratio (Peto, Fixed, 95% CI) | 0.27 [0.06, 1.18] |