Assisted hatching on assisted conception (IVF & ICSI)
Referencias
References to studies included in this review
References to studies excluded from this review
References to ongoing studies
Additional references
References to other published versions of this review
Characteristics of studies
Characteristics of included studies [ordered by study ID]
| Methods | Randomisation stated, but method unclear or incorrect. | |
| Participants | Women from Italy without previous IVF experience undergoing IVF. Mean age control 27.0, AH 27.5. | |
| Interventions | AH (laser; complete zona breach; ? hours egg retrieval to AH;? hours AH to transfer) versus no AH | |
| Outcomes | clinical pregnancy, miscarriage, multiple pregnancy | |
| Notes | No reply | |
| Risk of bias | ||
| Bias | Authors' judgement | Support for judgement |
| Allocation concealment (selection bias) | Unclear risk | B ‐ Unclear |
| Methods | Randomisation stated, but method unclear or incorrect. Allocation concealment unclear. | |
| Participants | Women from Italy with >6 previous IVF failures undergoing IVF. Mean age control 36.0, AH 37.5. | |
| Interventions | AH (laser; complete zona breach; ? hours egg retrieval to AH;? hours AH to transfer) versus no AH | |
| Outcomes | clinical pregnancy, miscarriage, multiple pregnancy | |
| Notes | No reply | |
| Risk of bias | ||
| Bias | Authors' judgement | Support for judgement |
| Allocation concealment (selection bias) | Unclear risk | B ‐ Unclear |
| Methods | Randomised, method stated. Allocation concealment unclear. | |
| Participants | Women from Brazil aged 37 years or less, undergoing ICSI for the first time (mean zona thickness control 17.1 um (sd 1.7), AH 16.6 um (sd 2.2). Mean age control 31.4 (3.6), AH 31.8 (3.6). | |
| Interventions | AH (laser; thinning partial; 48 hours egg retrieval to AH; 0 hours AH to transfer) versus no AH | |
| Outcomes | implantation, clinical pregnancy, miscarriage | |
| Notes | No reply | |
| Risk of bias | ||
| Bias | Authors' judgement | Support for judgement |
| Allocation concealment (selection bias) | Unclear risk | B ‐ Unclear |
| Methods | Randomised, method stated. Allocation concealment inadequate. | |
| Participants | Women from North America undergoing IVF, normal 3 day FSH levels (15IU/L or less). Mean age control 36.7 (3.7), AH 36.5 (3.3). | |
| Interventions | AH by acid tyrodes (chemical; complete zona breach hole; 68‐72 hours egg retrieval to AH; 4‐8 hours AH to transfer) versus no AH | |
| Outcomes | implantation, clinical pregnancy, live births, multiple pregnancy | |
| Notes | Attempted to contact author about this study. Reply received, but no additional information was offered. | |
| Risk of bias | ||
| Bias | Authors' judgement | Support for judgement |
| Allocation concealment (selection bias) | Unclear risk | B ‐ Unclear |
| Methods | as for Cohen 1992A | |
| Participants | Poor prognosis | |
| Interventions | ||
| Outcomes | ||
| Notes | ttempted to contact author about this study. Reply received, but no additional information was offered. | |
| Risk of bias | ||
| Bias | Authors' judgement | Support for judgement |
| Allocation concealment (selection bias) | Unclear risk | B ‐ Unclear |
| Methods | Randomised, method stated. Allocation concealment inadequate. | |
| Participants | Women from North America undergoing IVF, high basal FSH ( >15IU/L). Mean age not stated. | |
| Interventions | AH by acid tyrodes (chemical; complete zona breach; 68‐72 hours egg retrieval to AH; 4‐8 hours AH to transfer) versus no AH | |
| Outcomes | implantation, clinical pregnancy | |
| Notes | Attempted to contact author about this study. Reply received, but no additional information was offered. | |
| Risk of bias | ||
| Bias | Authors' judgement | Support for judgement |
| Allocation concealment (selection bias) | Unclear risk | B ‐ Unclear |
| Methods | Randomised, method stated. Allocation concealment inadequate. | |
| Participants | Women from Belgium undergoing IVF or ICSI. Mean age control 30.8 (3.9), AH 30.9 (4.3). | |
| Interventions | AH (mechanical; complete zona breach hole; 48 hours egg retrieval to AH; 0.2 hours AH to transfer) versus no AH | |
| Outcomes | implantation, clinical pregnancy, live births, miscarriage, ectopic pregnancy | |
| Notes | Attempted to contact author about this study. A reply including much useful additional information was received. | |
| Risk of bias | ||
| Bias | Authors' judgement | Support for judgement |
| Allocation concealment (selection bias) | Unclear risk | B ‐ Unclear |
| Methods | Randomised, method stated. Allocation concealment unclear. | |
| Participants | Women from North America undergoing IVF either with no prior IVF (30 years or less, FSH<10IU/L, normal endometrium and sperm) or prior IVF (35 years or less, 6 embryos, 50% fertilisation, normal endometrium). Mean age control 30 (2.1), AH 30 (3.2). | |
| Interventions | AH by acid tyrodes (chemical; complete zona breach hole; ? hours egg retrieval to AH; ? hours AH to transfer) versus no AH | |
| Outcomes | implatation, clinical pregnancy, live births | |
| Notes | Attempted to contact author about this study. A reply including much useful additional information was received. | |
| Risk of bias | ||
| Bias | Authors' judgement | Support for judgement |
| Allocation concealment (selection bias) | Unclear risk | B ‐ Unclear |
| Methods | Randomised, method stated. Allocation not concealed | |
| Participants | Women from Turkey with >5 day‐3 cleavage stage embryos (FSH at day‐3 control 6.1 (3.0), AH 5.5 (1.4) IU/L, mean duration of infertility 6.7 years) undergoing ICSI. Mean age control 29.1 (3.6), AH 30.5 (5.2). | |
| Interventions | AH enzymatic (chemical; complete and total zona breach; 120‐144 hours egg retrieval to AH; 0.5‐1 hours AH to transfer) versus no AH | |
| Outcomes | implantation | |
| Notes | Author response | |
| Risk of bias | ||
| Bias | Authors' judgement | Support for judgement |
| Allocation concealment (selection bias) | High risk | C ‐ Inadequate |
| Methods | Randomisation stated, but method unclear . Allocation concealment unclear. | |
| Participants | Women from Turkey undergoing IVF. Mean age not stated. | |
| Interventions | AH (mechanical; complete zona breach; ? hours egg retrieval to AH;? hours AH to transfer) versus no AH | |
| Outcomes | implantation, clinical pregnancy, multiple pregnancy | |
| Notes | Attempted to contact author about this study. | |
| Risk of bias | ||
| Bias | Authors' judgement | Support for judgement |
| Allocation concealment (selection bias) | Unclear risk | B ‐ Unclear |
| Methods | Randomisation stated, but method unclear. Allocation of concealment unclear. Single center. Participants not blinded or unclear. Published as a paper and an abstract | |
| Participants | IVF patients only, at least 2 previous failures, mean age 32 in both groups. | |
| Interventions | AH (chemical removal by acid, complete zona breech | |
| Outcomes | Clinical pregnancy rate, implantation rate | |
| Notes | Attempted to contact author about this study. | |
| Risk of bias | ||
| Bias | Authors' judgement | Support for judgement |
| Allocation concealment (selection bias) | Unclear risk | B ‐ Unclear |
| Methods | Randomisation stated, but method unclear or incorrect. Allocation concealment unclear. | |
| Participants | Women from North America aged less than 40 years undergoing IVF. Mean age not stated. | |
| Interventions | AH (mechanical; complete zona breach; ? hours egg retrieval to AH;? hours AH to transfer) versus no AH | |
| Outcomes | Clinical pregnancy | |
| Notes | Attempted to contact author about this study. | |
| Risk of bias | ||
| Bias | Authors' judgement | Support for judgement |
| Allocation concealment (selection bias) | Unclear risk | B ‐ Unclear |
| Methods | Randomised, method stated. Allocation concealment unclear. | |
| Participants | Women from North America aged at least 36 years (mean basal FSH control 7.6 IU/l (sd 2.0), AH 7.9 IU/l (sd 2.5)), undergoing IVF (some with ICSI), half had been previously treated with IVF. Mean age control 38.5 (1.8), AH 38.3 (2.0). | |
| Interventions | AH by acid tyrodes (chemical; complete zona breach; 55 hours egg retrieval to AH;? hours AH to transfer) versus no AH | |
| Outcomes | implantation, clinical pregnancy, multiple pregnancy, live births | |
| Notes | Attempted to contact author about this study. A reply including much useful additional information was received. | |
| Risk of bias | ||
| Bias | Authors' judgement | Support for judgement |
| Allocation concealment (selection bias) | Low risk | A ‐ Adequate |
| Methods | Randomisation stated, but method unclear or incorrect. Allocation concealment unclear. | |
| Participants | Women from Italy with cryopreserved embryos undergoing IVF and ICSI. Mean age control 31.4 (3.7), AH 32.0 (4.0). | |
| Interventions | AH (laser; complete zona breach; ? hours egg retreival to AH;? hours AH to transfer) with concomitant removal of damaged blastomeres versus no AH and no damaged blastomere removal | |
| Outcomes | clinical pregnancy | |
| Notes | Attempted to contact author about this study. Reply received. | |
| Risk of bias | ||
| Bias | Authors' judgement | Support for judgement |
| Allocation concealment (selection bias) | Unclear risk | B ‐ Unclear |
| Methods | Randomisation pm day of frozen embryo transfer, computer generated randomisation in sealed envelopes | |
| Participants | Women from Hong Kong with frozen embryo transfer, mean age 34.0 years. | |
| Interventions | Laser assisted thinning 1/4 with frozen embryos compared to frozen embryos | |
| Outcomes | Clinical pregnancy, miscarriage and multiple pregnancy rates | |
| Notes | No author contact as all details clearly stated in article | |
| Risk of bias | ||
| Bias | Authors' judgement | Support for judgement |
| Allocation concealment (selection bias) | Low risk | A ‐ Adequate |
| Methods | Random numbers table, unclear if allocation concealed, code id to mask identity of the patient | |
| Participants | Women from Brazil, undergoing ART cycles. All patients had one failed treatment cycle. Mean age 34 years. | |
| Interventions | ICSI cycles only. AH quarter‐laser thinning versus control | |
| Outcomes | Live birth, clinical pregnancy, miscarriage and multiple pregnancy | |
| Notes | Author response | |
| Risk of bias | ||
| Bias | Authors' judgement | Support for judgement |
| Allocation concealment (selection bias) | Unclear risk | B ‐ Unclear |
| Methods | As for Petersen A | |
| Participants | Women from Brazil, undergoing ART cycles, mean age 35 years. More than one failed cycle | |
| Interventions | ICSI cycles only. AH quarter‐laser thinning versus control | |
| Outcomes | Live birth, clinical pregnancy, miscarriage and multiple pregnancy | |
| Notes | Author response | |
| Risk of bias | ||
| Bias | Authors' judgement | Support for judgement |
| Allocation concealment (selection bias) | Unclear risk | B ‐ Unclear |
| Methods | Unknown about randomization method and allocation of concealment | |
| Participants | 3 consecutive failed IVF cycles, all ages, undergoing IVF only | |
| Interventions | Mechancial partial zonal dissection ‐complete breach technique versus control | |
| Outcomes | Clinical pregnancy, miscarriage | |
| Notes | Author response | |
| Risk of bias | ||
| Bias | Authors' judgement | Support for judgement |
| Allocation concealment (selection bias) | Unclear risk | B ‐ Unclear |
| Methods | Random numbers table, unclear if allocation concealed, or if blinding occured. SIngle center | |
| Participants | Women from | |
| Interventions | AH ‐ tyrodes complete breach ‐ hole chemical means on both fresh and frozen‐thawed embryos | |
| Outcomes | Clinical pregnancy, | |
| Notes | Additional information was received from the 1st author regarding the definition of pregnancy. No further publication is planned. | |
| Risk of bias | ||
| Bias | Authors' judgement | Support for judgement |
| Allocation concealment (selection bias) | Unclear risk | B ‐ Unclear |
| Methods | Randomisation stated, but method unclear or incorrect. Allocation concealment unclear. | |
| Participants | Women from Israel with repeated implantation failure (>3 attempts) undergoing IVF. Mean age not stated. | |
| Interventions | AH (mechanical; complete zona breach; ? hours egg retrieval to AH; 1.5 hours AH to transfer) versus no AH | |
| Outcomes | Clinical pregnancy, miscarriage | |
| Notes | Attempted to contact author about this study, no reply received | |
| Risk of bias | ||
| Bias | Authors' judgement | Support for judgement |
| Allocation concealment (selection bias) | Unclear risk | B ‐ Unclear |
| Methods | Randomisation stated, but method unclear or incorrect. Allocation concealment unclear. | |
| Participants | Women from North America undergoing IVF. (Mean basal FSH control 9.0 (5.3), AH 8.8 (3.7) IU/L). Mean age control 34.2 (4.1), AH 34.1 (4.8). | |
| Interventions | AH with acid tyrodes thinning to 1/4; 72 hours egg retrieval to AH; 1‐3 hours AH to transfer) versus no AH | |
| Outcomes | Implantation, clinical pregnancy | |
| Notes | Attempted to contact author about this study, no reply received | |
| Risk of bias | ||
| Bias | Authors' judgement | Support for judgement |
| Allocation concealment (selection bias) | Unclear risk | B ‐ Unclear |
| Methods | Randomisation stated, but method unclear or incorrect. Allocation concealment unclear. | |
| Participants | Women from North America undergoing ICSI. Mean age control 33.5 (4.3), AH 35.3 (4.2). | |
| Interventions | AH with acid tyrodes (chemical; complete zona breach; 72 hours egg retrieval to AH; 4 hours AH to transfer) versus no AH | |
| Outcomes | Implantation, clinical pregnancy | |
| Notes | Attempted to contact author about this study, no reply received | |
| Risk of bias | ||
| Bias | Authors' judgement | Support for judgement |
| Allocation concealment (selection bias) | Unclear risk | B ‐ Unclear |
| Methods | Randomisation stated, but method unclear or incorrect. Allocation concealment unclear. | |
| Participants | Women from Japan, undergoing either ICSI or IVF. No data provided on age. | |
| Interventions | AH with acid (chemical). No other details about the day of treatment provided | |
| Outcomes | Clinical pregnancy rate only (gestation sac on ultrasound) | |
| Notes | No attempt to contact author | |
| Risk of bias | ||
| Bias | Authors' judgement | Support for judgement |
| Allocation concealment (selection bias) | Unclear risk | B ‐ Unclear |
AH = assisted hatching
IVF = in‐vitro fertilisation, ICSI = intracytoplasmic sperm injection
Mean age given in years (standard deviation).
note: only arms where all or no embryos transfered were treated with AH were accepted for data extraction
Characteristics of excluded studies [ordered by study ID]
| Study | Reason for exclusion |
| Pooled oocytes and then randomised, No per woman data provided. | |
| Not an RCT. Mentions randomly selected not randomly allocated. | |
| No randomised comparison between control and assisted hatching groups. | |
| Not randomised. No appropriate controls. | |
| Not randomised. | |
| Not randomised. No embryo transfer occurred, so no review outcomes could be measured. | |
| No per woman data. | |
| Assessment of pregnancy was by HCG only 14 days after embryo transfer | |
| Not randomised. Benefits of AH confounded by concurrent assessment of 2 different culture media. | |
| Not randomised. Benefits of assisted hatching confounded by concurrent assessment of two different culture media. | |
| Comparison of two types of assisted hatching, no 'no assisted hatching' control group was used. More than one cycle per woman. | |
| Not randomised. | |
| No pregnancy data provided. | |
| No hatching. | |
| No appropriate outcome measure. | |
| Benefits of assisted hatching confounded by concurrent assessment of two different culture media. | |
| No per woman data. | |
| Not randomised. | |
| Pseudorandomized (alternate days). | |
| Not randomised. The control group were from the period 1990‐1993, while the assisted hatching group were from 1994‐1996 (historical controls). | |
| Not randomised. Benefits of AH confounded by concurrent assessment of 2 different culture media. | |
| No per women data | |
| No per women data | |
| Not randomised. | |
| No per women data | |
| No per women data. | |
| No per women data. | |
| No per women data | |
| Not randomised. No concurrent controls. | |
| Randomisation by altenate days. | |
| Not randomised. No concurrent controls. | |
| Not randomised. No concurrent controls. | |
| No per woman data. | |
| No appropriate outcome measure. | |
| No per woman data. | |
| Not randomised. No concurrent controls. | |
| No per woman data. | |
| Assisted hatching was part of the ICSI method. | |
| It was not clear how many women were included in the study, or for how many cycles (only cycles were mentioned), and a mixture of participants and donated eggs were used for the study. | |
| Not randomised. Control and intervention groups recruited at different times. | |
| No per women data | |
| Not randomised. Benefits of assisted hatching confounded by concurrent assessment of two different culture media. | |
| Not randomised. Some of the women in the assisted hatching group were randomised, but most were allocated assisted hatching routinely, with no control option. | |
| Not randomised. | |
| Alternate randomisation | |
| Numbers in tables do not add up correctly and the text and tables are contradictory on the age groups used in the prospective part of the study. |
Characteristics of ongoing studies [ordered by study ID]
| Trial name or title | |
| Methods | |
| Participants | Group I, women who initiate their first transfer cycle of frozen‐thawed embryos. |
| Interventions | Assisted hatching with a diode laser (use of immunosuppressive and antibiotic treatment will also be tested). |
| Outcomes | Clinical pregnancy. |
| Starting date | Underway in 1998. |
| Contact information | M. Germond, Reproductive Medicine Unit, Dept. of Obstetrics‐Gynaecology, CHUV, CH‐1011 Lausanne, Switzerland. |
| Notes |
Data and analyses
| Outcome or subgroup title | No. of studies | No. of participants | Statistical method | Effect size |
| 1 Live birth per woman randomised Show forest plot | 6 | 516 | Odds Ratio (M‐H, Fixed, 95% CI) | 1.19 [0.81, 1.73] |
| Analysis 1.1  Comparison 1 Live birth rate, Outcome 1 Live birth per woman randomised. | ||||
| 2 Live birth rate per women randomised: grouped by 1st attempt and repeat attempts Show forest plot | 6 | 516 | Odds Ratio (M‐H, Fixed, 95% CI) | 1.19 [0.81, 1.73] |
| Analysis 1.2  Comparison 1 Live birth rate, Outcome 2 Live birth rate per women randomised: grouped by 1st attempt and repeat attempts. | ||||
| 2.1 First attempt at IVF or ICSI | 1 | 20 | Odds Ratio (M‐H, Fixed, 95% CI) | 0.24 [0.03, 2.03] |
| 2.2 Repeat attempt at IVF or ICSI | 2 | 150 | Odds Ratio (M‐H, Fixed, 95% CI) | 1.40 [0.62, 3.14] |
| 2.3 Unselected | 3 | 346 | Odds Ratio (M‐H, Fixed, 95% CI) | 1.21 [0.78, 1.88] |
| 3 Live birth rate per women randomised: grouped by ICSI cycles versus IVF cycles Show forest plot | 6 | 516 | Odds Ratio (M‐H, Fixed, 95% CI) | 1.19 [0.81, 1.73] |
| Analysis 1.3  Comparison 1 Live birth rate, Outcome 3 Live birth rate per women randomised: grouped by ICSI cycles versus IVF cycles. | ||||
| 3.1 ICSI only | 2 | 150 | Odds Ratio (M‐H, Fixed, 95% CI) | 1.40 [0.62, 3.14] |
| 3.2 IVF only | 2 | 157 | Odds Ratio (M‐H, Fixed, 95% CI) | 1.31 [0.69, 2.47] |
| 3.3 Mixed ICSI and IVF | 2 | 209 | Odds Ratio (M‐H, Fixed, 95% CI) | 1.01 [0.56, 1.80] |
| 4 Live birth rate per women randomised: grouped by method of assisted hatching used Show forest plot | 6 | 516 | Odds Ratio (M‐H, Fixed, 95% CI) | 1.19 [0.81, 1.73] |
| Analysis 1.4  Comparison 1 Live birth rate, Outcome 4 Live birth rate per women randomised: grouped by method of assisted hatching used. | ||||
| 4.1 Chemical | 4 | 366 | Odds Ratio (M‐H, Fixed, 95% CI) | 1.13 [0.74, 1.74] |
| 4.2 Laser | 2 | 150 | Odds Ratio (M‐H, Fixed, 95% CI) | 1.40 [0.62, 3.14] |
| 4.3 Mechanical | 0 | 0 | Odds Ratio (M‐H, Fixed, 95% CI) | 0.0 [0.0, 0.0] |
| 5 Live birth rate: grouped by prognosis Show forest plot | 6 | 516 | Odds Ratio (M‐H, Fixed, 95% CI) | 1.19 [0.81, 1.73] |
| Analysis 1.5  Comparison 1 Live birth rate, Outcome 5 Live birth rate: grouped by prognosis. | ||||
| 5.1 Poor prognosis | 4 | 376 | Odds Ratio (M‐H, Fixed, 95% CI) | 1.32 [0.84, 2.07] |
| 5.2 Good prognosis | 2 | 140 | Odds Ratio (M‐H, Fixed, 95% CI) | 0.91 [0.45, 1.83] |
| 5.3 Not stated | 0 | 0 | Odds Ratio (M‐H, Fixed, 95% CI) | 0.0 [0.0, 0.0] |
| Outcome or subgroup title | No. of studies | No. of participants | Statistical method | Effect size |
| 1 Clinical pregnancy rate per woman randomised Show forest plot | 23 | 2686 | Odds Ratio (M‐H, Fixed, 95% CI) | 1.33 [1.12, 1.57] |
| Analysis 2.1  Comparison 2 Clinical pregnancy, Outcome 1 Clinical pregnancy rate per woman randomised. | ||||
| 2 Clinical pregnancy rate per woman randomised: grouped by 1st attempt and repeat attempts Show forest plot | 23 | 2686 | Odds Ratio (M‐H, Fixed, 95% CI) | 1.33 [1.12, 1.57] |
| Analysis 2.2  Comparison 2 Clinical pregnancy, Outcome 2 Clinical pregnancy rate per woman randomised: grouped by 1st attempt and repeat attempts. | ||||
| 2.1 First attempt at IVF or ICSI | 4 | 378 | Odds Ratio (M‐H, Fixed, 95% CI) | 0.97 [0.63, 1.49] |
| 2.2 Repeat attempt at IVF or ICSI | 7 | 963 | Odds Ratio (M‐H, Fixed, 95% CI) | 1.46 [1.08, 1.96] |
| 2.3 Unselected or mixed | 12 | 1345 | Odds Ratio (M‐H, Fixed, 95% CI) | 1.37 [1.09, 1.73] |
| 3 Clinical pregnancy rate: grouped by ICSI versus IVF cycles Show forest plot | 23 | 2686 | Odds Ratio (M‐H, Fixed, 95% CI) | 1.33 [1.12, 1.57] |
| Analysis 2.3  Comparison 2 Clinical pregnancy, Outcome 3 Clinical pregnancy rate: grouped by ICSI versus IVF cycles. | ||||
| 3.1 ICSI only | 5 | 399 | Odds Ratio (M‐H, Fixed, 95% CI) | 1.30 [0.85, 1.99] |
| 3.2 IVF only | 13 | 1785 | Odds Ratio (M‐H, Fixed, 95% CI) | 1.39 [1.13, 1.70] |
| 3.3 Mixed ICSI and IVF | 5 | 502 | Odds Ratio (M‐H, Fixed, 95% CI) | 1.12 [0.75, 1.68] |
| 4 Clinical pregnancy rate: grouped by method of assisted hatching used Show forest plot | 23 | 2686 | Odds Ratio (M‐H, Fixed, 95% CI) | 1.33 [1.12, 1.57] |
| Analysis 2.4  Comparison 2 Clinical pregnancy, Outcome 4 Clinical pregnancy rate: grouped by method of assisted hatching used. | ||||
| 4.1 Chemical | 12 | 1433 | Odds Ratio (M‐H, Fixed, 95% CI) | 1.38 [1.11, 1.73] |
| 4.2 Laser | 7 | 792 | Odds Ratio (M‐H, Fixed, 95% CI) | 1.36 [0.98, 1.88] |
| 4.3 Mechanical | 4 | 461 | Odds Ratio (M‐H, Fixed, 95% CI) | 1.09 [0.71, 1.66] |
| 5 Clinical pregnancy rate: grouped by age >=35 years Show forest plot | 6 | 697 | Odds Ratio (M‐H, Fixed, 95% CI) | 1.13 [0.81, 1.57] |
| Analysis 2.5  Comparison 2 Clinical pregnancy, Outcome 5 Clinical pregnancy rate: grouped by age >=35 years. | ||||
| 5.1 Age >= 35 years old | 4 | 362 | Odds Ratio (M‐H, Fixed, 95% CI) | 1.54 [0.94, 2.51] |
| 5.2 Age < 35 years old | 4 | 335 | Odds Ratio (M‐H, Fixed, 95% CI) | 0.85 [0.53, 1.35] |
| 6 Clinical pregnancy rate: grouped by prognosis Show forest plot | 23 | 2686 | Odds Ratio (M‐H, Fixed, 95% CI) | 1.33 [1.12, 1.57] |
| Analysis 2.6  Comparison 2 Clinical pregnancy, Outcome 6 Clinical pregnancy rate: grouped by prognosis. | ||||
| 6.1 Poor prognosis | 9 | 1082 | Odds Ratio (M‐H, Fixed, 95% CI) | 1.43 [1.09, 1.89] |
| 6.2 Good prognosis | 5 | 613 | Odds Ratio (M‐H, Fixed, 95% CI) | 1.20 [0.86, 1.67] |
| 6.3 Unstated | 9 | 991 | Odds Ratio (M‐H, Fixed, 95% CI) | 1.31 [1.00, 1.73] |
| 7 Clinicial pregnancy rate per woman randomised: subgrouped extent of assisted hatching Show forest plot | 23 | 2686 | Odds Ratio (M‐H, Fixed, 95% CI) | 1.33 [1.13, 1.57] |
| Analysis 2.7  Comparison 2 Clinical pregnancy, Outcome 7 Clinicial pregnancy rate per woman randomised: subgrouped extent of assisted hatching. | ||||
| 7.1 Thinning only | 6 | 686 | Odds Ratio (M‐H, Fixed, 95% CI) | 1.20 [0.85, 1.69] |
| 7.2 Breach by hole only | 15 | 1699 | Odds Ratio (M‐H, Fixed, 95% CI) | 1.28 [1.04, 1.58] |
| 7.3 Complete removal of zona | 2 | 301 | Odds Ratio (M‐H, Fixed, 95% CI) | 1.93 [1.21, 3.09] |
| Outcome or subgroup title | No. of studies | No. of participants | Statistical method | Effect size |
| 1 Miscarriage per woman randomised Show forest plot | 12 | 1320 | Odds Ratio (M‐H, Fixed, 95% CI) | 1.23 [0.73, 2.05] |
| Analysis 3.1  Comparison 3 Miscarriage rate, Outcome 1 Miscarriage per woman randomised. | ||||
| 2 Miscarriage rate per woman randomised: grouped by 1st or repeat attempt Show forest plot | 12 | 1320 | Odds Ratio (M‐H, Fixed, 95% CI) | 1.23 [0.73, 2.05] |
| Analysis 3.2  Comparison 3 Miscarriage rate, Outcome 2 Miscarriage rate per woman randomised: grouped by 1st or repeat attempt. | ||||
| 2.1 First attempt at IVF or ICSI | 3 | 322 | Odds Ratio (M‐H, Fixed, 95% CI) | 0.82 [0.28, 2.44] |
| 2.2 More than one previous IVF or ICSI cycle | 5 | 606 | Odds Ratio (M‐H, Fixed, 95% CI) | 2.39 [0.78, 7.29] |
| 2.3 Unselected couples | 4 | 392 | Odds Ratio (M‐H, Fixed, 95% CI) | 1.08 [0.54, 2.20] |
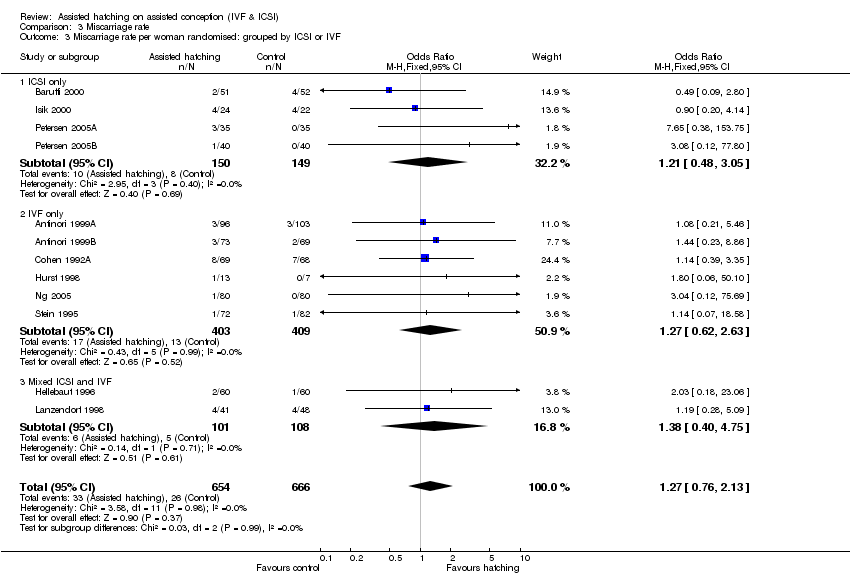
| 3 Miscarriage rate per woman randomised: grouped by ICSI or IVF Show forest plot | 12 | 1320 | Odds Ratio (M‐H, Fixed, 95% CI) | 1.27 [0.76, 2.13] |
| Analysis 3.3  Comparison 3 Miscarriage rate, Outcome 3 Miscarriage rate per woman randomised: grouped by ICSI or IVF. | ||||
| 3.1 ICSI only | 4 | 299 | Odds Ratio (M‐H, Fixed, 95% CI) | 1.21 [0.48, 3.05] |
| 3.2 IVF only | 6 | 812 | Odds Ratio (M‐H, Fixed, 95% CI) | 1.27 [0.62, 2.63] |
| 3.3 Mixed ICSI and IVF | 2 | 209 | Odds Ratio (M‐H, Fixed, 95% CI) | 1.38 [0.40, 4.75] |
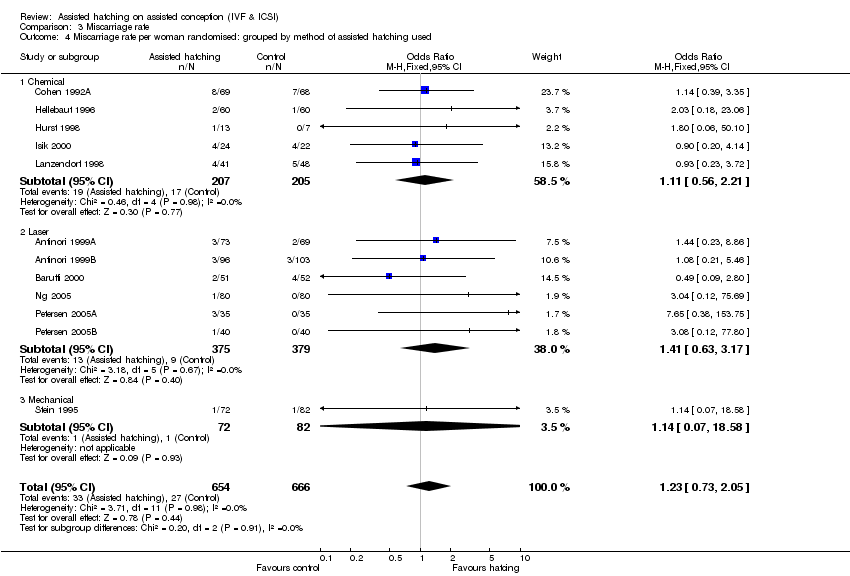
| 4 Miscarriage rate per woman randomised: grouped by method of assisted hatching used Show forest plot | 12 | 1320 | Odds Ratio (M‐H, Fixed, 95% CI) | 1.23 [0.73, 2.05] |
| Analysis 3.4  Comparison 3 Miscarriage rate, Outcome 4 Miscarriage rate per woman randomised: grouped by method of assisted hatching used. | ||||
| 4.1 Chemical | 5 | 412 | Odds Ratio (M‐H, Fixed, 95% CI) | 1.11 [0.56, 2.21] |
| 4.2 Laser | 6 | 754 | Odds Ratio (M‐H, Fixed, 95% CI) | 1.41 [0.63, 3.17] |
| 4.3 Mechanical | 1 | 154 | Odds Ratio (M‐H, Fixed, 95% CI) | 1.14 [0.07, 18.58] |
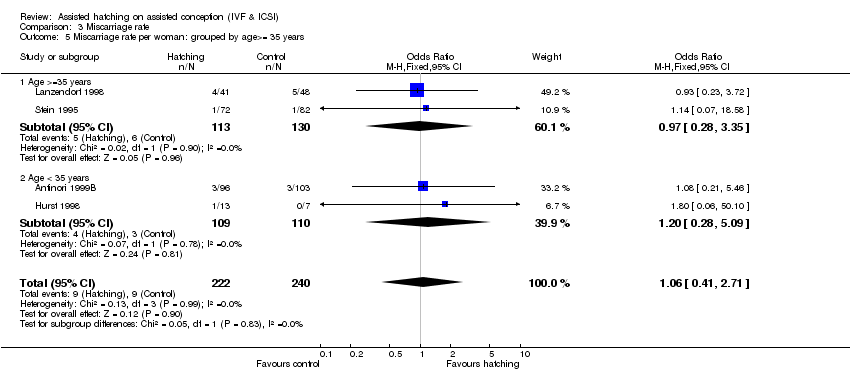
| 5 Miscarriage rate per woman: grouped by age>= 35 years Show forest plot | 4 | 462 | Odds Ratio (M‐H, Fixed, 95% CI) | 1.06 [0.41, 2.71] |
| Analysis 3.5  Comparison 3 Miscarriage rate, Outcome 5 Miscarriage rate per woman: grouped by age>= 35 years. | ||||
| 5.1 Age >=35 years | 2 | 243 | Odds Ratio (M‐H, Fixed, 95% CI) | 0.97 [0.28, 3.35] |
| 5.2 Age < 35 years | 2 | 219 | Odds Ratio (M‐H, Fixed, 95% CI) | 1.20 [0.28, 5.09] |
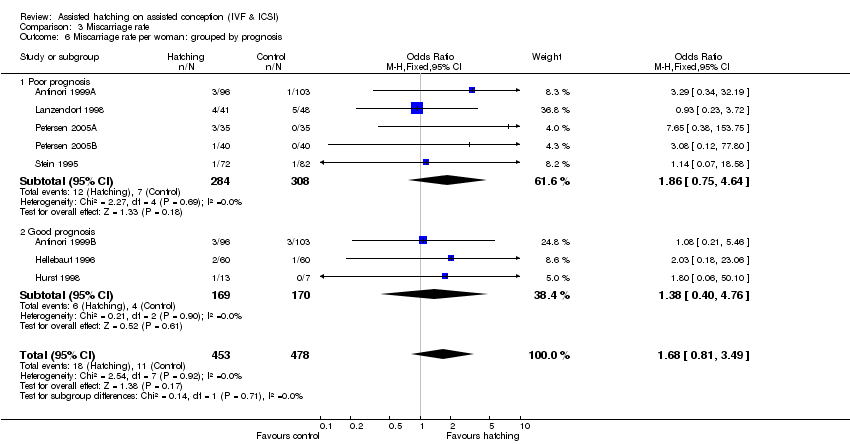
| 6 Miscarriage rate per woman: grouped by prognosis Show forest plot | 8 | 931 | Odds Ratio (M‐H, Fixed, 95% CI) | 1.68 [0.81, 3.49] |
| Analysis 3.6  Comparison 3 Miscarriage rate, Outcome 6 Miscarriage rate per woman: grouped by prognosis. | ||||
| 6.1 Poor prognosis | 5 | 592 | Odds Ratio (M‐H, Fixed, 95% CI) | 1.86 [0.75, 4.64] |
| 6.2 Good prognosis | 3 | 339 | Odds Ratio (M‐H, Fixed, 95% CI) | 1.38 [0.40, 4.76] |
| 8 Miscarriage per clinical pregnancy Show forest plot | 11 | Odds Ratio (M‐H, Random, 95% CI) | Totals not selected | |
| Analysis 3.8  Comparison 3 Miscarriage rate, Outcome 8 Miscarriage per clinical pregnancy. | ||||
| Outcome or subgroup title | No. of studies | No. of participants | Statistical method | Effect size |
| 1 Multiple pregnancy rate per woman randomised Show forest plot | 9 | 981 | Odds Ratio (M‐H, Fixed, 95% CI) | 1.83 [1.19, 2.83] |
| Analysis 4.1  Comparison 4 Multiple pregnancy rate, Outcome 1 Multiple pregnancy rate per woman randomised. | ||||
| 2 Multiple pregnancy rate per woman: grouped by 1st attempt versus repeat attempts Show forest plot | 9 | 981 | Odds Ratio (M‐H, Fixed, 95% CI) | 1.83 [1.19, 2.83] |
| Analysis 4.2  Comparison 4 Multiple pregnancy rate, Outcome 2 Multiple pregnancy rate per woman: grouped by 1st attempt versus repeat attempts. | ||||
| 2.1 1st IVF attempt | 1 | 136 | Odds Ratio (M‐H, Fixed, 95% CI) | 2.63 [0.11, 65.65] |
| 2.2 More than one previous IVF attempt | 2 | 359 | Odds Ratio (M‐H, Fixed, 95% CI) | 3.59 [0.97, 13.29] |
| 2.3 Unselected couples | 6 | 486 | Odds Ratio (M‐H, Fixed, 95% CI) | 1.64 [1.02, 2.63] |
| 3 Multiple pregnancy rate per woman: grouped by ICSI or IVF Show forest plot | 9 | 981 | Odds Ratio (M‐H, Fixed, 95% CI) | 1.83 [1.19, 2.83] |
| Analysis 4.3  Comparison 4 Multiple pregnancy rate, Outcome 3 Multiple pregnancy rate per woman: grouped by ICSI or IVF. | ||||
| 3.1 ICSI only | 1 | 25 | Odds Ratio (M‐H, Fixed, 95% CI) | 0.62 [0.07, 5.28] |
| 3.2 IVF only | 6 | 747 | Odds Ratio (M‐H, Fixed, 95% CI) | 2.38 [1.43, 3.94] |
| 3.3 Mixed IVF or ICSI | 2 | 209 | Odds Ratio (M‐H, Fixed, 95% CI) | 0.79 [0.28, 2.22] |
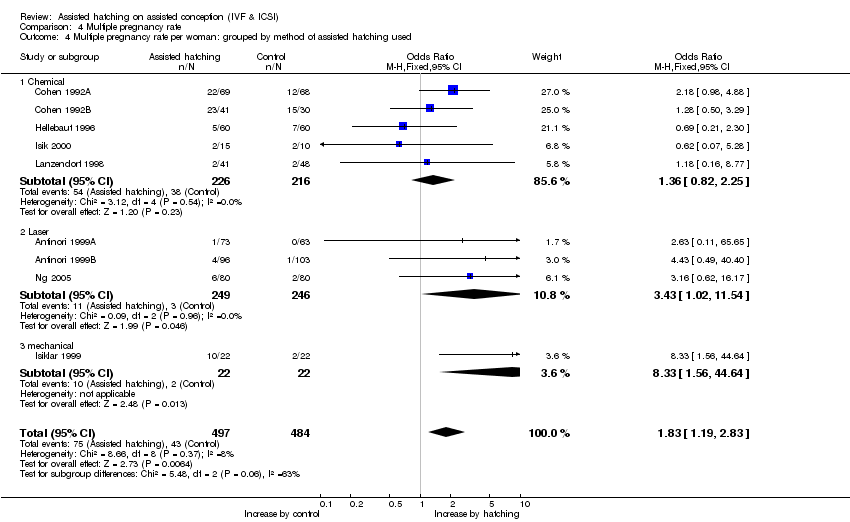
| 4 Multiple pregnancy rate per woman: grouped by method of assisted hatching used Show forest plot | 9 | 981 | Odds Ratio (M‐H, Fixed, 95% CI) | 1.83 [1.19, 2.83] |
| Analysis 4.4  Comparison 4 Multiple pregnancy rate, Outcome 4 Multiple pregnancy rate per woman: grouped by method of assisted hatching used. | ||||
| 4.1 Chemical | 5 | 442 | Odds Ratio (M‐H, Fixed, 95% CI) | 1.36 [0.82, 2.25] |
| 4.2 Laser | 3 | 495 | Odds Ratio (M‐H, Fixed, 95% CI) | 3.43 [1.02, 11.54] |
| 4.3 mechanical | 1 | 44 | Odds Ratio (M‐H, Fixed, 95% CI) | 8.33 [1.56, 44.64] |
| 5 Multiple pregnancy rate per woman: grouped by age>=35 years old Show forest plot | 2 | 74 | Odds Ratio (M‐H, Fixed, 95% CI) | 1.51 [0.34, 6.70] |
| Analysis 4.5  Comparison 4 Multiple pregnancy rate, Outcome 5 Multiple pregnancy rate per woman: grouped by age>=35 years old. | ||||
| 5.1 Age >= 35 years | 1 | 44 | Odds Ratio (M‐H, Fixed, 95% CI) | 0.90 [0.12, 7.07] |
| 5.2 Age < 35 years | 1 | 30 | Odds Ratio (M‐H, Fixed, 95% CI) | 2.67 [0.26, 27.49] |
| 6 Multiple pregnancy rate per woman: grouped by prognosis Show forest plot | 4 | 544 | Odds Ratio (M‐H, Fixed, 95% CI) | 1.24 [0.53, 2.91] |
| Analysis 4.6  Comparison 4 Multiple pregnancy rate, Outcome 6 Multiple pregnancy rate per woman: grouped by prognosis. | ||||
| 6.1 Poor prognosis | 2 | 225 | Odds Ratio (M‐H, Fixed, 95% CI) | 1.51 [0.29, 8.02] |
| 6.2 Good prognosis | 2 | 319 | Odds Ratio (M‐H, Fixed, 95% CI) | 1.16 [0.43, 3.11] |
| 7 Multiple pregnancy rate per woman grouped by extent of assisted hatching Show forest plot | 9 | 981 | Odds Ratio (M‐H, Fixed, 95% CI) | 1.83 [1.19, 2.83] |
| Analysis 4.7  Comparison 4 Multiple pregnancy rate, Outcome 7 Multiple pregnancy rate per woman grouped by extent of assisted hatching. | ||||
| 7.1 Thinning only | 1 | 160 | Odds Ratio (M‐H, Fixed, 95% CI) | 3.16 [0.62, 16.17] |
| 7.2 breach by hole | 7 | 796 | Odds Ratio (M‐H, Fixed, 95% CI) | 1.84 [1.15, 2.92] |
| 7.3 Complete removal of zona | 1 | 25 | Odds Ratio (M‐H, Fixed, 95% CI) | 0.62 [0.07, 5.28] |
| 8 Multiple pregnancy per pregnancy Show forest plot | 9 | 394 | Odds Ratio (M‐H, Fixed, 95% CI) | 1.79 [1.11, 2.89] |
| Analysis 4.8  Comparison 4 Multiple pregnancy rate, Outcome 8 Multiple pregnancy per pregnancy. | ||||
| Outcome or subgroup title | No. of studies | No. of participants | Statistical method | Effect size |
| 1 Monozygotic twinning per woman randomised Show forest plot | 4 | 524 | Odds Ratio (M‐H, Fixed, 95% CI) | 3.26 [0.14, 77.84] |
| Analysis 5.1  Comparison 5 Monozygotic twinning rate, Outcome 1 Monozygotic twinning per woman randomised. | ||||
| Outcome or subgroup title | No. of studies | No. of participants | Statistical method | Effect size |
| 1 Number of gestation sacs per embryo transferred Show forest plot | 12 | Odds Ratio (M‐H, Fixed, 95% CI) | Totals not selected | |
| Analysis 7.1  Comparison 7 Implantation rate (gestation sac/embryo transfer), Outcome 1 Number of gestation sacs per embryo transferred. | ||||

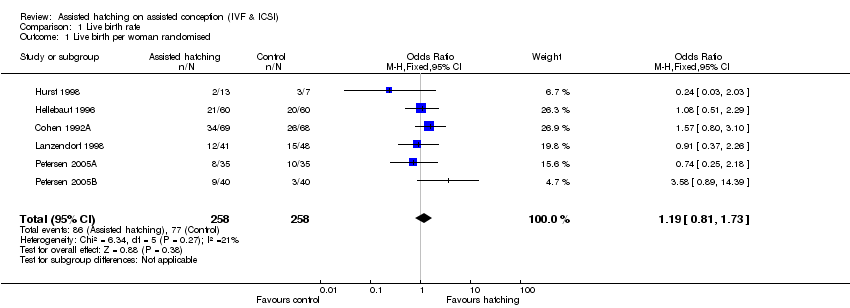
Comparison 1 Live birth rate, Outcome 1 Live birth per woman randomised.
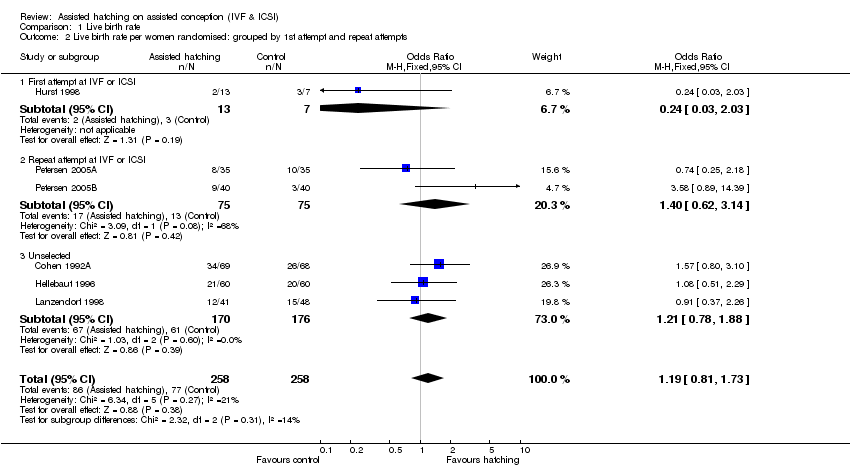
Comparison 1 Live birth rate, Outcome 2 Live birth rate per women randomised: grouped by 1st attempt and repeat attempts.
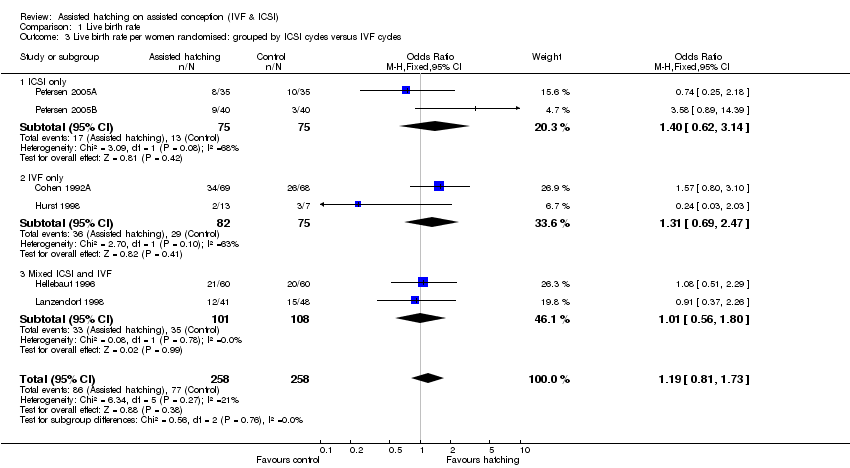
Comparison 1 Live birth rate, Outcome 3 Live birth rate per women randomised: grouped by ICSI cycles versus IVF cycles.
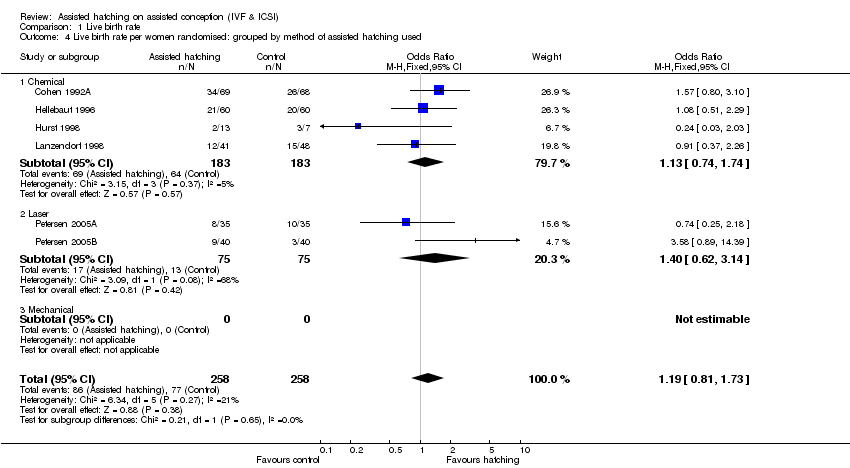
Comparison 1 Live birth rate, Outcome 4 Live birth rate per women randomised: grouped by method of assisted hatching used.
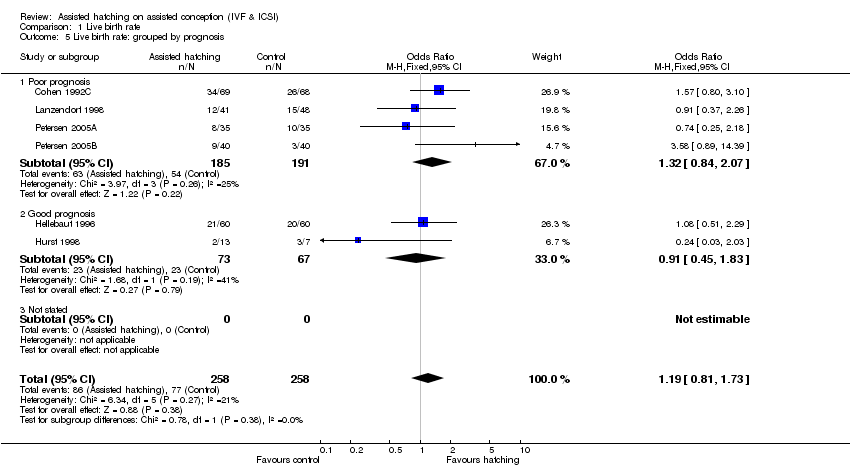
Comparison 1 Live birth rate, Outcome 5 Live birth rate: grouped by prognosis.

Comparison 2 Clinical pregnancy, Outcome 1 Clinical pregnancy rate per woman randomised.

Comparison 2 Clinical pregnancy, Outcome 2 Clinical pregnancy rate per woman randomised: grouped by 1st attempt and repeat attempts.
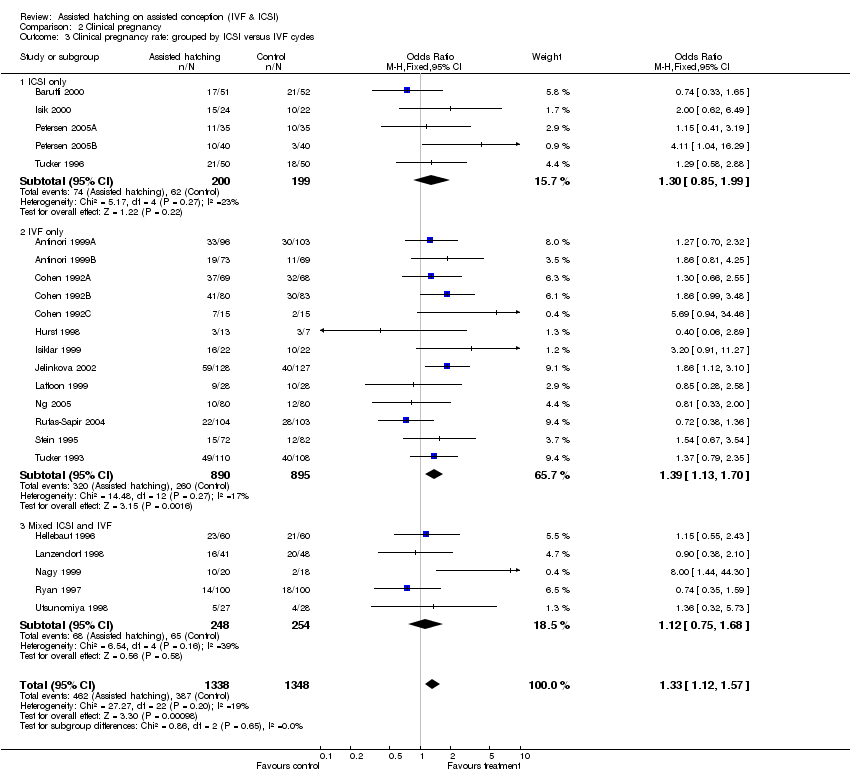
Comparison 2 Clinical pregnancy, Outcome 3 Clinical pregnancy rate: grouped by ICSI versus IVF cycles.
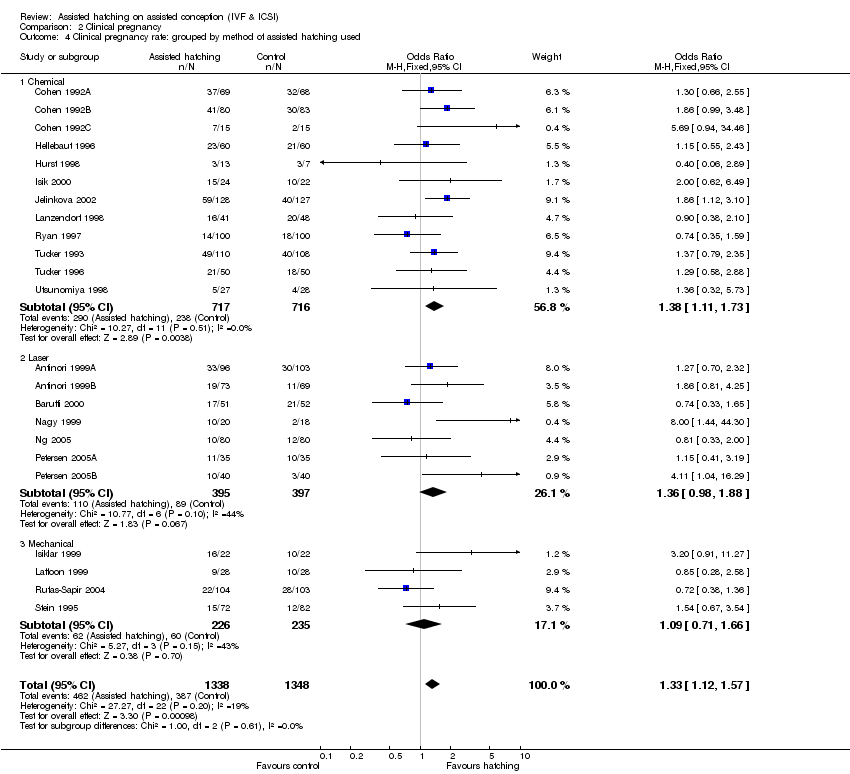
Comparison 2 Clinical pregnancy, Outcome 4 Clinical pregnancy rate: grouped by method of assisted hatching used.

Comparison 2 Clinical pregnancy, Outcome 5 Clinical pregnancy rate: grouped by age >=35 years.
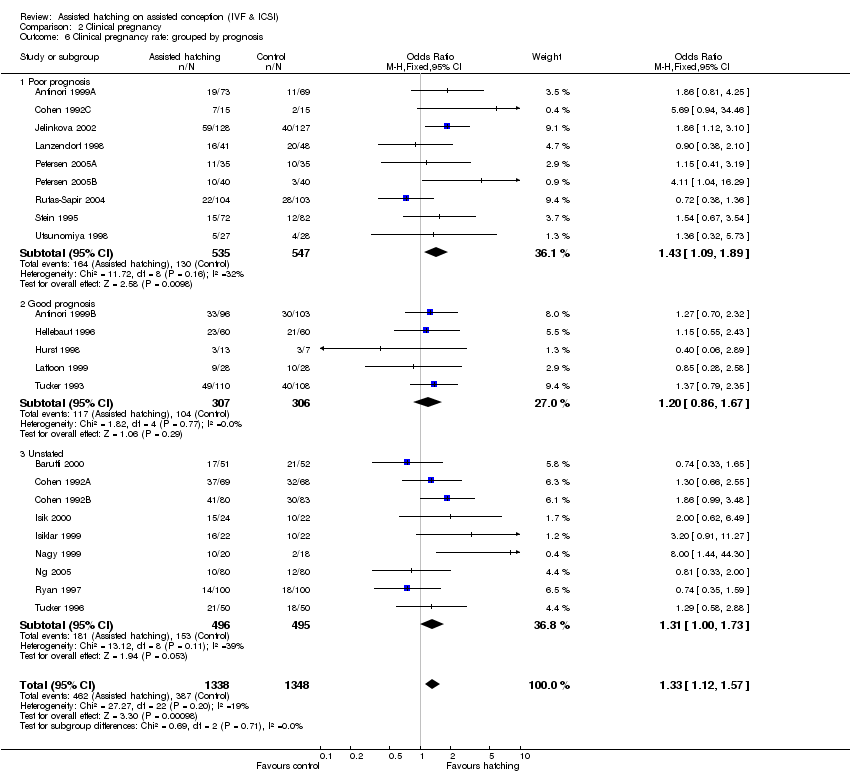
Comparison 2 Clinical pregnancy, Outcome 6 Clinical pregnancy rate: grouped by prognosis.

Comparison 2 Clinical pregnancy, Outcome 7 Clinicial pregnancy rate per woman randomised: subgrouped extent of assisted hatching.

Comparison 3 Miscarriage rate, Outcome 1 Miscarriage per woman randomised.

Comparison 3 Miscarriage rate, Outcome 2 Miscarriage rate per woman randomised: grouped by 1st or repeat attempt.
Comparison 3 Miscarriage rate, Outcome 3 Miscarriage rate per woman randomised: grouped by ICSI or IVF.
Comparison 3 Miscarriage rate, Outcome 4 Miscarriage rate per woman randomised: grouped by method of assisted hatching used.
Comparison 3 Miscarriage rate, Outcome 5 Miscarriage rate per woman: grouped by age>= 35 years.
Comparison 3 Miscarriage rate, Outcome 6 Miscarriage rate per woman: grouped by prognosis.
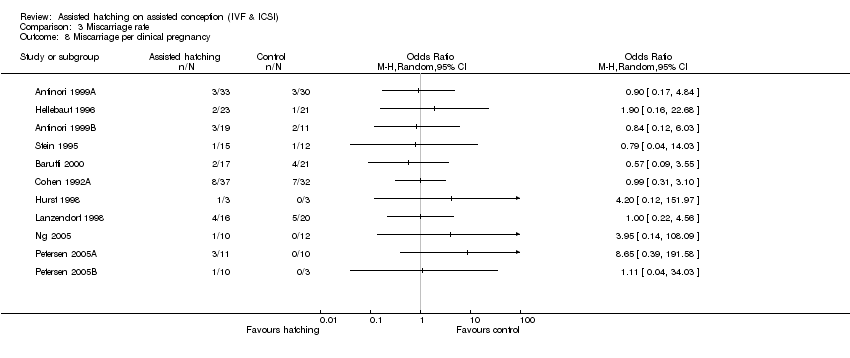
Comparison 3 Miscarriage rate, Outcome 8 Miscarriage per clinical pregnancy.
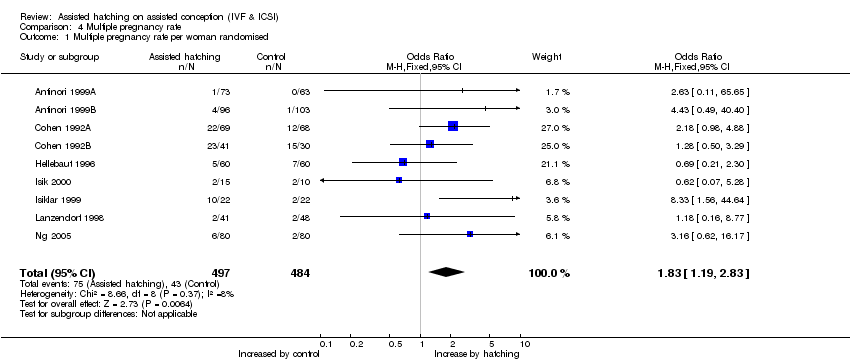
Comparison 4 Multiple pregnancy rate, Outcome 1 Multiple pregnancy rate per woman randomised.
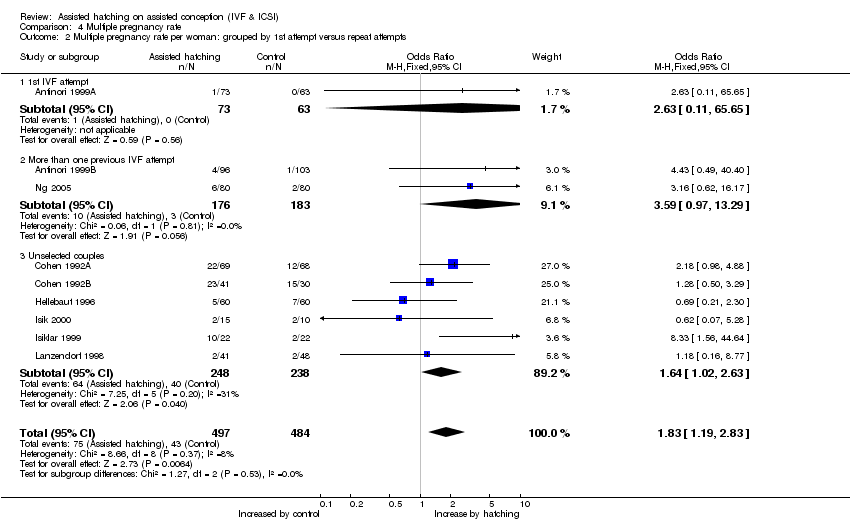
Comparison 4 Multiple pregnancy rate, Outcome 2 Multiple pregnancy rate per woman: grouped by 1st attempt versus repeat attempts.
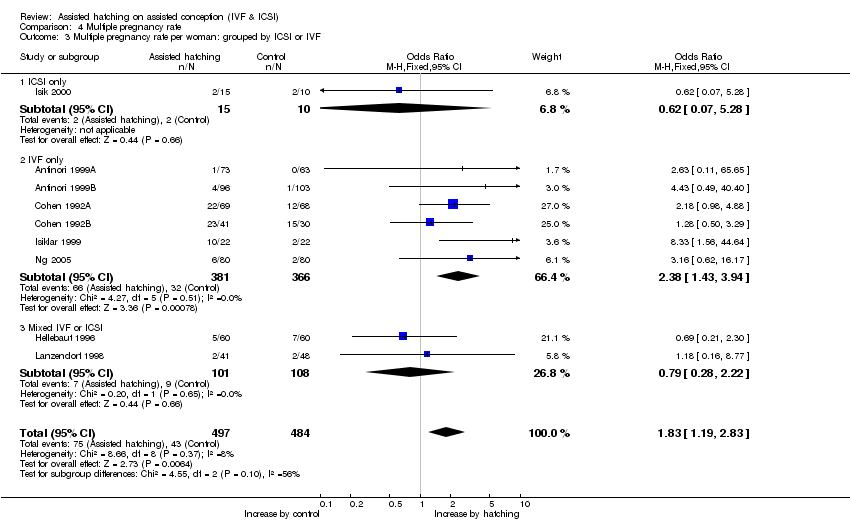
Comparison 4 Multiple pregnancy rate, Outcome 3 Multiple pregnancy rate per woman: grouped by ICSI or IVF.
Comparison 4 Multiple pregnancy rate, Outcome 4 Multiple pregnancy rate per woman: grouped by method of assisted hatching used.

Comparison 4 Multiple pregnancy rate, Outcome 5 Multiple pregnancy rate per woman: grouped by age>=35 years old.

Comparison 4 Multiple pregnancy rate, Outcome 6 Multiple pregnancy rate per woman: grouped by prognosis.

Comparison 4 Multiple pregnancy rate, Outcome 7 Multiple pregnancy rate per woman grouped by extent of assisted hatching.

Comparison 4 Multiple pregnancy rate, Outcome 8 Multiple pregnancy per pregnancy.

Comparison 5 Monozygotic twinning rate, Outcome 1 Monozygotic twinning per woman randomised.

Comparison 7 Implantation rate (gestation sac/embryo transfer), Outcome 1 Number of gestation sacs per embryo transferred.
| Study ID | Allocation concealed | Randomisation method | Blinding | Follow up complete | No. embryos transfer | Day of randomisat |
| Antinori 1999A | Unclear | Unclear | Unclear | Unknown | AH 4.3 Control 4.4 | Not stated |
| Antinori 1999B | Unclear | Unclear | No | Unknown | AH 2.3, control 2.4 | Not stated |
| Baruffi 2000 | no | Randomisation table | No | Unknown | AH 2.76, Control 2.87 | Not stated |
| Chao 1997 | Unclear | Unclear | No | Unknown | AH 5.8, control 5.7 | Not stated |
| Cohen 1992A | No | Preprinted randomisation list | Yes ‐ double | Unknown | AH 3.4, control 3.5 | Not stated |
| Cohen 1992B | No | Preprinted randomisation list | Yes ‐ double | Unknown | AH 3.4, Control 3.5 | Not stated |
| Cohen 1992C | No | Preprinted randomisation list | Yes ‐ double | Unknown | No data | Not stated |
| Hellebaut 1996 | Unclear | Computer randomised | No | Unknown | AH 4.0, Control 4.0 | Day of embryo transfer |
| Hurst 1999 | Unclear | Computer randomised | No | Unknown | AH 4.0, Control 4.0 | Not stated |
| Isik 2000 | Unclear | Random numbers table | No | Unknown | Blastocyst transfer AH 2.86, Control 2.95 | Randomised on day 3 |
| Isiklar 1999 | Unclear | Unclear | No | Unknown | AH 3.7, Control 3.5 NB Blastocyst transfer | Randomised on day 3 |
| Jelinkova 2002 | Unclear | Unclear | Unclear | Yes | AH 2.2, Control 2.2 | Not stated |
| Laffoon 1999 | Unclear | Unclear | No | Unknown | Not stated | Day of Hcg administration |
| Lanzendorf 1998 | Sealed envelope | Unclear | Yes ‐ double | Yes | AH 4.4, Control 4.4 | Day of aspiration |
| Mansour 2000B | Unclear | Unclear 3:4 ratio | No | Unknown | AH 3.9, Control 3.8 | Day of embryo transfer |
| Nagy 1999 | Unclear | Unclear | No | Unknown | Not stated | Not stated |
| Ng 2005 | Sealed envelopes | Computer generated | Yes ‐ double until completion of the whole study | Yes | AH ‐ transfered 2 in 52% and 3 in 41%, control transfered 2 in 36% and 3 in 61%. | Day of frozen embryo transfer |
| Petersen 2005A | Unclear | Random numbers table to be allocated into experimental or control | Code numbers used to identify patients but no true blinding | yes | yes ‐ mean of 2.7 | Not stated |
| Petersen 2005B | Unclear | Random numbers table to be allocated into experimental or control | Code numbers used to identify patients but no true blinding | yes | yes ‐ mean of 30 | Not stated |
| Rufas‐Sapir 2004 | Unclear | Unclear | Unclear | yes | AH 3.4 ETs, control 3.7 | Day of embryo transfer |
| Ryan 1996 | Unclear | Random numbers table | Unclear | yes | mean 2.17 | Not stated |
| Stein 1995 | Unclear | Unclear | No | yes | Not stated | Not stated |
| Tucker 1993 | Unclear | Unclear | Unclear | yes | AH 2.9, control 3.0 | Not stated |
| Tucker 1996 | Unclear | Unclear | Unclear | yes | AH 3.4, control 3.6 | Not stated |
| Utsinomiya 1998 | Unclear | Unclear | Unclear | yes | Not stated | Not stated |
| Study | n, mean age (sd) AH | n, mean age (sd) con | WMD (95% CI) | OR for clinical preg |
| Baruffi 2000 | 51, 31.80 (3.60) | 52, 31.40 (3.60) | 0.40 (‐0.99 to 1.79) | 0.74 (0.33‐1.65) |
| Cohen 1992A | 39, 36.50 (3.30) | 68, 36.70 (3.70) | ‐0.20 (‐1.37 to 0.97) | 1.30 (0.66‐2.55) |
| Hellebaut 1996 | 60, 30.90 (4.30) | 60, 30.80 (3.90) | 0.10 (‐1.37 to 1.57) | 1.15 (0.55‐2.43) |
| Hurst 1998 | 13, 30.00 (0.90) | 7, 30.00 (0.80) | 0.00 (‐0.77 to 0.77) | 0.40 (0.06‐2.89) |
| Isik 2000 | 24, 30.50 (5.20) | 22, 29.10 (3.60) | 1.40 (‐1.17 to 3.97) | 2.0 (0.62‐6.49) |
| Jelinkova | 128, 32.3 (4.24) | 127, 32.1 (3.16) | 0.20 (‐0.72‐1.12) | 1.86 (1.12‐3.10) |
| Lanzendorf 1998 | 41, 38.30 (0.31) | 48, 38.50 (0.26) | ‐0.20 (‐0.32 to ‐0.08) | 0.90 (0.38‐2.10) |
| Mansour 2000B | 30, 37.30 (5.60) | 41, 36.30 (5.20) | 1.00 (‐1.56 to 3.56) | 3.86 (0.91‐16.41) |
| Nagy 1999 | 20, 32.00 (4.00) | 20, 31.40 (3.70) | 0.60 (‐1.79 to 2.99) | 8.0 (1.44‐44.3) |
| Ng 2005 | 80, 34 (25‐40) (range) | 80, 34 (24‐40) | 0.00 (‐1.57 ‐ 1.57) needs checking about the SD from a range | 0.81 (0.33‐2.00) |
| Petersen 2005A | 35, 34.6 (4.6) | 35, 34.1 (5.3) | 0.50 (‐1.82, 2.82) | 1.15 (0.41‐3.19) |
| Petersen 2005B | 40, 35.7 (3.8) | 40, 35.3 (5.1) | 0.40 (‐1.57‐2.37) | 4.11 (1.04‐16.29) |
| Tucker 1993 | 110, 34.10 (4.80) | 108, 34.20 (4.10) | ‐0.10 (‐1.28 to 1.08) | 1.37 (0.79‐2.35) |
| Tucker 1996 | 50, 35.30 (4.20) | 50, 33.50 (4.30) | 1.80 (0.13 to 3.47) | 0.74 (0.35‐1.59) |
| Outcome | Analysis type | Description | No. of studies | OR (fixed effects) | 95% CI | heterogeneity p |
| Live births, per woman randomised | Overall meta‐analysis | 6 | 1.19 | 0.81 to 1.73 | 0.27 | |
| Live births, per woman randomised | Sensitivity analysis | Allocation concealment | 1 | 0.91 | 0.37 to 2.26 | ‐ |
| Live births, per woman randomised | Sensitivity analysis | Method of randomisation | 5 | 1.04 | 0.66 to 1.65 | 0.26 |
| Live births, per woman randomised | Sensitivity analysis | Balanced reporting of age | 5 | 1.25 | 0.83 to 1.90 | 0.19 |
| Clinical pregnancy, per woman randomised | Overall meta‐analysis | 23 | 1.33 | 1.12 to 1.57 | 0.20 | |
| Clinical pregnancy, per woman randomised | Sensitivity analysis | Allocation concealment | 2 | 0.85 | 0.49 to 1.59 | 0.87 |
| Clinical pregnancy, per woman randomised | Sensitivity analysis | Method of randomisation | 9 | 1.15 | 0.88 to 1.50 | 0.38 |
| Clinical pregnancy, per woman randomised | Sensitivity analysis | Balanced reporting of age | 12 | 1.49 | 1.21 to 1.85 | 0.18 |
| Outcome or subgroup title | No. of studies | No. of participants | Statistical method | Effect size |
| 1 Live birth per woman randomised Show forest plot | 6 | 516 | Odds Ratio (M‐H, Fixed, 95% CI) | 1.19 [0.81, 1.73] |
| 2 Live birth rate per women randomised: grouped by 1st attempt and repeat attempts Show forest plot | 6 | 516 | Odds Ratio (M‐H, Fixed, 95% CI) | 1.19 [0.81, 1.73] |
| 2.1 First attempt at IVF or ICSI | 1 | 20 | Odds Ratio (M‐H, Fixed, 95% CI) | 0.24 [0.03, 2.03] |
| 2.2 Repeat attempt at IVF or ICSI | 2 | 150 | Odds Ratio (M‐H, Fixed, 95% CI) | 1.40 [0.62, 3.14] |
| 2.3 Unselected | 3 | 346 | Odds Ratio (M‐H, Fixed, 95% CI) | 1.21 [0.78, 1.88] |
| 3 Live birth rate per women randomised: grouped by ICSI cycles versus IVF cycles Show forest plot | 6 | 516 | Odds Ratio (M‐H, Fixed, 95% CI) | 1.19 [0.81, 1.73] |
| 3.1 ICSI only | 2 | 150 | Odds Ratio (M‐H, Fixed, 95% CI) | 1.40 [0.62, 3.14] |
| 3.2 IVF only | 2 | 157 | Odds Ratio (M‐H, Fixed, 95% CI) | 1.31 [0.69, 2.47] |
| 3.3 Mixed ICSI and IVF | 2 | 209 | Odds Ratio (M‐H, Fixed, 95% CI) | 1.01 [0.56, 1.80] |
| 4 Live birth rate per women randomised: grouped by method of assisted hatching used Show forest plot | 6 | 516 | Odds Ratio (M‐H, Fixed, 95% CI) | 1.19 [0.81, 1.73] |
| 4.1 Chemical | 4 | 366 | Odds Ratio (M‐H, Fixed, 95% CI) | 1.13 [0.74, 1.74] |
| 4.2 Laser | 2 | 150 | Odds Ratio (M‐H, Fixed, 95% CI) | 1.40 [0.62, 3.14] |
| 4.3 Mechanical | 0 | 0 | Odds Ratio (M‐H, Fixed, 95% CI) | 0.0 [0.0, 0.0] |
| 5 Live birth rate: grouped by prognosis Show forest plot | 6 | 516 | Odds Ratio (M‐H, Fixed, 95% CI) | 1.19 [0.81, 1.73] |
| 5.1 Poor prognosis | 4 | 376 | Odds Ratio (M‐H, Fixed, 95% CI) | 1.32 [0.84, 2.07] |
| 5.2 Good prognosis | 2 | 140 | Odds Ratio (M‐H, Fixed, 95% CI) | 0.91 [0.45, 1.83] |
| 5.3 Not stated | 0 | 0 | Odds Ratio (M‐H, Fixed, 95% CI) | 0.0 [0.0, 0.0] |
| Outcome or subgroup title | No. of studies | No. of participants | Statistical method | Effect size |
| 1 Clinical pregnancy rate per woman randomised Show forest plot | 23 | 2686 | Odds Ratio (M‐H, Fixed, 95% CI) | 1.33 [1.12, 1.57] |
| 2 Clinical pregnancy rate per woman randomised: grouped by 1st attempt and repeat attempts Show forest plot | 23 | 2686 | Odds Ratio (M‐H, Fixed, 95% CI) | 1.33 [1.12, 1.57] |
| 2.1 First attempt at IVF or ICSI | 4 | 378 | Odds Ratio (M‐H, Fixed, 95% CI) | 0.97 [0.63, 1.49] |
| 2.2 Repeat attempt at IVF or ICSI | 7 | 963 | Odds Ratio (M‐H, Fixed, 95% CI) | 1.46 [1.08, 1.96] |
| 2.3 Unselected or mixed | 12 | 1345 | Odds Ratio (M‐H, Fixed, 95% CI) | 1.37 [1.09, 1.73] |
| 3 Clinical pregnancy rate: grouped by ICSI versus IVF cycles Show forest plot | 23 | 2686 | Odds Ratio (M‐H, Fixed, 95% CI) | 1.33 [1.12, 1.57] |
| 3.1 ICSI only | 5 | 399 | Odds Ratio (M‐H, Fixed, 95% CI) | 1.30 [0.85, 1.99] |
| 3.2 IVF only | 13 | 1785 | Odds Ratio (M‐H, Fixed, 95% CI) | 1.39 [1.13, 1.70] |
| 3.3 Mixed ICSI and IVF | 5 | 502 | Odds Ratio (M‐H, Fixed, 95% CI) | 1.12 [0.75, 1.68] |
| 4 Clinical pregnancy rate: grouped by method of assisted hatching used Show forest plot | 23 | 2686 | Odds Ratio (M‐H, Fixed, 95% CI) | 1.33 [1.12, 1.57] |
| 4.1 Chemical | 12 | 1433 | Odds Ratio (M‐H, Fixed, 95% CI) | 1.38 [1.11, 1.73] |
| 4.2 Laser | 7 | 792 | Odds Ratio (M‐H, Fixed, 95% CI) | 1.36 [0.98, 1.88] |
| 4.3 Mechanical | 4 | 461 | Odds Ratio (M‐H, Fixed, 95% CI) | 1.09 [0.71, 1.66] |
| 5 Clinical pregnancy rate: grouped by age >=35 years Show forest plot | 6 | 697 | Odds Ratio (M‐H, Fixed, 95% CI) | 1.13 [0.81, 1.57] |
| 5.1 Age >= 35 years old | 4 | 362 | Odds Ratio (M‐H, Fixed, 95% CI) | 1.54 [0.94, 2.51] |
| 5.2 Age < 35 years old | 4 | 335 | Odds Ratio (M‐H, Fixed, 95% CI) | 0.85 [0.53, 1.35] |
| 6 Clinical pregnancy rate: grouped by prognosis Show forest plot | 23 | 2686 | Odds Ratio (M‐H, Fixed, 95% CI) | 1.33 [1.12, 1.57] |
| 6.1 Poor prognosis | 9 | 1082 | Odds Ratio (M‐H, Fixed, 95% CI) | 1.43 [1.09, 1.89] |
| 6.2 Good prognosis | 5 | 613 | Odds Ratio (M‐H, Fixed, 95% CI) | 1.20 [0.86, 1.67] |
| 6.3 Unstated | 9 | 991 | Odds Ratio (M‐H, Fixed, 95% CI) | 1.31 [1.00, 1.73] |
| 7 Clinicial pregnancy rate per woman randomised: subgrouped extent of assisted hatching Show forest plot | 23 | 2686 | Odds Ratio (M‐H, Fixed, 95% CI) | 1.33 [1.13, 1.57] |
| 7.1 Thinning only | 6 | 686 | Odds Ratio (M‐H, Fixed, 95% CI) | 1.20 [0.85, 1.69] |
| 7.2 Breach by hole only | 15 | 1699 | Odds Ratio (M‐H, Fixed, 95% CI) | 1.28 [1.04, 1.58] |
| 7.3 Complete removal of zona | 2 | 301 | Odds Ratio (M‐H, Fixed, 95% CI) | 1.93 [1.21, 3.09] |
| Outcome or subgroup title | No. of studies | No. of participants | Statistical method | Effect size |
| 1 Miscarriage per woman randomised Show forest plot | 12 | 1320 | Odds Ratio (M‐H, Fixed, 95% CI) | 1.23 [0.73, 2.05] |
| 2 Miscarriage rate per woman randomised: grouped by 1st or repeat attempt Show forest plot | 12 | 1320 | Odds Ratio (M‐H, Fixed, 95% CI) | 1.23 [0.73, 2.05] |
| 2.1 First attempt at IVF or ICSI | 3 | 322 | Odds Ratio (M‐H, Fixed, 95% CI) | 0.82 [0.28, 2.44] |
| 2.2 More than one previous IVF or ICSI cycle | 5 | 606 | Odds Ratio (M‐H, Fixed, 95% CI) | 2.39 [0.78, 7.29] |
| 2.3 Unselected couples | 4 | 392 | Odds Ratio (M‐H, Fixed, 95% CI) | 1.08 [0.54, 2.20] |
| 3 Miscarriage rate per woman randomised: grouped by ICSI or IVF Show forest plot | 12 | 1320 | Odds Ratio (M‐H, Fixed, 95% CI) | 1.27 [0.76, 2.13] |
| 3.1 ICSI only | 4 | 299 | Odds Ratio (M‐H, Fixed, 95% CI) | 1.21 [0.48, 3.05] |
| 3.2 IVF only | 6 | 812 | Odds Ratio (M‐H, Fixed, 95% CI) | 1.27 [0.62, 2.63] |
| 3.3 Mixed ICSI and IVF | 2 | 209 | Odds Ratio (M‐H, Fixed, 95% CI) | 1.38 [0.40, 4.75] |
| 4 Miscarriage rate per woman randomised: grouped by method of assisted hatching used Show forest plot | 12 | 1320 | Odds Ratio (M‐H, Fixed, 95% CI) | 1.23 [0.73, 2.05] |
| 4.1 Chemical | 5 | 412 | Odds Ratio (M‐H, Fixed, 95% CI) | 1.11 [0.56, 2.21] |
| 4.2 Laser | 6 | 754 | Odds Ratio (M‐H, Fixed, 95% CI) | 1.41 [0.63, 3.17] |
| 4.3 Mechanical | 1 | 154 | Odds Ratio (M‐H, Fixed, 95% CI) | 1.14 [0.07, 18.58] |
| 5 Miscarriage rate per woman: grouped by age>= 35 years Show forest plot | 4 | 462 | Odds Ratio (M‐H, Fixed, 95% CI) | 1.06 [0.41, 2.71] |
| 5.1 Age >=35 years | 2 | 243 | Odds Ratio (M‐H, Fixed, 95% CI) | 0.97 [0.28, 3.35] |
| 5.2 Age < 35 years | 2 | 219 | Odds Ratio (M‐H, Fixed, 95% CI) | 1.20 [0.28, 5.09] |
| 6 Miscarriage rate per woman: grouped by prognosis Show forest plot | 8 | 931 | Odds Ratio (M‐H, Fixed, 95% CI) | 1.68 [0.81, 3.49] |
| 6.1 Poor prognosis | 5 | 592 | Odds Ratio (M‐H, Fixed, 95% CI) | 1.86 [0.75, 4.64] |
| 6.2 Good prognosis | 3 | 339 | Odds Ratio (M‐H, Fixed, 95% CI) | 1.38 [0.40, 4.76] |
| 8 Miscarriage per clinical pregnancy Show forest plot | 11 | Odds Ratio (M‐H, Random, 95% CI) | Totals not selected | |
| Outcome or subgroup title | No. of studies | No. of participants | Statistical method | Effect size |
| 1 Multiple pregnancy rate per woman randomised Show forest plot | 9 | 981 | Odds Ratio (M‐H, Fixed, 95% CI) | 1.83 [1.19, 2.83] |
| 2 Multiple pregnancy rate per woman: grouped by 1st attempt versus repeat attempts Show forest plot | 9 | 981 | Odds Ratio (M‐H, Fixed, 95% CI) | 1.83 [1.19, 2.83] |
| 2.1 1st IVF attempt | 1 | 136 | Odds Ratio (M‐H, Fixed, 95% CI) | 2.63 [0.11, 65.65] |
| 2.2 More than one previous IVF attempt | 2 | 359 | Odds Ratio (M‐H, Fixed, 95% CI) | 3.59 [0.97, 13.29] |
| 2.3 Unselected couples | 6 | 486 | Odds Ratio (M‐H, Fixed, 95% CI) | 1.64 [1.02, 2.63] |
| 3 Multiple pregnancy rate per woman: grouped by ICSI or IVF Show forest plot | 9 | 981 | Odds Ratio (M‐H, Fixed, 95% CI) | 1.83 [1.19, 2.83] |
| 3.1 ICSI only | 1 | 25 | Odds Ratio (M‐H, Fixed, 95% CI) | 0.62 [0.07, 5.28] |
| 3.2 IVF only | 6 | 747 | Odds Ratio (M‐H, Fixed, 95% CI) | 2.38 [1.43, 3.94] |
| 3.3 Mixed IVF or ICSI | 2 | 209 | Odds Ratio (M‐H, Fixed, 95% CI) | 0.79 [0.28, 2.22] |
| 4 Multiple pregnancy rate per woman: grouped by method of assisted hatching used Show forest plot | 9 | 981 | Odds Ratio (M‐H, Fixed, 95% CI) | 1.83 [1.19, 2.83] |
| 4.1 Chemical | 5 | 442 | Odds Ratio (M‐H, Fixed, 95% CI) | 1.36 [0.82, 2.25] |
| 4.2 Laser | 3 | 495 | Odds Ratio (M‐H, Fixed, 95% CI) | 3.43 [1.02, 11.54] |
| 4.3 mechanical | 1 | 44 | Odds Ratio (M‐H, Fixed, 95% CI) | 8.33 [1.56, 44.64] |
| 5 Multiple pregnancy rate per woman: grouped by age>=35 years old Show forest plot | 2 | 74 | Odds Ratio (M‐H, Fixed, 95% CI) | 1.51 [0.34, 6.70] |
| 5.1 Age >= 35 years | 1 | 44 | Odds Ratio (M‐H, Fixed, 95% CI) | 0.90 [0.12, 7.07] |
| 5.2 Age < 35 years | 1 | 30 | Odds Ratio (M‐H, Fixed, 95% CI) | 2.67 [0.26, 27.49] |
| 6 Multiple pregnancy rate per woman: grouped by prognosis Show forest plot | 4 | 544 | Odds Ratio (M‐H, Fixed, 95% CI) | 1.24 [0.53, 2.91] |
| 6.1 Poor prognosis | 2 | 225 | Odds Ratio (M‐H, Fixed, 95% CI) | 1.51 [0.29, 8.02] |
| 6.2 Good prognosis | 2 | 319 | Odds Ratio (M‐H, Fixed, 95% CI) | 1.16 [0.43, 3.11] |
| 7 Multiple pregnancy rate per woman grouped by extent of assisted hatching Show forest plot | 9 | 981 | Odds Ratio (M‐H, Fixed, 95% CI) | 1.83 [1.19, 2.83] |
| 7.1 Thinning only | 1 | 160 | Odds Ratio (M‐H, Fixed, 95% CI) | 3.16 [0.62, 16.17] |
| 7.2 breach by hole | 7 | 796 | Odds Ratio (M‐H, Fixed, 95% CI) | 1.84 [1.15, 2.92] |
| 7.3 Complete removal of zona | 1 | 25 | Odds Ratio (M‐H, Fixed, 95% CI) | 0.62 [0.07, 5.28] |
| 8 Multiple pregnancy per pregnancy Show forest plot | 9 | 394 | Odds Ratio (M‐H, Fixed, 95% CI) | 1.79 [1.11, 2.89] |
| Outcome or subgroup title | No. of studies | No. of participants | Statistical method | Effect size |
| 1 Monozygotic twinning per woman randomised Show forest plot | 4 | 524 | Odds Ratio (M‐H, Fixed, 95% CI) | 3.26 [0.14, 77.84] |
| Outcome or subgroup title | No. of studies | No. of participants | Statistical method | Effect size |
| 1 Number of gestation sacs per embryo transferred Show forest plot | 12 | Odds Ratio (M‐H, Fixed, 95% CI) | Totals not selected | |