Fecundación asistida en la reproducción asistida (fecundación in vitro [FIV] e inyección intracitoplasmática de espermatozoides [ICSI])
Resumen
Antecedentes
El fracaso de la implantación y la concepción se puede deber a la incapacidad del blastocisto de deshacerse de su capa exterior, que se conoce como zona pelúcida. La rotura artificial de esta capa se conoce como fecundación asistida y se ha propuesto como un método para mejorar el éxito de la reproducción asistida al facilitar la implantación del embrión.
Objetivos
Determinar el efecto de la fecundación asistida (FA) en embriones obtenidos por reproducción asistida sobre las tasas de nacidos vivos y embarazos múltiples.
Métodos de búsqueda
Se realizaron búsquedas en las siguientes bases de datos (desde su creación hasta ell 27 de mayo de 2020), sin restricción de idioma ni fecha: Registro Especializado del Grupo Cochrane de Ginecología y fertilidad (Cochrane Gynaecology and Fertility Group [CGFG]), CENTRAL, MEDLINE, Embase y PsycINFO. Se verificaron las listas de referencias de los estudios pertinentes y se realizaron búsquedas en los registros de ensayos.
Criterios de selección
Dos autores de la revisión identificaron y examinaron de forma independiente los ensayos. Se incluyeron los ensayos controlados aleatorizados (ECA) de FA (rotura mecánica, química o con láser de la zona pelúcida antes del reemplazo de los embriones) versus ninguna FA que informaron datos de los nacidos vivos o de embarazos clínicos.
Obtención y análisis de los datos
Se utilizaron los procedimientos metodológicos estándar recomendados por Cochrane. Dos autores de la revisión realizaron de forma independiente las evaluaciones de la calidad y la extracción de los datos.
Resultados principales
Se incluyeron 39 ECA (7249 mujeres). Todos informaron datos de los embarazos clínicos e incluyeron 2486 embarazos clínicos. Sólo 14 estudios informaron datos de los nacidos vivos, con 834 eventos de nacidos vivos. La calidad de la evidencia varió de muy baja a baja. Las limitaciones principales fueron el riesgo alto de sesgo asociado con el informe deficiente de los métodos de estudio, la inconsistencia, la imprecisión y el sesgo de publicación. Actualmente hay cinco ensayos en curso.
No se sabe con certeza si la fecundación asistida mejoró las tasas de nacidos vivos en comparación con ninguna fecundación asistida (odds ratio [OR] 1,09; intervalo de confianza [IC] del 95%: 0,92 a 1,29; 14 ECA, n = 2849; I² = 20%; evidencia de calidad baja). Este análisis indica que si la tasa de nacidos vivos en las mujeres que no utilizan la fecundación asistida es de aproximadamente el 28%, la tasa en las que utilizan la fecundación asistida estará entre el 27% y el 34%.
El análisis de las tasas de embarazo múltiple por mujer mostró que en las mujeres asignadas al azar a la FA en comparación con las mujeres asignadas al azar a ninguna FA, podría haber habido un ligero aumento de las tasas de embarazo múltiple (OR 1,38; IC del 95%: 1,13 a 1,68; 18 ECA, n = 4308; I² = 48%; evidencia de calidad baja). Lo anterior indica que si la tasa de embarazos múltiples en las mujeres que no utilizan la fecundación asistida es de aproximadamente el 9%, la tasa en las que utilizan la fecundación asistida estará entre el 10% y el 14%.
Cuando se agrupan todos los estudios incluidos (39), la tasa de embarazo clínico en las mujeres que se sometieron a FA podría mejorar ligeramente en comparación con ninguna FA (OR 1,20; IC del 95%: 1,09 a 1,33; 39 ECA, n = 7249; I² = 55%; evidencia de calidad baja). Sin embargo, cuando se utiliza un modelo de efectos aleatorios debido a la alta heterogeneidad, podría haber poca o ninguna diferencia en la tasa de embarazo clínico (p = 0,04).
Los 14 ECA que informaron las tasas de nacidos vivos también informaron las tasas de embarazo clínico, y el análisis de estos estudios ilustra que la FA podría dar lugar a pequeña o ninguna diferencia en las tasas de embarazo clínico en comparación con ninguna FA (OR 1,07; IC del 95%: 0,92 a 1,25; 14 ECA, n = 2848; I² = 45%).
No se sabe con certeza si la FA afecta las tasas de aborto espontáneo debido a la calidad de la evidencia (OR 1,13; IC del 95%: 0,82 a 1,56; 17 ECA, n = 2810; I² = 0%; evidencia de calidad muy baja).
Conclusiones de los autores
Esta actualización indica que no hay certeza acerca de los efectos de la fecundación asistida (FA) en las tasas de nacidos vivos. La FA podría provocar un aumento en el riesgo de embarazo múltiple. Los riesgos de complicaciones asociadas con el embarazo múltiple podrían aumentar sin que haya evidencia que demuestre un aumento de la tasa de nacidos vivos, lo que justifica una cuidadosa consideración del uso sistemático de la FA en las parejas que se someten a la fecundación in vitro (FIV) o a la inyección intracitoplasmática de espermatozoides (ICSI).
La FA podría ofrecer una probabilidad ligeramente mayor de lograr un embarazo clínico, pero la calidad de los datos fue de bajo grado. No se sabe con certeza si la FA influye en las tasas de abortos espontáneos.
PICO
Resumen en términos sencillos
Fecundación asistida de óvulos fecundados en la reproducción asistida (FIV e ICSI)
Pregunta de la revisión
¿La fecundación asistida (ayuda para fecundar embriones humanos en el laboratorio) durante la reproducción asistida mejora la posibilidad de lograr un embarazo y un nacido vivo, y afecta al riesgo de embarazo múltiple?
Antecedentes
La fecundación asistida es una técnica que a veces se utiliza en la reproducción asistida para la fecundación in vitro (FIV) y la inyección intracitoplasmática de espermatozoides (ICSI). Consiste en adelgazar la capa que rodea al óvulo fecundado o hacer una perforación en ella. Se ha indicado que este procedimiento podría mejorar la posibilidad de que el embrión se adhiera al útero para que el embarazo pueda comenzar.
Características de los estudios
Los autores de la revisión Cochrane incluyeron 39 ensayos controlados aleatorizados (ECA) con 7249 mujeres. Todos los estudios informaron sobre el embarazo clínico, pero sólo 14 estudios informaron sobre los nacidos vivos y sólo 18 informaron sobre el embarazo múltiple. La evidencia está actualizada hasta mayo de 2020.
Resultados clave
Esta revisión de ECA demuestra que no hay seguridad acerca de los efectos de la fecundación asistida en la tasa de nacidos vivos cuando se compara con ninguna fecundación asistida. La fecundación asistida podría aumentar ligeramente las tasas de embarazo múltiple en comparación con ninguna fecundación asistida. La fecundación asistida podría mejorar ligeramente las posibilidades de embarazo clínico en las mujeres. No hay seguridad acerca de los efectos de la fecundación asistida en el aborto espontáneo.
En el futuro, sólo se deberían realizar y financiar estudios que informen sobre los nacidos vivos y los embarazos múltiples como criterios de valoración principales.
Calidad de la evidencia
La calidad de la evidencia es baja a muy baja. Las principales limitaciones son el alto riesgo de sesgo asociado con el informe deficiente de los métodos de estudio, la inconsistencia, la imprecisión y el sesgo de publicación.
Authors' conclusions
Summary of findings
| Assisted hatching compared to no assisted hatching for women undergoing assisted conception | ||||||
| Patient or population: women undergoing assisted conception Setting: clinic | ||||||
| Outcomes | Anticipated absolute effects* (95% CI) | Relative effect | №. of participants | Quality of evidence | Comments | |
|---|---|---|---|---|---|---|
| Risk with no assisted hatching | Risk with assisted hatching | |||||
| Live births per woman randomised | 283 per 1000 | 301 per 1000 | OR 1.09 | 2849 | ⊕⊕⊝⊝ | |
| Multiple pregnancy rate per woman randomised | 91 per 1000 | 121 per 1000 | OR 1.38 | 4308 | ⊕⊕⊝⊝ | |
| Clinical pregnancy rate per woman randomised | 322 per 1000 | 363 per 1000 | OR 1.20 | 7249 | ⊕⊕⊝⊝ | |
| Miscarriage rate per woman randomised | 53 per 1000 | 60 per 1000 | OR 1.13 | 2810 | ⊕⊝⊝⊝ | |
| *The risk in the intervention group (and its 95% confidence interval) is based on the assumed risk in the comparison group and the relative effect of the intervention (and its 95% CI). | ||||||
| GRADE Working Group grades of evidence. | ||||||
| aDowngraded two levels for serious risk of bias and publication bias: in many studies, the method was unclear and information was incomplete. The main limitation was serious risk of bias associated with poor reporting of study methods. bDowngraded two levels for serious risk of bias and for serious inconsistency. cDowngraded three levels for serious risk of bias, serious inconsistency, and serious imprecision (only 158 events). | ||||||
Background
Description of the condition
The World Health Organization estimates that one in four couples in developing countries have been found to be affected by infertility (Mascarenhas 2012). Increasing numbers of couples require treatment by the assisted conception (AC) procedures of in vitro fertilisation (IVF) and intracytoplasmic sperm injection (ICSI) ‐ types of assisted reproductive technology (ART). In the UK in 2018, 54,000 women had 68,727 fresh and frozen IVF cycles at Human Fertilisation and Embryology Authority (HFEA)‐licensed fertility clinics (HFEA 2020). In 2016, across 40 European countries, a total of 156,002 cycles of IVF and 407,222 cycles of ICSI were performed, with ART infants contributing to 2.9% of all births. Following IVF and ICSI, clinical pregnancy rates per transfer were 34.8% and 33.2%, respectively (ESHRE‐ European IVF monitoring consortium 2020).
The European Society of Human Reproduction and Embryology (ESHRE) reported that the most important indicator of success of ART treatment is the birth of a single healthy child (Land 2003). Following this, the Harbin Consensus Conference Workshop Group developed a modified Consolidated Standards of Reporting Trials (CONSORT) statement for infertility trials and recommended that the preferred primary outcome of all infertility trials is live birth (defined as any delivery of a live infant at ≥ 20 weeks' gestation) (Harbin Consensus Conference Workshop Group 2014).
Numerous innovations have improved assisted reproduction outcomes; these include laboratory technologies to improve fertilisation, cryopreservation techniques, blastocyst transfers to improve success (Glujovsky 2016), pre‐genetic testing (Sengupta 2012), and time lapse embryo imaging, which provides a better selection of embryos for transfer (Freour 2012).
To improve ART outcomes, a receptive endometrium in the presence of a good quality embryo is important for achieving a successful pregnancy. The quality of the transferred embryos may be affected by genetic disorders, issues with hatching (zona pellucida harding), and poor laboratory cultural conditions.
The human oocyte and early embryo is surrounded by a 13‐ to 15‐μm‐thick acellular matrix, the zona pellucida (ZP) (Bleil 1980), which is composed of glycoproteins, carbohydrates, and zona pellucida‐specific proteins (ZP1, ZP2, ZP3, ZP4) (Lefievre 2004). The zona pellucida is bi‐layered; the outer layer is thick, whereas the inner layer is thin but resilient. It is involved in sperm binding and induction of the acrosome reaction, and it promotes oocyte fusion (Gupta 2015). Following fertilisation, the zona pellucida blocks polyspermy, prevents blastomere dispersal, and helps in oviductal transport. It avoids contact with other cells (epithelial lining of the reproductive tract, leucocytes, spermatozoa, and other cells of the embryo). It is essential for maintaining the integrity of the pre‐compacted embryo. Compaction is the formation of structural junctions between blastomeres. Once compaction occurs, the zona pellucida is no longer essential (Hammadeh 2011). Zona hardening occurs naturally after fertilisation to ensure this threefold function. A combination of lysins produced by the cleaving embryo or the uterus and physical expansion then reduces the zona thickness in preparation for hatching. Zona hardening, although not readily quantifiable, may also be induced by in vitro culture and by in vivo aging (De Vos 2000).
After fertilisation, the zona maintains the three‐dimensional integrity of the uncompacted embryo for up to six days in early development, facilitates free passage of the compacted embryo through the fallopian tube into the uterus, and protects the embryo from micro‐organisms and immune cells (Bronson 1970). During embryonic development, fluid starts to accumulate between cells at the morulae stage. As the volume of fluid increases, a cavity gradually appears, forming the blastocoele. This normally happens between Days 4 and 5 in human embryos in vitro and is known as the blastocyst stage. Concurrently with the increase in fluid inside the blastocyst, the number of cells increases. This combination causes progressive enlargement of the blastocyst and its cavity, leading to progressive thinning of the ZP. Finally, the blastocyst breaks free of the ZP through a process called hatching (Hardarson 2012). This process occurs before implantation.
Human embryos resulting from controlled ovarian hyperstimulation develop more slowly in vitro compared to embryos in vivo. These embryos manifest a relatively high degree of cytogenetic abnormalities and cellular fragmentation and a reduced rate of blastocyst development, although maternal age and treatment protocols may influence rates (Hsu 1999). Cultured embryos also hatch and implant at lower rates than occurs naturally (Harlow 1982; Mercader 2001). It is unclear whether this is due to 'hardening' of the zona pellucida as a result of cross‐linking of its constituent ZP glycoproteins in an in vitro environment (Cohen 1991). With IVF and ICSI treatment, the possible combination of delayed embryo hatching and advanced endometrial development may present an unfavourable environment for implantation (Check 1999; Hsu 1999).
Description of the intervention
Artificial disruption of the zona pellucida is known as assisted hatching (AH) and was first suggested in the 1980s. It was subsequently observed in women undergoing embryo biopsy for pre‐implantation genetic diagnosis (Fehilly 1985). AH is a complementary technique to conventional ART and involves thinning or completely diminishing a small fraction of the outer coat of a fertilised egg or early embryo to encourage hatching and implantation in the receptive endometrium.
A variety of techniques have since been employed to assist embryo hatching, including chemical drilling of the ZP with acidic Tyrode’s medium, ZP thinning using acidic Tyrode’s, mechanical piercing of the ZP with a microneedle, known also as partial zona dissection (PZD), and mechanical expansion of the ZP via injected hydrostatic pressure, carving a hole in ZP via piezoelectric pulses and laser‐assisted zona drilling (Avella 2019). Regardless of the AH technique employed, it is important to distinguish whether the zona has remained unbreached (as in thinning), has been fully breached (when a hole is made chemically), or has been completely removed. This distinction may have implications for whether an embryo is able to undergo normal zona expansion and escape following AH (Blake 2001), as well as for subsequent monozygotic twinning (da Costa 2001; Menezo 2003; Schieve 2000). At present, laser AH is the most popular complementary ART technique (Hammadeh 2011)
How the intervention might work
Zona thickness appears to be influenced by a variety of factors including the woman's age (Balakier 2012), hormone profile, smoking, and cause of infertility. Increased ZP thickness correlates negatively with embryo implantation rates (Avella 2019, Loret de Mola 1997). Implantation of the embryo into the endometrium is initiated by hatching of the embryo from the surrounding ZP (Hardarson 2012). Failure of the embryonic zona pellucida to rupture following blastocyst expansion has been suggested as a possible contributing factor to failure of embryo implantation. To help embryos escape from their zona during blastocyst expansion, different types of assisted hatching have been proposed (De Vos 2000).
Many mechanisms by which AH could improve embryo implantation have been postulated. One of these mechanisms is AH overcoming the zona pellucida hardening caused by IVF and cell culture or cryopreservation. Additionally, some evidence indicates that embryos that have undergone zona manipulation for AH tend to implant one day earlier than unhatched embryos (Rink 1995). Finally, as suggested by Cohen 1992, artificial opening could enhance hormonal and metabolite exchange, as well as messaging between the embryo and the endometrium.
Why it is important to do this review
Zona manipulation of some form has been offered to women of advanced age and to those with high follicle‐stimulating hormone (FSH) levels, with high risk of zona hardening (as with in vitro oocyte maturation), and status post repeated implantation failure (Al‐Nuaim 2002). However, considerable uncertainty remains over whether AH significantly improves IVF and ICSI clinical outcomes and embryo implantation rates, or whether it is associated with negative consequences for embryo development and viability. Previous updates showed that AH results in an increase in clinical pregnancy rates when compared with no AH, but AH has failed to result in a statistically significant increase in live birth rates. However, few trials have reported on live birth rates. We hope that updating this review and incorporating more studies will provide more conclusive evidence of effects of AH on live birth rate particularly rather than only on clinical pregnancy rates, as well as its effects on other outcomes such as miscarriage and multiple pregnancy rates.
Objectives
To determine effects of assisted hatching (AH) of embryos derived from assisted conception on live birth and multiple pregnancy rates.
Methods
Criteria for considering studies for this review
Types of studies
Published and unpublished randomised controlled trials (RCTs) were eligible for inclusion. We excluded non‐randomised studies (e.g. studies with evidence of inadequate sequence generation such as alternate days and patient numbers), as they are associated with high risk of bias. Trials were eligible for inclusion only if data could be extracted per woman and not per cycle. We excluded trials that presented results as per cycle rather than as per woman (unless it was clear in the text that per cycle and per woman were used interchangeably). We excluded cross‐over trials, as the design is not valid in this context.
Types of participants
Eligible participants were women of all nationalities and reproductive ages undergoing assisted conception by IVF or ICSI, using their own gametes and consenting to participation in a trial of AH after fertilisation.
In the subgroup analysis, poor prognosis referred to women with increased age, previous IVF failure, high FSH, or use of frozen embryos, or it was used when the primary study protocol referred to women with a poor prognosis.
Types of interventions
Trials that investigated any known method of AH after fertilisation were included. Techniques used to disrupt the zona pellucida before embryo replacement were of the following forms.
-
Mechanical.
-
Chemical.
-
Laser.
Trials in which assisted hatching took place to the following extent were eligible.
-
Breaching the zona pellucida by a hole (by laser, chemical, or mechanical means).
-
Thinning the zona pellucida (with no actual hole created).
-
Removing the entire zona pellucida.
Trials were eligible when AH was performed on fresh embryos and cryopreserved embryos following thawing and before embryo transfer, as well as on vitrified‐warmed embryos that were transferred at the cleavage stage. The effects of these interventions were compared to those of a control by which AH was not performed.
Trials directly comparing different AH methods (without including a control group with no assisted hatching performed) were excluded because the objective of this review was to determine the overall effectiveness of the technique of AH.
We excluded biopsied embryos for purposes of pre‐genetic screening (PGS)/pre‐genetic diagnosis (PGD) during assisted reproduction because this approach aims towards embryo selection ‐ not towards increased possibility of implantation per se. As assisted hatching has been proposed to improve implantation, leading to improved clinical pregnancy and live birth rates, biopsied embryos for PGS and PGD were excluded.
Types of outcome measures
Primary outcomes
-
Live birth rate per woman
-
Multiple pregnancy rate per woman
Secondary outcomes
-
Clinical pregnancy rate per woman (defined as pregnancy diagnosed by ultrasonographic visualisation of one or more gestational sacs, or definitive clinical signs of pregnancy)
-
Miscarriage rate per woman (loss of pregnancy up to 20 weeks' gestation per woman)
-
Monozygotic twinning per woman
-
Ectopic pregnancy rate per woman
-
Congenital or chromosomal abnormalities per woman
Only trials that reported at least clinical pregnancy rate per woman were included. The first version of the review included trials with implantation as an outcome; however for this update, we have removed implantation rate as an outcome. It is not possible to pool implantation, as the data are reported per embryo. We recorded live birth as an event per woman and not by the number of infants delivered because of the large number of multiple births.
Search methods for identification of studies
We searched for all published and unpublished RCTs of AH versus no AH, without language restrictions, from inception of the databases until 27 May 2020, in consultation with the Gynaecology and Fertility Group Information Specialist.
Electronic searches
We searched the following electronic databases, trial registers, and websites:
-
Cochrane Gynaecology and Fertility (CGF) Group Specialised Register of Controlled Trials, ProCite platform, searched 27 May 2020, (Appendix 1);
-
CENTRAL, via the Cochrane Register of Studies Online (CRSO), Web platform, searched 27 May 2020, (Appendix 2);
-
MEDLINE, Ovid platform, searched from 1946 to 27 May 2020, (Appendix 3);
-
Embase, Ovid platform, searched from 1980 to 27 May 2020, (Appendix 4);
-
PsycINFO, Ovid platform, searched from 1806 to 27 May 2020,(Appendix 5).
Searching other resources
-
International trial registers: the ClinicalTrials database, a service of the US National Institutes of Health (clinicaltrials.gov/ct2/home) and the World Health Organization International Trials Registry Platform search portal (www.who.int/trialsearch/Default.aspx);
-
We also handsearched the reference lists of relevant articles retrieved by the search.
Data collection and analysis
We conducted data collection and analysis in accordance with the Cochrane Handbook for Systematic Reviews of Interventions (Higgins 2019).
Selection of studies
Two review authors (LL and SH) scanned titles and abstracts from the first searches; the same methods were adopted by another review author for the second searches. Trials that appeared relevant were selected and formally assessed for inclusion independently by three review authors using an inclusion and exclusion form. We resolved disagreements through discussion. Multiple reports of the same study were collated under a single reference. We corresponded with study investigators as required to clarify study eligibility. Trials excluded at this stage are detailed in the table Characteristics of excluded studies table. We have documented the selection process with a PRISMA flow chart (Figure 1).
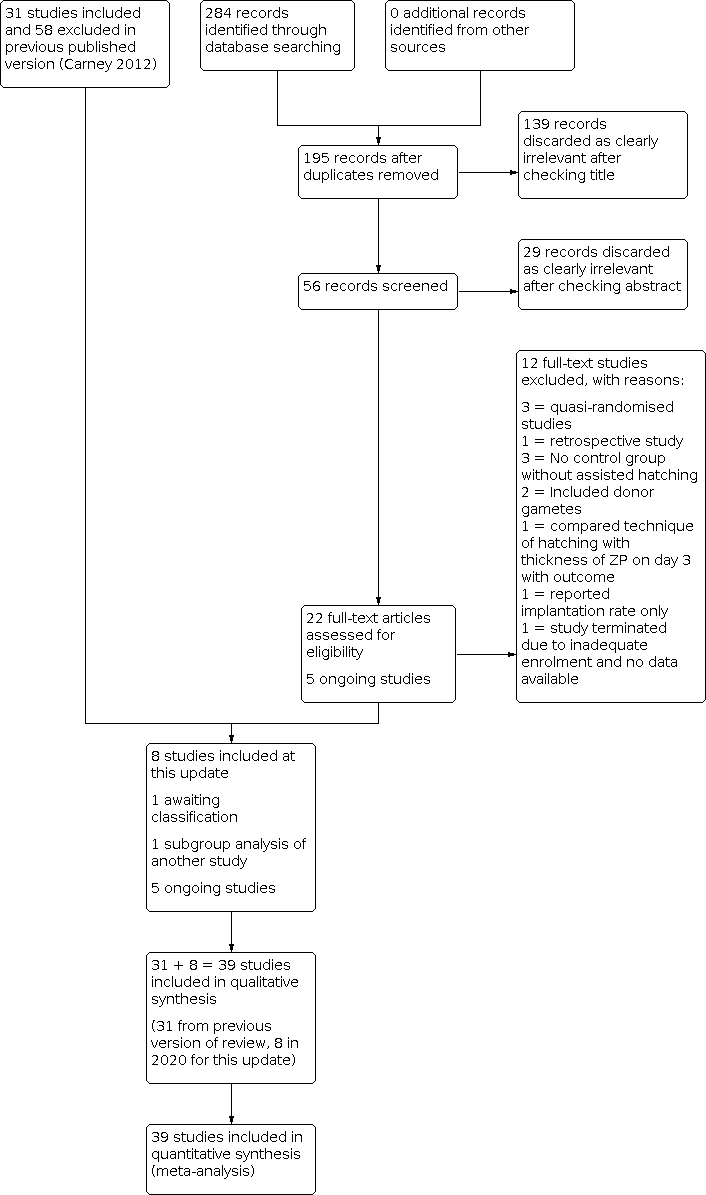
Study flow diagram.
Data extraction and management
Two review authors (LL and MAA) independently extracted data from eligible studies using the Cochrane data collection form for Intervention reviews (RCTs only) (Figure 2; Figure 3). Discrepancies in data extraction were resolved by consensus during discussions with another review author (MWS or SF).

Methodological quality graph: review authors' judgements about each methodological quality item presented as percentages across all included studies.

Methodological quality summary: review authors' judgements about each methodological quality item for each included study.
Assessment of risk of bias in included studies
Two review authors (LL and MAA) independently assessed the included studies for risk of bias using the Cochrane risk of bias assessment tool to assess allocation (random sequence generation and allocation concealment), blinding of participants and personnel, blinding of outcome assessors, incomplete outcome data, selective reporting, and other bias (http://handbook.cochrane.org). Disagreements were resolved by discussion or by a third review author (MWS or SF).
For each trial, it was determined whether adequate allocation concealment was described, and the trial was classed as being at low risk of bias if this was the case. If it was not the case, or if it was unclear how allocation concealment was achieved, the trial was classed as being at high risk or unclear risk, respectively. For each trial, we determined whether an acceptable method of sequence generation was described within the text (e.g. by stating that a computer‐generated randomisation list had been used). If this was the case, again the trial was classed as being at low risk in this respect. Similarly, if this was unclear, the trial was classed as having unclear risk of bias. We determined who was blinded in each trial. If participants and medical staff in the trial were blinded to allocation, the trial was at low risk. If this was not stated or if it was clear that this was not the case, the trial was again classed as having unclear risk or high risk of bias, respectively. Finally, selective reporting is an important issue in this review and is an important contributor to reporting bias, with only a minority of trials reporting on the primary outcome of live birth. Each trial that reported live birth was classed as low risk unless it did not report clinical pregnancy; in that case, it was reported as high risk. Each trial that did not report live birth was classed as high risk. Study authors were contacted if risks of bias were unclear to support the assessment
Measures of treatment effect
All outcomes were dichotomous, and results were expressed for each trial as an odds ratio (OR) with 95% confidence interval (CI); P values were calculated.
Unit of analysis issues
The primary analysis was per woman randomised. Data that did not allow valid analysis (e.g. 'per cycle' data) were not pooled. Multiple live births (e.g. twins, triplets) were counted as one live birth event.
Dealing with missing data
Attempts were made to obtain additional information on trial methods, actual original trial data, or both, by contacting the principal authors of the trials. Reminders were sent (when necessary) to study authors if no reply had been received four weeks after the initial request. Only available data were analysed, and no imputation of data was undertaken.
Assessment of heterogeneity
Consideration of the clinical and methodological characteristics of included studies was undertaken to ascertain if they were sufficiently similar for meta‐analysis to provide a clinically meaningful result. Heterogeneity between the results of different trials was examined using the I² statistic. Statistical heterogeneity was deemed significant if the P value was ≤ 0.1, that is, an indication of greater variation than would be expected by chance. I² values were also examined, and higher values (> 40%) were taken to indicate high heterogeneity (Higgins 2019).
Assessment of reporting biases
In view of the difficulty of detecting and correcting for publication bias and other reporting biases, review authors aimed to minimise their potential impact by ensuring a comprehensive search for eligible studies, and by staying alert for duplication of data. If 10 or more studies were included in an analysis, we planned to use a funnel plot to explore the possibility of small‐study effects (a tendency for estimates of the intervention effect to be more beneficial in smaller studies). Asymmetry can be found in funnel plots, especially when high heterogeneity is noted. Asymmetry detected in a funnel plot would probably be due to true heterogeneity (Stuck 1998).
Data synthesis
Studies were combined via meta‐analysis using a fixed‐effect model for AH versus no AH with RevMan 5.4 software (RevMan 2020). An increase in the odds of a particular outcome was displayed graphically in the meta‐analyses to the right of the centre‐line, and a decrease in the odds of an outcome was displayed to the left of the centre‐line.
Subgroup analysis and investigation of heterogeneity
The following subgroup analyses were undertaken for the 2012 and 2020 updates.
-
Number of attempts: first or repeat attempt at assisted conception.
-
Mode of assisted conception: IVF or ICSI.
-
Method of assisted hatching: chemical, laser, or mechanical.
-
Prognosis of woman: good or poor.
-
Extent of AH: thinning, breaching, complete removal of zona pellucida.
-
Type of embryo: fresh or frozen embryo transfer (frozen embryo transfer included thawed cryopreserved and vitrified‐warm embryo).
Sensitivity analysis
We performed sensitivity analysis to examine the stability of results for our primary outcomes and for clinical pregnancy, in relation to:
-
adequacy of allocation concealment, by removing trials with unclear or inadequate allocation concealment; and
-
adequacy of the randomisation process, by removing trials for which the method of randomisation was unclear.
Summary of findings and assessment of the certainty of the evidence
We prepared a Summary of findings table using GRADEpro and Cochrane methods (Higgins 2011; GRADEpro GDT 2015).This table evaluated the overall quality of the body of evidence for the main review outcomes (live birth, multiple pregnancy, clinical pregnancy and miscarriage) for the main review comparison (assisted hatching versus no assisted hatching). We assessed the quality of the evidence using GRADE criteria: risk of bias, consistency of effect, imprecision, indirectness and publication bias). Judgements about evidence quality (high, moderate, low or very low) were be made by two review authors working independently (LL and MAA), with disagreements resolved by discussion. Judgements were justified, documented, and incorporated into reporting of results for each outcome. We planned to extract study data, format our comparisons in data tables and prepare a summary of findings table before writing the results and conclusions of our review.
Results
Description of studies
Results of the search
In our updated search in 2020, we identified 284 discrete records, of which 22 were examined in full text as they were potentially eligible. Twelve were excluded in 2020 as they did not meet our inclusion criteria, one was identified as a subgroup analysis of an included study (Desai 2013; Hagemann 2010), and one is awaiting classification (Elnahas A 2018); therefore eight were eligible for inclusion. The previous version of the review included 31 studies and excluded 58 studies, so altogether there are now 39 included studies and 70 excluded studies (Figure 1). Five ongoing trials are registered at http://www.clinicaltrials.gov (a service of the US National Institutes of Health) and at http://www.who.int/trialsearch/Default.aspx (The World Health Organization International Trials Registry Platform search portal) (see Characteristics of ongoing studies).
All included trials were described in published reports (full papers or abstracts). One included study was published in Spanish (González‐Ortega 2015), and one excluded study was published in Chinese (Lu 2016). In total, the studies included in our review recruited a total of 7249 women undergoing IVF or ICSI: 3688 women in the assisted hatching groups and 3561 women in the control groups.
Included studies
Study design and setting
We included a total of 39 studies, including eight new studies for this update (Abulsoud 2019; Elnahas 2017; González‐Ortega 2015; Nada 2018; Razi 2013; Safari 2017; Shi 2016; Wan 2014) (Figure 1).
The trials were carried out in 17 different countries: USA (Carter 2003; Cohen 1992; Hagemann 2010; Hurst 1998; Laffoon 1999; Lanzendorf 1998; Sagoskin 2007; Tucker 1993; Tucker 1996), Italy (Antinori 1999; Nagy 1999), Belgium (Hellebaut 1996), Turkey (Balaban 2006; Ciray 2005; Isik 2000; Isiklar 1999; Kutlu 2010), Brazil (Baruffi 2000; Petersen 2005), Australia (Ryan 1997), Germany (Jelinkova 2002), China (Fang 2010; Ge 2008; Ng 2005; Shi 2016; Wan 2014), Japan (Utsunomiya 1998), Israel (Rufas‐Sapir 2004; Stein 1995), Iran (Razi 2013; Safari 2017; Valojerdi 2010), Canada (Balakier 2009), Egypt (Abulsoud 2019; Elhelw 2005; Elnahas 2017; Nada 2018), and Mexico (González‐Ortega 2015). One European multi‐centre study involved women at IVF centres in Switzerland, France, Germany, and Spain (Germond 2004).
Participants
The age of participants ranged from 27 to 42 years (when reported). Some trials had subgroup data within them (e.g. Elnahas 2017; Ge 2008; Germond 2004; Kutlu 2010; Rufas‐Sapir 2004; Shi 2016; Stein 1995; and Tucker 1996 presented pregnancy for different age groups), whilst other studies included only women 35 years of age and older (e.g. González‐Ortega 2015; Lanzendorf 1998) or younger than 35 years old (Antinori 1999; Hurst 1998). Other studies included women of other specific age groups, for example, 38 years of age or younger (Balakier 2009; Hagemann 2010). Subgroup analysis based on age of the women has not been achievable, as studies did not categorise age groups in a universal way.
Fourteen trials included women with a poor prognosis (Abulsoud 2019; Antinori 1999; Cohen 1992; Elhelw 2005; Ge 2008; Germond 2004; González‐Ortega 2015; Jelinkova 2002; Kutlu 2010; Lanzendorf 1998; Petersen 2005; Rufas‐Sapir 2004; Stein 1995; Utsunomiya 1998). Fourteen trials included women with a good prognosis (Antinori 1999; Balakier 2009; Carter 2003; Ciray 2005; Cohen 1992; Elnahas 2017; Ge 2008; Hellebaut 1996; Hurst 1998; Kutlu 2010; Laffoon 1999; Nada 2018; Sagoskin 2007; Tucker 1993), and the remaining studies did not provide information.
Interventions
Twelve trials were repeat cycles, and eight included women undergoing their first assisted reproductive technology (ART) cycle; 19 trials did not report whether the treatment cycle was a first or repeat cycle or were mixed cycles. A total of 12 trials included women undergoing ICSI alone, 15 were IVF only, and the rest were unstated or included mixed ICSI and IVF cycles. Twenty‐eight trials involved transfer of fresh embryos exclusively, nine involved frozen or vitrified‐warmed embryos only, two used fresh and frozen embryos (Germond 2004; Ge 2008), and one study used a combination of fresh and frozen embryos (Ryan 1997).
Eleven trials employed chemical means for assisted hatching, five employed mechanical means, and 23 employed laser.
Seventeen trials utilised a breach of the zona pellucida with a hole (Antinori 1999; Cohen 1992; Germond 2004; Hagemann 2010; Hellebaut 1996; Hurst 1998; Isiklar 1999; Laffoon 1999; Lanzendorf 1998; Nagy 1999; Razi 2013; Rufas‐Sapir 2004; Ryan 1997; Sagoskin 2007; Stein 1995; Tucker 1996; Wan 2014), a further 17 utilised non‐breach thinning (Abulsoud 2019; Balaban 2006; Balakier 2009; Baruffi 2000; Ciray 2005; Elhelw 2005; Elnahas 2017; Ge 2008; Kutlu 2010; Nada 2018; Ng 2005; Petersen 2005; Safari 2017; Shi 2016; Tucker 1996; Utsunomiya 1998; Valojerdi 2010), and two performed complete zona removal (Isik 2000; Jelinkova 2002). For two studies, this was unknown (Carter 2003; González‐Ortega 2015), whilst another study used a new method of AH whereby the zona pellucida was expanding mechanically (Fang 2010). Three trials reported the thickness of the zona pellucida (in each case, choosing zona thickness > 12 µm as an inclusion criterion).
Twenty‐five trials reported the interval between AH and embryo transfer (20 trials reported less than four hours; three trials, four to eight hours; and two, longer than eight hours).
Blastocyst transfer occurred in four trials (Isik 2000; Isiklar 1999; Laffoon 1999; Wan 2014), one of which involved complete zona removal (Isik 2000).
Outcomes
Outcome measures utilised for this review were reported by varying numbers of trials.
-
14 trials reported live birth rate.
-
18 trials reported multiple pregnancy rate.
-
39 trials reported clinical pregnancy rate.
-
17 trials reported miscarriages.
-
6 trials reported monozygotic twinning.
-
5 trials reported ectopic pregnancy.
-
3 trials reported congenital or chromosomal abnormalities, or both.
-
3 trials reported embryo damage.
-
No trials reported in vitro blastocyst development post AH.
Further details about the included trials are provided in the Characteristics of included studies table and in Table 1 and Table 2.
| Study | AH n, mean age (SD) | Control n, mean age (SD) | OR for clinical pregnancy |
|---|---|---|---|
| 65, 39.2 (1.2) | 65, 39.5 (1.2) | 2.50 (1.14 to 5.49) | |
| Antinori 1999: first IVF | 73, 37.5 | 69, 36.0 | 1.27 (0.70 to 2.32) |
| Antinori 1999: repeat IVF | 96, 27.5 | 103, 27 | 1.86 (0.81 to 4.25) |
| 183, 32.4 (3.3) | 183, 32.7 (3.1) | 1.85 (1.19 to 2.86) | |
| 45, 32.5 (3.8) | 39, 33.8 (3.2) | 0.64 (0.27 to 1.55) | |
| 51, 31.8 (3.6) | 52, 31.4 (3.6) | 0.74 (0.33 to 1.65) | |
| 121, 34 (3.3) | 82, 34 (3.2) | 0.95 (0.54 to 1.67) | |
| 60, 33.1 (4.2) | 30, 34.0 (3.7) | 0.62 (0.26 to 1.49) | |
| Cohen 1992: FSH < 15 | 69, 36.50 (3.30) | 68, 36.70 (3.70) | 2.11 (1.18 to 3.77) |
| Cohen 1992: poor prognosis | 80, 36.7 (4.3) | 83, 35.3 (4.2) | 1.30 (0.66 to 2.55) |
| Cohen 1992: FSH > 15 | not stated | not stated | 1.30 (0.66 to 2.55) |
| not stated | not stated | 1.77 (0.52 to 6.01) | |
| 80, 31.0 (4.7) | 80, 31.7 (4.9) | 1.58 (0.81 to 3.08) | |
| 61, 32.3 (3.4) | 64, 32.1 (3.6) | 2.37 (1.07 to 5.28) | |
| Ge 2008: fresh embryo | 387, 31.08 (4.68) | 373, 30.44 (4.15) | 0.99 (0.74 to 1.32) |
| Ge 2008: frozen embryo | 100, 31.84 (3.85) | 100, 30.66 (4.42) | 2.05 (0.99 to 4.22) |
| Germond 2004: first cycle of frozen‐thawed embryos | 62, 32.8 (4.2) | 53, 32.6 (3.8) | 0.09 (0.01 to 0.76) |
| Germond 2004: poor prognosis, first cycle of fresh embryos | 22, 39.3 (2.9) | 21, 38.3 (3.4) | 0.51 (0.10 to 2.45) |
| 154, 38.5 (2.8) | 149, 37.3 (4.2) | 2.71 (1.62 to 4.56) | |
| 59, 32.1 (3.0) | 62, 31.2 (3.5) | 0.81 (0.37 to 1.76) | |
| 60, 30.9 (4.3) | 60, 30.8 (3.9) | 1.15 (0.55 to 2.43) | |
| 13, 30.0 (0.9) | 7, 30.0 (0.8) | 0.40 (0.06 to 2.89) | |
| 24, 30.5 (5.2) | 22, 29.1 (3.6) | 2.0 (0.62 to 6.49) | |
| not stated | not stated | 3.20 (0.91 to 11.27) | |
| 128, 32.3 (4.24) | 129, 32.1 (3.16) | 1.86 (1.12 to 3.10) | |
| Kutlu 2010: good prognosis | 73, 29.9 (2.9) | 66, 28.9 (3.4) | 1.06 (0.54 to 2.08) |
| Kutlu 2010: poor prognosis | 58, 38.0 (2.3) | 55, 37.4 (2.4) | 1.23 (0.58 to 2.60) |
| not stated | not stated | 0.85 (0.28 to 2.58) | |
| 41, 38.30 (0.31) | 48, 38.50 (0.26) | 0.90 (0.38 to 2.10) | |
| 158, 31.3 (4.1) | 150, 32.6 (2.4) | 1.79 (1.05 to 3.07) | |
| 20, 32.0 (4.0) | 20, 31.4 (3.7) | 8.0 (1.44 to 44.3) | |
| 80, 34.0 (range 25 to 40) | 80, 34.0 (range 26 to 40) | 0.81 (0.33 to 2.00) | |
| Petersen 2005: 1 previous implantation failure | 35, 34.6 (4.6) | 35, 34.1 (5.3) | 1.15 (0.41 to 3.19) |
| Petersen 2005: several previous implantation failures | 40, 35.7 (3.8) | 40, 35.3 (5.1) | 4.11 (1.04 to 16.29) |
| 90, 32.9 (0.5) | 92, 31.6 (0.4) | 0.7 (0.3 to 1.6) | |
| not stated | not stated | 0.72 (0.38 to 1.36) | |
| not stated | not stated | 0.74 (0.35 to 1.59) | |
| 30, 30.6 (5.6) | 32, 29.2 (5.3) | 0.58 (0.19 to 1.78) | |
| 118, 34.0 (3.3) | 81, 34.0 (3.2) | 0.94 (0.53 to1.65) | |
| 82, 37.2 (2.22) | 96, 36.97 (1.96) | 0.65 (0.36 to 1.18) | |
| not stated | not stated | 1.54 (0.67 to 3.54) | |
| 110, 34.1 (4.8) | 108, 34.2 (4.1) | 1.37 (0.79 to 2.35) | |
| 50, 35.3 (4.2) | 50, 33.5 (4.3) | 0.74 (0.35 to 1.59) | |
| not stated | not stated | 1.36 (0.32 to 5.73) | |
| 200, 30.86 (5.82) | 200, 29.85 (5.14) | 0.53 (0.35 to 0.80) | |
| 96, 33.1 (3.7) | 102, 32.6 (3.4) | 1.91 (1.08 to 3.38) |
| Study ID | Balanced age between groups | Balances no. of embryos transferred | Prognosis: poor/good | FSH levels | Blastocyst transfer | Complete/partial AH | Frozen cycles |
|---|---|---|---|---|---|---|---|
| Yes | Yes | Poor | No data | No | Thinning | Fresh | |
| AH mean 1.5 years older | Yes | Good and poor subgroups | No data | No | Complete hole | Not stated | |
| Yes | Yes | Unselected | < 10 | No | Thinning | Frozen | |
| AH mean 1.3 years older | Yes | Good | < 10 | No | Thinning | Fresh | |
| Yes | Yes | Good | No data | No | Thinning | Fresh | |
| Yes | Yes | Good | < 10 | No | Not stated | Fresh | |
| Yes | Yes | Good | < 15 | No | Thinning | Fresh | |
| Yes | Yes | Unstated | ≤ 15 and > 15 subgroups | No | Complete hole | Fresh | |
| Yes | No data | Poor | No data | No | Thinning | Frozen | |
| Yes | No data | Good | No data | No | Thinning | Frozen | |
| Yes | Yes | Not stated | No data | No | Mechanical expansion | Frozen thawed | |
| Yes | Yes | Mixed | No data | No | Thinning | Fresh and frozen subgroups | |
| Yes | Yes | Mixed, in subgroups | Between 3 and 12 | No | Complete hole | Fresh and frozen subgroups | |
| Yes | Yes | Poor | > 12 | No | Partial | Fresh | |
| Mean age data given only for combined cycles 1 and 2 | Yes | Under 38 years, > 2 previously failed cycles, ZP thickness > 13 micrometers | No data | No | 20 micrometer diameter opening | Fresh | |
| Yes | Yes | Good | No data | No | Complete hole | Fresh | |
| Yes | Yes | Good | < 10 | No | Complete hole | Fresh | |
| AH mean 1.4 years older | Yes | Unstated | < 10 | Yes | Removal complete | Fresh | |
| No data | Yes | Unstated | No data | Yes | Complete hole | Fresh | |
| Yes | Yes | Poor | No data | Yes | Removal complete | Fresh | |
| Yes | Yes | Good and poor subgroups | No data | No | Complete hole | Fresh | |
| No data | No data | Good | No data | No | Complete hole | Fresh | |
| No | Yes | Poor | No data | No | Complete hole | Fresh | |
| Yes | Yes | Good | AH 5.4 ± 1.3 | No | Thinning | Fresh | |
| Yes | Yes | Unstated | No data | No | Thinning | Frozen‐thaw cycle | |
| Yes | Higher proportion of controls received 3 embryos | Unstated | < 11 | No | Thinning | Frozen‐thaw cycle | |
| Yes | Yes | Poor | No data | No | Thinning | Fresh | |
| Yes | Yes | Unstated | No data | No | Partial | Fresh | |
| No data | Yes | Poor | No data | No | Complete hole | Fresh | |
| No data | No data | Unstated | No data | No | Complete hole | Both | |
| Yes | Yes | Unstated | AH 6.4 ± 2.3 No AH 5.6 ± 2.1 | No | Thinning | Frozen | |
| Yes | Yes | Good | < 10 | No | Hole | Fresh | |
| Yes | Yes | Advanced maternal age | < 10 | No | Zona Thinning | Fresh | |
| No data | No data | Poor | No data | No | Complete hole | Fresh | |
| Yes | Yes | Good | < 15 | No | Thinning | Fresh | |
| AH mean 1.8 years older | Yes | Not stated | No data | No | Complete hole | Fresh | |
| No data | No data | Poor | No data | No | Thinning | Fresh | |
| Yes | Yes | Not stated | No data | No | Partially thinned | Vitrified‐warmed embryo | |
| Yes | Yes | Previously unsuccessful 1 fresh cycle | No data | Yes | Partial | Vitrified‐warmed embryo |
AH: assisted hatching.
ET: embryo transfer.
FSH: follicle‐stimulating hormone.
Excluded studies
We excluded 72 studies from the review (see Characteristics of excluded studies). Reasons for exclusion included inadequate method of randomisation, no per woman data, inadequate reporting of clinical pregnancy, no control group, inclusion of women with donor gametes, and, in the remainder, studies were not randomised and two studies were found to be retrospective studies on close examination of the text. Conference abstracts were excluded only when further details were asked from study authors and no response was provided, and we could not utilise available data.
Risk of bias in included studies
The overall methodological quality of the included trials was considered sub‐optimal, largely due to risk of bias in the included studies. Further details of the trials' risk of bias can be found in the Characteristics of included studies table. Summaries of risk of bias for all included studies are presented in Figure 2 and Figure 3.
Allocation
Random sequence generation
All 39 trials stated that randomisation had occurred. Regarding random sequence generation, 23 studies were at low risk of this bias, 15 had unclear risk, and one was at high risk (Hagemann 2010).
Allocation concealment
Three studies were at low risk of selection bias related to allocation concealment (Abulsoud 2019; Elnahas 2017; González‐Ortega 2015), and 36 studies had unclear risk.
Blinding
Although blinding was unlikely to influence findings for the primary review outcome (live birth), eight trials employed double blinding with both the woman and the outcome assessor unaware of the allocation (Balakier 2009; Cohen 1992; Ge 2008; González‐Ortega 2015; Hagemann 2010; Lanzendorf 1998; Ng 2005; Razi 2013). In 28 studies, it is unclear if blinding was used or who was blinded (participant or assessor), and in the remaining three studies, no blinding was reported (Ciray 2005; Hellebaut 1996; Shi 2016).
Incomplete outcome data
Ideally, studies should randomise women on the day of assessment of embryos for suitability for embryo transfer. Two studies we assessed as high risk related to incomplete outcome data (Nada 2018; Safari 2017). One excluded participants after randomisation due to cycle cancellation but gave no reason for why cycles were cancelled, and one randomised 32 participants into each trial arm but reported outcomes for only 30 participants. A total of 16 studies were at low risk of bias related to incomplete outcome data, and 21 studies had unclear risk.
Selective reporting
All pre‐specified outcomes were reported within the outcomes of all studies. Many studies did not report live birth, multiple pregnancy, or miscarriage outcomes.
Other potential sources of bias
Age groups were matched in trials with similar means in the AH and control groups.
Thirty‐two trials were reported as full published papers. Seven trials were published in conference abstract form only (Antinori 1999; Carter 2003; Elhelw 2005; Laffoon 1999; Rufas‐Sapir 2004; Ryan 1997; Utsunomiya 1998).
No funding bias or any other conflicts of interests were noted in the included studies.
Effects of interventions
Assisted hatching compared to no assisted hatching
Primary outcomes
Live birth per woman
Only 14 of the 39 trials reported live birth rate. We are uncertain of the effect of AH on live birth rate when compared to no AH (odds ratio (OR) 1.09, 95% confidence interval (CI) 0.92 to 1.29; 14 RCTs, N = 2849; I² = 20%; low‐quality evidence; Analysis 1.1; Figure 4).

Forest plot of comparison: 1 Live birth rate, outcome: 1.1 Live birth per woman randomised.
Subgroup analysis
-
Number of attempts ‐ first or repeat attempt at ART: no evidence indicates that the effect of assisted hatching differed between those undergoing their first or subsequent attempts (P = 0.23). We are uncertain of the effect of AH on the live birth rate in women in their first attempt at ART (OR 0.78, 95% CI 0.48 to 1.28; 3 RCTs, n = 380; I² = 15%) or in subsequent attempts at ART (OR 1.40, 95% CI 0.62 to 3.13; 1 RCT only) when compared to no AH (Analysis 1.2)
-
Mode of conception ‐ assisted conception procedure (IVF/ICSI): no evidence shows that the effect of assisted hatching differed between those undergoing IVF and those undergoing ICSI (P = 0.20). For couples undergoing ICSI, AH may improve slightly the live birth rate when compared to no AH (OR 1.54, 95% CI 1.02 to 2.33; 3 RCTs, n = 640; I² = 0%). For couples undergoing IVF, there may be little to no difference in live birth rate with AH compared to no AH (OR 1.00, 95% CI 0.60 to 1.68; 3 RCTs, n = 241; I² = 58%) (Analysis 1.3)
-
Method of assisted hatching: no evidence suggests that the effect of assisted hatching differed between chemical and laser methods (P = 0.80). We are uncertain of the effect of chemical AH or laser AH on live birth rate when compared to no AH (OR 1.13, 95% CI 0.74 to 1.74; 4 RCTs, n = 366; I² = 5%; and OR 1.07, 95% CI 0.89 to 1.28; 10 RCTs, n = 2473; I² = 24%, respectively). None of the trials that employed mechanical forms of AH reported on live births (Analysis 1.4)
-
Prognosis: no evidence shows that the effect of assisted hatching differed between women in poor prognosis groups and women in good prognosis groups (P = 0.12). We are uncertain of the effect of AH on live birth rate in women with a good prognosis compared with no AH (OR 1.03, 95% CI 0.83 to 1.28; 6 RCTs, n = 1495; I² = 23%) and in women with a poor prognosis who underwent AH compared to no AH (OR 1.46, 95% CI 0.99 to 2.15; 4 RCTs, n = 576; I² = 0%) (Analysis 1.5)
-
Extent of zona manipulation: no evidence indicates that the effect of assisted hatching differed between thinning of zona and breaching the zona with a hole (P = 0.64). We are uncertain of the effect of AH with thinning of the zona pellucida on live birth rate compared with no AH and AH with breech of the zona pellucida on live birth rate compared with no AH (OR 1.06, 95% CI 0.86 to 1.30; 6 RCTs; I² = 31%; and OR 1.15, 95% CI 0.87 to 1.51; 8 RCTs, n = 1107; I² = 21%, respectively) (Analysis 1.6)
-
Type of embryo ‐ fresh or frozen embryo: no evidence shows that the effect of assisted hatching differed between fresh and frozen embryos (P = 0.35). We are uncertain of the effect of AH on live birth rate in women who had fresh embryo transfer compared with the no AH group (OR 1.16, 95% CI 0.94 to 1.44; 11 RCTs, N = 1669; I² = 16%). Only one study reported use of frozen embryos (Safari 2017), and two studies reported use of fresh and frozen embryos (Ge 2008; Germond 2004)
Sensitivity analysis
-
Allocation concealment: no trials were assessed as low risk
-
Method of randomisation: 11 trials stated the method of randomisation (Balakier 2009; Cohen 1992; Ge 2008; Germond 2004; Hellebaut 1996; Hurst 1998; Lanzendorf 1998; Nada 2018; Petersen 2005; Razi 2013; Sagoskin 2007). Analysis of the data from these trials suggests that there was no improvement in live birth rate between AH groups and control groups (OR 1.10, 95% CI 0.92 to 1.32; n = 2411; I² = 11%)
Other analyses
We used a funnel plot to assess publication bias and small‐study effects. The funnel plot shows only some mild asymmetry (Figure 5). The funnel plot is likely to be detecting small‐study effects.

Funnel plot of comparison: 1 Live birth: assisted hatching compared with no assisted hatching, outcome: 1.1 Live birth per woman randomised.
Multiple pregnancy per woman
Eighteen of the 39 trials reported on multiple pregnancy. AH may lead to a higher multiple pregnancy rate compared to no AH (OR 1.38, 95% CI 1.13 to 1.68; 18 RCTs, n = 4308; I² = 48%; low‐quality evidence; Analysis 2.1; Figure 6).

Forest plot of comparison: 4 Multiple pregnancy rate, outcome: 4.1 Multiple pregnancy rate per woman randomised.
Subgroup analysis
-
Number of attempts ‐ first attempt or repeat attempt at ART: no evidence indicates that the effect of AH differed between those undergoing their first attempt and those undergoing subsequent attempts (P = 0.28). We are uncertain of the effect of AH on the multiple pregnancy rate in women who underwent AH compared with no AH in their first attempt at ART (OR 0.73, 95% CI 0.31 to 1.72; 4 RCTs, n = 654; I² = 0%) or in subsequent attempts at ART (OR 1.25, 95% CI 0.80 to 1.94; 5 RCTs, n = 1068; I² = 25%) (Analysis 2.2)
-
Mode of conception‐ assisted conception procedure (IVF/ICSI): no evidence shows that the effect of AH differed between those undergoing IVF and those undergoing ICSI treatment (P = 0.21). For couples undergoing ICSI, AH may lead to slightly higher multiple pregnancy rates when compared to no AH (OR 3.09, 95% CI 1.57 to 6.08; 3 RCTs, n = 573; I² = 52%). For couples undergoing IVF, AH may lead to slightly higher multiple pregnancy rates when compared to no AH (OR 1.87, 95% CI 1.28 to 2.72; 6 RCTs, n = 1126; I² = 36%) (Analysis 2.3)
-
Method of assisted hatching: evidence suggests that the effect of AH differed between chemical, laser, and mechanical methods (P = 0.08). We are uncertain of the effect of chemical AH on the multiple pregnancy rate when compared to no AH (OR 1.55, 95% CI 0.98 to 2.47; 4 RCTs, n = 534; I² = 10%). Both laser and mechanical AH may lead to a slightly higher multiple pregnancy rate when compared to no AH (OR 1.29, 95% CI 1.03 to 1.61; 4 RCTs, n = 534; I² = 50%; and OR 8.33, 95% CI 1.56‐44.64; 1 RCT only, n = 44, respectively) (Analysis 2.4)
-
Prognosis: some evidence suggests that the effect of AH differed between women in poor prognosis groups and women in good prognosis groups (P = 0.02). We are uncertain of the effect of AH on the multiple pregnancy rate in women with a good prognosis compared with no AH (OR 1.08, 95% CI 0.81 to 1.44; 6 RCTs, n = 1569; I² = 0%). In women with a poor prognosis, AH may lead to a slightly higher multiple pregnancy rate when compared to no AH (OR 1.95, 95% CI 1.27 to 3.00; 6 RCTs, n = 1186; I² = 0%) (Analysis 2.5)
-
Extent of zona manipulation: no evidence indicates that the effect of AH differed between thinning of zona and breaching of zona with a hole (P = 0.65). AH may lead to a slightly higher multiple pregnancy rate in women who had assisted hatching with thinning of the zona pellucida compared with no AH (OR 1.34, 95% CI 1.02 to 1.76; 6 RCTs, n = 2148; I² = 71%) and assisted hatching with breech of the zona pellucida by a hole only compared with no AH (OR 1.51, 95% CI 1.08 to 2.11; 9 RCTs, n = 1629; I² = 35%). Only one study reported complete removal of the zona pellucida (Isik 2000) (Analysis 2.6)
-
Type of embryo ‐ fresh or frozen embryo: no evidence suggests that the effect of assisted hatching differed between fresh and frozen embryos (P = 0.46). We are uncertain of the affect of AH on the multiple pregnancy rate in women who had fresh embryo transfer compared with no AH (OR 1.30, 95% CI 0.98 to 1.73; 13 RCTs, n = 2264; I² = 0%) and in women who had frozen embryo transfer compared with no AH (OR 1.60, 95% CI 1.00 to 2.55; 3 RCTs, n = 926; I² = 88%) (Analysis 2.7)
-
Multiple pregnancy per pregnancy: overall, AH may lead to a higher multiple pregnancy rate compared to control (OR 1.37, 95% CI 1.09 to 1.72; 17 trials, n = 1598; I² = 25%) (Analysis 2.8)
Sensitivity analysis
-
Allocation concealment: only one trial was assessed as low risk (González‐Ortega 2015)
-
Method of randomisation: 15 trials stated the method of randomisation (Balaban 2006; Balakier 2009; Carter 2003; Cohen 1992; Ge 2008; Germond 2004; González‐Ortega 2015; Hellebaut 1996; Isik 2000; Isiklar 1999; Lanzendorf 1998; Ng 2005; Razi 2013; Sagoskin 2007; Valojerdi 2010). Analysis of the data from these trials suggests that AH may lead to a high multiple pregnancy rate when compared to no AH (OR 1.37, 95% CI 1.11 to 1.69; n = 3597; I² = 53%)
Secondary outcomes
Clinical pregnancy rate per woman
Thirty‐nine trials reported clinical pregnancy data. AH may improve slightly the clinical pregnancy rate compared to no AH (OR 1.20, 95% CI 1.09 to 1.33; I² = 55%; low‐quality evidence; Analysis 3.1; Figure 7). Furthemore, the forest plots show high heterogeneity. When a random‐effects model is used, there may be little to no difference in clinical pregnancy rate among women who underwent AH compared with those given control (P = 0.04).

Forest plot of comparison: 2 Clinical pregnancy, outcome: 2.1 Clinical pregnancy rate per woman randomised.
Among the 14 trials reporting both clinical pregnancy and live births, analysis demonstrated that we are uncertain of the effect of AH on clinical pregnancy rate in women who underwent AH compared with those given the control (OR 1.07, 95% CI 0.92 to 1.25; I² = 45%) (Analysis 4.1).
Subgroup analysis
-
Number of attempts ‐ first or repeat attempt at ART: some evidence suggests that the effect of AH differed between those undergoing their first attempt and those undergoing subsequent attempts (P < 0.00001; fixed model). When the random‐effects model is used, the effect is less pronounced (P = 0.0002). With the fixed‐effect model, there may be a slight decrease in the clinical pregnancy rate among women who underwent AH compared with no AH in their first attempt at ART (OR 0.74, 95% CI 0.56 to 0.98; 8 RCTs, n = 1010 women; I² = 9%). There may be slight improvement in clinical pregnancy rate among women who underwent AH compared to no AH in women undergoing repeat attempts at ART (OR 1.65, 95% CI 1.34 to 2.04; 11 RCTs, n = 1798; I² = 38%) (Analysis 3.2)
-
Mode of conception ‐ assisted conception procedure (IVF/ICSI): no evidence shows that the effect of AH differed between those undergoing IVF and those undergoing ICSI treatment (P = 0.62). For couples undergoing ICSI, AH may improve slightly the clinical pregnancy rate when compared to no AH (OR 1.40, 95% CI 1.14 to 1.71; 11 RCTs; n = 1825; I² = 30%). For couples undergoing IVF, AH may improve slightly the clinical pregnancy rate when compared to no AH (OR 1.31, 95% CI 1.10 to 1.55; 15 RCTs, n = 2460; I² = 28%) (Analysis 3.3)
-
Method of assisted hatching: no evidence indicates that the effect of AH differed between laser, chemical, and mechanical methods (P = 0.48) (Analysis 3.4). Chemical AH may improve slightly the clinical pregnancy rate when compared to no AH (OR 1.33, 95% CI 1.08 to 1.64; 11 RCTs, n = 1536; I² = 0%). Laser AH may improve slightly the clinical pregnancy rate when compared to no AH (OR 1.15, 95% CI 1.03 to 1.30; 23 RCTs, n = 5127; I² = 67%). We are uncertain of the effect of mechanical AH on the clinical pregnancy rate when compared to control (OR 1.30, 95% CI 0.89 to 1.88; 5 RCTs, n = 586; I² = 51%)
-
Prognosis: some evidence suggests that the effect of AH differed between women in poor prognosis groups and women in good prognosis groups (P = 0.0009; fixed‐effect model). When a random‐effects model is used, the effect is less pronounced (P = 0.005) than with the fixed‐effect model. In women with a good prognosis, we are uncertain of the effect of AH on the clinical pregnancy rate when compared with no AH (OR 1.10, 95% CI 0.94 to 1.29; 14 RCTs, n = 2721; I² = 0%). In women with a poor prognosis, AH may improve slightly the clinical pregnancy rate when compared with no AH (OR 1.68, 95% CI 1.38 to 2.04; 14 RCTs, n = 2108; I² = 25%) (Analysis 3.5)
-
Extent of zona manipulation: some evidence shows that the effect of AH differed depending upon the extent of assisted hatching (P = 0.04). In women who had AH with thinning of the zona pellucida, we are uncertain of the effect on the clinical pregnancy rate when compared to no AH (OR 1.10, 95% CI 0.96 to 1.26; 17 RCTs, n = 3774; I² = 57%). In women who had AH with breech of the zona pellucida by a hole only, we are uncertain of the effect of AH on clinical pregnancy rate when compared with control (OR 1.17, 95% CI 0.98 to 1.39; 17 RCTs, n = 2543; I² = 46%). Only two studies used AH with complete removal of the zona pellucida (Isik 2000; Jelinkova 2002), and only one study used AH with expansion of the zona pellucida (Fang 2010) (Analysis 3.6)
-
Type of embryos ‐ fresh or frozen embryo: in fresh embryo groups: no evidence indicates that the effect of AH differed between fresh and frozen embryos (P = 0.58). AH may improve slightly the clinical pregnancy rate in women who had fresh embryo transfer when compared with no AH (OR 1.23, 95% CI 1.10 to 1.38; 30 RCTs, n = 5349; I² = 41%). We are uncertain of the effect of AH on the clinical pregnancy rate in women who had frozen embryo transfer when compared to no AH (OR 1.15, 95% CI 0.93 to 1.42; 10 RCTs, n = 1700; I² = 76%) (Analysis 3.7)
Sensitivity analysis
-
Allocation concealment: limiting the analysis to trials that reported allocation concealment left only three trials (Abulsoud 2019; Elnahas 2017; González‐Ortega 2015). Analysis of the data from these trials suggests that there was improvement in the clinical pregnancy rate in the AH group when compared to the no AH group (OR 2.28, 95% CI 1.59 to 3.27; n = 593; I² = 0%)
-
Method of randomisation: 23 trials stated an acceptable method of randomisation. Analysis of the data from these trials suggests that there was improvement in the clinical pregnancy rate in the AH group compared to the no AH group (OR 1.16, 95% CI 1.03 to 1.30; n = 5050; I² = 63%)
Other analyses
We used a funnel plot to assess publication bias and small‐study effects. The funnel plots are symmetrical (Figure 8Figure 9).

Funnel plot of comparison: 3 Clinical pregnancy: assisted hatching compared with no assisted hatching, outcome: 3.1 Clinical pregnancy rate per woman randomised.

Funnel plot of comparison: 4 Clinical pregnancies in trials that reported live births: assisted hatching compared with no assisted hatching, outcome: 4.1 Clinical pregnancies in trials reporting live births.
Miscarriage per woman
Seventeen (17) trials reported miscarriage rates, accounting for 2810 women. Due to the quality of the evidence, we are uncertain about the difference in miscarriage rate among women who underwent AH compared with those who underwent no AH (OR 1.13, 95% CI 0.82 to 1.56; 17 RCTs, n = 2810; I² = 0%; very low‐quality evidence; Figure 10; Analysis 5.1).

Forest plot of comparison: 3 Miscarriage rate, outcome: 3.1 Miscarriage per woman randomised.
Subgroup analysis
-
Number of attempts ‐ first or repeat attempt at ART: no evidence indicates that the effect of AH differed between those undergoing their first or subsequent attempts (P = 0.18) (Analysis 5.2)
-
Mode of conception ‐ assisted conception procedure (IVF/ICSI): no evidence shows that the effect of AH differed between those undergoing IVF and those undergoing ICSI treatment (P = 0.90) (Analysis 5.3)
-
Method of assisted hatching: no evidence suggests that the effect of AH differed between methods of AH (P = 1.00) (Analysis 5.4)
-
Prognosis: no evidence indicates that the effect of AH differed between women in poor prognosis groups and women in good prognosis groups (P = 0.73) (Analysis 5.5)
Monozygotic twinning
Six trials reported data on monozygotic twinning (Figure 11). Hurst 1998 reported two monozygotic twins from three pregnancies in the AH group and none in the control group (0 from three pregnancies). Hagemann 2010 reported one case of monozygotic twins in the AH group also. Balakier 2009, Isik 2000, Jelinkova 2002, Lanzendorf 1998, and Ng 2005 reported absence of monozygotic twins in either group. There was an overall rate of 0.8% for the AH group and 0% for the control group (Analysis 6.1).

Forest plot of comparison: 5 Monozygotic twinning rate, outcome: 5.1 Monozygotic twinning per woman randomised.
Ectopic pregnancy
Five trials reported ectopic pregnancy data. Lanzendorf 1998 reported one ectopic pregnancy in the control group and none in the AH group. Hagemann 2010, Hellebaut 1996, and Hurst 1998 reported absence of ectopic pregnancies. Shi 2016 reported one ectopic pregnancy each in the AH and control groups.
Congenital or chromosomal abnormalities
Two trials reported absence of congenital or chromosomal abnormalities (Hurst 1998; Lanzendorf 1998), and two trials reported fetal abnormalities in both AH and control groups (Hagemann 2010; Razi 2013).
Failure to transfer any embryos per woman
No trials reported data on this outcome.
Embryo damage
Three trials reported absence of embryo damage (Hurst 1998; Lanzendorf 1998; Stein 1995).
In vitro blastocyst development
No trials reported data on in vitro blastocyst development.
No further analyses were performed because of the paucity of data on these secondary outcomes.
Assessment of reporting bias
We produced funnel plots for the outcomes of live birth (Figure 5) and clinical pregnancy (Figure 8; Figure 9), and we did not find any strong suggestion of publication bias.
Discussion
Summary of main results
Live birth
For this update, the primary outcome remained live birth rate. However only 14 of the 39 studies reported this outcome, representing 39% of all women randomised in the studies.
We are uncertain of the effects of assisted hatching (AH) on live birth rates when compared to no AH (summary of findings Table 1). It is disappointing that the conclusions of this review are still limited by the paucity of available data since publication of the first Cochrane Review on this topic. Researchers still are not publishing the most important and sought after statistic on the impact of AH on assisted conception, namely, the 'live birth (take home baby rate)'. This reflects the gap that continues to exist between the practice of assisted conception and clinical obstetrics, with the absence of a central database of patient records that would facilitate follow‐up of these women by authorised agencies. Moving forward, we hope that with publication of the modified CONSORT statement to improve reporting of fertility trials, the primary outcome measure of all fertility trials in the future will be live birth (Harbin Consensus Conference Workshop Group 2014). Reported live birth data in one‐third of all studies suggest haste on the part of study authors to disseminate data limited to short‐term outcomes, and for all intents and purposes, these data are incomplete.
Multiple pregnancy
AH may lead to a higher multiple pregnancy rate compared to no AH; furthermore, an increase in multiple pregnancies per clinical pregnancy has been noted (37% increase in odds ratio (OR)). Given this significance in combination with uncertainty about any evidence of an increase in success at achieving live birth with AH, we may need to consider the overall risks versus benefits of this technique.
Only half of the studies that report multiple pregnancy rates also report live birth data. This is unfortunate as it limits interpretation of results, given this high multiple pregnancy rate, because as many as 5% of multiple pregnancies are lost at between 20 and 40 weeks' gestation. In addition, many studies were transferring two to four embryos, although the numbers transferred were balanced between groups. The increase in multiple pregnancies can be attributed to an increase in implantation rates resulting in higher pregnancy rates or monozygotic twinning, or both, with AH. This must be taken into consideration in planning this procedure.
It is likely that reducing to one the number of embryos transferred will not completely eliminate monozygotic twinning. Implantation rate was not considered as an outcome in this update for two reasons. Pooling of embryo implantation data for meta‐analysis is statistically problematic. Implantation is traditionally expressed 'per embryo transferred', without regard for the number of women. However, more than one embryo is normally transferred per woman, resulting in an embryo clustering effect and necessitating more advanced analysis to render the results meaningful. A statistically valid and easier approach is to express implantation 'per woman randomised'. This also confers the advantage of being more useful in aiding understanding of resulting live births. This approach requires, however, that the number of women with at least one gestation sac is reported, which is not the case in practice.
Clinical pregnancy
All 39 included trials reported on clinical pregnancy. Similar to the previous update (in 2012), this update suggests that overall, AH may slightly improve the chance of achieving a clinical pregnancy, but these results are less reliable because of high risk of bias and dependence upon the statistical model. Subgroup analysis supports these results.
When analysis of clinical pregnancy rate was restricted to those trials that went on to report live birth, the clinical pregnancy result showed little to no difference in effect between AH and control groups.
Miscarriage
We are uncertain of the effect of AH on miscarriage rates when compared to controls.
Other outcomes
The impact of AH on ectopic pregnancy, congenital and chromosomal abnormalities, blastocyst formation, and embryo damage could unfortunately not be determined by this review because of the paucity of available data. This is disappointing as it leaves many unanswered questions about perceived risks of the procedure, from embryo damage to chromosomal and congenital abnormalities.
Overall completeness and applicability of evidence
A large number of trials were incorporated into this review, involving a large sample size. The results of 7249 women in 39 trials are included in this review, leading to a low to very low level of evidence. Failure of many trials to report on primary outcomes (live birth, multiple pregnancy) and variable levels of reporting on other outcomes allow potential bias to be introduced into the analysis. This calls for standardised outcome reporting for future assisted conception trials as discussed.
Quality of the evidence
The quality of the evidence is low to very low. The main limitations are serious risk of bias associated with poor reporting of study methods, inconsistency, imprecision, and publication bias (summary of findings Table 1).
Potential biases in the review process
Three review authors (LL, SH, and MAA) with varying levels of expertise undertook the search process several times to minimise the risk of bias introduced by review authors; they had no conflicts of interest.
We were unable to get responses from authors of various studies when abstracts were published and we had requested relevant or additional data. These studies could potentially have been included in the review.
Agreements and disagreements with other studies or reviews
Overall, the addition of eight new trials to this update has not changed the findings regarding live birth that were reported in previous reviews, namely, that no current evidence suggests that AH increases the chances of a live birth.
Clinical pregnancy rate may improve slightly in women undergoing AH, but these results are not reliable and robust.
Three recent non‐Cochrane systematic reviews have been published (He 2018; Li 2016; Zeng 2018). Li 2016 used random‐effects models for their meta‐analysis. They suggested that there is an increase in clinical pregnancy and multiple pregnancy rates with AH when compared to control. We agree with these findings generally, but Li 2016 did not present clear assessment of the quality and robustness of evidence related to these outcome improvements. Review authors suggested there was no improvement in live birth rates and no difference in miscarriage rates between AH and control groups. Li 2016 reported clinical pregnancy in 36 RCTs; however, this present Cochrane Review included 39 RCTs reporting clinical pregnancy (some different from the studies included by Li 2016), One RCT ‐ Urman 2002 ‐ which is reported in Li 2016 ‐ was excluded from the previous published Cochrane Review due to inadequate methods of allocation. He 2018 published a systematic review about AH that focused on a population of women older than 35 years of age. These review authors similarly demonstrated no increase in live birth rate or miscarriage rate with AH compared to control. Conversely, they demonstrated no increase in multiple pregnancy and no improvement in clinical pregnancy rate with AH compared to control. Our Cochrane Review did not specifically look at this subgroup, but this population was incorporated into our poor prognosis subgroup. Our data for the poor prognosis subgroup suggest that AH may improve slightly clinical pregnancy and may increase multiple pregnancy when compared to control. Zeng 2018 examined laser AH only in cryopreserved embryos. Their analysis led to the conclusions that AH improved clinical pregnancy rates and increased multiple pregnancy rates when compared to control but led to no difference in live birth rate and miscarriage rate. Our subgroup analysis of cryopreserved embryos includes all methods of AH. Our results suggest that AH makes little to no difference in live birth, clinical pregnancy, or multiple pregnancy when compared to control in this subgroup. Zeng 2018 included studies that reported data outcomes per embryo transfer rather than per woman; this could explain in part the differences in results.

Study flow diagram.

Methodological quality graph: review authors' judgements about each methodological quality item presented as percentages across all included studies.

Methodological quality summary: review authors' judgements about each methodological quality item for each included study.

Forest plot of comparison: 1 Live birth rate, outcome: 1.1 Live birth per woman randomised.

Funnel plot of comparison: 1 Live birth: assisted hatching compared with no assisted hatching, outcome: 1.1 Live birth per woman randomised.

Forest plot of comparison: 4 Multiple pregnancy rate, outcome: 4.1 Multiple pregnancy rate per woman randomised.

Forest plot of comparison: 2 Clinical pregnancy, outcome: 2.1 Clinical pregnancy rate per woman randomised.

Funnel plot of comparison: 3 Clinical pregnancy: assisted hatching compared with no assisted hatching, outcome: 3.1 Clinical pregnancy rate per woman randomised.

Funnel plot of comparison: 4 Clinical pregnancies in trials that reported live births: assisted hatching compared with no assisted hatching, outcome: 4.1 Clinical pregnancies in trials reporting live births.

Forest plot of comparison: 3 Miscarriage rate, outcome: 3.1 Miscarriage per woman randomised.

Forest plot of comparison: 5 Monozygotic twinning rate, outcome: 5.1 Monozygotic twinning per woman randomised.

Comparison 1: Live birth: assisted hatching compared with no assisted hatching, Outcome 1: Live birth per woman randomised

Comparison 1: Live birth: assisted hatching compared with no assisted hatching, Outcome 2: First or repeat attempt

Comparison 1: Live birth: assisted hatching compared with no assisted hatching, Outcome 3: Conception mode

Comparison 1: Live birth: assisted hatching compared with no assisted hatching, Outcome 4: Hatching method

Comparison 1: Live birth: assisted hatching compared with no assisted hatching, Outcome 5: Prognosis

Comparison 1: Live birth: assisted hatching compared with no assisted hatching, Outcome 6: Live birth rate by extent of assisted hatching

Comparison 1: Live birth: assisted hatching compared with no assisted hatching, Outcome 7: Fresh or frozen embryo transfer

Comparison 2: Multiple pregnancy: assisted hatching compared with no assisted hatching, Outcome 1: Multiple pregnancy rate per woman randomised

Comparison 2: Multiple pregnancy: assisted hatching compared with no assisted hatching, Outcome 2: First or repeat attempt

Comparison 2: Multiple pregnancy: assisted hatching compared with no assisted hatching, Outcome 3: Conception mode

Comparison 2: Multiple pregnancy: assisted hatching compared with no assisted hatching, Outcome 4: Hatching method

Comparison 2: Multiple pregnancy: assisted hatching compared with no assisted hatching, Outcome 5: Prognosis

Comparison 2: Multiple pregnancy: assisted hatching compared with no assisted hatching, Outcome 6: Multiple pregnancy rate per woman grouped by extent of assisted hatching

Comparison 2: Multiple pregnancy: assisted hatching compared with no assisted hatching, Outcome 7: Fresh or frozen embryo transfer

Comparison 2: Multiple pregnancy: assisted hatching compared with no assisted hatching, Outcome 8: Multiple pregnancy per pregnancy

Comparison 3: Clinical pregnancy: assisted hatching compared with no assisted hatching, Outcome 1: Clinical pregnancy rate per woman randomised

Comparison 3: Clinical pregnancy: assisted hatching compared with no assisted hatching, Outcome 2: First or repeat attempt

Comparison 3: Clinical pregnancy: assisted hatching compared with no assisted hatching, Outcome 3: Conception mode

Comparison 3: Clinical pregnancy: assisted hatching compared with no assisted hatching, Outcome 4: Hatching method

Comparison 3: Clinical pregnancy: assisted hatching compared with no assisted hatching, Outcome 5: Prognosis

Comparison 3: Clinical pregnancy: assisted hatching compared with no assisted hatching, Outcome 6: Extent of assisted hatching

Comparison 3: Clinical pregnancy: assisted hatching compared with no assisted hatching, Outcome 7: Fresh and frozen embryo transfer

Comparison 4: Clinical pregnancies in trials that reported live births: assisted hatching compared with no assisted hatching, Outcome 1: Clinical pregnancies in trials reporting live births

Comparison 5: Miscarriage: assisted hatching compared with no assisted hatching, Outcome 1: Miscarriage per woman randomised

Comparison 5: Miscarriage: assisted hatching compared with no assisted hatching, Outcome 2: First or repeat attempt

Comparison 5: Miscarriage: assisted hatching compared with no assisted hatching, Outcome 3: Conception mode

Comparison 5: Miscarriage: assisted hatching compared with no assisted hatching, Outcome 4: Hatching method

Comparison 5: Miscarriage: assisted hatching compared with no assisted hatching, Outcome 5: Prognosis

Comparison 5: Miscarriage: assisted hatching compared with no assisted hatching, Outcome 6: Miscarriage per clinical pregnancy

Comparison 6: Monozygotic twinning: assisted hatching compared with no assisted hatching, Outcome 1: Monozygotic twinning per woman randomised

Comparison 7: Robust studies (randomisation method and allocation concealment stated and live birth reported): assisted hatching compared with no assisted hatching, Outcome 1: Live births

Comparison 7: Robust studies (randomisation method and allocation concealment stated and live birth reported): assisted hatching compared with no assisted hatching, Outcome 2: Clinical pregnancies
| Assisted hatching compared to no assisted hatching for women undergoing assisted conception | ||||||
| Patient or population: women undergoing assisted conception Setting: clinic | ||||||
| Outcomes | Anticipated absolute effects* (95% CI) | Relative effect | №. of participants | Quality of evidence | Comments | |
|---|---|---|---|---|---|---|
| Risk with no assisted hatching | Risk with assisted hatching | |||||
| Live births per woman randomised | 283 per 1000 | 301 per 1000 | OR 1.09 | 2849 | ⊕⊕⊝⊝ | |
| Multiple pregnancy rate per woman randomised | 91 per 1000 | 121 per 1000 | OR 1.38 | 4308 | ⊕⊕⊝⊝ | |
| Clinical pregnancy rate per woman randomised | 322 per 1000 | 363 per 1000 | OR 1.20 | 7249 | ⊕⊕⊝⊝ | |
| Miscarriage rate per woman randomised | 53 per 1000 | 60 per 1000 | OR 1.13 | 2810 | ⊕⊝⊝⊝ | |
| *The risk in the intervention group (and its 95% confidence interval) is based on the assumed risk in the comparison group and the relative effect of the intervention (and its 95% CI). | ||||||
| GRADE Working Group grades of evidence. | ||||||
| aDowngraded two levels for serious risk of bias and publication bias: in many studies, the method was unclear and information was incomplete. The main limitation was serious risk of bias associated with poor reporting of study methods. bDowngraded two levels for serious risk of bias and for serious inconsistency. cDowngraded three levels for serious risk of bias, serious inconsistency, and serious imprecision (only 158 events). | ||||||
| Study | AH n, mean age (SD) | Control n, mean age (SD) | OR for clinical pregnancy |
|---|---|---|---|
| 65, 39.2 (1.2) | 65, 39.5 (1.2) | 2.50 (1.14 to 5.49) | |
| Antinori 1999: first IVF | 73, 37.5 | 69, 36.0 | 1.27 (0.70 to 2.32) |
| Antinori 1999: repeat IVF | 96, 27.5 | 103, 27 | 1.86 (0.81 to 4.25) |
| 183, 32.4 (3.3) | 183, 32.7 (3.1) | 1.85 (1.19 to 2.86) | |
| 45, 32.5 (3.8) | 39, 33.8 (3.2) | 0.64 (0.27 to 1.55) | |
| 51, 31.8 (3.6) | 52, 31.4 (3.6) | 0.74 (0.33 to 1.65) | |
| 121, 34 (3.3) | 82, 34 (3.2) | 0.95 (0.54 to 1.67) | |
| 60, 33.1 (4.2) | 30, 34.0 (3.7) | 0.62 (0.26 to 1.49) | |
| Cohen 1992: FSH < 15 | 69, 36.50 (3.30) | 68, 36.70 (3.70) | 2.11 (1.18 to 3.77) |
| Cohen 1992: poor prognosis | 80, 36.7 (4.3) | 83, 35.3 (4.2) | 1.30 (0.66 to 2.55) |
| Cohen 1992: FSH > 15 | not stated | not stated | 1.30 (0.66 to 2.55) |
| not stated | not stated | 1.77 (0.52 to 6.01) | |
| 80, 31.0 (4.7) | 80, 31.7 (4.9) | 1.58 (0.81 to 3.08) | |
| 61, 32.3 (3.4) | 64, 32.1 (3.6) | 2.37 (1.07 to 5.28) | |
| Ge 2008: fresh embryo | 387, 31.08 (4.68) | 373, 30.44 (4.15) | 0.99 (0.74 to 1.32) |
| Ge 2008: frozen embryo | 100, 31.84 (3.85) | 100, 30.66 (4.42) | 2.05 (0.99 to 4.22) |
| Germond 2004: first cycle of frozen‐thawed embryos | 62, 32.8 (4.2) | 53, 32.6 (3.8) | 0.09 (0.01 to 0.76) |
| Germond 2004: poor prognosis, first cycle of fresh embryos | 22, 39.3 (2.9) | 21, 38.3 (3.4) | 0.51 (0.10 to 2.45) |
| 154, 38.5 (2.8) | 149, 37.3 (4.2) | 2.71 (1.62 to 4.56) | |
| 59, 32.1 (3.0) | 62, 31.2 (3.5) | 0.81 (0.37 to 1.76) | |
| 60, 30.9 (4.3) | 60, 30.8 (3.9) | 1.15 (0.55 to 2.43) | |
| 13, 30.0 (0.9) | 7, 30.0 (0.8) | 0.40 (0.06 to 2.89) | |
| 24, 30.5 (5.2) | 22, 29.1 (3.6) | 2.0 (0.62 to 6.49) | |
| not stated | not stated | 3.20 (0.91 to 11.27) | |
| 128, 32.3 (4.24) | 129, 32.1 (3.16) | 1.86 (1.12 to 3.10) | |
| Kutlu 2010: good prognosis | 73, 29.9 (2.9) | 66, 28.9 (3.4) | 1.06 (0.54 to 2.08) |
| Kutlu 2010: poor prognosis | 58, 38.0 (2.3) | 55, 37.4 (2.4) | 1.23 (0.58 to 2.60) |
| not stated | not stated | 0.85 (0.28 to 2.58) | |
| 41, 38.30 (0.31) | 48, 38.50 (0.26) | 0.90 (0.38 to 2.10) | |
| 158, 31.3 (4.1) | 150, 32.6 (2.4) | 1.79 (1.05 to 3.07) | |
| 20, 32.0 (4.0) | 20, 31.4 (3.7) | 8.0 (1.44 to 44.3) | |
| 80, 34.0 (range 25 to 40) | 80, 34.0 (range 26 to 40) | 0.81 (0.33 to 2.00) | |
| Petersen 2005: 1 previous implantation failure | 35, 34.6 (4.6) | 35, 34.1 (5.3) | 1.15 (0.41 to 3.19) |
| Petersen 2005: several previous implantation failures | 40, 35.7 (3.8) | 40, 35.3 (5.1) | 4.11 (1.04 to 16.29) |
| 90, 32.9 (0.5) | 92, 31.6 (0.4) | 0.7 (0.3 to 1.6) | |
| not stated | not stated | 0.72 (0.38 to 1.36) | |
| not stated | not stated | 0.74 (0.35 to 1.59) | |
| 30, 30.6 (5.6) | 32, 29.2 (5.3) | 0.58 (0.19 to 1.78) | |
| 118, 34.0 (3.3) | 81, 34.0 (3.2) | 0.94 (0.53 to1.65) | |
| 82, 37.2 (2.22) | 96, 36.97 (1.96) | 0.65 (0.36 to 1.18) | |
| not stated | not stated | 1.54 (0.67 to 3.54) | |
| 110, 34.1 (4.8) | 108, 34.2 (4.1) | 1.37 (0.79 to 2.35) | |
| 50, 35.3 (4.2) | 50, 33.5 (4.3) | 0.74 (0.35 to 1.59) | |
| not stated | not stated | 1.36 (0.32 to 5.73) | |
| 200, 30.86 (5.82) | 200, 29.85 (5.14) | 0.53 (0.35 to 0.80) | |
| 96, 33.1 (3.7) | 102, 32.6 (3.4) | 1.91 (1.08 to 3.38) |
| Study ID | Balanced age between groups | Balances no. of embryos transferred | Prognosis: poor/good | FSH levels | Blastocyst transfer | Complete/partial AH | Frozen cycles |
|---|---|---|---|---|---|---|---|
| Yes | Yes | Poor | No data | No | Thinning | Fresh | |
| AH mean 1.5 years older | Yes | Good and poor subgroups | No data | No | Complete hole | Not stated | |
| Yes | Yes | Unselected | < 10 | No | Thinning | Frozen | |
| AH mean 1.3 years older | Yes | Good | < 10 | No | Thinning | Fresh | |
| Yes | Yes | Good | No data | No | Thinning | Fresh | |
| Yes | Yes | Good | < 10 | No | Not stated | Fresh | |
| Yes | Yes | Good | < 15 | No | Thinning | Fresh | |
| Yes | Yes | Unstated | ≤ 15 and > 15 subgroups | No | Complete hole | Fresh | |
| Yes | No data | Poor | No data | No | Thinning | Frozen | |
| Yes | No data | Good | No data | No | Thinning | Frozen | |
| Yes | Yes | Not stated | No data | No | Mechanical expansion | Frozen thawed | |
| Yes | Yes | Mixed | No data | No | Thinning | Fresh and frozen subgroups | |
| Yes | Yes | Mixed, in subgroups | Between 3 and 12 | No | Complete hole | Fresh and frozen subgroups | |
| Yes | Yes | Poor | > 12 | No | Partial | Fresh | |
| Mean age data given only for combined cycles 1 and 2 | Yes | Under 38 years, > 2 previously failed cycles, ZP thickness > 13 micrometers | No data | No | 20 micrometer diameter opening | Fresh | |
| Yes | Yes | Good | No data | No | Complete hole | Fresh | |
| Yes | Yes | Good | < 10 | No | Complete hole | Fresh | |
| AH mean 1.4 years older | Yes | Unstated | < 10 | Yes | Removal complete | Fresh | |
| No data | Yes | Unstated | No data | Yes | Complete hole | Fresh | |
| Yes | Yes | Poor | No data | Yes | Removal complete | Fresh | |
| Yes | Yes | Good and poor subgroups | No data | No | Complete hole | Fresh | |
| No data | No data | Good | No data | No | Complete hole | Fresh | |
| No | Yes | Poor | No data | No | Complete hole | Fresh | |
| Yes | Yes | Good | AH 5.4 ± 1.3 | No | Thinning | Fresh | |
| Yes | Yes | Unstated | No data | No | Thinning | Frozen‐thaw cycle | |
| Yes | Higher proportion of controls received 3 embryos | Unstated | < 11 | No | Thinning | Frozen‐thaw cycle | |
| Yes | Yes | Poor | No data | No | Thinning | Fresh | |
| Yes | Yes | Unstated | No data | No | Partial | Fresh | |
| No data | Yes | Poor | No data | No | Complete hole | Fresh | |
| No data | No data | Unstated | No data | No | Complete hole | Both | |
| Yes | Yes | Unstated | AH 6.4 ± 2.3 No AH 5.6 ± 2.1 | No | Thinning | Frozen | |
| Yes | Yes | Good | < 10 | No | Hole | Fresh | |
| Yes | Yes | Advanced maternal age | < 10 | No | Zona Thinning | Fresh | |
| No data | No data | Poor | No data | No | Complete hole | Fresh | |
| Yes | Yes | Good | < 15 | No | Thinning | Fresh | |
| AH mean 1.8 years older | Yes | Not stated | No data | No | Complete hole | Fresh | |
| No data | No data | Poor | No data | No | Thinning | Fresh | |
| Yes | Yes | Not stated | No data | No | Partially thinned | Vitrified‐warmed embryo | |
| Yes | Yes | Previously unsuccessful 1 fresh cycle | No data | Yes | Partial | Vitrified‐warmed embryo | |
| AH: assisted hatching. | |||||||
| Outcome or subgroup title | No. of studies | No. of participants | Statistical method | Effect size |
| 1.1 Live birth per woman randomised Show forest plot | 14 | 2849 | Odds Ratio (M‐H, Fixed, 95% CI) | 1.09 [0.92, 1.29] |
| 1.2 First or repeat attempt Show forest plot | 4 | Odds Ratio (M‐H, Fixed, 95% CI) | Subtotals only | |
| 1.2.1 First attempt at IVF or ICSI | 3 | 380 | Odds Ratio (M‐H, Fixed, 95% CI) | 0.78 [0.48, 1.28] |
| 1.2.2 Repeat attempt at IVF or ICSI | 1 | 150 | Odds Ratio (M‐H, Fixed, 95% CI) | 1.40 [0.62, 3.13] |
| 1.3 Conception mode Show forest plot | 6 | Odds Ratio (M‐H, Fixed, 95% CI) | Subtotals only | |
| 1.3.1 ICSI only | 3 | 640 | Odds Ratio (M‐H, Fixed, 95% CI) | 1.54 [1.02, 2.33] |
| 1.3.2 IVF only | 3 | 241 | Odds Ratio (M‐H, Fixed, 95% CI) | 1.00 [0.60, 1.68] |
| 1.4 Hatching method Show forest plot | 14 | Odds Ratio (M‐H, Fixed, 95% CI) | Subtotals only | |
| 1.4.1 Chemical | 4 | 366 | Odds Ratio (M‐H, Fixed, 95% CI) | 1.13 [0.74, 1.74] |
| 1.4.2 Laser | 10 | 2473 | Odds Ratio (M‐H, Fixed, 95% CI) | 1.07 [0.89, 1.28] |
| 1.5 Prognosis Show forest plot | 9 | Odds Ratio (M‐H, Fixed, 95% CI) | Subtotals only | |
| 1.5.1 Poor prognosis | 4 | 576 | Odds Ratio (M‐H, Fixed, 95% CI) | 1.46 [0.99, 2.15] |
| 1.5.2 Good prognosis | 6 | 1495 | Odds Ratio (M‐H, Fixed, 95% CI) | 1.03 [0.83, 1.28] |
| 1.6 Live birth rate by extent of assisted hatching Show forest plot | 14 | 2849 | Odds Ratio (M‐H, Fixed, 95% CI) | 1.09 [0.92, 1.29] |
| 1.6.1 Thinning only | 6 | 1742 | Odds Ratio (M‐H, Fixed, 95% CI) | 1.06 [0.86, 1.30] |
| 1.6.2 Breach by hole only | 8 | 1107 | Odds Ratio (M‐H, Fixed, 95% CI) | 1.15 [0.87, 1.51] |
| 1.7 Fresh or frozen embryo transfer Show forest plot | 12 | 1731 | Odds Ratio (M‐H, Fixed, 95% CI) | 1.14 [0.92, 1.41] |
| 1.7.1 Fresh | 11 | 1669 | Odds Ratio (M‐H, Fixed, 95% CI) | 1.16 [0.94, 1.44] |
| 1.7.2 Frozen | 1 | 62 | Odds Ratio (M‐H, Fixed, 95% CI) | 0.67 [0.22, 2.07] |
| Outcome or subgroup title | No. of studies | No. of participants | Statistical method | Effect size |
| 2.1 Multiple pregnancy rate per woman randomised Show forest plot | 18 | 4308 | Odds Ratio (M‐H, Fixed, 95% CI) | 1.38 [1.13, 1.68] |
| 2.2 First or repeat attempt Show forest plot | 8 | Odds Ratio (M‐H, Fixed, 95% CI) | Subtotals only | |
| 2.2.1 First attempt at IVF or ICSI | 4 | 654 | Odds Ratio (M‐H, Fixed, 95% CI) | 0.73 [0.31, 1.72] |
| 2.2.2 Repeat attempt at IVF or ICSI | 5 | 1068 | Odds Ratio (M‐H, Fixed, 95% CI) | 1.25 [0.80, 1.94] |
| 2.3 Conception mode Show forest plot | 9 | Odds Ratio (M‐H, Fixed, 95% CI) | Subtotals only | |
| 2.3.1 ICSI only | 3 | 573 | Odds Ratio (M‐H, Fixed, 95% CI) | 3.09 [1.57, 6.08] |
| 2.3.2 IVF only | 6 | 1126 | Odds Ratio (M‐H, Fixed, 95% CI) | 1.87 [1.28, 2.72] |
| 2.4 Hatching method Show forest plot | 18 | Odds Ratio (M‐H, Fixed, 95% CI) | Subtotals only | |
| 2.4.1 Chemical | 4 | 534 | Odds Ratio (M‐H, Fixed, 95% CI) | 1.55 [0.98, 2.47] |
| 2.4.2 Laser | 13 | 3730 | Odds Ratio (M‐H, Fixed, 95% CI) | 1.29 [1.03, 1.61] |
| 2.4.3 Mechanical | 1 | 44 | Odds Ratio (M‐H, Fixed, 95% CI) | 8.33 [1.56, 44.64] |
| 2.5 Prognosis Show forest plot | 10 | Odds Ratio (M‐H, Fixed, 95% CI) | Subtotals only | |
| 2.5.1 Poor prognosis | 6 | 1186 | Odds Ratio (M‐H, Fixed, 95% CI) | 1.95 [1.27, 3.00] |
| 2.5.2 Good prognosis | 6 | 1569 | Odds Ratio (M‐H, Fixed, 95% CI) | 1.08 [0.81, 1.44] |
| 2.6 Multiple pregnancy rate per woman grouped by extent of assisted hatching Show forest plot | 16 | Odds Ratio (M‐H, Fixed, 95% CI) | Subtotals only | |
| 2.6.1 Thinning only | 6 | 2148 | Odds Ratio (M‐H, Fixed, 95% CI) | 1.34 [1.02, 1.76] |
| 2.6.2 Breach by hole | 9 | 1629 | Odds Ratio (M‐H, Fixed, 95% CI) | 1.51 [1.08, 2.11] |
| 2.6.3 Complete removal of zona | 1 | 25 | Odds Ratio (M‐H, Fixed, 95% CI) | 0.62 [0.07, 5.28] |
| 2.7 Fresh or frozen embryo transfer Show forest plot | 16 | 3190 | Odds Ratio (M‐H, Fixed, 95% CI) | 1.38 [1.08, 1.75] |
| 2.7.1 Fresh | 13 | 2264 | Odds Ratio (M‐H, Fixed, 95% CI) | 1.30 [0.98, 1.73] |
| 2.7.2 Frozen | 3 | 926 | Odds Ratio (M‐H, Fixed, 95% CI) | 1.60 [1.00, 2.55] |
| 2.8 Multiple pregnancy per pregnancy Show forest plot | 17 | 1598 | Odds Ratio (M‐H, Fixed, 95% CI) | 1.37 [1.09, 1.72] |
| Outcome or subgroup title | No. of studies | No. of participants | Statistical method | Effect size |
| 3.1 Clinical pregnancy rate per woman randomised Show forest plot | 39 | 7249 | Odds Ratio (M‐H, Fixed, 95% CI) | 1.20 [1.09, 1.33] |
| 3.2 First or repeat attempt Show forest plot | 18 | Odds Ratio (M‐H, Fixed, 95% CI) | Subtotals only | |
| 3.2.1 First attempt at IVF or ICSI | 8 | 1010 | Odds Ratio (M‐H, Fixed, 95% CI) | 0.74 [0.56, 0.98] |
| 3.2.2 Repeat attempt at IVF or ICSI | 11 | 1798 | Odds Ratio (M‐H, Fixed, 95% CI) | 1.65 [1.34, 2.04] |
| 3.3 Conception mode Show forest plot | 26 | Odds Ratio (M‐H, Fixed, 95% CI) | Subtotals only | |
| 3.3.1 ICSI only | 11 | 1825 | Odds Ratio (M‐H, Fixed, 95% CI) | 1.40 [1.14, 1.71] |
| 3.3.2 IVF only | 15 | 2460 | Odds Ratio (M‐H, Fixed, 95% CI) | 1.31 [1.10, 1.55] |
| 3.4 Hatching method Show forest plot | 39 | Odds Ratio (M‐H, Fixed, 95% CI) | Subtotals only | |
| 3.4.1 Chemical | 11 | 1536 | Odds Ratio (M‐H, Fixed, 95% CI) | 1.33 [1.08, 1.64] |
| 3.4.2 Laser | 23 | 5127 | Odds Ratio (M‐H, Fixed, 95% CI) | 1.15 [1.03, 1.30] |
| 3.4.3 Mechanical | 5 | 586 | Odds Ratio (M‐H, Fixed, 95% CI) | 1.30 [0.89, 1.88] |
| 3.5 Prognosis Show forest plot | 24 | Odds Ratio (M‐H, Fixed, 95% CI) | Subtotals only | |
| 3.5.1 Poor prognosis | 14 | 2108 | Odds Ratio (M‐H, Fixed, 95% CI) | 1.68 [1.38, 2.04] |
| 3.5.2 Good prognosis | 14 | 2721 | Odds Ratio (M‐H, Fixed, 95% CI) | 1.10 [0.94, 1.29] |
| 3.6 Extent of assisted hatching Show forest plot | 37 | Odds Ratio (M‐H, Fixed, 95% CI) | Subtotals only | |
| 3.6.1 Thinning only | 17 | 3774 | Odds Ratio (M‐H, Fixed, 95% CI) | 1.10 [0.96, 1.26] |
| 3.6.2 Breach by hole only | 17 | 2543 | Odds Ratio (M‐H, Fixed, 95% CI) | 1.17 [0.98, 1.39] |
| 3.6.3 Complete removal of zona | 2 | 301 | Odds Ratio (M‐H, Fixed, 95% CI) | 1.93 [1.21, 3.09] |
| 3.6.4 Expansion of zona pellucida | 1 | 125 | Odds Ratio (M‐H, Fixed, 95% CI) | 2.37 [1.07, 5.28] |
| 3.7 Fresh and frozen embryo transfer Show forest plot | 38 | Odds Ratio (M‐H, Fixed, 95% CI) | Subtotals only | |
| 3.7.1 Fresh embryo transfer | 30 | 5349 | Odds Ratio (M‐H, Fixed, 95% CI) | 1.23 [1.10, 1.38] |
| 3.7.2 Frozen embryo transfer only | 10 | 1700 | Odds Ratio (M‐H, Fixed, 95% CI) | 1.15 [0.93, 1.42] |
| Outcome or subgroup title | No. of studies | No. of participants | Statistical method | Effect size |
| 4.1 Clinical pregnancies in trials reporting live births Show forest plot | 14 | 2849 | Odds Ratio (M‐H, Fixed, 95% CI) | 1.07 [0.92, 1.25] |
| Outcome or subgroup title | No. of studies | No. of participants | Statistical method | Effect size |
| 5.1 Miscarriage per woman randomised Show forest plot | 17 | 2810 | Odds Ratio (M‐H, Fixed, 95% CI) | 1.13 [0.82, 1.56] |
| 5.2 First or repeat attempt Show forest plot | 8 | Odds Ratio (M‐H, Fixed, 95% CI) | Subtotals only | |
| 5.2.1 First attempt at IVF or ICSI | 4 | 442 | Odds Ratio (M‐H, Fixed, 95% CI) | 0.98 [0.51, 1.89] |
| 5.2.2 Repeat attempt at IVF or ICSI | 5 | 966 | Odds Ratio (M‐H, Fixed, 95% CI) | 1.96 [0.90, 4.28] |
| 5.3 Conception mode Show forest plot | 10 | Odds Ratio (M‐H, Fixed, 95% CI) | Subtotals only | |
| 5.3.1 ICSI only | 4 | 665 | Odds Ratio (M‐H, Fixed, 95% CI) | 1.20 [0.58, 2.47] |
| 5.3.2 IVF only | 6 | 896 | Odds Ratio (M‐H, Fixed, 95% CI) | 1.28 [0.65, 2.52] |
| 5.4 Hatching method Show forest plot | 17 | Odds Ratio (M‐H, Fixed, 95% CI) | Subtotals only | |
| 5.4.1 Chemical | 5 | 412 | Odds Ratio (M‐H, Fixed, 95% CI) | 1.11 [0.56, 2.21] |
| 5.4.2 Laser | 11 | 2244 | Odds Ratio (M‐H, Fixed, 95% CI) | 1.13 [0.78, 1.64] |
| 5.4.3 Mechanical | 1 | 154 | Odds Ratio (M‐H, Fixed, 95% CI) | 1.14 [0.07, 18.58] |
| 5.5 Prognosis Show forest plot | 11 | Odds Ratio (M‐H, Fixed, 95% CI) | Subtotals only | |
| 5.5.1 Poor prognosis | 7 | 1133 | Odds Ratio (M‐H, Fixed, 95% CI) | 1.21 [0.70, 2.08] |
| 5.5.2 Good prognosis | 5 | 626 | Odds Ratio (M‐H, Fixed, 95% CI) | 1.03 [0.50, 2.14] |
| 5.6 Miscarriage per clinical pregnancy Show forest plot | 15 | 777 | Odds Ratio (M‐H, Random, 95% CI) | 0.94 [0.62, 1.43] |
| Outcome or subgroup title | No. of studies | No. of participants | Statistical method | Effect size |
| 6.1 Monozygotic twinning per woman randomised Show forest plot | 6 | 729 | Odds Ratio (M‐H, Fixed, 95% CI) | 3.23 [0.34, 31.03] |
| Outcome or subgroup title | No. of studies | No. of participants | Statistical method | Effect size |
| 7.1 Live births Show forest plot | 1 | 960 | Odds Ratio (M‐H, Fixed, 95% CI) | 1.08 [0.82, 1.41] |
| 7.2 Clinical pregnancies Show forest plot | 1 | 960 | Odds Ratio (M‐H, Fixed, 95% CI) | 1.10 [0.85, 1.43] |