Scolaris Content Display Scolaris Content Display

Study flow diagram.
Figuras y tablas -
Figure 1

Study flow diagram.

'Risk of bias' graph: review authors' judgements about each 'Risk of bias' item presented as percentages across all included trials.
Figuras y tablas -
Figure 2

'Risk of bias' graph: review authors' judgements about each 'Risk of bias' item presented as percentages across all included trials.

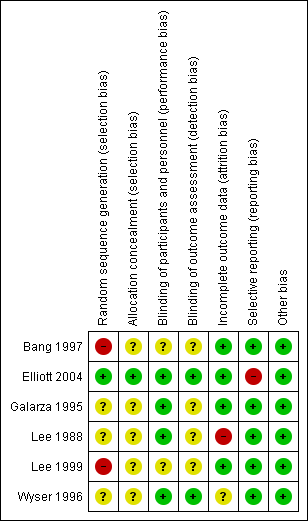
'Risk of bias' summary: review authors' judgements about each 'Risk of bias' item for each included trial.
Figuras y tablas -
Figure 3

'Risk of bias' summary: review authors' judgements about each 'Risk of bias' item for each included trial.

Comparison 1 Corticosteroids versus control (placebo or no steroids), Outcome 1 Residual pleural effusion on chest X‐ray.
Figuras y tablas -
Analysis 1.1

Comparison 1 Corticosteroids versus control (placebo or no steroids), Outcome 1 Residual pleural effusion on chest X‐ray.

Comparison 1 Corticosteroids versus control (placebo or no steroids), Outcome 2 Pleural changes at the end of treatment (pleural thickening and pleural adhesions).
Figuras y tablas -
Analysis 1.2

Comparison 1 Corticosteroids versus control (placebo or no steroids), Outcome 2 Pleural changes at the end of treatment (pleural thickening and pleural adhesions).

Comparison 1 Corticosteroids versus control (placebo or no steroids), Outcome 3 Death from any cause.
Figuras y tablas -
Analysis 1.3

Comparison 1 Corticosteroids versus control (placebo or no steroids), Outcome 3 Death from any cause.

Comparison 1 Corticosteroids versus control (placebo or no steroids), Outcome 4 Adverse events leading to study drug discontinuation.
Figuras y tablas -
Analysis 1.4

Comparison 1 Corticosteroids versus control (placebo or no steroids), Outcome 4 Adverse events leading to study drug discontinuation.

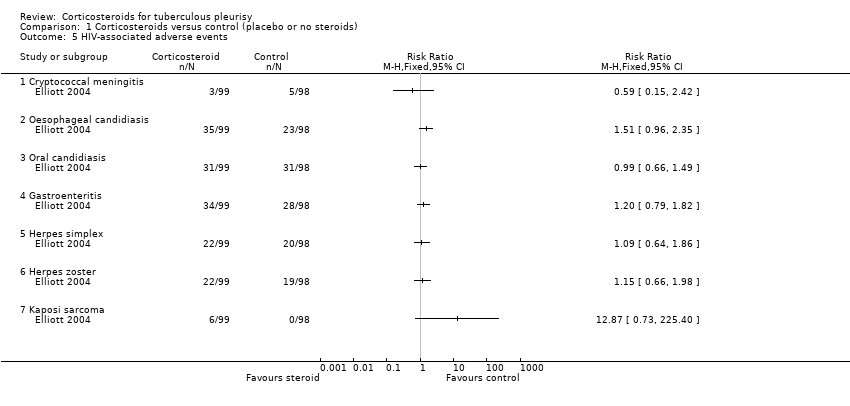
Comparison 1 Corticosteroids versus control (placebo or no steroids), Outcome 5 HIV‐associated adverse events.
Figuras y tablas -
Analysis 1.5

Comparison 1 Corticosteroids versus control (placebo or no steroids), Outcome 5 HIV‐associated adverse events.

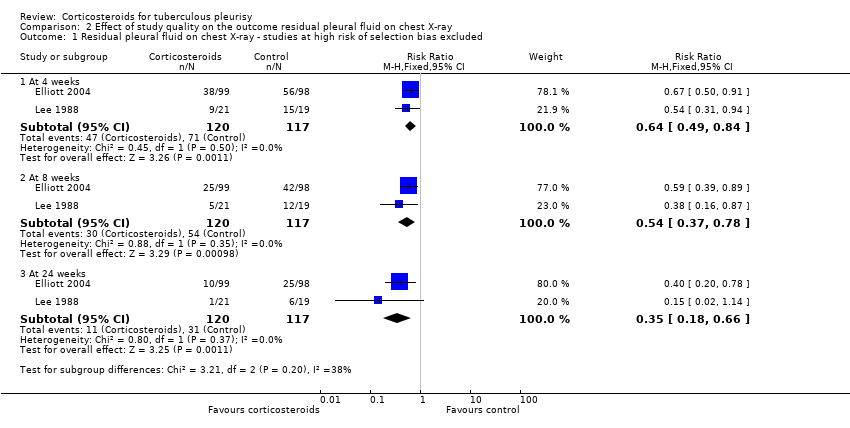
Comparison 2 Effect of study quality on the outcome residual pleural fluid on chest X‐ray, Outcome 1 Residual pleural fluid on chest X‐ray ‐ studies at high risk of selection bias excluded.
Figuras y tablas -
Analysis 2.1

Comparison 2 Effect of study quality on the outcome residual pleural fluid on chest X‐ray, Outcome 1 Residual pleural fluid on chest X‐ray ‐ studies at high risk of selection bias excluded.

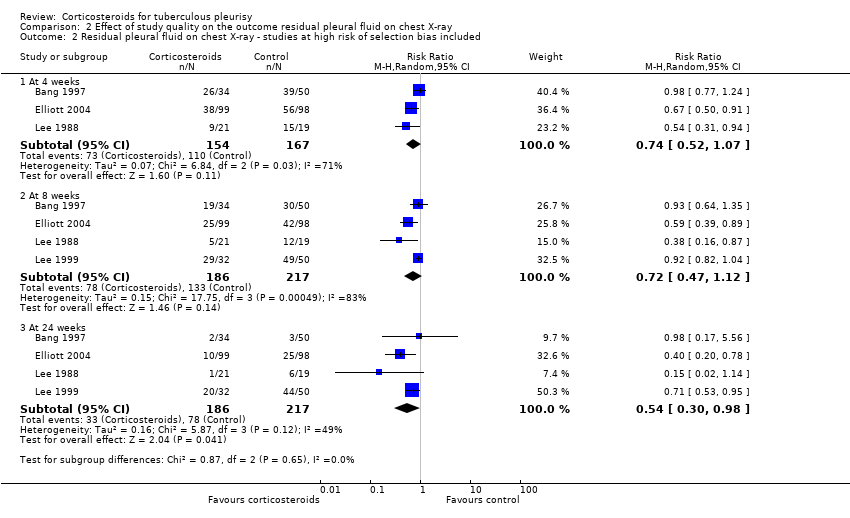
Comparison 2 Effect of study quality on the outcome residual pleural fluid on chest X‐ray, Outcome 2 Residual pleural fluid on chest X‐ray ‐ studies at high risk of selection bias included.
Figuras y tablas -
Analysis 2.2

Comparison 2 Effect of study quality on the outcome residual pleural fluid on chest X‐ray, Outcome 2 Residual pleural fluid on chest X‐ray ‐ studies at high risk of selection bias included.

Steroids compared with placebo for pleural TB

Patient or population: adults and adolescents with pleural TB

Settings: hospital care and community follow‐up

Intervention: corticosteroids

Comparison: placebo

Outcomes

Illustrative comparative risks¹ (95% CI)

Relative effect
(95% CI)

Number of participants
(trials)

Certainty of the evidence
(GRADE)

Assumed risk

Corresponding risk

Control

Corticosteroids

Residual pleural fluid on chest X‐ray at 8 weeks

62 per 100

33 per 100

(23 to 48)

RR 0.54

(0.37 to 0.78)

237

(2 trials)

⊕⊕⊝⊝1,2,3,4
low

Residual pleural fluid on chest X‐ray at 24 weeks

29 per 100

10 per 100

(5 to 19)

RR 0.35

(0.18 to 0.66)

237

(2 trials)

⊕⊕⊝⊝1,2,3,4

low

Pleural changes at the end of follow‐up

(pleural adhesions or pleural thickening on chest X‐ray; follow‐up 6 to 24 months)

50 per 100

36 per 100

(29 to 46)

RR 0.72

(0.57 to 0.92)

393

(5 trials)

⊕⊕⊝⊝5,6,7
low

Long‐term functional respiratory impairment (> 6 months)

Average percentage predicted FVC similar in corticosteroid and control groups.

187

(2 trials)

⊕⊝⊝⊝8
very low

Adverse events leading to treatment discontinuation

(follow‐up 6 to 24 months)

1 per 100

3 per 100
(1 to 7)

RR 2.78

(1.11 to 6.94)

590
(6 trials)

⊕⊕⊝⊝9,10
low

HIV‐related infections (cryptococcal meningitis)

5 per 100

3 per 100

(1 to 12)

RR 0.59

(0.15 to 2.42)

103

(1 trial)

⊕⊝⊝⊝11,12
very low

HIV‐related cancer (Kaposi's sarcoma)

14 per 100013

180 per 1000

(1 to 316)

RR 12.87

(0.73 to 225.40)

103

(1 trial)

⊕⊝⊝⊝14,15
very low

¹The basis for the assumed risk (for example, the median control group risk across studies) is provided in footnotes. The corresponding risk (and its 95% CI) is based on the assumed risk in the comparison group and the relative effect of the intervention (and its 95% CI).
Abbreviations: CI: confidence interval; GRADE: Grading of Recommendations Assessment, Development and Evaluation; RR: risk ratio; TB: tuberculosis; FVC: forced vital capacity.

GRADE Working Group grades of evidence
High quality: further research is very unlikely to change our confidence in the estimate of effect.
Moderate quality: further research is likely to have an important impact on our confidence in the estimate of effect and may change the estimate.
Low quality: further research is very likely to have an important impact on our confidence in the estimate of effect and is likely to change the estimate.
Very low quality: we are very uncertain about the estimate.

1Downgraded by one for risk of bias: of the four trials that reported this outcome, we excluded two trials from the final analysis due to high risk of selection bias, after a subgroup analysis suggested the pooled estimate including these studies could be misleading (Bang 1997; Lee 1999). We judged this to be our best estimate of effect. However because we excluded trials from this analysis this generates uncertainty, so we have downgraded the quality of the evidence.
2Not downgraded for inconsistency: heterogeneity in the original meta‐analysis was likely due to differences in study quality. A subgroup analysis showed that statistical heterogeneity disappeared when we excluded trials that were at high risk of selection bias.
3Downgraded by one for imprecision: the CI around the summary effect estimate is wide due to the small number of participants and events in each included trial.
4Not downgraded for indirectness: the included trials were performed in different settings and time periods and used widely available drugs and diagnostic techniques. Although the trials did not include children, we did not downgrade as pleural TB is less common in children than in adults. One trial included HIV‐positive people, Elliott 2004, and this trial contributed most of the participants in the meta‐analysis. When making recommendations relating to the use of corticosteroids for pleural TB in children or in HIV‐negative adults, guideline panels may wish to consider downgrading for indirectness.
5Downgraded by one for serious risk of bias: we assessed two trials as at high risk of bias for randomization method (Bang 1997; Lee 1999), and the other three trials were at unclear risk of bias (Galarza 1995; Lee 1988; Wyser 1996). Only Wyser 1996 reported that outcome assessors were blinded to the treatment allocation.
6Downgraded by one for serious imprecision: the CI around the summary effect estimate is wide, ranging from a maximum risk reduction with steroids of 43% to a minimum risk reduction of 7%, which may not be clinically significant when weighed against possible harms of steroids.
7Not downgraded for indirectness: the trials were performed in a variety of settings, and all used drugs and diagnostic techniques that are widely available. We did not include any HIV‐positive people in this meta‐analysis, so when making recommendations regarding the use of corticosteroids in HIV‐positive people with TB pleurisy, guideline panels may wish to consider downgrading for indirectness. Only one trial included children aged over 11 years of age (Galarza 1995), but we did not downgrade as pleural TB is not common in children.
8Two of the six trials reported pulmonary function tests at the end of treatment (Galarza 1995; Wyser 1996), but data were insufficient to combine these outcomes in a meta‐analysis. The data are in Table 7, and suggest that in these trials there was little or no difference in mean percentage predicted FVC at the end of treatment. The number of participants in each group with pulmonary function tests suggestive of a functional respiratory impairment are not reported.
9Downgraded by one for risk of bias: there were concerns about randomization method and allocation concealment. Additionally, reporting of adverse events varied significantly across the trials, and some trials only reported on adverse events in the steroid group, and it is likely that some trials did not detect or report all adverse events.
10Downgraded by one for serious imprecision: the CI around the summary effect estimate is wide, with a maximum increased risk of adverse effects leading to study drug discontinuation of nearly 700% and a minimum increased risk of 12%, which may not be clinically significant when weighed against possible benefits of steroids.
11Downgraded by two for serious imprecision: the CI around the summary effect estimate is very wide, and possible effects range from large benefits to significant harms.
12Downgraded by one for indirectness: only one trial included HIV‐positive people and assessed HIV‐related adverse events (Elliott 2004). Participants in this trial were not treated with antiretroviral therapy, which is known to prevent cryptococcal meningitis in HIV‐positive people; therefore this estimate may not be applicable to HIV‐positive people on antiretroviral therapy. This trial did not include any children.
13Prevalence of Kaposi's sarcoma of 1.4% in HIV‐positive adults on clinic enrolment taken from Semeere 2016, a multi‐centre prospective cohort study performed in Uganda and Kenya.
14Downgraded by two for serious imprecision: the CI around the summary effect estimate is very wide, and possible effects range from large benefits to significant harms.
15Downgraded by one for indirectness: only one trial included HIV‐positive people and assessed HIV‐related adverse events (Elliott 2004). Participants in this trial were not treated with antiretroviral therapy, which is known to treat and prevent Kaposi's sarcoma in HIV‐positive people, therefore this estimate may not be applicable to HIV‐positive people on antiretroviral therapy. This trial did not include any children.

Figuras y tablas -
Table 1. Theoretical framework describing differences between isolated tuberculous pleurisy and pulmonary TB with tuberculous pleurisy (pleuro‐pulmonary TB)

Clinical Feature

Isolated pleural TB

Pleuro‐pulmonary TB

Sputum microscopy/culture

Negative

Some positive

Pleural fluid

Usually demonstrates exudative effusion

Usually negative for M. tuberculosis on smear and culture

Usually demonstrates exudative effusion

Usually negative for M. tuberculosis on smear and culture

Chest X‐ray

Discrete pleural effusion, or pleural thickening, or both

Pleural effusion with other changes such as consolidation, cavities, atelectasis, or hilar enlargement

Chest computed tomography (CT)

May demonstrate underlying lung infection

Demonstrates underlying lung infection

Pathogenesis

Predominantly driven by delayed type hypersensitivity reaction

Predominantly driven by TB infection of the lung

Prognosis

Most people will improve with no antituberculous treatment (ATT), but may experience a relapse of TB infection

People may deteriorate and die without ATT

Figuras y tablas -
Table 1. Theoretical framework describing differences between isolated tuberculous pleurisy and pulmonary TB with tuberculous pleurisy (pleuro‐pulmonary TB)
Table 2. Summary of characteristics of included studies

Trial

Country

Year

Participants

Adults or children

HIV status

ATT regimen

Therapeutic thoracocentesis performed

Steroid group

Control group

Bang 1997

South Korea

1991 to 1994

34

50

Adults

Not reported

2RHZE/7RHE

No

Elliott 2004

Uganda

1998 to 2002

99

98

Adults

Positive

2RHZE/4RH

No

Galarza 1995

Spain

1985 to 1992

57

60

Both

Negative

6RH

Yes

Lee 1988

Taiwan

1983 to 1987

21

19

Adults

Not reported

3RHE/6‐9RH

No

Lee 1999

South Korea

1990 to 1997

50

32

Adults

Not reported

6RHZE or 2RHZS/4RHZ

No

Wyser 1996

South Africa

1994 to 1995

34

36

Adults

Negative

6RHZ

Yes

Abbreviations: ATT: antituberculous treatment; E: ethambutol; H: isoniazid; R: rifampicin; S: streptomycin; Z: pyrazinamide.

Figuras y tablas -
Table 2. Summary of characteristics of included studies
Table 3. Diagnostic testing in included trials

Trial

Diagnostic criteria for pleural TB

Other diagnostic tests

Bang 1997

Microscopy positive for AFB or culture positive from sputum, pleural fluid, or pleural biopsy.

  • Chest X‐ray

Elliott 2004

Positive culture from pleural biopsy, pleural fluid, or sputum, or histopathologic analysis of pleural biopsy consistent with tuberculous pleurisy

  • Chest X‐ray

  • HIV test (rapid test and ELISA)

  • Serum cryptococcal antigen test

  • CD4+ cell count

  • HIV viral load (plasma and pleural fluid)

  • Serum glucose

Galarza 1995

At least one of the following

  • Pleural exudate with positive culture

  • Pleural biopsy culture positive

  • Pleural biopsy with caseating granulomas with Langhans giant cells,

  • Epithelioid cells and lymphocytes

  • Compatible clinico‐radiological picture plus 2 or more of the following:

    • age < 40 years, PPD > 6 mm or conversion using 5 units of tuberculin PPD‐S, lymphocytic pleural fluid (> 70% lymphocytes), pleural fluid levels of adenosine deaminase activity (ADA) > 60 U/mL

  • Chest X‐ray

  • Simple spirometry (FVC and FEV1)

  • Serum biochemistry

  • Full blood count

  • HIV test

Lee 1988

Pleural biopsy reported as pleural TB or chronic granulomatous inflammation

  • Chest X‐ray

  • Unspecified diagnostic tests to exclude heart failure, malignancy, pneumonia, diabetes mellitus

  • Chest ultrasound or CT scan in participants with persisting pleural effusion after 3 months

Lee 1999

TB on pleural biopsy, or pleural effusion plus AFB stain positive or culture positive from sputum, pleural fluid, or pleural biopsy

  • Chest X‐ray

Wyser 1996

Pleural biopsy with caseating granulomata with or without AFB on histological examination, or positive culture.

  • Chest X‐ray

  • Unspecified tests to rule out pneumonia, empyema, malignancy, diabetes mellitus

  • HIV test

  • Thoracoscopy and bronchoscopy performed under general anaesthesia

  • High‐resolution CT chest at three levels to measure pleural thickness

  • Spirometry and body plethysmography

Abbreviations: ADA: adenosine deaminase activity; AFB: acid‐fast bacilli; CT: computed tomography; ELISA: enzyme‐linked immunosorbent assay; FEV1: forced expiratory volume at one second; FVC: forced vital capacity; HIV: human immunodeficiency virus; PPD: purified protein derivative; PPD‐S: purified protein derivative‐standard; TB: tuberculosis

Figuras y tablas -
Table 3. Diagnostic testing in included trials
Table 4. Corticosteroid regimens in included studies

Trial

Steroid

Regimen

Bang 1997

Prednisolone

1 mg/kg twice daily, tapered by 10 mg each week until cessation

Elliott 2004

Prednisolone

50 mg daily for 2 weeks, 40 mg daily for 2 weeks, then 25 mg daily for 2 weeks, then 15 mg daily for 2 weeks, then stopped

Galarza 1995

Prednisone

1 mg/kg/day for 15 days, tapering over the next 15 days

Lee 1988

Prednisolone

0.75 mg/kg/day, tapered by 5 mg per week until discontinued once radiological improvement was seen

Lee 1999

Prednisolone

30 mg four times daily for 1 month and tapered over the following month

Wyser 1996

Prednisone

0.75 mg/kg/day for 2 to 4 weeks; dose tapered by 5 mg/day over 2 weeks after clinical and radiological improvement

Abbreviations: mg: milligrams

Figuras y tablas -
Table 4. Corticosteroid regimens in included studies
Table 5. Results: Time to resolution of symptoms

Trial

Indicator

Units

Corticosteroids

Control

Mean values

Bang 1997

“Fever, pleuritic pain, malaise and breathlessness”

Mean days to resolution

3.8 (N = 34)

7.41 (N = 50)

Galarza 1995

“Fever duration”

Mean days

3.32 (N = 57)

4.15 (N = 60)

Lee 1988

“Fever, pleuritic pain, malaise and breathlessness”

Mean days to resolution

2.4 (N = 21)

5.6 (N = 19)

Cut‐offs (categorical)

Elliott 2004

“Anorexia”

Number of participants with anorexia at 4 weeks

3/99 (3%)

18/98 (18.4%)

“Cough”

Number of participants with cough at 4 weeks

35/99 (35.4%)

57/98 (58.2%)

“Weight”

Mean weight in kg at 4 weeks

57

52.5

Wyser 1996

Symptoms resolved in all patients (VAS score)

Weeks

12

16

Abbreviations: kg: kilograms; VAS: visual analogue scale
1P < 0.05.

Figuras y tablas -
Table 5. Results: Time to resolution of symptoms
Table 6. Time to resolution of pleural effusion on chest X‐ray

Trial

Units

Corticosteroids

Control

Mean values

Bang 1997

Mean days to resolution

88 (N=34)

100 (N=50)

Lee 1988

Mean days to resolution

54.5 (N=21)

123.2 (N=19)

Galarza 1995

Reabsorption index1 at 4 weeks

93%

89%2

Categorical values

Bang 1997

Number of participants with residual effusion at 4 weeks

26/34 (76.5%)

39/50 (78%)

Number of participants with residual effusion at 8 weeks

19/34 (55.9%)

30/50 (60%)

Number of participants with residual effusion at 24 weeks

2/34 (5.9%)

3/50 (6%)

Elliott 2004

Number of participants with residual effusion at 4 weeks

38/99 (38.4%)

56/98 (57.1%)

Number of participants with residual effusion at 8 weeks

25/99 (30.3%)

42/98 (56.1%)

Number of participants with residual effusion at 24 weeks

10/99 (10.1%)

25/98 (25.5%)3

Lee 1988

Number of participants with residual effusion at 4 weeks

9/21 (42.9%)

15/19 (78.9%)

Number of participants with residual effusion at 8 weeks

5/21 (23.8%)

12/19 (63.2%)

Number of participants with residual effusion at 24 weeks

1/21 (4.8%)

6/19 (31.6%)

Lee 1999

Number of participants with residual effusion at 8 weeks

29/32 (90.6%)

49/50 (98%)

Number of participants with residual effusion at 24 weeks

20/32 (62.5%)

44/50 (88%)

Abbreviations: N: number of participants
1Reabsorption index = (length of affected hemithorax/length of healthy hemithorax) x 100.
2P = 0.01.
3Data at this time point extrapolated from graph. Data for 4 weeks and 8 weeks from the trial authors (unpublished data).

Figuras y tablas -
Table 6. Time to resolution of pleural effusion on chest X‐ray
Table 7. Pulmonary function at the end of treatment

Trial

Indicator

Units

Corticosteroids

Control

Galarza 1995

Percentage predicted FVC

Mean percentage predicted FVC

95% (N = 57)

95% (N = 60)1

Wyser 1996

Percentage predicted FVC

Mean percentage predicted FVC

85% (N = 34)

80% (N = 36)2

Lung function impairment

Number of participants with restrictive PFT results

11/34 (33.3%)

14/36 (39.4%)3

Abbreviations: FVC: forced vital capacity; N: number of participants; PFT: pulmonary function tests
1Range 65% to 130% in steroid group, 63% to 140% in placebo group.
2Read from graph, P = 0.65.
3P = 0.72. Results extrapolated from percentages.

Figuras y tablas -
Table 7. Pulmonary function at the end of treatment
Table 8. Adverse events leading to discontinuation of the trial drug

Trial

Corticosteroid

Control

Bang 1997

1/34 (2.9%)1

0/50

Elliott 2004

9/99 (9.1%)2

2/98 (2.0%)

Galarza 1995

0/57

NR

Lee 1988

1/21 (4.8%)3

NR

Lee 1999

NR

NR

Wyser 1996

4/34 (11.8%)

3/36 (8.3%)4

Abbreviations: NR: not reported

1Aggravation of epigastric pain in one patient, steroids stopped, and patient withdrawn from the trial.
2Trial drug discontinued for hyperglycaemia (two participants), hypertension (three participants), herpes zoster (three participants), oesophageal candidiasis (one participant) in the corticosteroid group; in the placebo group hyperglycaemia (one participant) and hypertension (one participant).
3One participant developed moon facies, epigastric pain, and lower limb oedema, all of which resolved on tapering the dosage.
4Epigastric pain was the only adverse effect noted, and affected four participants in the steroid group and three in the control group.

Figuras y tablas -
Table 8. Adverse events leading to discontinuation of the trial drug
Table 9. Results: HIV‐related adverse events

Trial

Indicator

Control (N/98)

Corticosteroid (N/99)

Elliott 2004

Kaposi’s sarcoma

0

6 (6.1%)

Cryptococcal meningitis

5 (5.1%)

3 (3.0%)

Oesophageal candidiasis

23 (23.5%)

35 (35.4%)

Oral candidiasis

31 (32.6%)

31 (31.3%)

Herpes zoster

19 (19.4%)

22 (22.2%)

Oral or genital herpes simplex

20 (20.4%)

22 (22.2%)

Gastroenteritis

28 (28.6%)

34 (34.3%)

Abbreviations: N: number of participants

Figuras y tablas -
Table 9. Results: HIV‐related adverse events
Comparison 1. Corticosteroids versus control (placebo or no steroids)

Outcome or subgroup title

No. of studies

No. of participants

Statistical method

Effect size

1 Residual pleural effusion on chest X‐ray Show forest plot

2

Risk Ratio (M‐H, Fixed, 95% CI)

Subtotals only

1.1 At 4 weeks

2

237

Risk Ratio (M‐H, Fixed, 95% CI)

0.64 [0.49, 0.84]

1.2 At 8 weeks

2

237

Risk Ratio (M‐H, Fixed, 95% CI)

0.54 [0.37, 0.78]

1.3 At 24 weeks

2

237

Risk Ratio (M‐H, Fixed, 95% CI)

0.35 [0.18, 0.66]

2 Pleural changes at the end of treatment (pleural thickening and pleural adhesions) Show forest plot

5

393

Risk Ratio (M‐H, Fixed, 95% CI)

0.72 [0.57, 0.92]

3 Death from any cause Show forest plot

1

197

Risk Ratio (M‐H, Fixed, 95% CI)

0.91 [0.64, 1.31]

4 Adverse events leading to study drug discontinuation Show forest plot

6

590

Risk Ratio (M‐H, Fixed, 95% CI)

2.78 [1.11, 6.94]

5 HIV‐associated adverse events Show forest plot

1

Risk Ratio (M‐H, Fixed, 95% CI)

Totals not selected

5.1 Cryptococcal meningitis

1

Risk Ratio (M‐H, Fixed, 95% CI)

0.0 [0.0, 0.0]

5.2 Oesophageal candidiasis

1

Risk Ratio (M‐H, Fixed, 95% CI)

0.0 [0.0, 0.0]

5.3 Oral candidiasis

1

Risk Ratio (M‐H, Fixed, 95% CI)

0.0 [0.0, 0.0]

5.4 Gastroenteritis

1

Risk Ratio (M‐H, Fixed, 95% CI)

0.0 [0.0, 0.0]

5.5 Herpes simplex

1

Risk Ratio (M‐H, Fixed, 95% CI)

0.0 [0.0, 0.0]

5.6 Herpes zoster

1

Risk Ratio (M‐H, Fixed, 95% CI)

0.0 [0.0, 0.0]

5.7 Kaposi sarcoma

1

Risk Ratio (M‐H, Fixed, 95% CI)

0.0 [0.0, 0.0]

Figuras y tablas -
Comparison 1. Corticosteroids versus control (placebo or no steroids)
Comparison 2. Effect of study quality on the outcome residual pleural fluid on chest X‐ray

Outcome or subgroup title

No. of studies

No. of participants

Statistical method

Effect size

1 Residual pleural fluid on chest X‐ray ‐ studies at high risk of selection bias excluded Show forest plot

2

Risk Ratio (M‐H, Fixed, 95% CI)

Subtotals only

1.1 At 4 weeks

2

237

Risk Ratio (M‐H, Fixed, 95% CI)

0.64 [0.49, 0.84]

1.2 At 8 weeks

2

237

Risk Ratio (M‐H, Fixed, 95% CI)

0.54 [0.37, 0.78]

1.3 At 24 weeks

2

237

Risk Ratio (M‐H, Fixed, 95% CI)

0.35 [0.18, 0.66]

2 Residual pleural fluid on chest X‐ray ‐ studies at high risk of selection bias included Show forest plot

4

Risk Ratio (M‐H, Random, 95% CI)

Subtotals only

2.1 At 4 weeks

3

321

Risk Ratio (M‐H, Random, 95% CI)

0.74 [0.52, 1.07]

2.2 At 8 weeks

4

403

Risk Ratio (M‐H, Random, 95% CI)

0.72 [0.47, 1.12]

2.3 At 24 weeks

4

403

Risk Ratio (M‐H, Random, 95% CI)

0.54 [0.30, 0.98]

Figuras y tablas -
Comparison 2. Effect of study quality on the outcome residual pleural fluid on chest X‐ray