Intra‐uterine insemination for unexplained subfertility
Información
- DOI:
- https://doi.org/10.1002/14651858.CD001838.pub5Copiar DOI

- Base de datos:
-
- Cochrane Database of Systematic Reviews
- Versión publicada:
-
- 19 febrero 2016see what's new
- Tipo:
-
- Intervention
- Etapa:
-
- Review
- Grupo Editorial Cochrane:
-
Grupo Cochrane de Ginecología y fertilidad
- Copyright:
-
- Copyright © 2016 The Cochrane Collaboration. Published by John Wiley & Sons, Ltd.
Cifras del artículo
Altmetric:
Citado por:
Autores
Contributions of authors
Susanne Veltman‐Verhulst: took the lead in rewriting the protocol and writing and updating the review. She completed the literature search and selection of the trials and performed the data extraction and analyses.
Edward Hughes: performed data extraction on the included trials and contributed to drafts of the initial review.
Reuben Ayeleke: Performed the updated search, created the 'Summary of findings' tables and contributed to the writing and updating of the review
Ben Cohlen: was the primary author of the first publication of the protocol (1999). He worked as second reviewer on selection of the relevant trials and assisted with the writing of the document and updates of the draft.
Sources of support
Internal sources
-
No sources of support supplied
External sources
-
Van Harreveld Stichting, Netherlands.
-
Marco Polo fonds, Netherlands.
-
Stichting de Korinthiers, Netherlands.
-
Jan Kornelis de Kock Stichting, Netherlands.
Declarations of interest
Susanne Veltman‐Verhulst: none known
Edward Hughes: none known
Reuben Ayeleke: none known
Ben Cohlen: none known
Acknowledgements
We wish to thank all colleagues of Cochrane Gynaecology and Fertility for their help. Special thanks to Cindy Farquhar, Jane Marjoribanks, Anne Lethaby, Helen Nagels and statistician Andy Vail for all their advice and support.
Thanks are also expressed to all authors for their responses and additional information on their trials.
We acknowledge the contribution of Professor Maas Jan Heineman to previous versions of this review.
Version history
| Published | Title | Stage | Authors | Version |
| 2020 Mar 03 | Intra‐uterine insemination for unexplained subfertility | Review | Reuben Olugbenga Ayeleke, Joyce Danielle Asseler, Ben J Cohlen, Susanne M Veltman‐Verhulst | |
| 2016 Feb 19 | Intra‐uterine insemination for unexplained subfertility | Review | Susanne M Veltman‐Verhulst, Edward Hughes, Reuben Olugbenga Ayeleke, Ben J Cohlen | |
| 2012 Sep 12 | Intra‐uterine insemination for unexplained subfertility | Review | Susanne M Veltman‐Verhulst, Ben J Cohlen, Edward Hughes, Maas Jan Heineman | |
| 2006 Oct 18 | Intra‐uterine insemination for unexplained subfertility | Review | Susanne M Veltman‐Verhulst, Ben J Cohlen, Edward Hughes, Maas Jan Heineman | |
| 2005 Oct 19 | Intra‐uterine insemination for unexplained subfertility | Protocol | Susanne M. Verhulst, Ben BJ Cohlen, Edward Hughes, Maas Jan Heineman, Egbert Te Velde | |
| 1999 Oct 25 | Intra‐uterine insemination for unexplained subfertility | Protocol | Ben J Cohlen, Edward Hughes, E R te Velde, Egbert Te Velde | |
Differences between protocol and review
We moved multiple pregnancy rate to be a primary outcome in the 2015 update.
Keywords
MeSH
Medical Subject Headings (MeSH) Keywords
- Abortion, Spontaneous [epidemiology];
- *Coitus;
- Fertile Period [physiology];
- Fertility Agents, Female [therapeutic use];
- Infertility [*therapy];
- Insemination, Artificial [adverse effects, *methods];
- Live Birth [epidemiology];
- Ovarian Hyperstimulation Syndrome;
- Ovulation Induction [adverse effects, *methods];
- *Pregnancy Rate;
- Pregnancy, Multiple [statistics & numerical data];
- Randomized Controlled Trials as Topic;
- Time Factors;
- Watchful Waiting;
Medical Subject Headings Check Words
Female; Humans; Male; Pregnancy;
PICO

Methodological quality graph: review authors' judgements about each methodological quality item presented as percentages across all included studies.
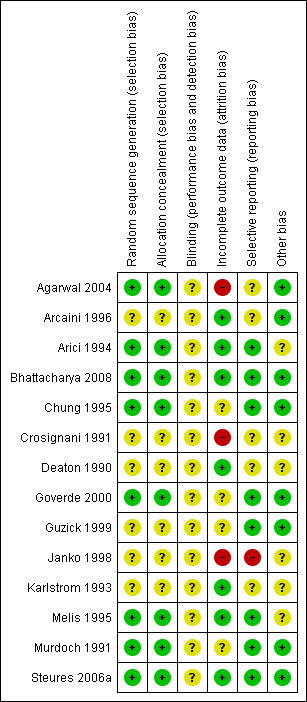
Methodological quality summary: review authors' judgements about each methodological quality item for each included study.

Study flow diagram.

Funnel plot of comparison: 2 IUI versus TI both in stimulated cycle, outcome: 2.3 Pregnancy rate per couple (all cycles).
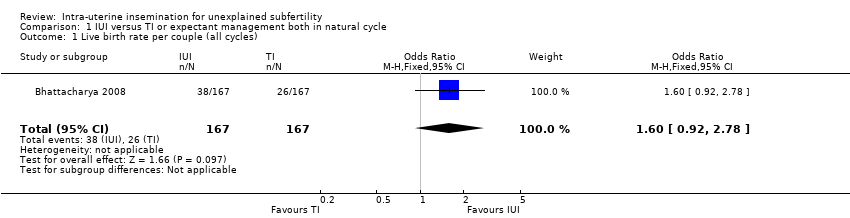
Comparison 1 IUI versus TI or expectant management both in natural cycle, Outcome 1 Live birth rate per couple (all cycles).

Comparison 1 IUI versus TI or expectant management both in natural cycle, Outcome 2 Multiple pregnancy rate per couple.

Comparison 1 IUI versus TI or expectant management both in natural cycle, Outcome 3 Pregnancy rate per couple (all cycles).
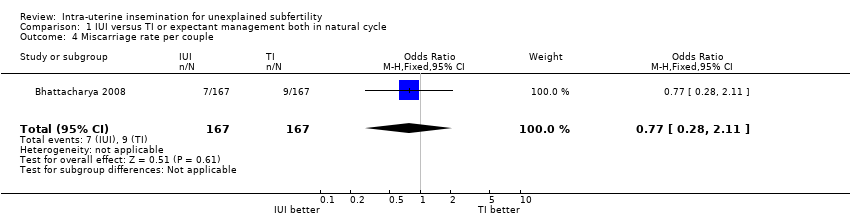
Comparison 1 IUI versus TI or expectant management both in natural cycle, Outcome 4 Miscarriage rate per couple.

Comparison 1 IUI versus TI or expectant management both in natural cycle, Outcome 5 Ectopic pregnancy rate per couple.

Comparison 2 IUI versus TI or expectant management both in stimulated cycle, Outcome 1 Live birth rate per couple (all cycles).

Comparison 2 IUI versus TI or expectant management both in stimulated cycle, Outcome 2 Multiple pregnancy rate per couple.
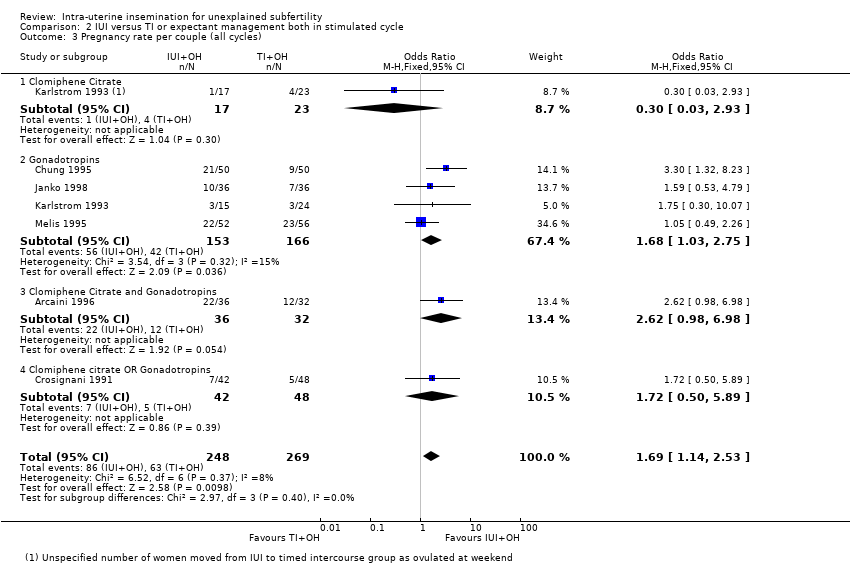
Comparison 2 IUI versus TI or expectant management both in stimulated cycle, Outcome 3 Pregnancy rate per couple (all cycles).
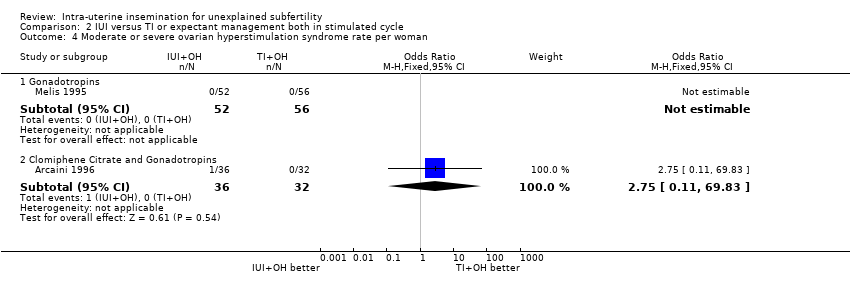
Comparison 2 IUI versus TI or expectant management both in stimulated cycle, Outcome 4 Moderate or severe ovarian hyperstimulation syndrome rate per woman.

Comparison 2 IUI versus TI or expectant management both in stimulated cycle, Outcome 5 Miscarriage rate per couple.

Comparison 2 IUI versus TI or expectant management both in stimulated cycle, Outcome 6 Ectopic pregnancy rate per couple.

Comparison 3 IUI in natural cycle versus IUI in stimulated cycle, Outcome 1 Live birth rate per couple (all cycles).

Comparison 3 IUI in natural cycle versus IUI in stimulated cycle, Outcome 2 Multiple pregnancy rate per couple.

Comparison 3 IUI in natural cycle versus IUI in stimulated cycle, Outcome 3 Pregnancy rate per couple (all cycles).
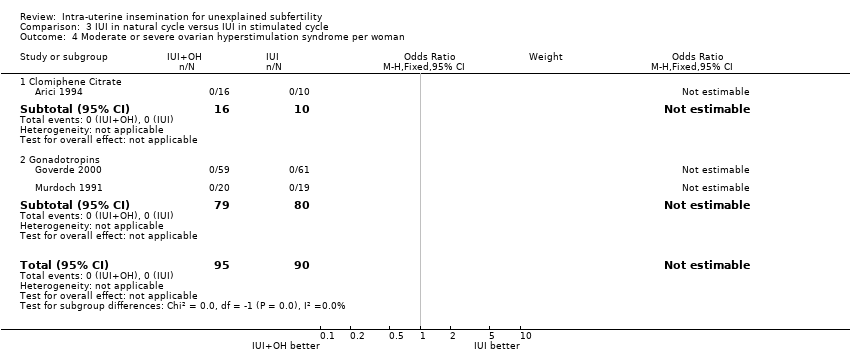
Comparison 3 IUI in natural cycle versus IUI in stimulated cycle, Outcome 4 Moderate or severe ovarian hyperstimulation syndrome per woman.
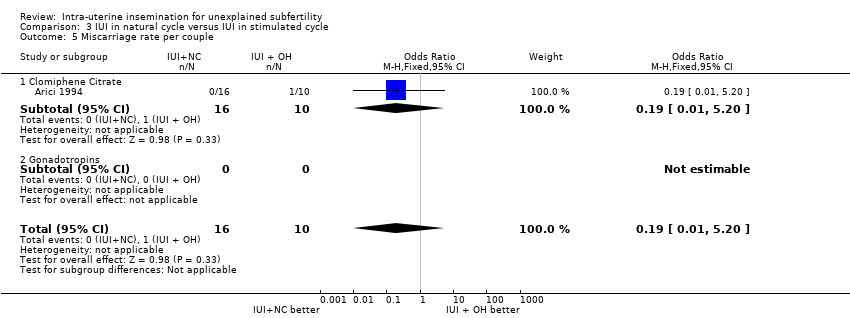
Comparison 3 IUI in natural cycle versus IUI in stimulated cycle, Outcome 5 Miscarriage rate per couple.

Comparison 3 IUI in natural cycle versus IUI in stimulated cycle, Outcome 6 Ectopic pregnancy rate per couple.

Comparison 4 IUI in stimulated cycle versus TI or expectant management in natural cycle, Outcome 1 Live birth rate per couple (all cycles).

Comparison 4 IUI in stimulated cycle versus TI or expectant management in natural cycle, Outcome 2 Multiple pregnancy rate per couple.
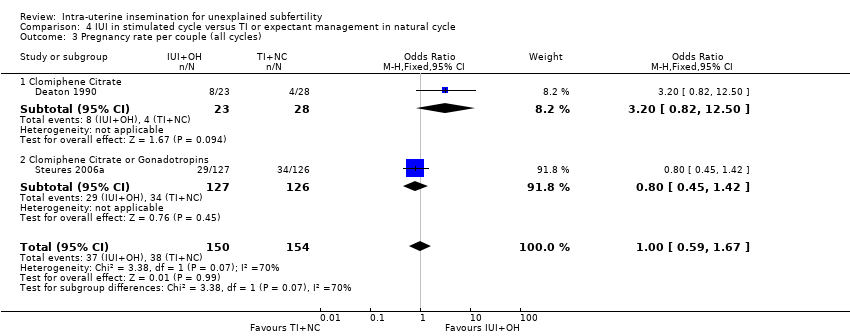
Comparison 4 IUI in stimulated cycle versus TI or expectant management in natural cycle, Outcome 3 Pregnancy rate per couple (all cycles).
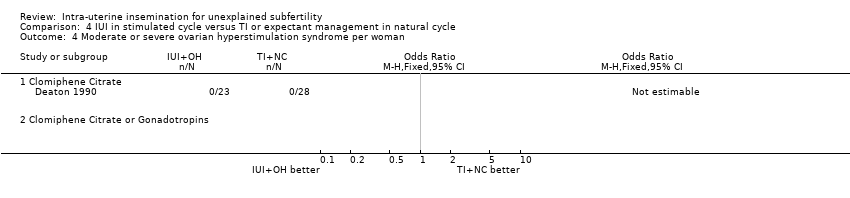
Comparison 4 IUI in stimulated cycle versus TI or expectant management in natural cycle, Outcome 4 Moderate or severe ovarian hyperstimulation syndrome per woman.

Comparison 4 IUI in stimulated cycle versus TI or expectant management in natural cycle, Outcome 5 Miscarriage rate per couple.

Comparison 5 IUI in natural cycle versus TI or expectant management in stimulated cycle, Outcome 1 Live birth rate per couple (all cycles).
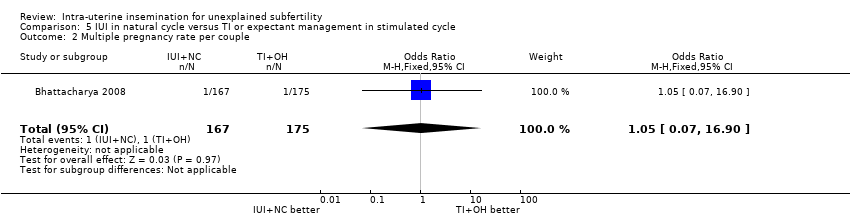
Comparison 5 IUI in natural cycle versus TI or expectant management in stimulated cycle, Outcome 2 Multiple pregnancy rate per couple.
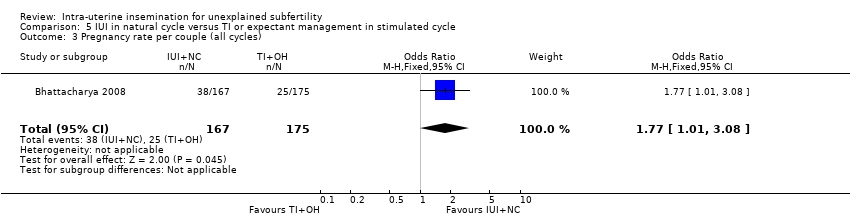
Comparison 5 IUI in natural cycle versus TI or expectant management in stimulated cycle, Outcome 3 Pregnancy rate per couple (all cycles).

Comparison 5 IUI in natural cycle versus TI or expectant management in stimulated cycle, Outcome 4 Miscarriage rate per couple.

Comparison 5 IUI in natural cycle versus TI or expectant management in stimulated cycle, Outcome 5 Ectopic pregnancy rate per couple.
| IUI compared to TI or expectant management both in natural cycle for unexplained subfertility | ||||||
| Patient or population: people with unexplained subfertility | ||||||
| Outcomes | Illustrative comparative risks* (95% CI) | Relative effect | No of Participants | Quality of the evidence | Comments | |
| Assumed risk | Corresponding risk | |||||
| TI or expectant management both in natural cycle | IUI | |||||
| Live birth rate per couple (all cycles) | 156 per 1000 | 228 per 1000 | OR 1.60 | 334 | ⊕⊕⊕⊝ | |
| Multiple pregnancy rate per couple | 12 per 1000 | 6 per 1000 | OR 0.50 | 334 | ⊕⊕⊕⊝ | |
| Pregnancy rate per couple (all cycles) | 162 per 1000 | 228 per 1000 | OR 1.53 | 334 | ⊕⊕⊕⊝ | |
| Ovarian Hyperstimulation Syndrome rate per woman ‐ not reported | Not estimable | ‐ | ||||
| Miscarriage rate per couple | 54 per 1000 | 42 per 1000 | OR 0.77 | 334 | ⊕⊕⊕⊝ | |
| Ectopic pregnancy rate per couple | Not estimable | OR 5.06 | 334 | ⊕⊕⊕⊝ | ||
| *The basis for the assumed risk is the median control group risk across studies. The corresponding risk (and its 95% confidence interval) is based on the assumed risk in the comparison group and the relative effect of the intervention (and its 95% CI). | ||||||
| GRADE Working Group grades of evidence | ||||||
| 1 Small sample size | ||||||
| IUI compared to TI or expectant management both in stimulated cycle for unexplained subfertility | ||||||
| Patient or population: people with unexplained subfertility | ||||||
| Outcomes | Illustrative comparative risks* (95% CI) | Relative effect | No of Participants | Quality of the evidence | Comments | |
| Assumed risk | Corresponding risk | |||||
| TI both in stimulated cycle | IUI | |||||
| Live birth rate per couple (all cycles) | 255 per 1000 | 352 per 1000 | OR 1.59 | 208 | ⊕⊕⊕⊝ | |
| Multiple pregnancy rate per couple | 43 per 1000 | 62 per 1000 | OR 1.46 | 316 | ⊕⊕⊝⊝ | |
| Pregnancy rate per couple (all cycles) | 234 per 1000 | 339 per 1000 | OR 1.69 | 517 | ⊕⊕⊝⊝ | |
| Ovarian Hyperstimulation Syndrome rate per woman | not estimable | OR 2.75 | 68 | ⊕⊕⊝⊝ | ||
| Miscarriage rate per couple | 57 per 1000 | 91 per 1000 | OR 1.66 | 208 | ⊕⊕⊕⊝ | |
| Ectopic pregnancy rate per couple | not estimable | OR 3.06 | 100 | ⊕⊕⊕⊝ | ||
| *The basis for the assumed risk is the median control group risk across studies. The corresponding risk (and its 95% confidence interval) is based on the assumed risk in the comparison group and the relative effect of the intervention (and its 95% CI). | ||||||
| GRADE Working Group grades of evidence | ||||||
| 1 Small sample size | ||||||
| IUI in natural cycle compared to IUI in stimulated cycle for unexplained subfertility | ||||||
| Patient or population: people with unexplained subfertility | ||||||
| Outcomes | Illustrative comparative risks* (95% CI) | Relative effect | No of Participants | Quality of the evidence | Comments | |
| Assumed risk | Corresponding risk | |||||
| IUI in stimulated cycle | IUI in natural cycle | |||||
| Live birth rate per couple (all cycles) | 248 per 1000 | 137 per 1000 | OR 0.48 | 396 | ⊕⊕⊕⊝ | |
| Multiple pregnancy rate per couple | 33 per 1000 | 11 per 1000 | OR 0.33 | 65 | ⊕⊕⊝⊝ | |
| Pregnancy rate per couple (all cycles) | 300 per 1000 | 64 per 1000 | OR 0.16 | 26 | ⊕⊕⊕⊝ | |
| Ovarian Hyperstimulation Syndrome rate per woman5 ‐ not measured | Not estimable3 | ‐ | ||||
| Miscarriage rate per couple | 100 per 1000 | 21 per 1000 | OR 0.19 | 26 | ⊕⊕⊝⊝ | |
| Ectopic pregnancy rate per couple | 23 per 1000 | 4 per 1000 | OR 0.15 | 250 | ⊕⊕⊕⊝ | |
| *The basis for the assumed risk is the median control group risk across studies. The corresponding risk (and its 95% confidence interval) is based on the assumed risk in the comparison group and the relative effect of the intervention (and its 95% CI). | ||||||
| GRADE Working Group grades of evidence | ||||||
| 1 Small sample size | ||||||
| IUI in stimulated cycle compared to TI or expectant management in natural cycle for unexplained subfertility | ||||||
| Patient or population: people with unexplained subfertility | ||||||
| Outcomes | Illustrative comparative risks* (95% CI) | Relative effect | No of Participants | Quality of the evidence | Comments | |
| Assumed risk | Corresponding risk | |||||
| TI or expectant management in natural cycle | IUI in stimulated cycle | |||||
| Live birth rate per couple (all cycles) | 238 per 1000 | 204 per 1000 | OR 0.82 | 253 | ⊕⊕⊕⊝ | |
| Multiple pregnancy rate per couple | 6 per 1000 | 13 per 1000 | OR 2.00 | 304 | ⊕⊕⊕⊝ | |
| Pregnancy rate per couple (all cycles) | 247 per 1000 | 247 per 1000 | OR 1.00 | 304 | ⊕⊕⊕⊝ | |
| Ovarian Hyperstimulation rate per woman ‐ not measured | Not estimable | ‐ | ||||
| Miscarriage rate per couple | 48 per 1000 | 103 per 1000 | OR 2.28 | 253 | ⊕⊕⊕⊝ | |
| Ectopic pregnancy rate per couple ‐ not reported | See comment | See comment | Not estimable | ‐ | See comment | |
| *The basis for the assumed risk is the median control group risk across studies. The corresponding risk (and its 95% confidence interval) is based on the assumed risk in the comparison group and the relative effect of the intervention (and its 95% CI). | ||||||
| GRADE Working Group grades of evidence | ||||||
| 1 Small sample size | ||||||
| IUI in natural cycle compared to TI or expectant management in stimulated cycle for unexplained subfertility | ||||||
| Patient or population: people with unexplained subfertility | ||||||
| Outcomes | Illustrative comparative risks* (95% CI) | Relative effect | No of Participants | Quality of the evidence | Comments | |
| Assumed risk | Corresponding risk | |||||
| TI in stimulated cycle | IUI in natural cycle | |||||
| Live birth rate per couple (all cycles) | 131 per 1000 | 227 per 1000 | OR 1.95 | 342 | ⊕⊕⊕⊝ | |
| Multiple pregnancy rate per couple | 6 per 1000 | 6 per 1000 | OR 1.05 | 342 | ⊕⊕⊕⊝ | |
| Pregnancy rate per couple (all cycles) | 143 per 1000 | 228 per 1000 | OR 1.77 | 342 | ⊕⊕⊕⊝ | |
| Ovarian Hyperstimulation Syndrome rate per woman ‐ not reported | Not estimable | ‐ | ||||
| Miscarriage rate per couple | 46 per 1000 | 42 per 1000 | OR 0.91 | 342 | ⊕⊕⊕⊝ | |
| Ectopic pregnancy rate per couple | Not estimable | OR 5.30 | 342 | ⊕⊕⊕⊝ | ||
| *The basis for the assumed risk is the median control group risk across studies. The corresponding risk (and its 95% confidence interval) is based on the assumed risk in the comparison group and the relative effect of the intervention (and its 95% CI). | ||||||
| GRADE Working Group grades of evidence | ||||||
| 1 Small sample size | ||||||
| Outcome or subgroup title | No. of studies | No. of participants | Statistical method | Effect size |
| 1 Live birth rate per couple (all cycles) Show forest plot | 1 | 334 | Odds Ratio (M‐H, Fixed, 95% CI) | 1.60 [0.92, 2.78] |
| 2 Multiple pregnancy rate per couple Show forest plot | 1 | 334 | Odds Ratio (M‐H, Fixed, 95% CI) | 0.50 [0.04, 5.53] |
| 3 Pregnancy rate per couple (all cycles) Show forest plot | 1 | 334 | Odds Ratio (M‐H, Fixed, 95% CI) | 1.53 [0.88, 2.64] |
| 4 Miscarriage rate per couple Show forest plot | 1 | 334 | Odds Ratio (M‐H, Fixed, 95% CI) | 0.77 [0.28, 2.11] |
| 5 Ectopic pregnancy rate per couple Show forest plot | 1 | 334 | Odds Ratio (M‐H, Fixed, 95% CI) | 5.06 [0.24, 106.21] |
| Outcome or subgroup title | No. of studies | No. of participants | Statistical method | Effect size |
| 1 Live birth rate per couple (all cycles) Show forest plot | 2 | 208 | Odds Ratio (M‐H, Fixed, 95% CI) | 1.59 [0.88, 2.88] |
| 1.1 Gonadotropins | 2 | 208 | Odds Ratio (M‐H, Fixed, 95% CI) | 1.59 [0.88, 2.88] |
| 2 Multiple pregnancy rate per couple Show forest plot | 4 | 316 | Odds Ratio (M‐H, Fixed, 95% CI) | 1.46 [0.55, 3.87] |
| 2.1 Clomiphene Citrate | 1 | 40 | Odds Ratio (M‐H, Fixed, 95% CI) | 0.43 [0.02, 11.18] |
| 2.2 Gonadotropins | 2 | 208 | Odds Ratio (M‐H, Fixed, 95% CI) | 1.61 [0.44, 5.89] |
| 2.3 Clomiphene Citrate and Gonadotropins | 1 | 68 | Odds Ratio (M‐H, Fixed, 95% CI) | 1.88 [0.32, 11.00] |
| 3 Pregnancy rate per couple (all cycles) Show forest plot | 6 | 517 | Odds Ratio (M‐H, Fixed, 95% CI) | 1.69 [1.14, 2.53] |
| 3.1 Clomiphene Citrate | 1 | 40 | Odds Ratio (M‐H, Fixed, 95% CI) | 0.30 [0.03, 2.93] |
| 3.2 Gonadotropins | 4 | 319 | Odds Ratio (M‐H, Fixed, 95% CI) | 1.68 [1.03, 2.75] |
| 3.3 Clomiphene Citrate and Gonadotropins | 1 | 68 | Odds Ratio (M‐H, Fixed, 95% CI) | 2.62 [0.98, 6.98] |
| 3.4 Clomiphene citrate OR Gonadotropins | 1 | 90 | Odds Ratio (M‐H, Fixed, 95% CI) | 1.72 [0.50, 5.89] |
| 4 Moderate or severe ovarian hyperstimulation syndrome rate per woman Show forest plot | 2 | Odds Ratio (M‐H, Fixed, 95% CI) | Subtotals only | |
| 4.1 Gonadotropins | 1 | 108 | Odds Ratio (M‐H, Fixed, 95% CI) | 0.0 [0.0, 0.0] |
| 4.2 Clomiphene Citrate and Gonadotropins | 1 | 68 | Odds Ratio (M‐H, Fixed, 95% CI) | 2.75 [0.11, 69.83] |
| 5 Miscarriage rate per couple Show forest plot | 2 | 208 | Odds Ratio (M‐H, Fixed, 95% CI) | 1.66 [0.56, 4.88] |
| 5.1 Gonadotropins | 2 | 208 | Odds Ratio (M‐H, Fixed, 95% CI) | 1.66 [0.56, 4.88] |
| 6 Ectopic pregnancy rate per couple Show forest plot | 1 | 100 | Odds Ratio (M‐H, Fixed, 95% CI) | 3.06 [0.12, 76.95] |
| 6.1 Gonadotropins | 1 | 100 | Odds Ratio (M‐H, Fixed, 95% CI) | 3.06 [0.12, 76.95] |
| Outcome or subgroup title | No. of studies | No. of participants | Statistical method | Effect size |
| 1 Live birth rate per couple (all cycles) Show forest plot | 4 | 396 | Odds Ratio (M‐H, Fixed, 95% CI) | 0.48 [0.29, 0.82] |
| 1.1 Clomiphene Citrate | 1 | 26 | Odds Ratio (M‐H, Fixed, 95% CI) | 0.27 [0.02, 3.41] |
| 1.2 Gonadotropins | 3 | 370 | Odds Ratio (M‐H, Fixed, 95% CI) | 0.50 [0.29, 0.85] |
| 2 Multiple pregnancy rate per couple Show forest plot | 2 | 65 | Odds Ratio (M‐H, Fixed, 95% CI) | 0.33 [0.01, 8.70] |
| 2.1 Clomiphene Citrate | 1 | 26 | Odds Ratio (M‐H, Fixed, 95% CI) | 0.0 [0.0, 0.0] |
| 2.2 Gonadotropins | 1 | 39 | Odds Ratio (M‐H, Fixed, 95% CI) | 0.33 [0.01, 8.70] |
| 3 Pregnancy rate per couple (all cycles) Show forest plot | 1 | 26 | Odds Ratio (M‐H, Fixed, 95% CI) | 0.16 [0.01, 1.77] |
| 3.1 Clomiphene Citrate | 1 | 26 | Odds Ratio (M‐H, Fixed, 95% CI) | 0.16 [0.01, 1.77] |
| 4 Moderate or severe ovarian hyperstimulation syndrome per woman Show forest plot | 3 | 185 | Odds Ratio (M‐H, Fixed, 95% CI) | 0.0 [0.0, 0.0] |
| 4.1 Clomiphene Citrate | 1 | 26 | Odds Ratio (M‐H, Fixed, 95% CI) | 0.0 [0.0, 0.0] |
| 4.2 Gonadotropins | 2 | 159 | Odds Ratio (M‐H, Fixed, 95% CI) | 0.0 [0.0, 0.0] |
| 5 Miscarriage rate per couple Show forest plot | 1 | 26 | Odds Ratio (M‐H, Fixed, 95% CI) | 0.19 [0.01, 5.20] |
| 5.1 Clomiphene Citrate | 1 | 26 | Odds Ratio (M‐H, Fixed, 95% CI) | 0.19 [0.01, 5.20] |
| 5.2 Gonadotropins | 0 | 0 | Odds Ratio (M‐H, Fixed, 95% CI) | 0.0 [0.0, 0.0] |
| 6 Ectopic pregnancy rate per couple Show forest plot | 2 | 250 | Odds Ratio (M‐H, Fixed, 95% CI) | 0.15 [0.01, 3.02] |
| 6.1 Gonadotropins | 2 | 250 | Odds Ratio (M‐H, Fixed, 95% CI) | 0.15 [0.01, 3.02] |
| Outcome or subgroup title | No. of studies | No. of participants | Statistical method | Effect size |
| 1 Live birth rate per couple (all cycles) Show forest plot | 1 | 253 | Odds Ratio (M‐H, Fixed, 95% CI) | 0.82 [0.45, 1.49] |
| 2 Multiple pregnancy rate per couple Show forest plot | 2 | 304 | Odds Ratio (M‐H, Fixed, 95% CI) | 2.0 [0.18, 22.34] |
| 2.1 Clomiphene Citrate | 1 | 51 | Odds Ratio (M‐H, Fixed, 95% CI) | 0.0 [0.0, 0.0] |
| 2.2 Clomiphene Citrate or Gonadotropins | 1 | 253 | Odds Ratio (M‐H, Fixed, 95% CI) | 2.0 [0.18, 22.34] |
| 3 Pregnancy rate per couple (all cycles) Show forest plot | 2 | 304 | Odds Ratio (M‐H, Fixed, 95% CI) | 1.00 [0.59, 1.67] |
| 3.1 Clomiphene Citrate | 1 | 51 | Odds Ratio (M‐H, Fixed, 95% CI) | 3.2 [0.82, 12.50] |
| 3.2 Clomiphene Citrate or Gonadotropins | 1 | 253 | Odds Ratio (M‐H, Fixed, 95% CI) | 0.80 [0.45, 1.42] |
| 4 Moderate or severe ovarian hyperstimulation syndrome per woman Show forest plot | 1 | Odds Ratio (M‐H, Fixed, 95% CI) | Totals not selected | |
| 4.1 Clomiphene Citrate | 1 | Odds Ratio (M‐H, Fixed, 95% CI) | 0.0 [0.0, 0.0] | |
| 4.2 Clomiphene Citrate or Gonadotropins | 0 | Odds Ratio (M‐H, Fixed, 95% CI) | 0.0 [0.0, 0.0] | |
| 5 Miscarriage rate per couple Show forest plot | 1 | 253 | Odds Ratio (M‐H, Fixed, 95% CI) | 2.28 [0.84, 6.20] |
| Outcome or subgroup title | No. of studies | No. of participants | Statistical method | Effect size |
| 1 Live birth rate per couple (all cycles) Show forest plot | 1 | 342 | Odds Ratio (M‐H, Fixed, 95% CI) | 1.95 [1.10, 3.44] |
| 2 Multiple pregnancy rate per couple Show forest plot | 1 | 342 | Odds Ratio (M‐H, Fixed, 95% CI) | 1.05 [0.07, 16.90] |
| 3 Pregnancy rate per couple (all cycles) Show forest plot | 1 | 342 | Odds Ratio (M‐H, Fixed, 95% CI) | 1.77 [1.01, 3.08] |
| 4 Miscarriage rate per couple Show forest plot | 1 | 342 | Odds Ratio (M‐H, Fixed, 95% CI) | 0.91 [0.32, 2.58] |
| 5 Ectopic pregnancy rate per couple Show forest plot | 1 | 342 | Odds Ratio (M‐H, Random, 95% CI) | 5.30 [0.25, 111.26] |