Intra‐uterine insemination for unexplained subfertility
Appendices
Appendix 1. MDSG search strategy
01.01.15
Keywords CONTAINS "unexplained and endometriosis related infertility" or "unexplained infertility" or "unexplained subfertility" or Title CONTAINS "unexplained and endometriosis related infertility" or "unexplained infertility" or "unexplained subfertility"
AND
Keywords CONTAINS "Intrauterine Insemination" or "intrautero tuboperitoneal insemination" or "IUI" or "artifical insemination by donor" or "artifical insemination by partner" or "artificial insemination" or Title CONTAINS "Intrauterine Insemination" or "intrautero tuboperitoneal insemination" or "IUI" or "artifical insemination by donor" or "artifical insemination by partner" or "artificial insemination"
Appendix 2. CENTRAL search strategy
Database: EBM Reviews ‐ Cochrane Central Register of Controlled Trials <November 2015>
1 exp insemination, artificial/ or exp insemination, artificial, heterologous/ or exp insemination, artificial, homologous/ (296)
2 insemination.tw. (825)
3 iui.tw. (409)
4 or/1‐3 (919)
5 subfertil$.tw. (219)
6 infertil$.tw. (2489)
7 superovulation.tw. (142)
8 (unexplained adj2 sterility).tw. (3)
9 ovulation induction.tw. (557)
10 clomiphene.tw. (848)
11 exp Infertility/ (1670)
12 or/5‐11 (3906)
13 4 and 12 (557)
Appendix 3. MEDLINE search strategy
Database: Ovid MEDLINE(R) <1950 to December 2015>
1 exp insemination, artificial/ or exp insemination, artificial, heterologous/ or exp insemination, artificial, homologous/ (10482)
2 insemination.tw. (13177)
3 iui.tw. (1347)
4 or/1‐3 (17570)
5 subfertil$.tw. (4007)
6 infertil$.tw. (47182)
7 superovulation.tw. (1773)
8 (unexplained adj2 sterility).tw. (48)
9 ovulation induction.tw. (3103)
10 clomiphene.tw. (4578)
11 exp Infertility/ (56499)
12 randomized controlled trial.pt. (421692)
13 controlled clinical trial.pt. (92568)
14 randomized.ab. (343500)
15 placebo.tw. (176322)
16 clinical trials as topic.sh. (180817)
17 randomly.ab. (247477)
18 trial.ti. (151571)
19 cross over.ab. (18272)
20 or/12‐19 (1027804)
21 (animals not (humans and animals)).sh. (4077418)
22 20 not 21 (947417)
23 or/5‐11 (83460)
24 4 and 23 (4629)
25 24 and 22 (536)
Appendix 4. EMBASE search strategy
Database: Ovid EMBASE <1980 to December 2015>
1 exp artificial insemination/ (13129)
2 insemination.tw. (14203)
3 iui.tw. (2331)
4 or/1‐3 (20211)
5 exp ovulation induction/ (11436)
6 subfertil$.tw. (5054)
7 infertil$.tw. (62456)
8 superovulation.tw. (1943)
9 unexplained.tw. (36152)
10 ovulation induction.tw. (4192)
11 clomiphene.tw. (5175)
12 exp Infertility/ (98546)
13 or/5‐12 (156978)
14 4 and 13 (6953)
15 Clinical Trial/ (854455)
16 Randomized Controlled Trial/ (391145)
17 exp randomization/ (69171)
18 Single Blind Procedure/ (21435)
19 Double Blind Procedure/ (125380)
20 Crossover Procedure/ (45488)
21 Placebo/ (267953)
22 Randomi?ed controlled trial$.tw. (128448)
23 Rct.tw. (19108)
24 random allocation.tw. (1475)
25 randomly allocated.tw. (23799)
26 allocated randomly.tw. (2078)
27 (allocated adj2 random).tw. (745)
28 Single blind$.tw. (16729)
29 Double blind$.tw. (157482)
30 ((treble or triple) adj blind$).tw. (511)
31 placebo$.tw. (225354)
32 prospective study/ (317836)
33 or/15‐32 (1531254)
34 case study/ (35526)
35 case report.tw. (297077)
36 abstract report/ or letter/ (947549)
37 or/34‐36 (1273469)
38 33 not 37 (1490953)
39 38 and 14 (1138)
Appendix 5. PsycINFO search strategy
Database: PsycINFO <1806 to December Week 3 2015>
1 exp reproductive technology/ (1530)
2 insemination.tw. (629)
3 iui.tw. (27)
4 or/1‐3 (1912)
5 subfertil$.tw. (71)
6 infertil$.tw. (2818)
7 superovulation.tw. (3)
8 (unexplained adj2 sterility).tw. (1)
9 ovulation induction.tw. (19)
10 clomiphene.tw. (46)
11 or/5‐10 (2901)
12 4 and 11 (571)
13 random*.ti,ab,hw,id. (149863)
14 trial*.ti,ab,hw,id. (139796)
15 controlled stud*.ti,ab,hw,id. (10062)
16 placebo*.ti,ab,hw,id. (34029)
17 ((singl* or doubl* or trebl* or tripl*) and (blind* or mask*)).ti,ab,hw,id. (24142)
18 (cross over or crossover or factorial* or latin square).ti,ab,hw,id. (23991)
19 (assign* or allocat* or volunteer*).ti,ab,hw,id. (131093)
20 treatment effectiveness evaluation/ (19468)
21 mental health program evaluation/ (1947)
22 exp experimental design/ (50867)
23 "2000".md. (31997)
24 or/13‐23 (421988)
25 12 and 24 (21)
Appendix 6. Prognostic factors in included studies
| Study ID | Age distribution | Subfertility years | Prim/Sec infertility | Previous treatment | Stimulation Method | Single insemination |
| 1. | IUI versus Timed intercourse both in natural cycle | 1 study | ||||
| TI+NC: 32 (±3.4) IUI+NC: 32 (±3.7) | TI+NC: 30 (25 ‐ 38) | Mixed 117/386 (30%) | Not stated | No stimulation | Single | |
| 2. | IUI versus Timed intercourse both in stimulated cycle | 7 studies | ||||
| IUI+OH: 29.52 (±3.65) | IUI+OH: 4.91(±2.72) | Mixed | No | CC 50‐150 mg | Single | |
| IUI+OH: 34.6 (±4.9) | IUI+OH: 4.2 (±1.6) | Mixed | Not stated | High dose: CC100mg and hMG 75‐225IU | Double | |
| IUI+OH: 31.8 (±3.1) | IUI+OH: 4.7 (±2.0) | Not clear | Not stated | hMG 150IU starting dose and GnRHa | IUI: Single | |
| < 38 yrs | > 3 yrs | Not clear | Probably | Not stated | Not stated | |
| Not stated | > 3 yrs | Not clear | Not stated | hMG (10 amp per cycle) | Not stated | |
| 32 (range 21‐38) | 5 (range 2‐14) | Mixed | No | hMG (low dose step up) 75 IU starting dose OR CC 100mg | IUI: Single | |
| 33.1 (±5.2) | 4.3 (±1.4) | Not clear | Yes, all patients | High dose: FSH 225IU | Single | |
| 3. | IUI in natural cycle versus IUI in stimulated cycle | |||||
| 33 (range 24‐41) | 3.5 (range 1‐15) | Not clear | No | CC 50 mg | IUI+NC: Double | |
| IUI+NC: 31.6 (±3.7) | IUI+NC: 3.9 (±1.7) | Mixed | Not stated | hMG 75IU starting dose | Single | |
| IUI+NC: 32 (±4) | IUI+NC: 3.8 (±2.6) | Mixed | No | FSH 150IU | Single | |
| IUI+NC: 30.5 (±3.1) IUI+OH: 30.1 (±2.9) | IUI+NC: 5.7 (±2.4) | Mixed | No | hMG (low dose) 75IU + GnRHa | IUI+OH: Single | |
| 4. | IUI with OH versus TI in natural cycle | 1 study | ||||
| 33 (±4.0) | 3.5 (±1.7) | Mixed | Not stated | CC 50 mg | Single | |
| IUI+OH: 33 (±3.4) | IUI+OH: 2.0 (±0.5) | Mixed | Not stated | FSH 37‐150 IU or CC 50‐150 mg | Not stated | |
| 5. | IUI in natural cycle versus TI with OH | |||||
| TI+OH: 32 (±3.5) IUI+NC: 32 (±3.7) | TI+OH: 30 (24 ‐ 38) | Mixed | Not stated | CC 25‐50 mg | Single | |
| * Mean age in years (± SD) or range | * Mean duration in years (± SD) or range | * Daily dose |
Appendix 7. Sensitivity analyses: intra‐uterine insemination (IUI) versus timed intercourse (TI) both in a stimulated cycle
| Analysis | Number of studies | OR | 95% CI | Heterogeneity (P) | I2 (%) | |
| LIVE BIRTH RATE | Main analysis | 2 | 1.59 | 0.88 ‐ 2.88 | 0.06 | 72 |
| Not by ITT | 2 | 1.46 | 0.80 ‐ 2.66 | 0.06 | 71 | |
| Random effect | 2 | 1.65 | 0.52 ‐ 5.23 | 0.06 | 72 | |
| Agarwal 2004 included | 3 | 0.81 | 0.51 ‐ 1.28 | 0.0002 | 88 | |
| PREGNANCY RATE | Main analysis | 6 | 1.69 | 1.14 ‐ 2.53 | 0.37 | 8 |
| Not by ITT | 6 | 1.65 | 1.10 ‐ 2.47 | 0.36 | 10 | |
| Random effect | 6 | 1.72 | 1.11‐ 2.65 | 0.37 | 8 | |
| Agarwal 2004 included | 7 | 1.25 | 0.88 ‐ 1.78 | 0.02 | 60 | |
| Adequate methodology | 2 | 1.70 | 0.96 ‐ 3.02 | 0.06 | 71.7 | |
| Previous treatment excluded | 5 | 2.03 | 1.27 ‐ 3.26 | 0.50 | 0 | |
| Calculated data excluded | 5 | 1.71 | 1.11 ‐ 2.63 | 0.26 | 23 | |
| Trials including pt with endometriosis excluded | 5 | 1.83 | 1.20 ‐ 2.79 | 0.38 | 4 |
Appendix 8. Sensitivity analyses: IUI in a natural cycle versus IUI in a stimulated cycle
| Analysis | Number of studies | OR | 95% CI | Heterogeneity (p) | I2 (%) | |
| LIVE BIRTH RATE | Main analysis | 4 | 0.48 | 0.29 ‐ 0.82 | 0.55 | 0 |
| Not by ITT | 4 | 0.47 | 0.28 ‐ 0.81 | 0.79 | 0 | |
| Random effect | 4 | 0.48 | 0.28 ‐ 0.85 | 0.55 | 0 | |
| Cross over trials excluded | 3 | 0.50 | 0.29 ‐ 0.85 | 0.39 | 0 | |
| Adequate Methodology | 3 | 0.59 | 0.29 ‐ 1.21 | 0.47 | 0 | |
| Endometriosis (Arici 1994, Guzick 1999 excl) | 2 | 0.64 | 0.30 ‐ 1.34 | 0.29 | 9 |

Methodological quality graph: review authors' judgements about each methodological quality item presented as percentages across all included studies.
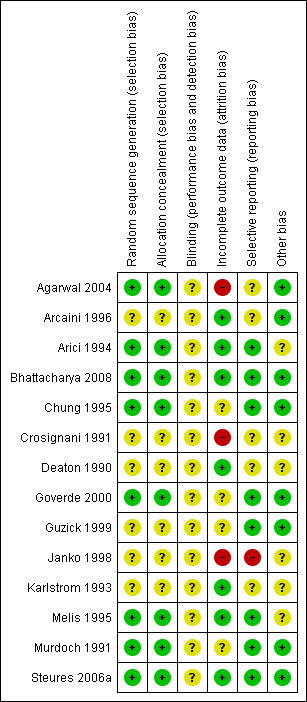
Methodological quality summary: review authors' judgements about each methodological quality item for each included study.

Study flow diagram.

Funnel plot of comparison: 2 IUI versus TI both in stimulated cycle, outcome: 2.3 Pregnancy rate per couple (all cycles).
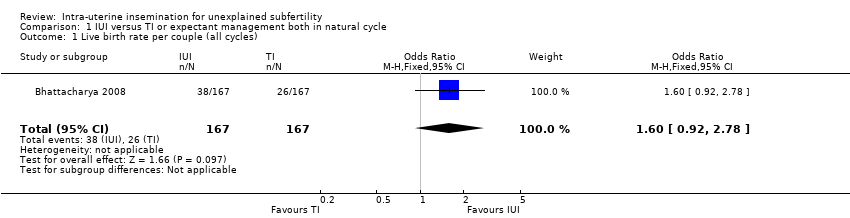
Comparison 1 IUI versus TI or expectant management both in natural cycle, Outcome 1 Live birth rate per couple (all cycles).

Comparison 1 IUI versus TI or expectant management both in natural cycle, Outcome 2 Multiple pregnancy rate per couple.

Comparison 1 IUI versus TI or expectant management both in natural cycle, Outcome 3 Pregnancy rate per couple (all cycles).
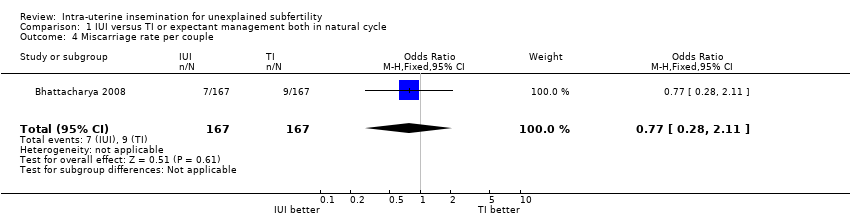
Comparison 1 IUI versus TI or expectant management both in natural cycle, Outcome 4 Miscarriage rate per couple.

Comparison 1 IUI versus TI or expectant management both in natural cycle, Outcome 5 Ectopic pregnancy rate per couple.

Comparison 2 IUI versus TI or expectant management both in stimulated cycle, Outcome 1 Live birth rate per couple (all cycles).

Comparison 2 IUI versus TI or expectant management both in stimulated cycle, Outcome 2 Multiple pregnancy rate per couple.
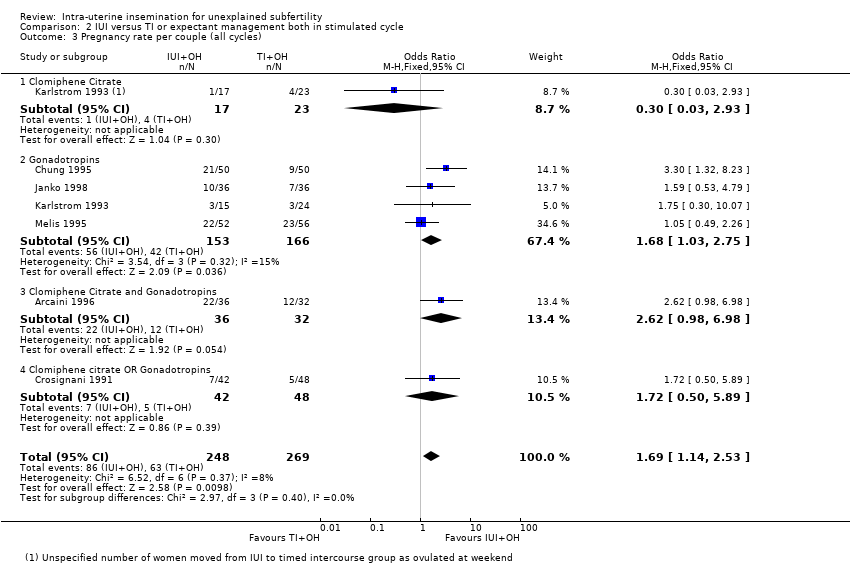
Comparison 2 IUI versus TI or expectant management both in stimulated cycle, Outcome 3 Pregnancy rate per couple (all cycles).
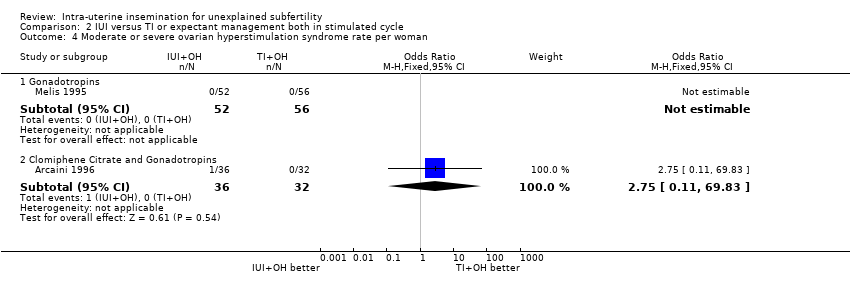
Comparison 2 IUI versus TI or expectant management both in stimulated cycle, Outcome 4 Moderate or severe ovarian hyperstimulation syndrome rate per woman.

Comparison 2 IUI versus TI or expectant management both in stimulated cycle, Outcome 5 Miscarriage rate per couple.

Comparison 2 IUI versus TI or expectant management both in stimulated cycle, Outcome 6 Ectopic pregnancy rate per couple.

Comparison 3 IUI in natural cycle versus IUI in stimulated cycle, Outcome 1 Live birth rate per couple (all cycles).

Comparison 3 IUI in natural cycle versus IUI in stimulated cycle, Outcome 2 Multiple pregnancy rate per couple.

Comparison 3 IUI in natural cycle versus IUI in stimulated cycle, Outcome 3 Pregnancy rate per couple (all cycles).
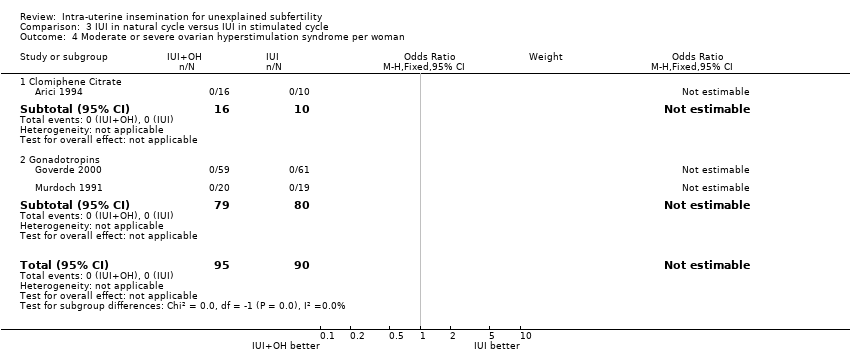
Comparison 3 IUI in natural cycle versus IUI in stimulated cycle, Outcome 4 Moderate or severe ovarian hyperstimulation syndrome per woman.
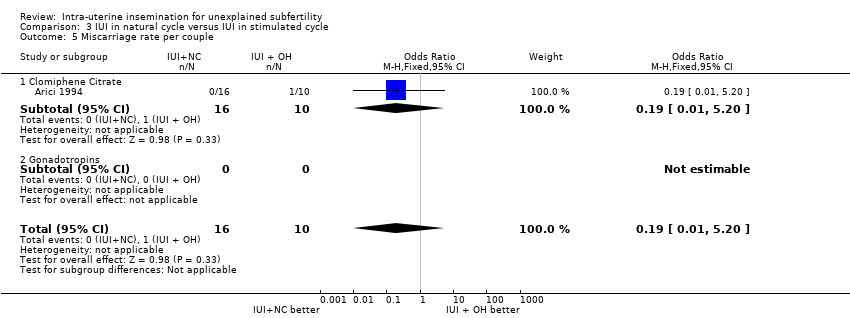
Comparison 3 IUI in natural cycle versus IUI in stimulated cycle, Outcome 5 Miscarriage rate per couple.

Comparison 3 IUI in natural cycle versus IUI in stimulated cycle, Outcome 6 Ectopic pregnancy rate per couple.

Comparison 4 IUI in stimulated cycle versus TI or expectant management in natural cycle, Outcome 1 Live birth rate per couple (all cycles).

Comparison 4 IUI in stimulated cycle versus TI or expectant management in natural cycle, Outcome 2 Multiple pregnancy rate per couple.
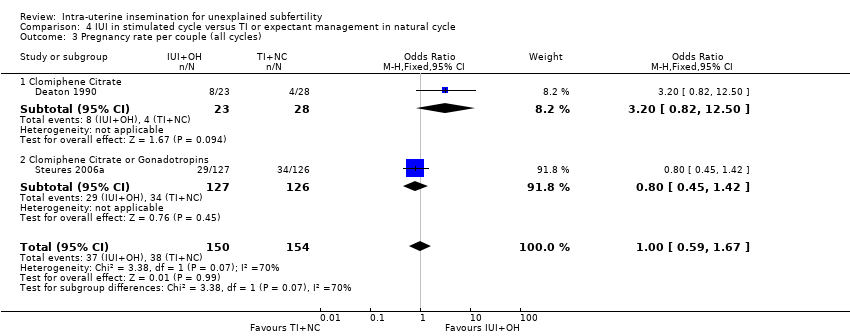
Comparison 4 IUI in stimulated cycle versus TI or expectant management in natural cycle, Outcome 3 Pregnancy rate per couple (all cycles).
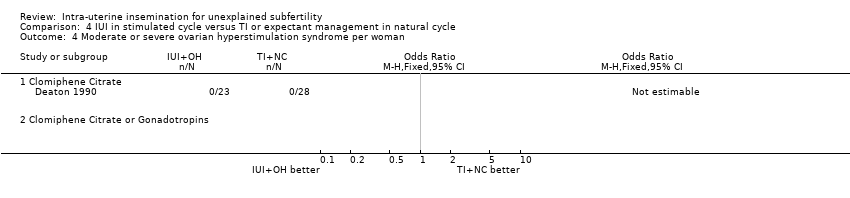
Comparison 4 IUI in stimulated cycle versus TI or expectant management in natural cycle, Outcome 4 Moderate or severe ovarian hyperstimulation syndrome per woman.

Comparison 4 IUI in stimulated cycle versus TI or expectant management in natural cycle, Outcome 5 Miscarriage rate per couple.

Comparison 5 IUI in natural cycle versus TI or expectant management in stimulated cycle, Outcome 1 Live birth rate per couple (all cycles).
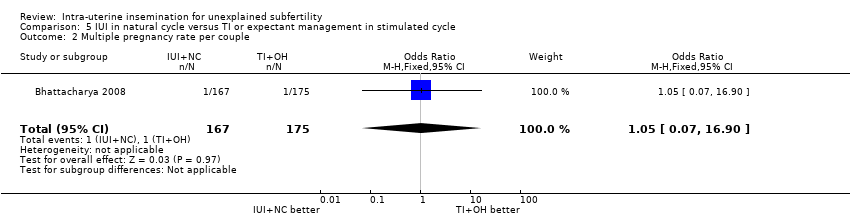
Comparison 5 IUI in natural cycle versus TI or expectant management in stimulated cycle, Outcome 2 Multiple pregnancy rate per couple.
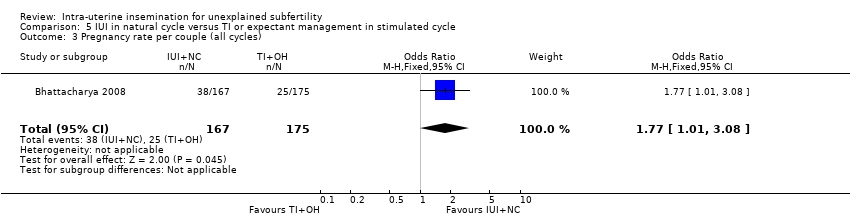
Comparison 5 IUI in natural cycle versus TI or expectant management in stimulated cycle, Outcome 3 Pregnancy rate per couple (all cycles).

Comparison 5 IUI in natural cycle versus TI or expectant management in stimulated cycle, Outcome 4 Miscarriage rate per couple.

Comparison 5 IUI in natural cycle versus TI or expectant management in stimulated cycle, Outcome 5 Ectopic pregnancy rate per couple.
| IUI compared to TI or expectant management both in natural cycle for unexplained subfertility | ||||||
| Patient or population: people with unexplained subfertility | ||||||
| Outcomes | Illustrative comparative risks* (95% CI) | Relative effect | No of Participants | Quality of the evidence | Comments | |
| Assumed risk | Corresponding risk | |||||
| TI or expectant management both in natural cycle | IUI | |||||
| Live birth rate per couple (all cycles) | 156 per 1000 | 228 per 1000 | OR 1.60 | 334 | ⊕⊕⊕⊝ | |
| Multiple pregnancy rate per couple | 12 per 1000 | 6 per 1000 | OR 0.50 | 334 | ⊕⊕⊕⊝ | |
| Pregnancy rate per couple (all cycles) | 162 per 1000 | 228 per 1000 | OR 1.53 | 334 | ⊕⊕⊕⊝ | |
| Ovarian Hyperstimulation Syndrome rate per woman ‐ not reported | Not estimable | ‐ | ||||
| Miscarriage rate per couple | 54 per 1000 | 42 per 1000 | OR 0.77 | 334 | ⊕⊕⊕⊝ | |
| Ectopic pregnancy rate per couple | Not estimable | OR 5.06 | 334 | ⊕⊕⊕⊝ | ||
| *The basis for the assumed risk is the median control group risk across studies. The corresponding risk (and its 95% confidence interval) is based on the assumed risk in the comparison group and the relative effect of the intervention (and its 95% CI). | ||||||
| GRADE Working Group grades of evidence | ||||||
| 1 Small sample size | ||||||
| IUI compared to TI or expectant management both in stimulated cycle for unexplained subfertility | ||||||
| Patient or population: people with unexplained subfertility | ||||||
| Outcomes | Illustrative comparative risks* (95% CI) | Relative effect | No of Participants | Quality of the evidence | Comments | |
| Assumed risk | Corresponding risk | |||||
| TI both in stimulated cycle | IUI | |||||
| Live birth rate per couple (all cycles) | 255 per 1000 | 352 per 1000 | OR 1.59 | 208 | ⊕⊕⊕⊝ | |
| Multiple pregnancy rate per couple | 43 per 1000 | 62 per 1000 | OR 1.46 | 316 | ⊕⊕⊝⊝ | |
| Pregnancy rate per couple (all cycles) | 234 per 1000 | 339 per 1000 | OR 1.69 | 517 | ⊕⊕⊝⊝ | |
| Ovarian Hyperstimulation Syndrome rate per woman | not estimable | OR 2.75 | 68 | ⊕⊕⊝⊝ | ||
| Miscarriage rate per couple | 57 per 1000 | 91 per 1000 | OR 1.66 | 208 | ⊕⊕⊕⊝ | |
| Ectopic pregnancy rate per couple | not estimable | OR 3.06 | 100 | ⊕⊕⊕⊝ | ||
| *The basis for the assumed risk is the median control group risk across studies. The corresponding risk (and its 95% confidence interval) is based on the assumed risk in the comparison group and the relative effect of the intervention (and its 95% CI). | ||||||
| GRADE Working Group grades of evidence | ||||||
| 1 Small sample size | ||||||
| IUI in natural cycle compared to IUI in stimulated cycle for unexplained subfertility | ||||||
| Patient or population: people with unexplained subfertility | ||||||
| Outcomes | Illustrative comparative risks* (95% CI) | Relative effect | No of Participants | Quality of the evidence | Comments | |
| Assumed risk | Corresponding risk | |||||
| IUI in stimulated cycle | IUI in natural cycle | |||||
| Live birth rate per couple (all cycles) | 248 per 1000 | 137 per 1000 | OR 0.48 | 396 | ⊕⊕⊕⊝ | |
| Multiple pregnancy rate per couple | 33 per 1000 | 11 per 1000 | OR 0.33 | 65 | ⊕⊕⊝⊝ | |
| Pregnancy rate per couple (all cycles) | 300 per 1000 | 64 per 1000 | OR 0.16 | 26 | ⊕⊕⊕⊝ | |
| Ovarian Hyperstimulation Syndrome rate per woman5 ‐ not measured | Not estimable3 | ‐ | ||||
| Miscarriage rate per couple | 100 per 1000 | 21 per 1000 | OR 0.19 | 26 | ⊕⊕⊝⊝ | |
| Ectopic pregnancy rate per couple | 23 per 1000 | 4 per 1000 | OR 0.15 | 250 | ⊕⊕⊕⊝ | |
| *The basis for the assumed risk is the median control group risk across studies. The corresponding risk (and its 95% confidence interval) is based on the assumed risk in the comparison group and the relative effect of the intervention (and its 95% CI). | ||||||
| GRADE Working Group grades of evidence | ||||||
| 1 Small sample size | ||||||
| IUI in stimulated cycle compared to TI or expectant management in natural cycle for unexplained subfertility | ||||||
| Patient or population: people with unexplained subfertility | ||||||
| Outcomes | Illustrative comparative risks* (95% CI) | Relative effect | No of Participants | Quality of the evidence | Comments | |
| Assumed risk | Corresponding risk | |||||
| TI or expectant management in natural cycle | IUI in stimulated cycle | |||||
| Live birth rate per couple (all cycles) | 238 per 1000 | 204 per 1000 | OR 0.82 | 253 | ⊕⊕⊕⊝ | |
| Multiple pregnancy rate per couple | 6 per 1000 | 13 per 1000 | OR 2.00 | 304 | ⊕⊕⊕⊝ | |
| Pregnancy rate per couple (all cycles) | 247 per 1000 | 247 per 1000 | OR 1.00 | 304 | ⊕⊕⊕⊝ | |
| Ovarian Hyperstimulation rate per woman ‐ not measured | Not estimable | ‐ | ||||
| Miscarriage rate per couple | 48 per 1000 | 103 per 1000 | OR 2.28 | 253 | ⊕⊕⊕⊝ | |
| Ectopic pregnancy rate per couple ‐ not reported | See comment | See comment | Not estimable | ‐ | See comment | |
| *The basis for the assumed risk is the median control group risk across studies. The corresponding risk (and its 95% confidence interval) is based on the assumed risk in the comparison group and the relative effect of the intervention (and its 95% CI). | ||||||
| GRADE Working Group grades of evidence | ||||||
| 1 Small sample size | ||||||
| IUI in natural cycle compared to TI or expectant management in stimulated cycle for unexplained subfertility | ||||||
| Patient or population: people with unexplained subfertility | ||||||
| Outcomes | Illustrative comparative risks* (95% CI) | Relative effect | No of Participants | Quality of the evidence | Comments | |
| Assumed risk | Corresponding risk | |||||
| TI in stimulated cycle | IUI in natural cycle | |||||
| Live birth rate per couple (all cycles) | 131 per 1000 | 227 per 1000 | OR 1.95 | 342 | ⊕⊕⊕⊝ | |
| Multiple pregnancy rate per couple | 6 per 1000 | 6 per 1000 | OR 1.05 | 342 | ⊕⊕⊕⊝ | |
| Pregnancy rate per couple (all cycles) | 143 per 1000 | 228 per 1000 | OR 1.77 | 342 | ⊕⊕⊕⊝ | |
| Ovarian Hyperstimulation Syndrome rate per woman ‐ not reported | Not estimable | ‐ | ||||
| Miscarriage rate per couple | 46 per 1000 | 42 per 1000 | OR 0.91 | 342 | ⊕⊕⊕⊝ | |
| Ectopic pregnancy rate per couple | Not estimable | OR 5.30 | 342 | ⊕⊕⊕⊝ | ||
| *The basis for the assumed risk is the median control group risk across studies. The corresponding risk (and its 95% confidence interval) is based on the assumed risk in the comparison group and the relative effect of the intervention (and its 95% CI). | ||||||
| GRADE Working Group grades of evidence | ||||||
| 1 Small sample size | ||||||
| Outcome or subgroup title | No. of studies | No. of participants | Statistical method | Effect size |
| 1 Live birth rate per couple (all cycles) Show forest plot | 1 | 334 | Odds Ratio (M‐H, Fixed, 95% CI) | 1.60 [0.92, 2.78] |
| 2 Multiple pregnancy rate per couple Show forest plot | 1 | 334 | Odds Ratio (M‐H, Fixed, 95% CI) | 0.50 [0.04, 5.53] |
| 3 Pregnancy rate per couple (all cycles) Show forest plot | 1 | 334 | Odds Ratio (M‐H, Fixed, 95% CI) | 1.53 [0.88, 2.64] |
| 4 Miscarriage rate per couple Show forest plot | 1 | 334 | Odds Ratio (M‐H, Fixed, 95% CI) | 0.77 [0.28, 2.11] |
| 5 Ectopic pregnancy rate per couple Show forest plot | 1 | 334 | Odds Ratio (M‐H, Fixed, 95% CI) | 5.06 [0.24, 106.21] |
| Outcome or subgroup title | No. of studies | No. of participants | Statistical method | Effect size |
| 1 Live birth rate per couple (all cycles) Show forest plot | 2 | 208 | Odds Ratio (M‐H, Fixed, 95% CI) | 1.59 [0.88, 2.88] |
| 1.1 Gonadotropins | 2 | 208 | Odds Ratio (M‐H, Fixed, 95% CI) | 1.59 [0.88, 2.88] |
| 2 Multiple pregnancy rate per couple Show forest plot | 4 | 316 | Odds Ratio (M‐H, Fixed, 95% CI) | 1.46 [0.55, 3.87] |
| 2.1 Clomiphene Citrate | 1 | 40 | Odds Ratio (M‐H, Fixed, 95% CI) | 0.43 [0.02, 11.18] |
| 2.2 Gonadotropins | 2 | 208 | Odds Ratio (M‐H, Fixed, 95% CI) | 1.61 [0.44, 5.89] |
| 2.3 Clomiphene Citrate and Gonadotropins | 1 | 68 | Odds Ratio (M‐H, Fixed, 95% CI) | 1.88 [0.32, 11.00] |
| 3 Pregnancy rate per couple (all cycles) Show forest plot | 6 | 517 | Odds Ratio (M‐H, Fixed, 95% CI) | 1.69 [1.14, 2.53] |
| 3.1 Clomiphene Citrate | 1 | 40 | Odds Ratio (M‐H, Fixed, 95% CI) | 0.30 [0.03, 2.93] |
| 3.2 Gonadotropins | 4 | 319 | Odds Ratio (M‐H, Fixed, 95% CI) | 1.68 [1.03, 2.75] |
| 3.3 Clomiphene Citrate and Gonadotropins | 1 | 68 | Odds Ratio (M‐H, Fixed, 95% CI) | 2.62 [0.98, 6.98] |
| 3.4 Clomiphene citrate OR Gonadotropins | 1 | 90 | Odds Ratio (M‐H, Fixed, 95% CI) | 1.72 [0.50, 5.89] |
| 4 Moderate or severe ovarian hyperstimulation syndrome rate per woman Show forest plot | 2 | Odds Ratio (M‐H, Fixed, 95% CI) | Subtotals only | |
| 4.1 Gonadotropins | 1 | 108 | Odds Ratio (M‐H, Fixed, 95% CI) | 0.0 [0.0, 0.0] |
| 4.2 Clomiphene Citrate and Gonadotropins | 1 | 68 | Odds Ratio (M‐H, Fixed, 95% CI) | 2.75 [0.11, 69.83] |
| 5 Miscarriage rate per couple Show forest plot | 2 | 208 | Odds Ratio (M‐H, Fixed, 95% CI) | 1.66 [0.56, 4.88] |
| 5.1 Gonadotropins | 2 | 208 | Odds Ratio (M‐H, Fixed, 95% CI) | 1.66 [0.56, 4.88] |
| 6 Ectopic pregnancy rate per couple Show forest plot | 1 | 100 | Odds Ratio (M‐H, Fixed, 95% CI) | 3.06 [0.12, 76.95] |
| 6.1 Gonadotropins | 1 | 100 | Odds Ratio (M‐H, Fixed, 95% CI) | 3.06 [0.12, 76.95] |
| Outcome or subgroup title | No. of studies | No. of participants | Statistical method | Effect size |
| 1 Live birth rate per couple (all cycles) Show forest plot | 4 | 396 | Odds Ratio (M‐H, Fixed, 95% CI) | 0.48 [0.29, 0.82] |
| 1.1 Clomiphene Citrate | 1 | 26 | Odds Ratio (M‐H, Fixed, 95% CI) | 0.27 [0.02, 3.41] |
| 1.2 Gonadotropins | 3 | 370 | Odds Ratio (M‐H, Fixed, 95% CI) | 0.50 [0.29, 0.85] |
| 2 Multiple pregnancy rate per couple Show forest plot | 2 | 65 | Odds Ratio (M‐H, Fixed, 95% CI) | 0.33 [0.01, 8.70] |
| 2.1 Clomiphene Citrate | 1 | 26 | Odds Ratio (M‐H, Fixed, 95% CI) | 0.0 [0.0, 0.0] |
| 2.2 Gonadotropins | 1 | 39 | Odds Ratio (M‐H, Fixed, 95% CI) | 0.33 [0.01, 8.70] |
| 3 Pregnancy rate per couple (all cycles) Show forest plot | 1 | 26 | Odds Ratio (M‐H, Fixed, 95% CI) | 0.16 [0.01, 1.77] |
| 3.1 Clomiphene Citrate | 1 | 26 | Odds Ratio (M‐H, Fixed, 95% CI) | 0.16 [0.01, 1.77] |
| 4 Moderate or severe ovarian hyperstimulation syndrome per woman Show forest plot | 3 | 185 | Odds Ratio (M‐H, Fixed, 95% CI) | 0.0 [0.0, 0.0] |
| 4.1 Clomiphene Citrate | 1 | 26 | Odds Ratio (M‐H, Fixed, 95% CI) | 0.0 [0.0, 0.0] |
| 4.2 Gonadotropins | 2 | 159 | Odds Ratio (M‐H, Fixed, 95% CI) | 0.0 [0.0, 0.0] |
| 5 Miscarriage rate per couple Show forest plot | 1 | 26 | Odds Ratio (M‐H, Fixed, 95% CI) | 0.19 [0.01, 5.20] |
| 5.1 Clomiphene Citrate | 1 | 26 | Odds Ratio (M‐H, Fixed, 95% CI) | 0.19 [0.01, 5.20] |
| 5.2 Gonadotropins | 0 | 0 | Odds Ratio (M‐H, Fixed, 95% CI) | 0.0 [0.0, 0.0] |
| 6 Ectopic pregnancy rate per couple Show forest plot | 2 | 250 | Odds Ratio (M‐H, Fixed, 95% CI) | 0.15 [0.01, 3.02] |
| 6.1 Gonadotropins | 2 | 250 | Odds Ratio (M‐H, Fixed, 95% CI) | 0.15 [0.01, 3.02] |
| Outcome or subgroup title | No. of studies | No. of participants | Statistical method | Effect size |
| 1 Live birth rate per couple (all cycles) Show forest plot | 1 | 253 | Odds Ratio (M‐H, Fixed, 95% CI) | 0.82 [0.45, 1.49] |
| 2 Multiple pregnancy rate per couple Show forest plot | 2 | 304 | Odds Ratio (M‐H, Fixed, 95% CI) | 2.0 [0.18, 22.34] |
| 2.1 Clomiphene Citrate | 1 | 51 | Odds Ratio (M‐H, Fixed, 95% CI) | 0.0 [0.0, 0.0] |
| 2.2 Clomiphene Citrate or Gonadotropins | 1 | 253 | Odds Ratio (M‐H, Fixed, 95% CI) | 2.0 [0.18, 22.34] |
| 3 Pregnancy rate per couple (all cycles) Show forest plot | 2 | 304 | Odds Ratio (M‐H, Fixed, 95% CI) | 1.00 [0.59, 1.67] |
| 3.1 Clomiphene Citrate | 1 | 51 | Odds Ratio (M‐H, Fixed, 95% CI) | 3.2 [0.82, 12.50] |
| 3.2 Clomiphene Citrate or Gonadotropins | 1 | 253 | Odds Ratio (M‐H, Fixed, 95% CI) | 0.80 [0.45, 1.42] |
| 4 Moderate or severe ovarian hyperstimulation syndrome per woman Show forest plot | 1 | Odds Ratio (M‐H, Fixed, 95% CI) | Totals not selected | |
| 4.1 Clomiphene Citrate | 1 | Odds Ratio (M‐H, Fixed, 95% CI) | 0.0 [0.0, 0.0] | |
| 4.2 Clomiphene Citrate or Gonadotropins | 0 | Odds Ratio (M‐H, Fixed, 95% CI) | 0.0 [0.0, 0.0] | |
| 5 Miscarriage rate per couple Show forest plot | 1 | 253 | Odds Ratio (M‐H, Fixed, 95% CI) | 2.28 [0.84, 6.20] |
| Outcome or subgroup title | No. of studies | No. of participants | Statistical method | Effect size |
| 1 Live birth rate per couple (all cycles) Show forest plot | 1 | 342 | Odds Ratio (M‐H, Fixed, 95% CI) | 1.95 [1.10, 3.44] |
| 2 Multiple pregnancy rate per couple Show forest plot | 1 | 342 | Odds Ratio (M‐H, Fixed, 95% CI) | 1.05 [0.07, 16.90] |
| 3 Pregnancy rate per couple (all cycles) Show forest plot | 1 | 342 | Odds Ratio (M‐H, Fixed, 95% CI) | 1.77 [1.01, 3.08] |
| 4 Miscarriage rate per couple Show forest plot | 1 | 342 | Odds Ratio (M‐H, Fixed, 95% CI) | 0.91 [0.32, 2.58] |
| 5 Ectopic pregnancy rate per couple Show forest plot | 1 | 342 | Odds Ratio (M‐H, Random, 95% CI) | 5.30 [0.25, 111.26] |