Inseminación intrauterina para la subfertilidad idiopática
Resumen
Antecedentes
La inseminación intrauterina (IIU) es un tratamiento para la fertilidad muy utilizado por parejas con subfertilidad idiopática. Aunque la IIU es menos invasiva y menos costosa que la fecundación in vitro (FIV), la seguridad de la IIU en combinación con la hiperestimulación ovárica (HEO) es objeto de debate. La preocupación principal sobre el tratamiento con IIU e HEO es el aumento de las tasas de embarazos múltiples.
Objetivos
Determinar si, para las parejas con subfertilidad idiopática, la tasa de nacidos vivos mejora después del tratamiento con IIU con o sin HEO en comparación con el coito programado (CP) o el manejo expectante con o sin HEO, o después del tratamiento con IIU e HEO en comparación con la IIU en un ciclo natural.
Métodos de búsqueda
Se realizaron búsquedas en el registro de ensayos del Grupo Cochrane de Ginecología y Fertilidad (Cochrane Gynaecology and Fertility [CGF] Group), CENTRAL, MEDLINE, Embase, PsycINFO, CINAHL y en dos registros de ensayos hasta el 17 de octubre 2019; y además se verificaron las referencias y se estableció contacto con los autores de los estudios para obtener los datos faltantes o no publicados.
Criterios de selección
Ensayos controlados aleatorizados (ECA) que compararon la IIU con el CP o el manejo expectante, ambos en ciclos estimulados o naturales, o la IIU en ciclos estimulados con la IIU en ciclos naturales en parejas con subfertilidad idiopática.
Obtención y análisis de los datos
Dos autores de la revisión realizaron la selección de estudios, la evaluación de la calidad y la extracción de datos de forma independiente. Los resultados primarios de la revisión fueron la tasa de nacidos vivos y la tasa de embarazos múltiples.
Resultados principales
Se incluyeron 15 ensayos con 2068 mujeres. La evidencia fue de calidad muy baja a moderada. La principal limitación fue la imprecisión muy grave.
IIU en un ciclo natural versus coito programado o manejo expectante en un ciclo natural
No se conoce con certeza si el tratamiento con IIU en un ciclo natural mejora la tasa de nacidos vivos en comparación con el manejo expectante en un ciclo natural (odds ratio [OR] 1,60, intervalo de confianza [IC] del 95%: 0,92 a 2,78; un ECA, 334 mujeres; evidencia de calidad baja). Si se supone que la probabilidad de un nacido vivo con el manejo expectante en un ciclo natural es del 16%, la de la IIU en un ciclo natural estaría entre el 15% y el 34%. No se conoce con certeza si el tratamiento con IIU en un ciclo natural reduce las tasas de embarazos múltiples en comparación con el control (OR 0,50; IC del 95%: 0,04 a 5,53; un ECA, 334 mujeres; evidencia de calidad baja).
IIU en un ciclo estimulado versus coito programado o manejo expectante en un ciclo estimulado
No se conoce con certeza si el tratamiento con IIU en un ciclo estimulado mejora las tasas de nacidos vivos en comparación con el tratamiento con CP en un ciclo estimulado (OR 1,59; IC del 95%: 0,88 a 2,88; dos ECA, 208 mujeres; I2 =72%; evidencia de calidad baja). Si se supone que la probabilidad de lograr un nacido vivo con el CP en un ciclo estimulado era del 26%, la probabilidad con la IIU en un ciclo estimulado estaría entre el 23% y el 50%. No se conoce con certeza si el tratamiento con IIU en un ciclo estimulado reduce las tasas de embarazos múltiples en comparación con el control (OR 1,46; IC del 95%: 0,55 a 3,87; cuatro ECA, 316 mujeres; I2 = 0%; evidencia de calidad baja).
IIU en un ciclo estimulado versus coito programado o manejo expectante en un ciclo natural
En las parejas con una puntuación de predicción baja de concepción natural, el tratamiento con IIU combinado con citrato de clomifeno o letrozol probablemente da lugar a una mayor tasa de nacidos vivos en comparación con el manejo expectante en un ciclo natural (OR 4,48; IC del 95%: 2,00 a 10,01; un ECA; 201 mujeres; evidencia de calidad moderada). Si se supone que la probabilidad de un nacido vivo con el manejo expectante en un ciclo natural era del 9%, la probabilidad de un nacido vivo con la IIU en un ciclo estimulado estaría entre el 17% y el 50%. No se conoce con certeza si el tratamiento con IIU en un ciclo estimulado da lugar a una menor tasa de embarazos múltiples en comparación con el control (OR 3,01; IC del 95%: 0,47 a 19,28; dos ECA, 454 mujeres; I2 = 0%; evidencia de calidad baja).
IIU en un ciclo natural versus coito programado o manejo expectante en un ciclo estimulado
El tratamiento con IIU en un ciclo natural probablemente da lugar a una mayor tasa acumulativa de nacidos vivos en comparación con el manejo expectante en un ciclo estimulado (OR 1,95; IC del 95%: 1,10 a 3,44; un ECA, 342 mujeres: evidencia de calidad moderada). Si se supone que la probabilidad de un nacido vivo con el manejo expectante en un ciclo estimulado era del 13%, la probabilidad de un nacido vivo con la IIU en un ciclo natural estaría entre el 14% y el 34%. No se conoce con certeza si el tratamiento con IIU en un ciclo natural da lugar a una tasa de embarazos múltiples más baja en comparación con el control (OR 1,05; IC del 95%: 0,07 a 16,90; un ECA, 342 mujeres; evidencia de calidad baja).
IIU en un ciclo estimulado versus IIU en un ciclo natural
El tratamiento con IIU en un ciclo estimulado puede dar lugar a una mayor tasa acumulativa de nacidos vivos en comparación con el tratamiento con IIU en un ciclo natural (OR 2,07; IC del 95%: 1,22 a 3,50; cuatro ECA, 396 mujeres; I2 = 0%; evidencia de calidad baja). Si se supone que la probabilidad de un nacido vivo con la IIU en un ciclo natural era del 14%, la probabilidad de un nacido vivo con la IIU en un ciclo estimulado estaría entre el 17% y el 36%. No se conoce con certeza si el tratamiento con IIU en un ciclo estimulado da lugar a una tasa mayor de embarazos múltiples en comparación con el control (OR 3,00; IC del 95%: 0,11 a 78,27; dos ECA, 65 mujeres; evidencia de calidad baja).
Conclusiones de los autores
Debido a que los datos no fueron suficientes, no se conoce con certeza si el tratamiento con IIU con o sin HEO, en comparación con el coito programado o el manejo expectante con o sin HEO, mejora las tasas acumulativas de nacidos vivos con tasas aceptables de embarazos múltiples en parejas con subfertilidad idiopática. Sin embargo, el tratamiento con IIU e HEO probablemente da lugar a una tasa acumulativa de nacidos vivos más alta en comparación con el manejo expectante sin HEO en parejas con una puntuación baja de predicción de concepción natural. De manera similar, el tratamiento con IIU en un ciclo natural probablemente da lugar a una tasa acumulativa de nacidos vivos más alta, en comparación con el tratamiento con coito programado e HEO. El tratamiento con IIU en un ciclo estimulado puede dar lugar a una tasa acumulativa mayor de nacidos vivos en comparación con el tratamiento con IIU en un ciclo natural.
PICO
Resumen en términos sencillos
Inseminación intrauterina para la subfertilidad idiopática
Pregunta de la revisión
¿El tratamiento con inseminación intrauterina (IIU), con o sin fármacos para la fertilidad, comparado con el coito programado o el manejo expectante (espera vigilante) con o sin fármacos para la fertilidad, o el tratamiento con IIU con fármacos para la fertilidad comparado con IIU sin fármacos para la fertilidad, mejoran las tasas de nacidos vivos en las parejas con subfertilidad idiopática?
Antecedentes
La IIU es un tratamiento que se utiliza a menudo para parejas con subfertilidad idiopática. En un ciclo de IIU, el esperma de la pareja masculina se prepara y se coloca directamente en el útero cerca del momento de la ovulación. Los ciclos de IIU se pueden utilizar en combinación con medicamentos para la fertilidad para aumentar el número de óvulos disponibles. Sin embargo, estos medicamentos pueden tener efectos secundarios y también aumentar el riesgo de embarazos múltiples. También se ha demostrado que el manejo expectante y el coito programado aumentan las tasas de embarazo, y dan lugar a nacidos vivos. Con esta revisión se desea mejorar la toma de decisiones de las parejas que comienzan el tratamiento para la subfertilidad idiopática.
Características de los estudios
Los autores Cochrane identificaron 15 ensayos controlados aleatorizados que incluyeron a 2068 mujeres. Las mujeres que fueron tratadas con IIU, con o sin fármacos para la fertilidad, se compararon con las asignadas a un coito programado o a manejo expectante con o sin fármacos para la fertilidad, o las mujeres que recibieron IIU con fármacos para la fertilidad se compararon con las recibieron tratamiento con IIU sin fármacos para la fertilidad. Los principales resultados de interés fueron las tasas de nacidos vivos y las tasas de embarazos múltiples. Otros resultados incluyeron las tasas de embarazo, las tasas de aborto y otros eventos adversos. La evidencia se actualizó hasta octubre 2019.
Resultados clave
En la mayoría de los grupos de tratamiento no se conoce si el tratamiento con un tipo de tratamiento de IIU mejora las tasas acumulativas de nacidos vivos (es decir, las tasas al final de un ciclo de tratamiento), con tasas aceptables de embarazos múltiples, en comparación con otro tipo de tratamiento. Sin embargo, hay evidencia de calidad moderada de que, en las parejas con pocas posibilidades de concepción natural, el tratamiento con IIU combinado con fármacos para la fertilidad probablemente mejora las tasas acumulativas de nacidos vivos, en comparación con el manejo expectante. De manera similar, hay evidencia de calidad moderada de que el tratamiento con IIU por sí solo probablemente mejora las tasas acumulativas de nacidos vivos en comparación con el manejo expectante combinado con fármacos para la fertilidad.
Calidad de la evidencia
La evidencia fue de calidad baja a moderada en el caso de la tasa acumulativa de nacidos vivos y de calidad baja en el caso de los embarazos múltiples. La principal limitación de la evidencia fue la falta de precisión de los hallazgos debido a la inclusión de pocos estudios con un tamaño pequeño de las muestras.
Conclusiones de los autores
Summary of findings
| IUI compared to TI or expectant management both in natural cycle for unexplained subfertility | ||||||
| Patient or population: participants with unexplained subfertility | ||||||
| Outcomes | Illustrative comparative risks* (95% CI) | Relative effect | No of Participants | Quality of the evidence | Comments | |
| Assumed risk | Corresponding risk | |||||
| TI or expectant management both in natural cycle | IUI | |||||
| Live birth rates per couple (all cycles) | 156 per 1000 | 228 per 1000 | OR 1.60 | 334 | ⊕⊕⊝⊝ | ‐ |
| Multiple pregnancy rate per couple | 12 per 1000 | 6 per 1000 | OR 0.50 | 334 | ⊕⊕⊝⊝ | ‐ |
| Pregnancy rate per couple (all cycles) | 162 per 1000 | 228 per 1000 | OR 1.53 | 334 | ⊕⊕⊝⊝ | ‐ |
| Ovarian hyperstimulation syndrome rate per woman ‐ not reported | See comment | See comment | ‐ | ‐ | See comment | No data reported on outcome |
| Miscarriage rate per couple | 54 per 1000 | 42 per 1000 | OR 0.77 | 334 | ⊕⊕⊝⊝ | ‐ |
| Ectopic pregnancy rate per couple | Not estimable (no events in control group) | ‐ | OR 05.06 | 334 | ⊕⊕⊝⊝ | ‐ |
| *The basis for the assumed risk (e.g. the median control group risk across studies) is provided in footnotes. The corresponding risk (and its 95% confidence interval) is based on the assumed risk in the comparison group and the relative effect of the intervention (and its 95% CI). | ||||||
| GRADE Working Group grades of evidence | ||||||
| aDowngraded by two levels for very serious imprecision: small sample size with a low event rate and effect estimate with a wide confidence interval. | ||||||
| IUI compared to TI or expectant management both in stimulated cycle for unexplained subfertility | ||||||
| Patient or population: participants with unexplained subfertility | ||||||
| Outcomes | Illustrative comparative risks* (95% CI) | Relative effect | No of Participants | Quality of the evidence | Comments | |
| Assumed risk | Corresponding risk | |||||
| TI or expectant management both in stimulated cycle | IUI | |||||
| Live birth rate per couple (all cycles) | 255 per 1000 | 352 per 1000 | OR 1.59 | 208 | ⊕⊕⊝⊝ | ‐ |
| Multiple pregnancy rate per couple | 43 per 1000 | 62 per 1000 | OR 1.46 | 316 | ⊕⊕⊝⊝ | ‐ |
| Pregnancy rate per couple (all cycles) | 234 per 1000 | 340 per 1000 | OR 1.69 | 517 | ⊕⊕⊝⊝ | ‐ |
| Ovarian hyperstimulation syndrome rate per woman | Not estimable (no events in control group) | OR 2.75 | 68 | ⊕⊝⊝⊝ | ‐ | |
| Miscarriage rate per couple | 57 per 1000 | 91 per 1000 | OR 1.66 | 208 | ⊕⊕⊝⊝ | ‐ |
| Ectopic pregnancy rate per couple | Not estimable (no events in control group) | ‐ | OR 3.06 | 100 | ⊕⊕⊝⊝ | ‐ |
| *The basis for the assumed risk (e.g. the median control group risk across studies) is provided in footnotes. The corresponding risk (and its 95% confidence interval) is based on the assumed risk in the comparison group and the relative effect of the intervention (and its 95% CI). | ||||||
| GRADE Working Group grades of evidence | ||||||
| aDowngraded by two levels for very serious imprecision: small sample size with a low event rate and effect estimate with a wide confidence interval. | ||||||
| IUI in stimulated cycle compared to TI or expectant management in natural cycle for unexplained subfertility | ||||||
| Patient or population: participants with unexplained subfertility | ||||||
| Outcomes | Illustrative comparative risks* (95% CI) | Relative effect | No of Participants | Quality of the evidence | Comments | |
| Assumed risk | Corresponding risk | |||||
| TI or expectant management in a natural cycle | IUI in a stimulated cycle | |||||
| Live birth rate per couple (all cycles)‐ clomiphene citrate or letrozole | 90 per 1000 | 307 per 1000 | OR 4.48 | 201 | ⊕⊕⊕⊝ | ‐ |
| Live birth rate per couple (all cycles)‐ clomiphene citrate or gonadotropins | 238 per 1000 | 204 per 1000 | OR 0.82 | 253 | ⊕⊕⊝⊝ | ‐ |
| Multiple pregnancy rate per couple | 4 per 1000 | 13 per 1000 | OR 3.01 | 454 | ⊕⊕⊝⊝ | ‐ |
| Pregnancy rate per couple (all cycles)‐ clomiphene citrate or letrozole | 110 per 1000 | 366 per 1000 | OR 4.68 | 201 | ⊕⊕⊕⊝ | ‐ |
| Ovarian hyperstimulation syndrome rate per woman | See comment | See comment | See comment | See comment | See comment | No events in intervention or control groups |
| Miscarriage rate per couple | 31 per 1000 | 84 per 1000 | OR 2.87 | 454 | ⊕⊕⊕⊝ | ‐ |
| Ectopic pregnancy rate per couple | Not estimable (no events in intervention group) | ‐ | OR 9.28 | 201 | ⊕⊕⊝⊝ | ‐ |
| *The basis for the assumed risk (e.g. the median control group risk across studies) is provided in footnotes. The corresponding risk (and its 95% confidence interval) is based on the assumed risk in the comparison group and the relative effect of the intervention (and its 95% CI). | ||||||
| GRADE Working Group grades of evidence | ||||||
| aDowngraded by one level for serious imprecision: small sample size with a low event rate. | ||||||
| IUI in natural cycle compared to TI or expectant management in stimulated cycle for unexplained subfertility | ||||||
| Patient or population: participants with unexplained subfertility | ||||||
| Outcomes | Illustrative comparative risks* (95% CI) | Relative effect | No of Participants | Quality of the evidence | Comments | |
| Assumed risk | Corresponding risk | |||||
| TI or expectant management in stimulated cycle | IUI in natural cycle | |||||
| Live birth rate per couple (all cycles) | 131 per 1000 | 227 per 1000 | OR 1.95 | 342 | ⊕⊕⊕⊝ | ‐ |
| Multiple pregnancy rate per couple | 6 per 1000 | 6 per 1000 | OR 1.05 | 342 | ⊕⊕⊝⊝ | ‐ |
| Pregnancy rate per couple (all cycles) | 143 per 1000 | 228 per 1000 | OR 1.77 | 342 | ⊕⊕⊕⊝ | ‐ |
| Ovarian hyperstimulation syndrome rate per woman ‐ not reported | See comment | See comment | ‐ | ‐ | See comment | No data reported on outcome |
| Miscarriage rater per couple | 46 per 1000 | 42 per 1000 | OR 0.91 | 342 | ⊕⊕⊝⊝ | ‐ |
| Ectopic pregnancy rate per couple | Not estimable (no events in control group) | ‐ | OR 5.30 | 342 | ⊕⊕⊝⊝ | ‐ |
| *The basis for the assumed risk (e.g. the median control group risk across studies) is provided in footnotes. The corresponding risk (and its 95% confidence interval) is based on the assumed risk in the comparison group and the relative effect of the intervention (and its 95% CI). | ||||||
| GRADE Working Group grades of evidence | ||||||
| aDowngraded by one level for serious imprecision: small sample size with a low event rate. | ||||||
| IUI in stimulated cycle compared to IUI in natural cycle for unexplained subfertility | ||||||
| Patient or population: participants with unexplained subfertility | ||||||
| Outcomes | Illustrative comparative risks* (95% CI) | Relative effect | No of Participants | Quality of the evidence | Comments | |
| Assumed risk | Corresponding risk | |||||
| IUI in a natural cycle | IUI in a stimulated cycle | |||||
| Live birth rare per couple (all cycles) | 139 per 1000 | 250 per 1000 | OR 2.07 | 396 | ⊕⊕⊝⊝ | ‐ |
| Multiple pregnancy rate per couple | Not estimable (no events in control group) | ‐ | OR 3.00 | 39 | ⊕⊕⊝⊝ | ‐ |
| Pregnancy rate per couple (all cycles) | 63 per 1000 | 302 per 1000 | OR 6.43 | 26 | ⊕⊕⊝⊝ | ‐ |
| Ovarian hyperstimulation syndrome rate per woman ‐ not measured | See comment | See comment | Not estimable | ‐ | See comment | No events in intervention and control groups |
| Miscarriage rate per couple | Not estimable (no events in control group) | ‐ | OR 5.21 | 26 | ⊕⊕⊝⊝ | ‐ |
| Ectopic pregnancy rate per couple | Not estimable (no events in control group) | ‐ | OR 6.48 | 211 | ⊕⊝⊝⊝ | ‐ |
| *The basis for the assumed risk (e.g. the median control group risk across studies) is provided in footnotes. The corresponding risk (and its 95% confidence interval) is based on the assumed risk in the comparison group and the relative effect of the intervention (and its 95% CI). | ||||||
| GRADE Working Group grades of evidence | ||||||
| aDowngraded by one level for serious imprecision: small sample size with a low event rate. | ||||||
Antecedentes
Descripción de la afección
De todas las parejas que se presentan a la consulta con problemas de fertilidad, alrededor del 25% no tienen una causa que se pueda identificar (NICE 2013). Las parejas se clasifican como con subfertilidad idiopática cuando han tratado de concebir durante al menos un año y el estudio de fertilidad ha mostrado trompas de Falopio permeables, un ciclo menstrual ovulatorio y un análisis de semen normal.
Descripción de la intervención
La inseminación intrauterina (IIU) es un tratamiento utilizado con frecuencia en parejas con subfertilidad idiopática. La IIU es un procedimiento relativamente simple en el que el semen se «lava» en el laboratorio y se inserta en la cavidad uterina a través de un pequeño catéter en el momento de la ovulación. La IIU se puede realizar con o sin medicamentos para la hiperestimulación ovárica (HEO). Para que el momento adecuado de la inseminación sea correcto, se monitoriza el ciclo. Generalmente se hace mediante una evaluación por ecografía del crecimiento de los folículos, o mediante la monitorización del aumento de la hormona luteinizante preovulatoria en la sangre o la orina. En los ciclos hiperestimulados, la ovulación se suele inducir con una inyección de gonadotropina coriónica humana (hCG, por sus siglas en inglés), lo que mejora las posibilidades de que los procedimientos se realicen en un momento adecuado. A diferencia del procedimiento de IIU, en el caso del manejo expectante se monitoriza el ciclo de las parejas para lograr un momento adecuado correcto de la relación sexual, es decir, un coito programado (CP), o no se realiza intervención alguna.
De qué manera podría funcionar la intervención
El fundamento para realizar la IIU es que los espermatozoides móviles, que son morfológicamente normales, se pueden concentrar en un pequeño volumen y colocarse directamente en el útero cerca del ovocito liberado. De esta manera, se pasa por alto el cuello del útero, que también actúa como un depósito de esperma. Por lo tanto, un momento adecuado exacto de la inseminación es de gran importancia. La IIU se puede realizar con o sin hiperestimulación ovárica (HEO). La función de la IIU en el tratamiento para la fertilidad suele ser objeto de debate, en particular en cuanto a si es o no superior al CP, y si se debe utilizar la HEO al mismo tiempo (Cohlen 200; Hughes 2003; Stewart 2003). Los fármacos que se administran con frecuencia para la hiperestimulación ovárica son el citrato de clomifeno (CC) y los inhibidores de la aromatasa, como el letrozol, que son tratamientos orales, así como las gonadotropinas, que se administran mediante inyección subcutánea. El objetivo de la HEO es aumentar el número de ovocitos disponibles para la fecundación y determinar con mayor precisión el momento adecuado.
El uso de la HEO en el tratamiento de la fertilidad para la subfertilidad idiopática se asocia con efectos beneficiosos y con un mayor riesgo de embarazos múltiples. Cuando Hughes 1997 publicó un metanálisis que indicó que el promedio de fecundidad es aproximadamente cinco veces mayor para el tratamiento con IIU e HEO, el Royal College of Obstetricians and Gynaecologists (RCOG 1998) concluyó en consecuencia que «la HEO con IIU es un tratamiento efectivo para las parejas con infertilidad idiopática». Sin embargo, se plantearon grandes preocupaciones sobre la incidencia de embarazos múltiples, y la HEO se hizo menos popular. Estas preocupaciones han dado lugar a un ajuste del asesoramiento para el tratamiento de parejas con subfertilidad idiopática. La guía de fertilidad NICE establece que «la hiperestimulación ovárica no se le debe ofrecer a las mujeres con subfertilidad idiopática» (NICE 2013).
El aumento de los embarazos múltiples es una consecuencia lógica de la estimulación del crecimiento de folículos múltiples. La incidencia de embarazos múltiples después del tratamiento con HEO e IIU varía entre el 10% y el 40%, y se calcula que la contribución global de este tratamiento a los nacimientos múltiples es de alrededor del 30% (Fauser 2005). Sin embargo, en estudios recientes se ha informado de una incidencia menor de embarazos múltiples con la HEO. Por ejemplo, un ensayo controlado aleatorizado reciente ha informado de tasas de embarazos múltiples de entre el 1,4% y el 2,2% con la HEO (Danhof 2018), y también se han informado tasas de entre el 3% y el 10% en otro ensayo (Diamond 2015). La cuestión es si esta tasa de embarazos múltiples es aceptable, o si se puede reducir hasta cifras aceptables. Recientemente se ha reunido más evidencia que demuestra que la hiperestimulación ovárica leve con criterios de cancelación estrictos reduce el riesgo de embarazos múltiples a aproximadamente el 10%, sin comprometer las tasas de embarazo (ESHRE 2006; Ragni 2006; Van Rumste 2006). Debido a que las tasas de morbilidad y mortalidad materna y neonatal aumentan considerablemente en los embarazos múltiples (Fauser 2005; Ombelet 2005), los cuidadores deben tener especial cuidado para mantener al mínimo la tasa de embarazos múltiples. Las parejas deben ser bien informadas por sus médicos, especialmente porque muchas parejas desean concebir gemelos (Ryan 2004) y prefieren una mayor probabilidad de embarazo por sobre la seguridad.
Algunos autores han afirmado que el tratamiento con HEO da lugar a una incidencia inaceptablemente alta de embarazos múltiples de alto orden (Gleicher 2000; Nan 1994) y que se debe preferir el tratamiento con IIU en los ciclos naturales (Fauser 2005; Goverde 2005). Otros han informado que el riesgo de embarazos múltiples se podría reducir con una monitorización estricta de las pacientes sometidas al tratamiento (Dickey 2005; Tur 2005). Te Velde 1999 concluyó que la IIU con HEO es una opción de tratamiento apropiada si se realiza con un protocolo de estimulación leve, una monitorización cuidadosa del ciclo y con criterios estrictos de cancelación. Sin embargo, todavía no se conoce en qué medida se pueden evitar los embarazos múltiples si se cumplen estos criterios. Además, el uso de criterios estrictos de cancelación del ciclo podría dar lugar a una reducción de la tasa general de embarazos. Se han publicado varios ensayos que utilizan protocolos de estimulación leve para la IIU y que muestran resultados prometedores de tasas de embarazo aceptables con tasas muy bajas de embarazos múltiples (Balasch 2004). Debido a que la FIV permite un mejor control sobre la reducción del riesgo de embarazos múltiples (Gleicher 2000), y que la FIV con transferencia de un solo embrión es cada vez más aceptada, se ha argumentado que la FIV es una opción de tratamiento más segura que la IIU con HEO.
Por qué es importante realizar esta revisión
Aunque la hiperestimulación ovárica parece dar lugar a tasas de embarazos más elevadas, también aumenta el riesgo de embarazos múltiples y de síndrome de hiperestimulación ovárica (SHEO). El riesgo alto de embarazos múltiples, por ejemplo, aumenta el riesgo de morbilidad y mortalidad neonatal y de morbilidad materna (Guzick 1999; Ombelet 2006). Las guías de fertilidad recomiendan la IIU sin HEO para las parejas con subfertilidad idiopática debido al mayor riesgo de embarazos múltiples y al SHEO asociado con la HEO (NICE 2013). Por lo tanto, esta revisión sistemática, publicada originalmente en 2006 y actualizada en 2012 (Veltman‐Verhulst 2012) y 2016 (Veltman‐Verhulst 2016) se realizó para evaluar la evidencia sobre los efectos beneficiosos y los eventos adversos asociados con la IIU con o sin HEO, en comparación con el coito programado o el manejo expectante con o sin HEO, o con la IIU con HEO en comparación con la IIU sin HEO, para las parejas con subfertilidad idiopática.
Objetivos
Determinar si, para las parejas con subfertilidad idiopática, la tasa de nacidos vivos mejora después del tratamiento con IIU con o sin HEO en comparación con el coito programado (CP) o el manejo expectante con o sin HEO, o después del tratamiento con IIU e HEO en comparación con la IIU en un ciclo natural.
Métodos
Criterios de inclusión de estudios para esta revisión
Tipos de estudios
Los ensayos controlados aleatorizados publicados y no publicados (ECA) fueron elegibles para su inclusión. Se excluyeron los estudios no aleatorizados (p.ej. estudios con evidencia de una generación inadecuada de la secuencia como días alternos y número de los pacientes) ya que se asocian con un riesgo de sesgo alto. Cuando el método de aleatorización o de asignación al azar no estuvo claro, se intentó establecer contacto con el autor del estudio.
Se excluyeron los ensayos que no informaron datos separados para las mujeres con subfertilidad idiopática, o en los que no fue posible obtener dichos datos por parte de los autores. Se evaluó el diseño del ensayo (cruzado o paralelo) y se incluyeron los ensayos cruzados si era posible extraer los datos previos al cruzamiento.
Tipos de participantes
I. Parejas con subfertilidad idiopática, definidas de la siguiente manera:
-
Estado ovulatorio normal (determinado por una tabla de temperatura corporal basal bifásica, progesterona luteínica normal, biopsia endometrial en fase u ovulación detectada por ecografía).
-
Permeabilidad tubárica (determinada con histerosalpingografía o laparoscopia, o ambas).
-
Una muestra de semen normal según los criterios de la Organización Mundial de la Salud (OMS) vigentes en el momento del ensayo.
II. Parejas que han intentado concebir durante al menos un año.
Los participantes excluidos fueron las parejas con una causa conocida de infertilidad, como un factor masculino moderado, endometriosis de moderada a grave (según la clasificación de la American Society for Reproductive Medicine [ASRM]), enfermedad tubárica o un factor cervical.
Cuando se estudiaron grupos con causas de infertilidad mixta, se estableció contacto con los autores de los estudios para obtener datos de parejas con infertilidad idiopática. Cuando no fue posible extraer los datos relevantes por separado para los participantes incluidos, se excluyó el estudio.
Se excluyeron los ensayos de participantes con endometriosis leve a moderada solamente.
Tipos de intervenciones
Ensayos con al menos una de las siguientes comparaciones:
-
Inseminación intrauterina (IIU) en un ciclo natural versus coito programado (CP) o manejo expectante en un ciclo natural;
-
IIU en un ciclo estimulado versus CP o manejo expectante en un ciclo estimulado;
-
IIU en un ciclo estimulado versus CP o manejo expectante en un ciclo natural;
-
IIU en un ciclo natural versus CP o manejo expectante en un ciclo estimulado;
-
IIU en un ciclo estimulado versus IIU en un ciclo natural.
La hiperestimulación ovárica (HEO) se logró con citrato de clomifeno, inhibidores de la aromatasa (letrozol) o gonadotropinas.
Se incluyó el manejo expectante como una variante del coito programado.
Se excluyeron las siguientes intervenciones:
-
inseminación intracervical, debido a que se considera que es una modalidad de tratamiento diferente (Ripps 1994) y es el tema de otra revisión Cochrane (Kop 2018);
-
inseminación con donante.
Tipos de medida de resultado
Resultados primarios
-
Tasa de nacidos vivos por pareja: todos los ciclos. Nacido vivo, se define como el parto de un feto vivo después de completadas las 20 semanas de gestación;
-
Tasa de embarazos múltiples por pareja. Se registraron los embarazos múltiples confirmados por ecografía, con o sin reducción selectiva.
Resultados secundarios
-
Tasa de embarazos por pareja: todos los ciclos. El embarazo incluye el embarazo clínico, definido por la presencia de un saco gestacional intrauterino o el latido del corazón del feto visualizado mediante ecografía antes de las 12 semanas, o el embarazo en curso, definido como un embarazo que se extiende más allá de las 12 semanas de gestación, confirmado con ecografía o el parto.
Otros eventos adversos:
-
Síndrome de hiperestimulación ovárica (SHEO) moderado o grave, tasa por mujer;
-
Tasa de abortos espontáneos por pareja;
-
Tasa de embarazos ectópicos por pareja.
Se excluyeron los embarazos confirmados solo por la detección de hCG en suero u orina (embarazos bioquímicos). Cuando el embarazo no se definió con más detalle, y no quedó claro incluso después de establecer contacto con los autores, se supuso que el embarazo era clínico.
Métodos de búsqueda para la identificación de los estudios
We searched for all reports which describe (or might describe) randomised controlled trials of IUI with or without OH, in couples with unexplained infertility. The original search was performed in 2005 and was last updated in October 2019, in consultation with the Gynaecology and Fertility Group (CGF) Information Specialist.
Búsquedas electrónicas
We searched:
-
Cochrane Gynaecology and Fertility Specialised Register; PROCITE platform (searched 17 October 2019) (Appendix 1);
-
CENTRAL; via the Cochrane Register of Studies Online (CRSO); web platform (searched 17 October 2019) (Appendix 2);
-
MEDLINE; OVID platform (searched from 1946 to 17 October 2019) (Appendix 3);
-
Embase; OVID platform (searched from 1980 to 17 October 2019) (Appendix 4);
-
PsycINFO; OVID platform (searched from 1806 to 17 October 2019) (Appendix 5);
-
CINAHL; EBSCO platform (searched from 1961 to October 2019) (Appendix 6).
We combined the MEDLINE search with the Cochrane highly sensitive search strategy for identifying randomised trials in MEDLINE: sensitivity‐ and precision‐maximising version (2008 revision; Lefebvre 2011). We combined the Embase and PsycINFO searches with trial filters developed by the Scottish Intercollegiate Guidelines Network (SIGN) ( www.sign.ac.uk/methodology/filters.html#random).
Other electronic sources of trials included:
-
Trial registers for ongoing and registered trials (up to October 2019):
-
www.clinicaltrials.gov (a service of the US National Institutes of Health);
-
www.who.int/trialsearch/Default.aspx (The World Health Organization International Trials Registry Platform search portal) Note: it is now mandatory for Cochrane Reviews to include searches of trial registers;
-
-
Database of Abstracts of Reviews of Effects (DARE) in the Cochrane Library at onlinelibrary.wiley.com/o/cochrane/cochrane_cldare_articles_fs.html (for reference lists from relevant non‐Cochrane reviews) (up to October 2019);
-
Web of Knowledge at wokinfo.com/ (another source of trials and conference abstracts) (up to October 2019);
-
OpenGrey at www.opengrey.eu/ for unpublished literature from Europe (up to October 2019);
-
LILACS database at regional.bvsalud.org/php/index.php?lang=en (for trials from the Portuguese‐ and Spanish‐speaking world) (up to October 2019);
-
PubMed and Google Scholar (for recent trials not yet indexed in MEDLINE) (up to October 2019);
-
Epistemonikos database at www.epistemonikos.org/en for systematic reviews that are useful for reference‐checking for trials (up to October 2019);
-
European Society of Human Reproduction and Embryology (ESHRE) and American Society for Reproductive Medicine (ASRM) 2019 conference abstracts.
Búsqueda de otros recursos
We handsearched reference lists of articles retrieved by the search and contacted experts in the field to obtain additional data. We also handsearched relevant journals and conference abstracts that were not covered in the Cochrane Gynaecology and Fertility register, in liaison with the Information Specialist.
Obtención y análisis de los datos
Selección de los estudios
After an initial screening of titles and abstracts produced by the search, we retrieved the full texts of all potentially eligible studies. Two review authors (ROA and JDA) independently examined these full‐text articles for compliance with the inclusion criteria and selected studies eligible for inclusion in the 2020 update. We contacted study investigators as required, to clarify study eligibility. We resolved any disagreements about study eligibility by discussion. We documented the selection process with a 'PRISMA' flow chart (Liberati 2009).
Extracción y manejo de los datos
Two review authors (ROA and JDA) independently extracted data from eligible studies using a data extraction form designed and pilot‐tested by the review authors, resolving any disagreements by discussion. Data extracted included study characteristics and outcome data. Where studies had multiple publications the review authors collated multiple reports of the same study, so that each study, rather than each report, was the unit of interest in the review, and such studies had a single study ID with multiple references. We contacted study investigators for further data on methods or results, or both, as required.
Evaluación del riesgo de sesgo de los estudios incluidos
Two review authors (ROA and JDA) independently assessed the included studies for risks of bias using the Cochrane 'Risk of bias' assessment tool (Higgins 2017) to assess: selection bias (random sequence generation and allocation concealment); performance bias (blinding of participants and personnel); detection bias (blinding of outcome assessors); attrition bias (incomplete outcome data); reporting bias (selective reporting); and other potential bias. We resolved disagreements by discussion or by involving a third review author. We described all judgements fully in the 'Risk of bias' table for each included study and incorporated our judgements into the interpretation of the review findings.
Medidas del efecto del tratamiento
Only dichotomous data were reported in this review and we used the numbers of events in the control and intervention groups of each study to calculate Mantel‐Haenszel odds ratios (ORs). We reversed the direction of effect of individual studies, where required, to ensure consistency across trials. We presented 95% confidence intervals (CIs) for all outcomes. We assessed whether the estimates calculated in the review for individual studies were compatible in each case with the estimates reported in the study publications.
Cuestiones relativas a la unidad de análisis
We analysed data per randomised couple or woman, because per‐treatment‐cycle data may lead to biased results (Dias 2008). In the case of a cross‐over trial, we only analysed data prior to cross‐over. For studies where data did not allow analysis (e.g. per‐cycle data) we contacted study authors for per‐woman data. Where we could not obtain appropriate data after contact with authors, we excluded such data (per‐cycle) from meta‐analyses. We counted multiple live births (e.g. twins or triplets) as one live birth event.
Manejo de los datos faltantes
We analysed the data on an intention‐to‐treat basis as far as possible. In the case of missing data we contacted authors of the published trials and included the newly‐obtained data in the analysis. However, where the study authors did not provide additional data, we assumed that no live births occurred in participants without a reported outcome. We assumed that women who dropped out or were excluded after randomisation were not pregnant. Women who were excluded because they conceived before receiving treatment were included as a success in the allocated group in the ITT analysis. For other outcomes, we analysed only the available data.
Evaluación de la heterogeneidad
We considered whether the clinical and methodological characteristics of the included studies were sufficiently similar for meta‐analysis to provide a clinically meaningful summary. We assessed statistical heterogeneity using the I2 statistic. We took an I2 statistic measurement greater than 50% to indicate substantial heterogeneity (Deeks 2017).
Evaluación de los sesgos de notificación
In view of the difficulty of detecting and correcting for publication bias and other reporting biases, we minimised their potential impact by ensuring a comprehensive search for eligible studies and by being alert for duplication of data. Where there were 10 or more studies in an analysis, we had intended to use a funnel plot to explore the possibility of small‐study effects (a tendency for estimates of the intervention effect to be more beneficial in smaller studies) (Sterne 2017).
Síntesis de los datos
Where the studies were sufficiently similar, we combined the data using a fixed‐effect model in the following comparisons:
-
Intra‐uterine insemination (IUI) in a natural cycle versus timed intercourse (TI) or expectant management in a natural cycle;
-
IUI in a stimulated cycle versus TI or expectant management in a stimulated cycle;
-
IUI in a stimulated cycle versus TI or expectant management in a natural cycle;
-
IUI in a natural cycle versus TI or expectant management in a stimulated cycle;
-
IUI in a stimulated cycle versus IUI in a natural cycle.
An increase in the odds of a particular outcome, which may be beneficial (e.g. live birth) or detrimental (e.g. adverse events), was displayed graphically in the meta‐analyses to the right of the centre‐line and a decrease in the odds of an outcome to the left of the centre‐line.
When pre‐cross‐over data were available, we included cross‐over trials in the analysis and pooled them with parallel trials.
Análisis de subgrupos e investigación de la heterogeneidad
Where data were available, we planned to conduct subgroup analyses to determine the separate evidence on the number of treatment cycles for live birth, and methods of ovarian hyperstimulation. However, there were insufficient data to perform subgroup analyses for the number of treatment cycles in any the comparisons, and for methods of ovarian hyperstimulation in some of the comparisons. We therefore did not report the findings by subgroups for any of the comparisons, except where data could not be pooled in meta‐analyses due to the presence of high heterogeneity. Where a visual scan of the forest plots or the results of statistical tests indicated substantial heterogeneity, we explored possible explanations in the text or in subgroup analyses.
Análisis de sensibilidad
Where appropriate, we performed sensitivity analyses for the review's primary outcomes (live birth and multiple pregnancy) to determine whether the results were robust to decisions made during the review process. These analyses considered the effects of excluding the following studies:
-
Studies that did not clearly describe adequate procedures for random sequence generation and allocation concealment;
-
Studies with a unit‐of‐analysis error (such as those in which cross‐over data were analysed as if they derived from parallel studies).
Overall quality of the body of evidence: 'Summary of findings' tables
We prepared 'Summary of findings' tables using GRADEpro software (GRADEpro GDT 2015) and Cochrane methods. These tables evaluate the overall quality of the body of evidence for the review outcomes (live birth, multiple pregnancy, pregnancy, OHSS, miscarriage, ectopic pregnancy) for the main review comparisons:
-
IUI versus TI or expectant management both in a natural cycle;
-
IUI in a stimulated cycle versus TI or expectant management in a stimulated cycle;
-
IUI in a stimulated cycle versus TI or expectant management in a natural cycle;
-
IUI in a natural cycle versus TI or expectant management in a stimulated cycle; and
-
IUI in a stimulated cycle versus IUI in a natural cycle).
We assessed the quality of the evidence using GRADE criteria: risk of bias, consistency of effect, indirectness, imprecision and publication bias (Schünemann 2017). Two review authors working independently made judgements about evidence quality (high, moderate, low or very low), with disagreements resolved by discussion. We justified, documented, and incorporated our judgements into the reporting of results for each outcome.
Results
Description of studies
Results of the search
For the 2020 update, the searches identified 925 records (most of which were also identified during the previous updates) after removal of duplicates. We retrieved three full‐text articles, one of which was eligible for inclusion (Farquhar 2018). Fourteen studies were identified from the previous updates; we therefore include a total of 15 studies (21 references) in the review. See Figure 1 for details of the screening and selection process and Characteristics of included studies for studies included in the review.

Study flow diagram.
We tried to contact all study authors to retrieve unpublished details. Responses from three study authors resulted in the exclusion of the following trials: Nulsen 1993; Prentice 1995; Serhal 1988. Seven study authors (Agarwal 2004; Arici 1994; Bhattacharya 2008; Guzick 1999; Melis 1995; Murdoch 1991; Steures 2006a) provided unpublished information or data, which we used in this analysis. Some authors could not provide us with the requested data, while others did not respond to our requests.
Included studies
Design
We included 15 RCTs. All trials were published in journals (Janko 1998 was published as an abstract only) and were available in English. The trials were carried out in different countries: UK (Bhattacharya 2008; Chung 1995; Murdoch 1991), USA (Arici 1994; Deaton 1990; Guzick 1999), Italy (Arcaini 1996; Melis 1995), the Netherlands (Goverde 2000;Steures 2006a), India (Agarwal 2004), New Zealand (Farquhar 2018), Slovakia (Janko 1998), Sweden (Karlstrom 1993), and multiple European countries (Crosignani 1991).
Twelve were parallel‐group studies (Agarwal 2004; Arcaini 1996; Bhattacharya 2008; Chung 1995; Farquhar 2018; Goverde 2000;Guzick 1999; Janko 1998; Karlstrom 1993; Melis 1995; Murdoch 1991; Steures 2006a), and three were cross‐over studies (Arici 1994; Crosignani 1991; Deaton 1990).
Power calculation
Bhattacharya 2008, Farquhar 2018, Goverde 2000 and Steures 2006a were the only studies which performed a power calculation. All four studies reached the targeted inclusion number to obtain enough power (80% to 90% with 5% level of significance). Further details about the included trials are provided in the Characteristics of included studies table.
Participants
The 15 trials comprised a total of 2068 women with unexplained subfertility.
The ages of the women were mentioned in most trials as either a mean ± standard deviation (SD) or a median and range. One trial (Janko 1998) did not report the women's ages. The overall age reported in the studies was similar. The mean or median age was between 30 years and 34 years (with comparable SDs). The maximum age of the participants was stated in six studies, only one of whom was above the age of 40 years (Arici 1994).
The duration of subfertility was given in 11 trials and reported as a mean duration or range. Five studies only included couples with subfertility for more than at least three years. The overall subfertility duration ranged from one year to 15 years.
Two studies used a prediction score of validated Hunault model (Hunault 2004), including women with a prediction score of natural conception of less than 30% (Farquhar 2018) or between 30% and 40% (Steures 2006a).
Types of subfertility
The definition of unexplained subfertility was similar between studies. Six trials enrolled participants with unexplained subfertility only. Five trials also included participants with male factor subfertility. In those studies the data for unexplained subfertility were either reported separately or obtained from the authors. One study selected couples with unexplained subfertility and an intermediate prognosis (Steures 2006a). Five studies reported the inclusion of women with either surgically‐corrected endometriosis (Deaton 1990), mild or stage II treated endometriosis (Guzick 1999) or minimal/mild endometriosis( Bhattacharya 2008; Farquhar 2018; Karlstrom 1993), which we considered to be unexplained subfertility. Melis 1995 specifically excluded participants if minor disorders such as minimal endometriosis were found in the investigation. Although our protocol stipulated only women with minimal and mild endometriosis, we decided to include Deaton 1990, despite the inclusion of three participants (out of 51 in total) with moderate endometriosis.
All studies reported a thorough fertility investigation, including a laparoscopy. A semen analysis was performed at least once in all studies. In nine studies the semen quality was reported according to the WHO criteria. Two studies (Arcaini 1996; Janko 1998) did not specify the criteria for a normal semen analysis. Chung 1995 used a sperm count per ejaculate instead of per ml. The data in Guzick 1999 were based only on a normal sperm count and a normal motility according to Kruger criteria.
Primary or secondary subfertility
Nine trials contained a mixed population of couples who had never achieved a pregnancy (primary subfertility) and those who had previously been pregnant (secondary subfertility). The remaining trials did not give any description for inclusion of people with secondary subfertility.
Previous treatment
Couples who have previously had failed fertility treatment have a lower probability of conception in subsequent treatment attempts. It is therefore important in fertility trials to report if couples have undergone previous treatment. Of the 15 included studies only two trials included couples who had previously had unsuccessful fertility treatment (Farquhar 2018; Melis 1995). Five trials did not include previously‐treated participants (Agarwal 2004; Arici 1994; Guzick 1999; Karlstrom 1993; Murdoch 1991) and the remaining trials did not provide information about previous treatment.
Interventions
Number of trials included per comparison
-
IUI in a natural cycle versus expectant management in a natural cycle: one trial (Bhattacharya 2008)..
-
IUI in a stimulated cycle versus TI in a stimulated cycle: seven trials (Agarwal 2004; Arcaini 1996; Chung 1995; Crosignani 1991; Janko 1998; Karlstrom 1993; Melis 199
-
IUI in a stimulated cycle versus TI or expectant management in a natural cycle: three trials (Deaton 1990; Farquhar 2018; Steures 2006a).
-
IUI in a natural cycle versus expectant management in a stimulated cycle: one trial (Bhattacharya 2008).
-
IUI in a stimulated cycle versus IUI in natural cycle: four trials (Arici 1994; Goverde 2000; Guzick 1999; Murdoch 1991)
Agarwal 2004, although included in the review, was excluded from the primary analysis. This Indian study had a high dropout percentage (37%) in the treatment group which caused severely unbalanced groups. The main reason for dropout was financial constraints, so this introduces a considerable bias. In three of the included studies (Bhattacharya 2008; Farquhar 2018; Steures 2006a) expectant management was performed instead of TI.
Treatment
The treatment methods varied substantially between studies. Seven studies used gonadotropins for ovarian hyperstimulation. Arcaini 1996 offered both gonadotropins and clomiphene citrate, which resulted in a high‐dose hyperstimulation. Five studies used clomiphene only, one study used clomiphene and letrozole (Farquhar 2018) and Crosignani 1991 did not report the method of ovarian hyperstimulation. The different fertility centres in this multicentre trial used different treatments. More details on drug dose and method can be found in the prognostic factor table (Appendix 7) and the Characteristics of included studies table. Additional gonadotropin‐releasing hormone agonist (GnRHa) was used by Chung 1995 and Murdoch 1991. All studies used human chorionic gonadotropin (hCG) (5000 to 10,000 IU) for triggering ovulation. Chung 1995 also provided hCG in the post‐ovulatory phase.
The timing of IUI was similar among the studies. Follicle development was usually monitored by ultrasound scan (USS) and serum estradiol levels (serum‐E2). The hCG was given when the dominant follicles reached a mean diameter of 16 mm to 18 mm. Insemination was performed 30 hours to 48 hours after hCG administration. Arcaini 1996 performed a double insemination at 24 and 48 hours, and in Murdoch 1991 insemination took place on alternate days until ovulation was confirmed. Follicular development in natural cycles was monitored by ultrasound or luteinising hormone (LH) urine tests, and intercourse was advised at 12 hours to 40 hours after the hCG or LH surge. Couples were mostly advised to have intercourse more than once.
In the studies with expectant management instead of TI (Bhattacharya 2008; Farquhar 2018; Steures 2006a), couples were given general advice about the need for regular intercourse.
The number of cycles in included studies ranged from one to eight.
Cancellation criteria
The most serious adverse effects of ovarian hyperstimulation are multiple pregnancies and ovarian hyperstimulation syndrome (OHSS). These risks can both be reduced by the cancellation of the treatment cycle if excessive follicle stimulation occurs. It is important that fertility trials report the cancellation criteria they applied. Firstly, this ensures that participants were not exposed to a higher risk of multiple pregnancy or OHSS to increase the pregnancy rate, and secondly, it reduces the bias introduced by cancellation of treatment in initially randomised groups.
Eleven studies described criteria for cancellation of the treatment cycle. Insemination or hCG administration did not take place if the cancellation criteria were met. Six studies used serum‐E2 levels to determine over‐ or under‐stimulation as well as a maximum of dominant follicles (four follicles of a maximum 16 mm diameter). Arcaini 1996 accepted a maximum of six dominant follicles. Four studies did not describe any cancellation criteria.
Outcomes
Ten trials reported live birth, our primary outcome of interest. The other studies reported pregnancy as the main outcome. Pregnancy was confirmed by ultrasound in nine trials. In Guzick 1999 pregnancy was confirmed by two hCG measurements or live birth. Others did not report the method of pregnancy confirmation. The reported pregnancies were mostly clinical. The multiple pregnancy rate was mentioned in 13 trials, miscarriage in 11, ectopic pregnancy in 11, and OHSS in 10 trials. These events were often reported as total numbers or as post‐cross‐over data and therefore often could not be used in the meta‐analysis.
Excluded studies
For the 2020 update, we excluded two studies in addition to those previously excluded. One was excluded because it was a prospective cohort study (Van Eekelen 2019) while the other study (Zolghadri 2012) was excluded because it included a mix of women with unexplained infertility and polycystic ovarian syndrome, with no separate data for the two groups. We contacted the study authors for data on women with unexplained infertility but we did not receive any response. We had excluded 23 studies during the previous updates (see details below); we therefore excluded a total of 25 studies from this review update. See Characteristics of excluded studies.
For the 2016 update, 10 studies were excluded (Aanesen 2014; Check 2013; Barros Delgadillo 2008; Barros‐Delgadillo 2010; Kabouk 2010; Leanza 2014a; Leanza 2014b; Peeraer 2013; Wadhwa 2013; Xu 2014). Four studies were not RCTs (Check 2013; Barros Delgadillo 2008; Leanza 2014a; Leanza 2014b), four studies did not include a comparison of interest to this review (Barros‐Delgadillo 2010; Kabouk 2010; Peeraer 2013; Wadhwa 2013), one study was a cohort study (Aanesen 2014) and another study was ineligible as it investigated donor sperm (Xu 2014).
For the 2012 update, 13 studies were excluded (Aboulghar 1993; Doyle 1991; Evans 1991; Gregoriou 1995; Ho 1998; Kirby 1991; Martinez 1990; Martinez 1991; Nulsen 1993; Prentice 1995; Serhal 1988; Tummon 1997; Zikopoulos 1993). Two studies were found not to be randomised studies (Aboulghar 1993; Serhal 1988); inadequate method of randomisation was the reason for exclusion of another two trials (Nulsen 1993; Prentice 1995); one study (Tummon 1997) included women with endometriosis only and thus did not focus on unexplained subfertility; Martinez 1990 reported biochemically‐confirmed pregnancies only and was therefore excluded; Ho 1998 did not report separate data for couples with unexplained subfertility; six studies (Doyle 1991; Evans 1991; Gregoriou 1995; Kirby 1991; Martinez 1991; Zikopoulos 1993) reported pre‐ or post‐cross‐over 'per‐cycle' only, instead of 'per randomised woman', and therefore could not be included. We contacted authors of these studies to obtain relevant data such as pre‐cross‐over 'per randomised woman' data but we did not receive any response from the authors.
Studies awaiting classification
There are no studies awaiting classification. However if pre‐cross‐over data of the excluded studies become available we will reconsider inclusion and report the studies in an update of this review.
Ongoing studies
We identified one study which was ongoing and appeared to meet the inclusion criteria (NCT03455426).
Risk of bias in included studies
See the ’Risk of bias’ graph (Figure 2) and ’Risk of bias’ summary (Figure 3).

Risk of bias graph: review authors' judgements about each risk of bias item presented as percentages across all included studies.

Risk of bias summary: review authors' judgements about each risk of bias item for each included study.
Allocation
In nine of the included studies (Agarwal 2004; Arici 1994; Bhattacharya 2008; Chung 1995; Farquhar 2018; Goverde 2000; Melis 1995; Murdoch 1991; Steures 2006a), we considered the methods used for sequence generation and allocation concealment to be adequate and we therefore rated them as being at low risk of bias. In the remaining six trials (Arcaini 1996; Crosignani 1991; Deaton 1990; Guzick 1999; Janko 1998; Karlstrom 1993), the methods used for random sequence generation and allocation concealment were not sufficiently described to draw a conclusive judgement, so we rated the risk of bias as unclear.
Blinding
We assessed all the included studies as being at unclear risk for performance bias, as none of them reported blinding due to the nature of the interventions. For detection bias, we rated all the included studies as being at low risk; we considered that non‐blinding was unlikely to affect the outcomes of interest, as they were objectively assessed.
Incomplete outcome data
We used an intention‐to‐treat (ITT) analysis when possible. In three trials an ITT analysis was not possible (Crosignani 1991; Deaton 1990; Karlstrom 1993), as the trials only reported the number of participants analysed.
In Murdoch 1991 one woman became pregnant spontaneously between treatment cycles. This pregnancy resulted in a live birth and was entered as such in the analysis. Goverde 2000 also reported spontaneous pregnancies that occurred between treatment cycles. Because it was unclear in which group these pregnancies occurred, we could not use them in the ITT analysis.
Seven of the 15 included trials clearly mentioned the number of dropouts and the reasons for dropping out (Arici 1994; Deaton 1990; Farquhar 2018; Goverde 2000; Guzick 1999; Melis 1995; Steures 2006a). Murdoch 1991 reported the number of dropouts but did not give any information on reasons for dropping out. Bhattacharya 2008 had a dropout rate of less than 1%. The studies with the highest dropout rates were Arcaini 1996 (dropout of 20.6%) and Agarwal 2004 (19%). In Agarwal the couples mainly left the study for financial reasons, which resulted in an unevenly‐distributed dropout rate of 37% in the treatment group as compared to 1% in the control group. The dropout rate usually increased in studies with a longer follow‐up period. Because this review included trials with different durations, it was difficult to compare the dropout rates. We rated nine of the included studies as being at low risk of bias, three as unclear and another three as high risk of bias.
Selective reporting
There was a risk of selective reporting in some of the studies included in this review. Live birth data were not reported in five studies (Arcaini 1996; Crosignani 1991; Deaton 1990; Janko 1998; Karlstrom 1993). Adverse events were often not reported by group but as a study total, which could not be included in the analysis. Multiple pregnancy rates were not reported in two trials (Crosignani 1991; Janko 1998). We rated nine of the included studies as being at low risk of bias, five as being at unclear risk and one as being at high risk. We did not construct a funnel plot for any of the analyses, as none of them included up to 10 studies.
Other potential sources of bias
To reduce bias introduced by a cross‐over study design, we included pre‐cross‐over data only. Three studies used a cross‐over design (Arici 1994; Crosignani 1991; Deaton 1990). In this design participants were initially randomised to the treatment or control group but then crossed over to the other group after a certain number of treatment cycles. The duration of these studies varied from two to eight treatment cycles per couple. In two studies (Arici 1994; Crosignani 1991) the participants crossed over after one treatment cycle. In Deaton 1990 participants crossed over after four cycles.
We rated nine of the included studies as being at low risk of bias because baseline demographic characteristics of participants between the two treatment groups were similar. We rated the remaining six studies at unclear risk for this domain because there was insufficient information to make a conclusive judgement on the baseline demographic characteristics of participants.
Effects of interventions
See: Summary of findings for the main comparison IUI in a natural cycle compared to TI or expectant management in a natural cycle for unexplained subfertility; Summary of findings 2 IUI in a stimulated cycle compared to TI or expectant management in a stimulated cycle for unexplained subfertility; Summary of findings 3 IUI in a stimulated cycle compared to TI or expectant management in a natural cycle for unexplained subfertility; Summary of findings 4 IUI in a natural cycle compared to TI or expectant management in a stimulated cycle for unexplained subfertility; Summary of findings 5 IUI in a stimulated cycle compared to IUI in a natural cycle for unexplained subfertility
This section describes the results of the meta‐analyses and sensitivity analyses.
Comparison 1. IUI in a natural cycle versus timed intercourse (TI) or expectant management in a natural cycle
The results from this comparison were all obtained from Bhattacharya 2008. Data for the unexplained subfertility group only were provided by the trial author.
1.1 Live birth rate per couple (all cycles)
Analysis 1.1
It is uncertain whether treatment with IUI in a natural cycle results in a higher cumulative live birth rate compared to treatment with expectant management in a natural cycle (OR 1.60, 95% CI 0.92 to 2.78; 1 RCT, 334 women; low‐quality evidence). The evidence suggests that if we assume the chance of a live birth using expectant management to be 16%, that of IUI would be between 15% and 34%.
1.2 Multiple pregnancy rate per couple
It is uncertain whether treatment with IUI in a natural cycle results in a lower multiple pregnancy rate compared to treatment with expectant management in a natural cycle (OR 0.50, 95% CI 0.04 to 5.53; 1 RCT, 334 women; low‐quality evidence). The evidence suggests that if we assume the risk of a multiple pregnancy using expectant management to be 1%, the risk using IUI would be between 0% and 6%.
We did not perform sensitivity analyses as only one trial with low risk of selection bas was included in the analysis for both primary outcomes.
1.3 Pregnancy rate per couple (all cycles)
Analysis 1.3
Compared to expectant management in a natural cycle, it is uncertain whether treatment with IUI in a natural cycle results in a higher cumulative pregnancy rate (OR 1.53, 95% CI 0.88 to 2.64; 1 RCT, 334 women; low‐quality evidence). The evidence suggests that if we assume the chance of a pregnancy using expectant management to be 16%, that of IUI would be between 15% and 34%.
Other adverse events
Moderate or severe ovarian hyperstimulation syndrome rate per woman
Data on OHSS were not reported.
1.4 Miscarriage rate per couple
It is uncertain whether treatment with IUI in a natural cycle results in a lower miscarriage rate compared to treatment with expectant management in a natural cycle. Sixteen miscarriages were reported in a total of 334 couples, seven in the IUI group and nine in the expectant management group (OR 0.77, 95% CI 0.28 to 2.11; 1 RCT, 334 women; low‐quality evidence). The evidence suggests that if we assume the risk of a miscarriage using expectant management to be 5%, that of IUI would be between 2% and 11%.
1.5 Ectopic pregnancy rate per couple
Analysis 1.5
Compared to expectant management in a natural cycle, it is uncertain whether treatment with IUI in a natural cycle results in a lower ectopic pregnancy rate. Two ectopic pregnancies were reported in a total of 334 couples, with both occurring in the IUI group (OR 5.06, 95% CI 0.24 to 106.21; 1 RCT, 334 women; low‐quality evidence).
Comparison 2. IUI in a stimulated cycle versus TI or expectant management in a stimulated cycle
2.1 Live birth rate per couple (all cycles)
Analysis 2.1
Only two of the six trials included in the analysis reported live birth rates (Chung 1995; Melis 1995). It is uncertain whether treatment with IUI in a stimulated cycle results in a higher cumulative live birth rate compared to treatment with TI in a stimulated cycle (OR 1.59, 95% CI 0.88 to 2.88; 2 RCTs, 208 women; I2 = 72%; low‐quality evidence). The evidence suggests that if we assume the chance of a live birth using TI to be 26%, that of IUI would be between 23% and 50%. Statistical heterogeneity was detected (P = 0.06, I2 = 72%) between the two studies, with inconsistency in the directions of effect estimates. This may be explained by the fact that all participants in Melis 1995 had previously received fertility treatment.
We did not perform sensitivity analysis excluding studies at unclear or high selection bias as both trials were at low risk of selection bias
2.2 Multiple pregnancy rate per couple
Analysis 2.2
Four studies reported their multiple pregnancies per treatment arm (Arcaini 1996; Chung 1995; Karlstrom 1993; Melis 1995), with a total of 17 multiple pregnancies in 316 couples. Arcaini 1996, Chung 1995 and Karlstrom 1993 reported one high‐order multiple pregnancy each. The studies reported 11 multiple pregnancies in the IUI group and six in the TI group (representing 13.5% of the total number of pregnancies in these studies). Pooling the data from these studies showed that it is uncertain whether treatment with IUI in a stimulated cycle results in a lower multiple pregnancy rate compared to treatment with TI in a stimulated cycle (OR 1.46, 95% CI 0.55 to 3.87; 4 RCTs, 316 women; I2 = 0%; low‐quality evidence). The evidence suggests that if we assume the risk of a multiple pregnancy using TI to be 4%, the risk using IUI would be between 2% and 15%.
2.3 Pregnancy rate per couple (all cycles)
Analysis 2.3
Six trials reported pregnancy rates per couple. There were 517 women included in this analysis, reporting 149 cumulative pregnancies. The result showed that treatment with IUI in a stimulated cycle may result in a higher cumulative pregnancy rate compared to treatment with TI in a stimulated cycle (OR 1.69, 95% CI 1.14 to 2.53; 6 RCTs, 517 women; I2 = 8%; low‐quality evidence). This suggests that if we assume the chance of a pregnancy with TI to be 23%, the chance of a pregnancy in women using IUI would be between 26% and 44%.
Other adverse events
2.4 Moderate to severe ovarian hyperstimulation syndrome rate per woman
Analysis 2.4
One case of OHSS was reported in 36 couples who were treated with IUI, while none was reported in 32 couples who received TI. It is, however, uncertain whether treatment with IUI in a stimulated cycle results in a lower OHSS rate compared to treatment with TI in a stimulated cycle (OR 2.75, 95% CI 0.11 to 69.83; 1 RCT, 68 women; very low‐quality evidence).
2.5 Miscarriage rate per couple
Analysis 2.5
Twenty‐seven miscarriages were reported in total. Fifteen were reported by treatment arm, nine in the IUI group and six in the TI group. It is uncertain whether treatment with IUI in a stimulated cycle results in a lower miscarriage rate compared to treatment with TI in a stimulated cycle (OR 1.66, 95% CI 0.56 to 4.88; I2 = 0%; 2 RCTs, 208 women; low‐quality evidence). The evidence suggests that if we assume the risk of miscarriage using TI to be 6%, the risk using IUI would be between 3% and 23%.
2.6 Ectopic pregnancy rate per couple
Analysis 2.6
One case of ectopic pregnancy, occurring in the IUI group, was reported by one study of 100 couples. It is, however, uncertain whether treatment with IUI in a stimulated cycle results in a higher ectopic pregnancy rate compared to treatment with TI in a stimulated cycle (OR 3.06, 95% CI 0.12 to 76.95; 1 RCT, 100 women; low‐quality evidence).
Comparison 3. IUI in a stimulated cycle versus TI or expectant management in a natural cycle
3.1 Live birth rate per couple (all cycles)
Analysis 3.1; Figure 4
Data on this outcome were reported by two studies (Farquhar 2018; Steures 2006a). We did not pool data from the two studies, because of extreme statistical heterogeneity (I2 = 91%). The presence of extreme heterogeneity could be due to the use of different population groups and OH drugs by the two studies: Farquhar 2018 investigated women with a low chance of natural conception (prediction score of natural conception less than 30%) using clomiphene citrate or letrozole, while Steures 2006a included couples with an intermediate chance of spontaneous conception (prediction score of natural conception between 30% and 40%), using clomiphene citrate or gonadotropins.

Forest plot of comparison 3: IUI in stimulated cycle versus TI or expectant management in natural cycle; outcome 3.1 Live birth rate per couple.
3.1.1 Clomiphene citrate or letrozole (Farquhar 2018)
In couples with a low prediction score of natural conception, treatment with IUI in a stimulated cycle probably results in a higher cumulative live birth rate compared to treatment with expectant management in a natural cycle (OR 4.48, 95% CI 2.00 to 10.01; 1 RCT; 201 women; moderate‐quality evidence). The evidence suggests that if we assume the chance of a live birth with expectant management in a natural cycle to be 9%, the chance of a live birth with IUI in a stimulated cycle would be between 17% and 50%.
3.1.2 Clomiphene citrate or gonadotropins (Steures 2006a)
It is uncertain whether treatment with IUI in a stimulated cycle results in a higher cumulative live birth rate compared to treatment with expectant management in a natural cycle (OR 0.82, 95% CI 0.45 to 1.49; 1 RCT, 253 women; low‐quality evidence). The evidence suggests that if we assume the chance of a live birth with expectant management in a natural cycle to be 24%, the chance of a live birth with IUI in a stimulated cycle would be between 12% and 32%.
3.2 Multiple pregnancy rate per couple
Data on this outcome were reported by Farquhar 2018 and Steures 2006a. It is uncertain whether treatment with IUI in a stimulated cycle results in a lower multiple pregnancy rate compared to treatment with expectant management in a natural cycle (OR 3.01, 95% CI 0.47 to 19.28; 2 RCTs, 454 women; I2 = 0%; low‐quality evidence). The evidence suggests that if we assume the risk of a multiple pregnancy with expectant management in a natural cycle to be 0%, the risk of a multiple pregnancy with IUI in a stimulated cycle would be between 0% and 8%.
We did not perform sensitivity analyses excluding studies at unclear or high selection bias, as both trials were at low risk of selection bias for the primary outcomes.
3.3 Pregnancy rate per couple (all cycles)
Data on this outcome were reported by three studies (Deaton 1990; Farquhar 2018; Steures 2006a). We did not pool data from the three studies, because of extreme statistical heterogeneity (I2 = 86%). The presence of significant heterogeneity might be due to the use of different population groups and OH drugs by the three studies: Deaton 1990 investigated women with mild or moderate endometriosis, using clomiphene citrate only; Farquhar 2018 investigated women with a low chance of spontaneous conception (prediction score of natural conception less than 30%), using clomiphene citrate or letrozole; Steures 2006a included couples with an intermediate chance of spontaneous conception (prediction score of natural conception between 30% and 40%). using clomiphene citrate or gonadotropins.
3.3.1 Clomiphene citrate only (Deaton 1990)
It is uncertain whether treatment with IUI in a stimulated cycle results in a higher cumulative pregnancy rate compared to treatment with TI in a natural cycle (OR 3.20, 95% CI 0.82 to 12.50; 1 RCT, 51 women; low‐quality evidence).
3.3.2 Clomiphene citrate or letrozole (Farquhar 2018)
Treatment with IUI in a stimulated cycle probably results in a higher cumulative pregnancy rate compared to treatment with expectant management in a natural cycle (OR 4.68, 95% CI 2.22 to 9.86; 1 RCT, 201 women; moderate‐quality evidence). The evidence suggests that if we assume the chance of a pregnancy with expectant management in a natural cycle to be 11%, the chance of a pregnancy with IUI in a stimulated cycle would be between 22% and 55%.
3.3.3 Clomiphene citrate or gonadotropins (Steures 2006a)
It is uncertain whether treatment with IUI in a stimulated cycle results in a higher cumulative pregnancy rate compared to treatment with expectant management in a natural cycle (OR 0.80, 95% CI 0.45 to 1.42; 1 RCT, 253 women, low‐quality evidence).
Other adverse events
Moderate or severe ovarian hyperstimulation syndrome rate per woman
Two studies (Deaton 1990; Farquhar 2018) reported on OHSS in this comparison; there were no cases of OHSS in either study.
3.4 Miscarriage rate per couple
Data on this outcome were reported by Farquhar 2018 and Steures 2006a. Treatment with IUI in a stimulated cycle probably results in a higher miscarriage rate compared to treatment with expectant management in a natural cycle (OR 2.87, 95% CI 1.18 to 7.01; 2 RCTs, 454 women; I2 = 0%; moderate‐quality evidence). The evidence suggests that if we assume the risk of miscarriage with expectant management in a natural cycle to be 3%, the risk of miscarriage with IUI in a stimulated cycle would be between 4% and 18%.
3.5 Ectopic pregnancy rate per couple
Data on this outcome were reported only by Farquhar 2018. It is uncertain whether treatment with IUI in a stimulated cycle results in a lower ectopic pregnancy rate compared to treatment with expectant management in a natural cycle (OR 9.28, 95% CI 0.49 to 174.60; 1 RCT, 201 women; low‐quality evidence)
Comparison 4. IUI in a natural cycle versus TI or expectant management in a stimulated cycle
Bhattacharya 2008 studied this comparison with IUI in a natural cycle compared to TI in a clomiphene citrate‐stimulated cycle.
4.1 Live birth rate per couple (all cycles)
Treatment with IUI in a natural cycle probably results in a higher cumulative live birth rate compared to expectant management in a stimulated cycle (OR 1.95, 95% CI 1.10 to 3.44; 1 RCT, 342 women: moderate‐quality evidence). The evidence suggests that if we assume the chance of a live birth with expectant management in a stimulated cycle to be 13%, the chance of a live birth with IUI in a natural cycle would be between 14% and 34%.
4.2 Multiple pregnancy per couple
It is uncertain whether treatment with IUI in a natural cycle results in a lower multiple pregnancy rate compared to treatment with expectant management in a stimulated cycle (OR 1.05, 95% CI 0.07 to 16.90; 1 RCT, 342 women; low‐quality evidence). The evidence suggests that if we assume the risk of a multiple pregnancy in expectant management in a stimulated cycle to be 1%, the risk of a multiple pregnancy with IUI in a natural cycle would be between 0% and 9%.
We did not perform sensitivity analysis for the main outcomes, as we included only one study with low risk of selection bias in this comparison.
4.3 Pregnancy rate per couple (all cycles)
Treatment with IUI in a natural cycle probably results in a higher cumulative pregnancy rate compared to treatment with expectant management in a stimulated cycle (OR 1.77, 95% CI 1.01 to 3.08; 1 RCT, 342 women; moderate‐quality evidence). The evidence suggests that if we assume the chance of a pregnancy with expectant management in a stimulated cycle to be 14%, the chance of a pregnancy with IUI in a natural cycle would be between 14% and 34%.
Other adverse events
Moderate or severe ovarian hyperstimulation syndrome rate per woman
OHSS was not reported.
4.4 Miscarriage rate per couple
Analysis 4.4
It is uncertain whether treatment with IUI in a natural cycle results in a lower miscarriage rate compared to treatment with expectant management in a stimulated cycle (OR 0.91, 95% CI 0.32 to 2.58; 1 RCT, 342 women; low‐quality evidence). The evidence suggests that if we assume the risk of a miscarriage with expectant management in a stimulated cycle to be 5%, the risk of a miscarriage with IUI in a natural cycle would be between 2% and 11%.
4.5 Ectopic pregnancy
Analysis 4.5
Although two ectopic pregnancies occurred in the IUI group, it is uncertain whether treatment with IUI in a natural cycle results in a lower ectopic pregnancy rate compared to treatment with expectant management in a stimulated cycle (OR 5.30, 95% CI 0.25 to 111.26; 1 RCT, 342 women; low‐quality evidence).
Comparison 5. IUI in a stimulated cycle versus IUI in a natural cycle
5.1 Live birth rate per couple (all cycles)
Analysis 5.1
Three trials reported the number of live births per treatment arm (Arici 1994; Goverde 2000; Murdoch 1991). We obtained the live birth data from Guzick 1999 after contacting the study authors. Treatement with IUI in a stimulated cycle may result in a higher cumulative live birth rate compared to treatment with IUI in a natural cycle (OR 2.07, 95% CI 1.22 to 3.50; I2 = 0%; 4 RCTs, 396 women; low‐quality evidence). The evidence suggests that if we assume the chance of a live birth with IUI in a natural cycle to be 14%, the chance of a live birth with IUI in a stimulated cycle would be between 17% and 36%. In a sensitivity analysis, we obtained a similar result by excluding Arici 1994, a cross‐over trial (OR 2.02, 95% CI 1.18 to 3.45; I2 = 0%; 3 RCTs, 370 women); however, it is uncertain whether treatment with IUI in a stimulated cycle results in a higher cumulative live birth rate compared to treatment with IUI in a natural cycle when we excluded Guzick 1999, a study with unclear risk of bias for random sequence generation and allocation concealment (OR 1.69, 95% CI 0.83 to 3.44; I2 = 0%; 3 RCTs, 185 women).
5.2 Multiple pregnancy rate per couple
Analysis 5.2
It is uncertain whether treatment with IUI in a stimulated cycle results in a higher multiple pregnancy rate compared to treatment with IUI in a natural cycle (OR 3.00, 95% CI 0.11 to 78.27; 1 RCT, 39; women; low‐quality evidence) (Figure 5).

Forest plot of comparison 5: IUI in stimulated cycle versus IUI in a natural cycle; outcome 5.2 Multiple pregnancy rate per couple.
5.3 Pregnancy rate per couple (all cycles)
Analysis 5.3
It is uncertain whether treatment with IUI in a stimulated cycle results in a higher cumulative pregnancy rate compared to treatment with IUI in a natural cycle (OR 6.43, 95% CI 0.56 to 73.35; 1 RCT, 26 women; low‐quality evidence). The evidence suggests that if we assume the chance of a pregnancy with IUI in a natural cycle to be 6%, the chance of a pregnancy with IUI in a stimulated cycle would be between 4% and 83%.
Other adverse events
Moderate or severe ovarian hyperstimulation syndrome rate per woman
There were no reported cases of OHSS.
5.4 Miscarriage rate per couple
One miscarriage in the stimulated group was reported by Arici 1994. Guzick 1999 reported a total miscarriage rate of approximately 24% in all couples undergoing IUI treatment. It is uncertain whether treatment with IUI in a stimulated cycle results in a higher miscarriage rate compared to treatment with IUI in a natural cycle (OR 5.21, 95% CI 0.19 to 141.08; 1 RCT, 26 women; low‐quality evidence).
5.5 Ectopic pregnancy rate per couple
Analysis 5.5
It is uncertain whether treatment with IUI in a stimulated cycle results in a higher ectopic pregnancy rate compared to treatment with IUI in a natural cycle (OR 6.48, 95% CI 0.33 to 127.09; 1 RCTs, 211 women; very low‐quality evidence).
Discusión
Resumen de los resultados principales
Esta es una actualización de una revisión Cochrane que evaluó si la tasa de nacidos vivos mejora con la inseminación intrauterina (IIU), con o sin hiperestimulación ovárica (HEO), en comparación con el coito programado (CP) o el manejo expectante con o sin HEO, o con IIU e HEO en comparación con la IIU en un ciclo natural, para las parejas con subfertilidad idiopática. Quince estudios cumplieron con los criterios de elegibilidad para la inclusión; investigaron diferentes modalidades de tratamiento con IIU en cinco comparaciones que incluían a 2068 mujeres. Los resultados primarios informados fueron las tasas acumulativas de nacidos vivos y las tasas de embarazos múltiples. Los resultados secundarios informados fueron las tasas acumulativas de embarazos y otros eventos adversos, incluidas las tasas de síndrome de hiperestimulación ovárica (SHEO) moderado a grave, las tasas de abortos espontáneos y las tasas de embarazos ectópicos. Las cinco comparaciones identificadas en los estudios incluidos se clasifican en dos grandes grupos, como se indica a continuación:
1. IIU con o sin HEO versus CP o manejo expectante con o sin HEO
Se identificaron cuatro comparaciones en este grupo:
-
IIU en un ciclo natural versus CP o manejo expectante en un ciclo natural;
-
IIU en un ciclo estimulado versus CP o manejo expectante en un ciclo estimulado;
-
IIU en un ciclo estimulado versus CP o manejo expectante en un ciclo natural; y
-
IIU en un ciclo natural versus CP o manejo expectante en un ciclo estimulado.
En el caso de los nacidos vivos, no se conoce con certeza si el tratamiento con IIU en un ciclo natural da lugar a una mayor tasa acumulativa de nacidos vivos en comparación con el manejo expectante en un ciclo natural. Se obtuvo un resultado similar con el tratamiento con IIU en un ciclo estimulado comparado con el CP en un ciclo estimulado. Sin embargo, hay evidencia de calidad moderada de que el tratamiento con IIU en un ciclo estimulado probablemente da lugar a una mayor tasa acumulativa de nacidos vivos en comparación con el manejo expectante en un ciclo natural en parejas con una puntuación baja de predicción de la concepción natural. La evidencia indica que si se supone que la probabilidad de un nacido vivo con el manejo expectante en un ciclo natural es del 9%, la probabilidad de un nacido vivo con la IIU en un ciclo estimulado estaría entre el 17% y el 50%. De manera similar, hay evidencia de calidad moderada de que el tratamiento con IIU en un ciclo natural probablemente da lugar a una tasa acumulativa de nacidos vivos más alta, en comparación con el manejo expectante en un ciclo estimulado. La evidencia indica que si se supone que la probabilidad de un nacido vivo con el manejo expectante en un ciclo estimulado es del 13%, la probabilidad de un nacido vivo con la IIU en un ciclo natural estaría entre el 14% y el 34%.
En el caso del embarazo múltiple, no se conoce con certeza si el tratamiento con IIU con o sin HEO da como resultado tasas de embarazos múltiples más bajas, en comparación con el tratamiento con CP o el manejo expectante, con o sin HEO. En cuanto a otros eventos adversos como las tasas de SHEO, las tasas de abortos espontáneos y las tasas de embarazos ectópicos, no hubo datos suficientes para evaluar de forma adecuada el impacto de estas modalidades de tratamiento; los datos sobre estos resultados no se informaron o se informaron en estudios únicos con muestras de tamaño pequeño.
2. IIU en un ciclo estimulado versus IIU en un ciclo natural
En el caso de los nacidos vivos, hay evidencia de calidad baja de que el tratamiento con IIU en un ciclo estimulado puede dar lugar a una tasa acumulativa mayor de nacidos vivos, en comparación con el tratamiento con IIU en un ciclo natural. La evidencia indica que si se supone que la probabilidad de un nacido vivo con la IIU en un ciclo natural es del 14%, la probabilidad de un nacido vivo con la IIU en un ciclo estimulado estaría entre el 17% y el 36%. La solidez de este hallazgo se probó en un análisis de sensibilidad con la exclusión de un estudio con un riesgo de sesgo incierto para la generación de la secuencia aleatoria y el ocultamiento de la asignación; el resultado mostró que sin este ensayo probablemente había poca o ninguna diferencia en las tasas de nacidos vivos entre los dos grupos de tratamiento.
En el caso de los embarazos múltiples, no se conoce con certeza si el tratamiento con IIU en un ciclo estimulado da lugar a una tasa de embarazos múltiples más baja, en comparación con el tratamiento con IIU en un ciclo natural. En cuanto a otros eventos adversos como las tasas de SHEO, las tasas de abortos espontáneos y las tasas de embarazos ectópicos, no hubo datos suficientes para evaluar de forma adecuada la repercusión de esta modalidad de tratamiento; la mayor parte de los datos sobre estos resultados se informaron en estudios individuales con muestras de tamaño pequeño.
Compleción y aplicabilidad general de las pruebas
La mayoría de las comparaciones identificadas en esta revisión se investigaron en ensayos individuales, lo que dificulta la combinación de los datos en los metanálisis. Cuando fue posible agrupar los datos en metanálisis, habitualmente las estimaciones del efecto global tuvieron intervalos de confianza amplios debido a los tamaños pequeños de las muestras, con números reducidos de eventos. Además, no fue posible evaluar todos los resultados estipulados para cada comparación. No hubo datos disponibles suficientes para evaluar de forma adecuada los efectos de las diversas intervenciones en los nacidos vivos, los embarazos múltiples y otros eventos adversos. Muchos estudios no se incluyeron en la revisión debido a que solo informaron datos por ciclo. Una de las áreas de especial preocupación en los ensayos de fertilidad es lo que los estadísticos llaman el error de la «unidad de análisis» (Vail 2003). Es metodológicamente incorrecto informar los datos por ciclo cuando son las mujeres o las parejas las que son asignadas al azar, debido a que muchas de las mujeres habrían sido sometidas a más de un ciclo de tratamiento (Dias 2008; Johnson 2003; Vail 2003). Sin embargo, la tasa de embarazos por ciclo es un resultado que se informa de manera habitual en los ensayos y las revisiones de fertilidad. Tampoco fue posible incluir muchos estudios con un diseño cruzado en la revisión debido a que no informaron sobre los datos previos al cruzamiento. No fue posible incluir los datos posteriores al cruzamiento debido a que las parejas habrían recibido ambas modalidades de tratamiento. Se ha debatido mucho sobre si un diseño cruzado es apropiado para los ensayos de fertilidad, principalmente debido a que los participantes abandonan el tratamiento después del éxito del mismo, lo que da lugar a una población seleccionada de participantes después del cruzamiento. Por esta razón, se ha indicado que el diseño cruzado no tiene cabida en los ensayos de infertilidad (Daya 1993). Un diseño cruzado podría dar lugar a una sobrestimación del efecto del tratamiento (Khan 1996; Norman 2000). Aún es objeto de debate si esta sobreestimación se podría corregir estadísticamente, o si es clínicamente pertinente (Cohlen 1998; McDonnell 2004; Vail 2003).
A menudo no se mencionaron los eventos adversos, o se mencionaron por grupo en lugar de por modalidad de tratamiento. En los meta‐análisis se incluyeron estudios que mencionaron «ningún evento», lo que podría dar lugar a una subestimación de los eventos adversos. Por otra parte, estos eventos adversos se atribuyen principalmente a la HEO y no a la IIU. Por lo tanto, parece poco probable que se encuentre una diferencia significativa en los eventos adversos cuando se compara la HEO con CP versus HEO con IIU. No fue posible determinar la evidencia por separado para el número de ciclos de tratamiento y los métodos de hiperestimulación ovárica, debido a que los datos fueron insuficientes. Además, no se examinaron los efectos de factores pronósticos importantes como la edad, la duración de la subfertilidad y el tratamiento anterior en los análisis de subgrupos, aunque si se hubiera tomado la decisión de hacerlo, no habría habido datos suficientes para realizar estos análisis. Por lo tanto, no está claro en qué medida algunos de los resultados que muestran evidencia de una diferencia entre los grupos de intervención son aplicables a parejas con diferentes pronósticos y fecundidad inicial.
En los estudios más recientes se adoptó el manejo expectante como el tratamiento de control para la IIU, en lugar del coito programado (Bhattacharya 2008; Farquhar 2018; Steures 2006a). Debido a que el momento adecuado del coito (CP) interfiere con los hábitos naturales del coito de una pareja, se ha propuesto el manejo expectante como el tratamiento de comparación más apropiado para la IIU (Wilcox 1995). Sin embargo, un metanálisis reciente no muestra diferencias significativas en la tasa de embarazos entre los estudios que comparan la IIU versus el CP y los estudios de la IIU versus manejo expectante (Snick 2008). Aún no está claro si es apropiado agrupar en un metanálisis los estudios que incluyen el CP y el manejo expectante. Sin embargo, los datos de Bhattacharya 2008; Farquhar 2018 y Steures 2006a no se agruparon con los datos de los ensayos que aplicaron el CP debido a que estos ensayos incluyeron comparaciones que no fueron el tema de muchos otros ensayos.
Calidad de la evidencia
La mayoría de los estudios incluidos en esta revisión fueron de calidad moderadamente buena en relación con el riesgo de sesgo. Se excluyeron los estudios con un diseño cruzado que no informaron los datos previos al cruzamiento. La mayoría de los estudios incluidos describieron claramente sus métodos de generación de la secuencia y ocultación de la asignación. Ninguno de los estudios incluidos informó sobre el cegamiento debido a la naturaleza de las intervenciones; sin embargo, es posible que la falta de cegamiento no tenga efecto sobre los resultados de interés, ya que se evaluaron de una manera objetiva. En la mayoría de las comparaciones, las estimaciones de los efectos se asociaron con imprecisión debido a los tamaños pequeños de las muestras y a los intervalos de confianza amplios. Se evaluó la calidad de la evidencia para las cinco comparaciones de la revisión; para los resultados primarios (tasa acumulativa de nacidos vivos y embarazos múltiples) la calidad de la evidencia varió de baja a moderada. Las limitaciones principales del conjunto de evidencia fueron la imprecisión muy grave debido a los tamaños pequeños de las muestras, con tasas bajas de eventos y estimaciones del efecto con intervalos de confianza amplios, así como el informe inadecuado de los eventos adversos. No fue posible examinar la presencia de sesgo de publicación o de informe en los gráficos en embudo para ninguna de las comparaciones, ya que ninguno de los análisis incluyó diez estudios o más. Por lo tanto, la calidad de la evidencia no se disminuyó debido al sesgo de publicación.
Sesgos potenciales en el proceso de revisión
Para prevenir el sesgo de selección, dos autores de la revisión (ROA y SVV para la actualización de 2020) seleccionaron los estudios incluidos y extrajeron los datos de forma independiente. Los desacuerdos se resolvieron mediante discusión, y el protocolo se mantuvo como la guía para reducir el sesgo. Se consultó a un estadístico (Andy Vail) para la extracción de los datos de los ensayos cruzados complicados. Para este metanálisis se extrajeron y calcularon los eventos por pareja asignada al azar, lo que dio lugar a la exclusión de seis estudios que solo informaban de los datos posteriores al cruzamiento o por ciclo. Por lo tanto, desde el punto de vista estadístico el análisis está menos sesgado, aunque puede haberse producido sesgo de selección. No fue posible construir un gráfico en embudo para los resultados a fin de comprobar la presencia de sesgo de publicación, ya que ninguno de los resultados se informó en diez estudios o más. Sin embargo, el efecto del sesgo de publicación se minimizó al realizar una búsqueda exhaustiva de todos los estudios elegibles.
Acuerdos y desacuerdos con otros estudios o revisiones
En los artículos de revisión y metanálisis anteriores (p.ej. Aboulghar 2003; Balasch 2004; Cohlen 2005; Costello 2004; Hughes 1997; Zeyneloglu 1998) se evaluó la efectividad de la IIU y la hiperestimulación ovárica, pero en todos las tasas de embarazo se calcularon por ciclo, lo que dificulta la comparación de sus hallazgos con los de la presente revisión, en la que solo se incluyeron los datos por pareja. Los datos por ciclo producen resultados sesgados que pueden exagerar los resultados del tratamiento (Dias 2008). Una revisión y metanálisis Cochrane publicados en 2019 (Wang 2019) evaluaron la efectividad y la seguridad de diferentes enfoques para el tratamiento clínico (manejo expectante, estimulación ovárica, inseminación intrauterina, estimulación ovárica ‐ inseminación intrauterina, y fertilización in vitro / inyección intracitoplasmática de esperma) en parejas con infertilidad idiopática. No hubo evidencia suficiente de diferencias en los nacidos vivos entre la inseminación intrauterina o la estimulación ovárica‐ inseminación intrauterina, en comparación con el manejo expectante (OR 1,21; IC del 95%: 0,61 a 2,43; evidencia de certeza baja; OR 1,61; IC del 95%: 0,88 a 2,94; evidencia de certeza baja, respectivamente). Estos hallazgos son similares a los de la presente revisión con respecto a los nacidos vivos en las comparaciones correspondientes de la actual revisión.

Study flow diagram.
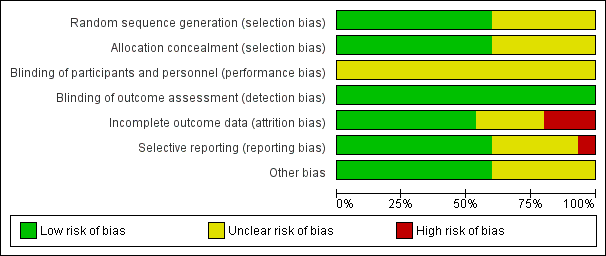
Risk of bias graph: review authors' judgements about each risk of bias item presented as percentages across all included studies.
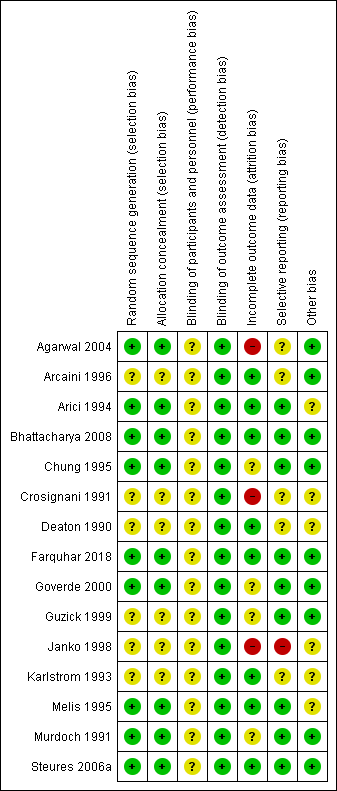
Risk of bias summary: review authors' judgements about each risk of bias item for each included study.

Forest plot of comparison 3: IUI in stimulated cycle versus TI or expectant management in natural cycle; outcome 3.1 Live birth rate per couple.
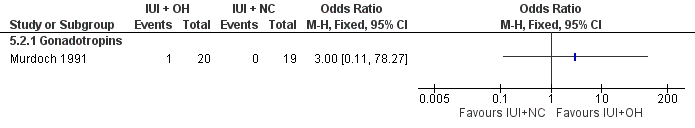
Forest plot of comparison 5: IUI in stimulated cycle versus IUI in a natural cycle; outcome 5.2 Multiple pregnancy rate per couple.

Comparison 1 IUI versus TI or expectant management both in natural cycle, Outcome 1 Live birth rate per couple (all cycles).
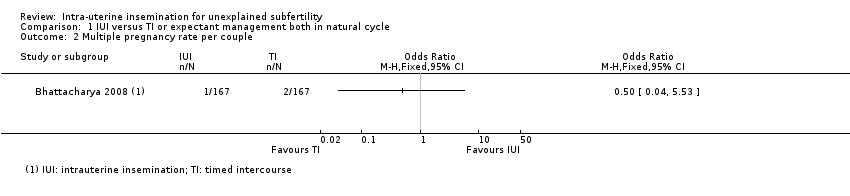
Comparison 1 IUI versus TI or expectant management both in natural cycle, Outcome 2 Multiple pregnancy rate per couple.

Comparison 1 IUI versus TI or expectant management both in natural cycle, Outcome 3 Pregnancy rate per couple (all cycles).
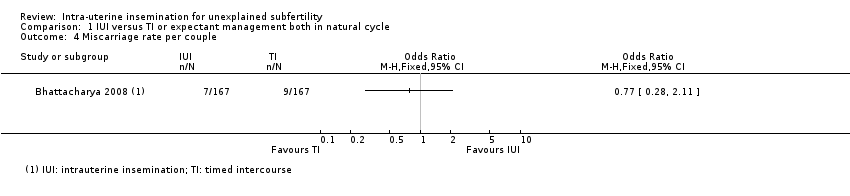
Comparison 1 IUI versus TI or expectant management both in natural cycle, Outcome 4 Miscarriage rate per couple.
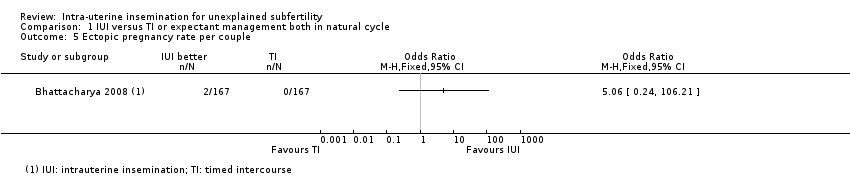
Comparison 1 IUI versus TI or expectant management both in natural cycle, Outcome 5 Ectopic pregnancy rate per couple.

Comparison 2 IUI versus TI or expectant management both in stimulated cycle, Outcome 1 Live birth rate per couple (all cycles).

Comparison 2 IUI versus TI or expectant management both in stimulated cycle, Outcome 2 Multiple pregnancy rate per couple.

Comparison 2 IUI versus TI or expectant management both in stimulated cycle, Outcome 3 Pregnancy rate per couple (all cycles).
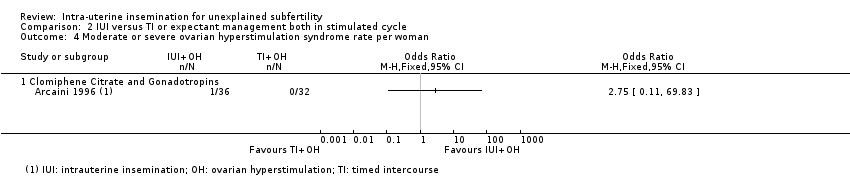
Comparison 2 IUI versus TI or expectant management both in stimulated cycle, Outcome 4 Moderate or severe ovarian hyperstimulation syndrome rate per woman.

Comparison 2 IUI versus TI or expectant management both in stimulated cycle, Outcome 5 Miscarriage rate per couple.

Comparison 2 IUI versus TI or expectant management both in stimulated cycle, Outcome 6 Ectopic pregnancy rate per couple.

Comparison 3 IUI in stimulated cycle versus TI or expectant management in natural cycle, Outcome 1 Live birth rate per couple (all cycles).
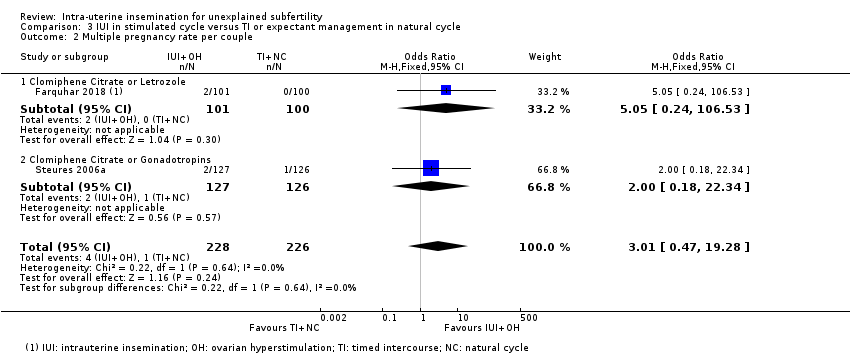
Comparison 3 IUI in stimulated cycle versus TI or expectant management in natural cycle, Outcome 2 Multiple pregnancy rate per couple.
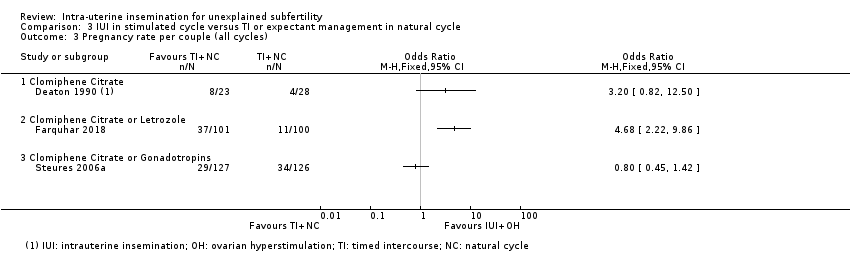
Comparison 3 IUI in stimulated cycle versus TI or expectant management in natural cycle, Outcome 3 Pregnancy rate per couple (all cycles).

Comparison 3 IUI in stimulated cycle versus TI or expectant management in natural cycle, Outcome 4 Miscarriage rate per couple.

Comparison 3 IUI in stimulated cycle versus TI or expectant management in natural cycle, Outcome 5 Ectopic pregnancy rate per couple.
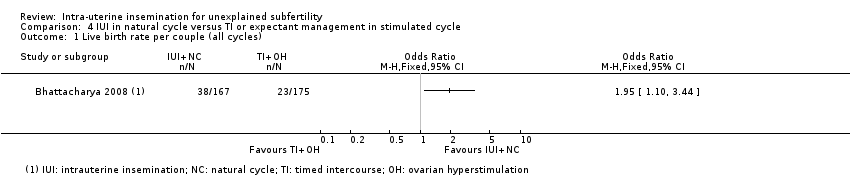
Comparison 4 IUI in natural cycle versus TI or expectant management in stimulated cycle, Outcome 1 Live birth rate per couple (all cycles).

Comparison 4 IUI in natural cycle versus TI or expectant management in stimulated cycle, Outcome 2 Multiple pregnancy rate per couple.

Comparison 4 IUI in natural cycle versus TI or expectant management in stimulated cycle, Outcome 3 Pregnancy rate per couple (all cycles).

Comparison 4 IUI in natural cycle versus TI or expectant management in stimulated cycle, Outcome 4 Miscarriage rate per couple.
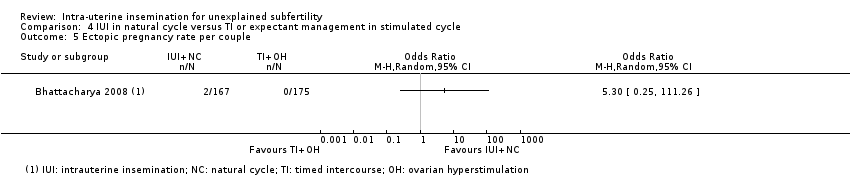
Comparison 4 IUI in natural cycle versus TI or expectant management in stimulated cycle, Outcome 5 Ectopic pregnancy rate per couple.
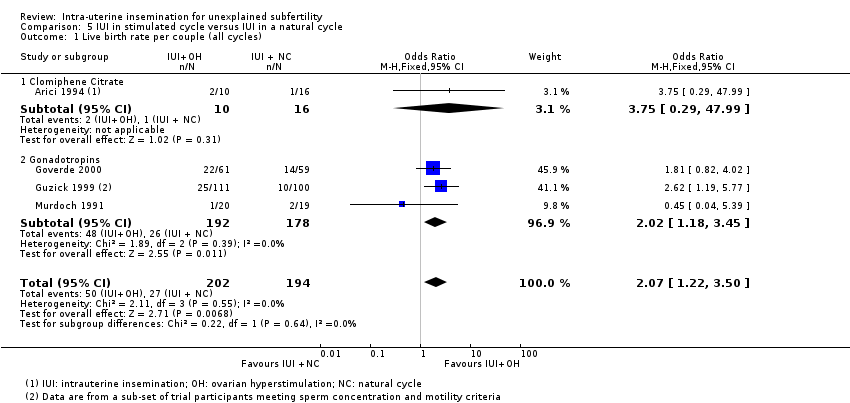
Comparison 5 IUI in stimulated cycle versus IUI in a natural cycle, Outcome 1 Live birth rate per couple (all cycles).

Comparison 5 IUI in stimulated cycle versus IUI in a natural cycle, Outcome 2 Multiple pregnancy rate per couple.

Comparison 5 IUI in stimulated cycle versus IUI in a natural cycle, Outcome 3 Pregnancy rate per couple (all cycles).

Comparison 5 IUI in stimulated cycle versus IUI in a natural cycle, Outcome 4 Miscarriage rate per couple.
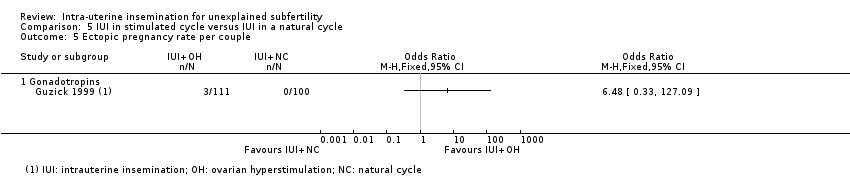
Comparison 5 IUI in stimulated cycle versus IUI in a natural cycle, Outcome 5 Ectopic pregnancy rate per couple.
| IUI compared to TI or expectant management both in natural cycle for unexplained subfertility | ||||||
| Patient or population: participants with unexplained subfertility | ||||||
| Outcomes | Illustrative comparative risks* (95% CI) | Relative effect | No of Participants | Quality of the evidence | Comments | |
| Assumed risk | Corresponding risk | |||||
| TI or expectant management both in natural cycle | IUI | |||||
| Live birth rates per couple (all cycles) | 156 per 1000 | 228 per 1000 | OR 1.60 | 334 | ⊕⊕⊝⊝ | ‐ |
| Multiple pregnancy rate per couple | 12 per 1000 | 6 per 1000 | OR 0.50 | 334 | ⊕⊕⊝⊝ | ‐ |
| Pregnancy rate per couple (all cycles) | 162 per 1000 | 228 per 1000 | OR 1.53 | 334 | ⊕⊕⊝⊝ | ‐ |
| Ovarian hyperstimulation syndrome rate per woman ‐ not reported | See comment | See comment | ‐ | ‐ | See comment | No data reported on outcome |
| Miscarriage rate per couple | 54 per 1000 | 42 per 1000 | OR 0.77 | 334 | ⊕⊕⊝⊝ | ‐ |
| Ectopic pregnancy rate per couple | Not estimable (no events in control group) | ‐ | OR 05.06 | 334 | ⊕⊕⊝⊝ | ‐ |
| *The basis for the assumed risk (e.g. the median control group risk across studies) is provided in footnotes. The corresponding risk (and its 95% confidence interval) is based on the assumed risk in the comparison group and the relative effect of the intervention (and its 95% CI). | ||||||
| GRADE Working Group grades of evidence | ||||||
| aDowngraded by two levels for very serious imprecision: small sample size with a low event rate and effect estimate with a wide confidence interval. | ||||||
| IUI compared to TI or expectant management both in stimulated cycle for unexplained subfertility | ||||||
| Patient or population: participants with unexplained subfertility | ||||||
| Outcomes | Illustrative comparative risks* (95% CI) | Relative effect | No of Participants | Quality of the evidence | Comments | |
| Assumed risk | Corresponding risk | |||||
| TI or expectant management both in stimulated cycle | IUI | |||||
| Live birth rate per couple (all cycles) | 255 per 1000 | 352 per 1000 | OR 1.59 | 208 | ⊕⊕⊝⊝ | ‐ |
| Multiple pregnancy rate per couple | 43 per 1000 | 62 per 1000 | OR 1.46 | 316 | ⊕⊕⊝⊝ | ‐ |
| Pregnancy rate per couple (all cycles) | 234 per 1000 | 340 per 1000 | OR 1.69 | 517 | ⊕⊕⊝⊝ | ‐ |
| Ovarian hyperstimulation syndrome rate per woman | Not estimable (no events in control group) | OR 2.75 | 68 | ⊕⊝⊝⊝ | ‐ | |
| Miscarriage rate per couple | 57 per 1000 | 91 per 1000 | OR 1.66 | 208 | ⊕⊕⊝⊝ | ‐ |
| Ectopic pregnancy rate per couple | Not estimable (no events in control group) | ‐ | OR 3.06 | 100 | ⊕⊕⊝⊝ | ‐ |
| *The basis for the assumed risk (e.g. the median control group risk across studies) is provided in footnotes. The corresponding risk (and its 95% confidence interval) is based on the assumed risk in the comparison group and the relative effect of the intervention (and its 95% CI). | ||||||
| GRADE Working Group grades of evidence | ||||||
| aDowngraded by two levels for very serious imprecision: small sample size with a low event rate and effect estimate with a wide confidence interval. | ||||||
| IUI in stimulated cycle compared to TI or expectant management in natural cycle for unexplained subfertility | ||||||
| Patient or population: participants with unexplained subfertility | ||||||
| Outcomes | Illustrative comparative risks* (95% CI) | Relative effect | No of Participants | Quality of the evidence | Comments | |
| Assumed risk | Corresponding risk | |||||
| TI or expectant management in a natural cycle | IUI in a stimulated cycle | |||||
| Live birth rate per couple (all cycles)‐ clomiphene citrate or letrozole | 90 per 1000 | 307 per 1000 | OR 4.48 | 201 | ⊕⊕⊕⊝ | ‐ |
| Live birth rate per couple (all cycles)‐ clomiphene citrate or gonadotropins | 238 per 1000 | 204 per 1000 | OR 0.82 | 253 | ⊕⊕⊝⊝ | ‐ |
| Multiple pregnancy rate per couple | 4 per 1000 | 13 per 1000 | OR 3.01 | 454 | ⊕⊕⊝⊝ | ‐ |
| Pregnancy rate per couple (all cycles)‐ clomiphene citrate or letrozole | 110 per 1000 | 366 per 1000 | OR 4.68 | 201 | ⊕⊕⊕⊝ | ‐ |
| Ovarian hyperstimulation syndrome rate per woman | See comment | See comment | See comment | See comment | See comment | No events in intervention or control groups |
| Miscarriage rate per couple | 31 per 1000 | 84 per 1000 | OR 2.87 | 454 | ⊕⊕⊕⊝ | ‐ |
| Ectopic pregnancy rate per couple | Not estimable (no events in intervention group) | ‐ | OR 9.28 | 201 | ⊕⊕⊝⊝ | ‐ |
| *The basis for the assumed risk (e.g. the median control group risk across studies) is provided in footnotes. The corresponding risk (and its 95% confidence interval) is based on the assumed risk in the comparison group and the relative effect of the intervention (and its 95% CI). | ||||||
| GRADE Working Group grades of evidence | ||||||
| aDowngraded by one level for serious imprecision: small sample size with a low event rate. | ||||||
| IUI in natural cycle compared to TI or expectant management in stimulated cycle for unexplained subfertility | ||||||
| Patient or population: participants with unexplained subfertility | ||||||
| Outcomes | Illustrative comparative risks* (95% CI) | Relative effect | No of Participants | Quality of the evidence | Comments | |
| Assumed risk | Corresponding risk | |||||
| TI or expectant management in stimulated cycle | IUI in natural cycle | |||||
| Live birth rate per couple (all cycles) | 131 per 1000 | 227 per 1000 | OR 1.95 | 342 | ⊕⊕⊕⊝ | ‐ |
| Multiple pregnancy rate per couple | 6 per 1000 | 6 per 1000 | OR 1.05 | 342 | ⊕⊕⊝⊝ | ‐ |
| Pregnancy rate per couple (all cycles) | 143 per 1000 | 228 per 1000 | OR 1.77 | 342 | ⊕⊕⊕⊝ | ‐ |
| Ovarian hyperstimulation syndrome rate per woman ‐ not reported | See comment | See comment | ‐ | ‐ | See comment | No data reported on outcome |
| Miscarriage rater per couple | 46 per 1000 | 42 per 1000 | OR 0.91 | 342 | ⊕⊕⊝⊝ | ‐ |
| Ectopic pregnancy rate per couple | Not estimable (no events in control group) | ‐ | OR 5.30 | 342 | ⊕⊕⊝⊝ | ‐ |
| *The basis for the assumed risk (e.g. the median control group risk across studies) is provided in footnotes. The corresponding risk (and its 95% confidence interval) is based on the assumed risk in the comparison group and the relative effect of the intervention (and its 95% CI). | ||||||
| GRADE Working Group grades of evidence | ||||||
| aDowngraded by one level for serious imprecision: small sample size with a low event rate. | ||||||
| IUI in stimulated cycle compared to IUI in natural cycle for unexplained subfertility | ||||||
| Patient or population: participants with unexplained subfertility | ||||||
| Outcomes | Illustrative comparative risks* (95% CI) | Relative effect | No of Participants | Quality of the evidence | Comments | |
| Assumed risk | Corresponding risk | |||||
| IUI in a natural cycle | IUI in a stimulated cycle | |||||
| Live birth rare per couple (all cycles) | 139 per 1000 | 250 per 1000 | OR 2.07 | 396 | ⊕⊕⊝⊝ | ‐ |
| Multiple pregnancy rate per couple | Not estimable (no events in control group) | ‐ | OR 3.00 | 39 | ⊕⊕⊝⊝ | ‐ |
| Pregnancy rate per couple (all cycles) | 63 per 1000 | 302 per 1000 | OR 6.43 | 26 | ⊕⊕⊝⊝ | ‐ |
| Ovarian hyperstimulation syndrome rate per woman ‐ not measured | See comment | See comment | Not estimable | ‐ | See comment | No events in intervention and control groups |
| Miscarriage rate per couple | Not estimable (no events in control group) | ‐ | OR 5.21 | 26 | ⊕⊕⊝⊝ | ‐ |
| Ectopic pregnancy rate per couple | Not estimable (no events in control group) | ‐ | OR 6.48 | 211 | ⊕⊝⊝⊝ | ‐ |
| *The basis for the assumed risk (e.g. the median control group risk across studies) is provided in footnotes. The corresponding risk (and its 95% confidence interval) is based on the assumed risk in the comparison group and the relative effect of the intervention (and its 95% CI). | ||||||
| GRADE Working Group grades of evidence | ||||||
| aDowngraded by one level for serious imprecision: small sample size with a low event rate. | ||||||
| Outcome or subgroup title | No. of studies | No. of participants | Statistical method | Effect size |
| 1 Live birth rate per couple (all cycles) Show forest plot | 1 | Odds Ratio (M‐H, Fixed, 95% CI) | Totals not selected | |
| 2 Multiple pregnancy rate per couple Show forest plot | 1 | Odds Ratio (M‐H, Fixed, 95% CI) | Totals not selected | |
| 3 Pregnancy rate per couple (all cycles) Show forest plot | 1 | Odds Ratio (M‐H, Fixed, 95% CI) | Totals not selected | |
| 4 Miscarriage rate per couple Show forest plot | 1 | Odds Ratio (M‐H, Fixed, 95% CI) | Totals not selected | |
| 5 Ectopic pregnancy rate per couple Show forest plot | 1 | Odds Ratio (M‐H, Fixed, 95% CI) | Totals not selected | |
| Outcome or subgroup title | No. of studies | No. of participants | Statistical method | Effect size |
| 1 Live birth rate per couple (all cycles) Show forest plot | 2 | 208 | Odds Ratio (M‐H, Fixed, 95% CI) | 1.59 [0.88, 2.88] |
| 1.1 Gonadotropins | 2 | 208 | Odds Ratio (M‐H, Fixed, 95% CI) | 1.59 [0.88, 2.88] |
| 2 Multiple pregnancy rate per couple Show forest plot | 4 | 316 | Odds Ratio (M‐H, Fixed, 95% CI) | 1.46 [0.55, 3.87] |
| 2.1 Clomiphene Citrate | 1 | 40 | Odds Ratio (M‐H, Fixed, 95% CI) | 0.43 [0.02, 11.18] |
| 2.2 Gonadotropins | 2 | 208 | Odds Ratio (M‐H, Fixed, 95% CI) | 1.61 [0.44, 5.89] |
| 2.3 Clomiphene Citrate and Gonadotropins | 1 | 68 | Odds Ratio (M‐H, Fixed, 95% CI) | 1.88 [0.32, 11.00] |
| 3 Pregnancy rate per couple (all cycles) Show forest plot | 6 | 517 | Odds Ratio (M‐H, Fixed, 95% CI) | 1.69 [1.14, 2.53] |
| 3.1 Clomiphene Citrate | 1 | 40 | Odds Ratio (M‐H, Fixed, 95% CI) | 0.30 [0.03, 2.93] |
| 3.2 Gonadotropins | 4 | 319 | Odds Ratio (M‐H, Fixed, 95% CI) | 1.68 [1.03, 2.75] |
| 3.3 Clomiphene Citrate and Gonadotropins | 1 | 68 | Odds Ratio (M‐H, Fixed, 95% CI) | 2.62 [0.98, 6.98] |
| 3.4 Clomiphene citrate OR Gonadotropins | 1 | 90 | Odds Ratio (M‐H, Fixed, 95% CI) | 1.72 [0.50, 5.89] |
| 4 Moderate or severe ovarian hyperstimulation syndrome rate per woman Show forest plot | 1 | Odds Ratio (M‐H, Fixed, 95% CI) | Totals not selected | |
| 4.1 Clomiphene Citrate and Gonadotropins | 1 | Odds Ratio (M‐H, Fixed, 95% CI) | 0.0 [0.0, 0.0] | |
| 5 Miscarriage rate per couple Show forest plot | 2 | 208 | Odds Ratio (M‐H, Fixed, 95% CI) | 1.66 [0.56, 4.88] |
| 5.1 Gonadotropins | 2 | 208 | Odds Ratio (M‐H, Fixed, 95% CI) | 1.66 [0.56, 4.88] |
| 6 Ectopic pregnancy rate per couple Show forest plot | 1 | Odds Ratio (M‐H, Fixed, 95% CI) | Totals not selected | |
| 6.1 Gonadotropins | 1 | Odds Ratio (M‐H, Fixed, 95% CI) | 0.0 [0.0, 0.0] | |
| Outcome or subgroup title | No. of studies | No. of participants | Statistical method | Effect size |
| 1 Live birth rate per couple (all cycles) Show forest plot | 2 | Odds Ratio (M‐H, Fixed, 95% CI) | Totals not selected | |
| 1.1 Clomiphene Citrate or Letrozole | 1 | Odds Ratio (M‐H, Fixed, 95% CI) | 0.0 [0.0, 0.0] | |
| 1.2 Clomiphene Citrate or Gonadotropins | 1 | Odds Ratio (M‐H, Fixed, 95% CI) | 0.0 [0.0, 0.0] | |
| 2 Multiple pregnancy rate per couple Show forest plot | 2 | 454 | Odds Ratio (M‐H, Fixed, 95% CI) | 3.01 [0.47, 19.28] |
| 2.1 Clomiphene Citrate or Letrozole | 1 | 201 | Odds Ratio (M‐H, Fixed, 95% CI) | 5.05 [0.24, 106.53] |
| 2.2 Clomiphene Citrate or Gonadotropins | 1 | 253 | Odds Ratio (M‐H, Fixed, 95% CI) | 2.0 [0.18, 22.34] |
| 3 Pregnancy rate per couple (all cycles) Show forest plot | 3 | Odds Ratio (M‐H, Fixed, 95% CI) | Totals not selected | |
| 3.1 Clomiphene Citrate | 1 | Odds Ratio (M‐H, Fixed, 95% CI) | 0.0 [0.0, 0.0] | |
| 3.2 Clomiphene Citrate or Letrozole | 1 | Odds Ratio (M‐H, Fixed, 95% CI) | 0.0 [0.0, 0.0] | |
| 3.3 Clomiphene Citrate or Gonadotropins | 1 | Odds Ratio (M‐H, Fixed, 95% CI) | 0.0 [0.0, 0.0] | |
| 4 Miscarriage rate per couple Show forest plot | 2 | 454 | Odds Ratio (M‐H, Fixed, 95% CI) | 2.87 [1.18, 7.01] |
| 4.1 Clomiphene Citrate or Letrozole | 1 | 201 | Odds Ratio (M‐H, Fixed, 95% CI) | 6.25 [0.74, 52.91] |
| 4.2 Clomiphene Citrate or Gonadotropins | 1 | 253 | Odds Ratio (M‐H, Fixed, 95% CI) | 2.28 [0.84, 6.20] |
| 5 Ectopic pregnancy rate per couple Show forest plot | 1 | Odds Ratio (M‐H, Fixed, 95% CI) | Totals not selected | |
| Outcome or subgroup title | No. of studies | No. of participants | Statistical method | Effect size |
| 1 Live birth rate per couple (all cycles) Show forest plot | 1 | Odds Ratio (M‐H, Fixed, 95% CI) | Totals not selected | |
| 2 Multiple pregnancy rate per couple Show forest plot | 1 | Odds Ratio (M‐H, Fixed, 95% CI) | Totals not selected | |
| 3 Pregnancy rate per couple (all cycles) Show forest plot | 1 | Odds Ratio (M‐H, Fixed, 95% CI) | Totals not selected | |
| 4 Miscarriage rate per couple Show forest plot | 1 | Odds Ratio (M‐H, Fixed, 95% CI) | Totals not selected | |
| 5 Ectopic pregnancy rate per couple Show forest plot | 1 | Odds Ratio (M‐H, Random, 95% CI) | Totals not selected | |
| Outcome or subgroup title | No. of studies | No. of participants | Statistical method | Effect size |
| 1 Live birth rate per couple (all cycles) Show forest plot | 4 | 396 | Odds Ratio (M‐H, Fixed, 95% CI) | 2.07 [1.22, 3.50] |
| 1.1 Clomiphene Citrate | 1 | 26 | Odds Ratio (M‐H, Fixed, 95% CI) | 3.75 [0.29, 47.99] |
| 1.2 Gonadotropins | 3 | 370 | Odds Ratio (M‐H, Fixed, 95% CI) | 2.02 [1.18, 3.45] |
| 2 Multiple pregnancy rate per couple Show forest plot | 1 | Odds Ratio (M‐H, Fixed, 95% CI) | Totals not selected | |
| 2.1 Gonadotropins | 1 | Odds Ratio (M‐H, Fixed, 95% CI) | 0.0 [0.0, 0.0] | |
| 3 Pregnancy rate per couple (all cycles) Show forest plot | 1 | Odds Ratio (M‐H, Fixed, 95% CI) | Totals not selected | |
| 3.1 Clomiphene Citrate | 1 | Odds Ratio (M‐H, Fixed, 95% CI) | 0.0 [0.0, 0.0] | |
| 4 Miscarriage rate per couple Show forest plot | 1 | Odds Ratio (M‐H, Fixed, 95% CI) | Totals not selected | |
| 4.1 Clomiphene Citrate | 1 | Odds Ratio (M‐H, Fixed, 95% CI) | 0.0 [0.0, 0.0] | |
| 4.2 Gonadotropins | 0 | Odds Ratio (M‐H, Fixed, 95% CI) | 0.0 [0.0, 0.0] | |
| 5 Ectopic pregnancy rate per couple Show forest plot | 1 | Odds Ratio (M‐H, Fixed, 95% CI) | Totals not selected | |
| 5.1 Gonadotropins | 1 | Odds Ratio (M‐H, Fixed, 95% CI) | 0.0 [0.0, 0.0] | |