Inseminación intrauterina para la subfertilidad de causa desconocida
Referencias
Referencias de los estudios incluidos en esta revisión
Referencias de los estudios excluidos de esta revisión
Referencias de los estudios en espera de evaluación
Referencias adicionales
Characteristics of studies
Characteristics of included studies [ordered by study ID]
Ir a:
| Methods | Trial design: parallel Nr of Pt randomised: IUI+OH 70; TI+OH 70 | |
| Participants | Couples with unexplained subfertility | |
| Interventions | Comparison: IUI+OH versus TI+OH | |
| Outcomes | Live birth and PR per couple and per cycle Pregnancy confirmed by USS showing gestational sac | |
| Notes | ITT‐analysis: possible | |
| Risk of bias | ||
| Bias | Authors' judgement | Support for judgement |
| Random sequence generation (selection bias) | Low risk | Random number table |
| Allocation concealment (selection bias) | Low risk | A ‐ Adequate; sealed opaque envelopes |
| Blinding (performance bias and detection bias) | High risk | Blinding was not possible because of the nature of the interventions |
| Incomplete outcome data (attrition bias) | High risk | There was an unequal dropout in the treatment group due to financial reasons. |
| Selective reporting (reporting bias) | Unclear risk | Reported on live birth, however authors provided additional information on ongoing pregnancies and twin pregnancies resulting in different data used for meta‐analysis |
| Other bias | High risk | The financial constraints causing unbalanced groups could also have influenced patient selection, follow‐up and treatment compliance. |
| Methods | Trial design: parallel Nr of Pt randomised: IUI+OH 36; TI+OH 32 | |
| Participants | Couples with unexplained subfertility | |
| Interventions | Comparison: IUI+OH versus TI+OH | |
| Outcomes | PR per couple Pregnancy confirmed by USS | |
| Notes | ITT‐analysis: yes | |
| Risk of bias | ||
| Bias | Authors' judgement | Support for judgement |
| Random sequence generation (selection bias) | Unclear risk | Not stated |
| Allocation concealment (selection bias) | Unclear risk | B ‐ Unclear |
| Blinding (performance bias and detection bias) | High risk | Blinding was not possible because of the nature of the interventions |
| Incomplete outcome data (attrition bias) | Low risk | A total of 16 cancelled treatment cycles is described and analysed according to intention to treat. Patients who dropped out are clearly stated in a table. |
| Selective reporting (reporting bias) | Unclear risk | Did not report on live birth, however, did not intend to report on live birth. |
| Methods | Trial design: crossover (after 1 cycle) Nr of Pt randomised: 26 | |
| Participants | Couples with unexplained subfertility and couples with male factor subfertility | |
| Interventions | Comparison: IUI+NC versus IUI+OH Timing: | |
| Outcomes | Live birth and PR per couple Pregnancy confirmed by USS showing gestational sac | |
| Notes | ITT analysis: yes | |
| Risk of bias | ||
| Bias | Authors' judgement | Support for judgement |
| Random sequence generation (selection bias) | Low risk | Computer generated random number table |
| Allocation concealment (selection bias) | Low risk | A ‐ Adequate; computer system utilizing locked files |
| Blinding (performance bias and detection bias) | High risk | Blinding was not possible because of the nature of the interventions |
| Incomplete outcome data (attrition bias) | Low risk | Author gave additional information on dropout rates of the couples with unexplained subfertility. Of the 26 women with unexplained subfertility, dropout occurred after 1 treatment cycle. Post‐crossover data are not included in the meta‐analysis. |
| Selective reporting (reporting bias) | Low risk | Live birth data were obtained from the author |
| Methods | Trial design: parallel Nr of Pt randomised: 509 with unexplained subfertility only (total 580). | |
| Participants | Couples with unexplained subfertility, (mild male factor infertility and minimal endometriosis) | |
| Interventions | Comparison: TI (expectant management) +NC versus TI+OH versus IUI+NC | |
| Outcomes | Live birth and PR per couple Pregnancy confirmed by USS showing gestational sac and fetal hart beat | |
| Notes | The author provided additional data on the couples with unexplained subfertility only. The baseline characteristics of the patients reported are from the group total. ITT analysis was therefore possible and performed. Author provided additional information. | |
| Risk of bias | ||
| Bias | Authors' judgement | Support for judgement |
| Random sequence generation (selection bias) | Low risk | Sequence generated by independent statistician |
| Allocation concealment (selection bias) | Low risk | A ‐ Adequate; central telephone randomisation system |
| Blinding (performance bias and detection bias) | High risk | Blinding was not possible because of the nature of the interventions |
| Incomplete outcome data (attrition bias) | Low risk | Loss to follow‐up and patients who received alternative treatment are presented in a flow‐chart. |
| Selective reporting (reporting bias) | Low risk | Live birth data and adverse events are published |
| Methods | Trial design: parallel Nr of Pt randomised: 100 | |
| Participants | Couples with unexplained subfertility | |
| Interventions | Comparison: IUI+OH versus TI+OH | |
| Outcomes | PR per couple and per cycle | |
| Notes | ITT‐analysis: possible | |
| Risk of bias | ||
| Bias | Authors' judgement | Support for judgement |
| Random sequence generation (selection bias) | Low risk | Blocked randomisation scheme |
| Allocation concealment (selection bias) | Low risk | A ‐ Adequate; numbered sealed envelopes |
| Blinding (performance bias and detection bias) | High risk | Blinding was not possible because of the nature of the interventions |
| Incomplete outcome data (attrition bias) | Unclear risk | 8/50 withdrawn and 6 treatment cycles cancelled in TI group, 4/50 withdrawn and 11 treatment cycles cancelled in IUI group. Reason for cycle cancellation was excessive response. Reason for withdrawal was not stated. |
| Selective reporting (reporting bias) | Low risk | Live birth data and complication numbers were reported. |
| Methods | Data from centre 10: Hedon, Montpellier, France Trial design: cross over (after 1 cycle) Nr of Pt randomised: unclear | |
| Participants | Couples with unexplained subfertility | |
| Interventions | Comparison: IUI+OH versus TI+OH | |
| Outcomes | PR per 1st cycle | |
| Notes | ITT‐analysis: not possible | |
| Risk of bias | ||
| Bias | Authors' judgement | Support for judgement |
| Random sequence generation (selection bias) | Unclear risk | Each centre used own randomisation method. The per centre method could not be obtained. |
| Allocation concealment (selection bias) | Unclear risk | B ‐ Unclear; each centre used own treatment allocation method. The per centre method could not be obtained. |
| Blinding (performance bias and detection bias) | High risk | Blinding was not possible because of the nature of the interventions |
| Incomplete outcome data (attrition bias) | High risk | Details on patient withdrawal or loss to follow‐up were not stated |
| Selective reporting (reporting bias) | Unclear risk | Live birth data were not reported |
| Methods | Data from centre 13: Willemsen, Nijmegen, the Netherlands | |
| Participants | ||
| Interventions | ||
| Outcomes | ||
| Notes | ||
| Risk of bias | ||
| Bias | Authors' judgement | Support for judgement |
| Blinding (performance bias and detection bias) | High risk | |
| Methods | Data from centre 16: Pellicer, Valencia, Italy | |
| Participants | ||
| Interventions | ||
| Outcomes | ||
| Notes | ||
| Risk of bias | ||
| Bias | Authors' judgement | Support for judgement |
| Blinding (performance bias and detection bias) | High risk | |
| Methods | Data from centre 19: Martinez, Amsterdam, the Netherlands | |
| Participants | ||
| Interventions | ||
| Outcomes | ||
| Notes | ||
| Risk of bias | ||
| Bias | Authors' judgement | Support for judgement |
| Blinding (performance bias and detection bias) | High risk | |
| Methods | Trial design: crossover (after 4 cycles) Nr of Pt randomised: 67 | |
| Participants | Couples with unexplained subfertility and couples with surgically treated endometriosis | |
| Interventions | Comparison: IUI+OH versus TI+NC Timing: | |
| Outcomes | Ongoing pregnancy rate Pregnancy: not further defined | |
| Notes | ITT‐analysis: not possible | |
| Risk of bias | ||
| Bias | Authors' judgement | Support for judgement |
| Random sequence generation (selection bias) | Unclear risk | Sequence generation not stated |
| Allocation concealment (selection bias) | Unclear risk | B ‐ Unclear |
| Blinding (performance bias and detection bias) | High risk | Blinding was not possible because of the nature of the interventions |
| Incomplete outcome data (attrition bias) | Low risk | 16/67 patients excluded from analysis due to anovulation, poor semen quality or inability to follow the treatment protocol. Of the remaining 51 patients, 6 couples did not complete treatment because of illness or relocation. 4/51 dropped out before cross‐over. |
| Selective reporting (reporting bias) | Unclear risk | Live birth rate was not reported. |
| Methods | Trial design: parallel Nr of patients randomised: 120 (unexplained IUI+NC and IUI+TI), 258 total | |
| Participants | Couples with unexplained subfertility and couples with male factor subfertility | |
| Interventions | Comparison: IUI+NC versus IUI+OH (versus IVF) | |
| Outcomes | Live birth per couple | |
| Notes | ITT‐analysis: yes Some dropouts because of spontaneous pregnancy | |
| Risk of bias | ||
| Bias | Authors' judgement | Support for judgement |
| Random sequence generation (selection bias) | Low risk | Computer generated randomisation schedule |
| Allocation concealment (selection bias) | Low risk | A ‐ Adequate; numbered, masked and sealed envelopes |
| Blinding (performance bias and detection bias) | High risk | Blinding was not possible because of the nature of the interventions |
| Incomplete outcome data (attrition bias) | Unclear risk | 7/120 withdrew before 1st treatment cycle. Details on dropout not separately available for unexplained subfertility. Some patients dropped out because of spontaneous pregnancy. It is not known whether these patients are included in the IUI unexplained subfertility group. |
| Selective reporting (reporting bias) | Low risk | Live birth and complication data were reported |
| Methods | Trial design: Parallel Nr of Pt randomised: 932 (465 treated with IUI) | |
| Participants | Couples with unexplained subfertility and couples with stage I or II treated endometriosis or male factor subfertility | |
| Interventions | Comparison: IUI+NC versus IUI+OH Cycles were cancelled if serum E2 concentration >3000pg/ml Duration of treatment: 4 cycles max | |
| Outcomes | Live birth per couple Pregnancy defined by two positive HCG tests. Confirmed by live birth | |
| Notes | ITT‐analysis: not possible | |
| Risk of bias | ||
| Bias | Authors' judgement | Support for judgement |
| Random sequence generation (selection bias) | Low risk | Computer generated permuted block |
| Allocation concealment (selection bias) | Low risk | A ‐ Adequate; locked computer files |
| Blinding (performance bias and detection bias) | High risk | Blinding was not possible because of the nature of the interventions |
| Incomplete outcome data (attrition bias) | Unclear risk | Withdrawal rates of the total group were presented: 4/465 treatment related withdrawal, 27/465 not treatment related. Numbers for unexplained subfertility group are not known. |
| Selective reporting (reporting bias) | Low risk | Live birth and complication data were reported |
| Methods | Trial design: parallel Nr of Pt randomised: 72 | |
| Participants | Couples with unexplained subfertility | |
| Interventions | Comparison: IUI+OH versus TI+OH | |
| Outcomes | PR per cycle Pregnancy not further defined | |
| Notes | ITT‐analysis: possible | |
| Risk of bias | ||
| Bias | Authors' judgement | Support for judgement |
| Random sequence generation (selection bias) | Unclear risk | Not stated |
| Allocation concealment (selection bias) | Unclear risk | B ‐ Unclear; not stated |
| Blinding (performance bias and detection bias) | High risk | Blinding was not possible because of the nature of the interventions |
| Incomplete outcome data (attrition bias) | High risk | Not available |
| Selective reporting (reporting bias) | High risk | In this abstract the reported outcome data are minimal |
| Methods | Trial design: Parallel Nr of Pt randomised: not clear | |
| Participants | Couples with unexplained subfertility and minimal or mild endometriosis | |
| Interventions | Comparison: IUI+OH versus TI+OH (vs DIPI+OH vs IUI and DIPI+OH) Cycles were cancelled according to serum E2 rise. Duration of treatment: 1 cycle max | |
| Outcomes | PR per cycle | |
| Notes | ITT‐analysis: not possible | |
| Risk of bias | ||
| Bias | Authors' judgement | Support for judgement |
| Random sequence generation (selection bias) | Unclear risk | Not stated |
| Allocation concealment (selection bias) | Unclear risk | B ‐ Unclear; not stated |
| Blinding (performance bias and detection bias) | High risk | Blinding was not possible because of the nature of the interventions |
| Incomplete outcome data (attrition bias) | Low risk | 4 withdrawals in clomiphene group due to absent LH surge, 5 withdrawals in hMG group due to absent LH surge, fast oestrogen rise or personal reasons. |
| Selective reporting (reporting bias) | Unclear risk | Live birth data were not reported |
| Methods | See Karlstrom 1993a | |
| Participants | ||
| Interventions | Stimulation method 2: 100mg CC/day for 5 days | |
| Outcomes | ||
| Notes | ||
| Risk of bias | ||
| Bias | Authors' judgement | Support for judgement |
| Blinding (performance bias and detection bias) | High risk | |
| Methods | Trial design: parallel Nr of Pt randomised: 108 | |
| Participants | Couples with unexplained and couples with mild male factor subfertility | |
| Interventions | Comparison: IUI+OH versus TI+OH Duration of treatment: 3 cycles max | |
| Outcomes | Live birth per couple Pregnancy confirmed by USS showing fetal heart activity | |
| Notes | ITT analysis: possible | |
| Risk of bias | ||
| Bias | Authors' judgement | Support for judgement |
| Random sequence generation (selection bias) | Low risk | Computer generated random number list |
| Allocation concealment (selection bias) | Low risk | A ‐ Adequate; numbered opaque sealed envelopes |
| Blinding (performance bias and detection bias) | High risk | Blinding was not possible because of the nature of the interventions |
| Incomplete outcome data (attrition bias) | Low risk | Exclusion numbers were published for the overall group.The author provided additional information: 1/52 (IUI+OH group) withdrew, 4/56 (TI+OH group) withdrew. Reasons for dropout were family problems, poor response or exaggerated response. |
| Selective reporting (reporting bias) | Low risk | Live birth data and complication numbers were available for analysis |
| Methods | Trial design: parallel Nr of Pt randomised: 39 | |
| Participants | Couples with unexplained subfertility | |
| Interventions | Comparison: IUI+NC versus IUI+OH (vs GIFT) Duration of treatment: 3 cycles max | |
| Outcomes | PR per couple and per cycle Clinical pregnancy defined by USS showing fetal heart activity | |
| Notes | ITT analysis: yes 1 pregnancy between treatment cycles | |
| Risk of bias | ||
| Bias | Authors' judgement | Support for judgement |
| Random sequence generation (selection bias) | Low risk | Computer generated random number sequence |
| Allocation concealment (selection bias) | Low risk | A ‐ Adequate; numbered opaque sealed envelopes |
| Blinding (performance bias and detection bias) | High risk | Blinding was not possible because of the nature of the interventions |
| Incomplete outcome data (attrition bias) | Low risk | Drop‐out rate 3/19 (IUI+NC), and 2/20 (IUI+OH). Reasons not stated. Data on cycle cancellation are reported. |
| Selective reporting (reporting bias) | Low risk | Live birth data were provided |
| Methods | Trial design: parallel Nr of Pt randomised: 253 | |
| Participants | Couples with unexplained subfertility and an intermediate prognosis of conceiving within the next 12 months (Hunault 30‐40%) Age: IUI+OH 33 (±3.4); TI+NC 33 (±3.19) | |
| Interventions | Comparison: IUI+OH versus TI (expectant management)+NC Cycles were cancelled when >3 follicles of 16mm or >5 follicles of 12mm were present. Duration of treatment: 6 months | |
| Outcomes | Live birth/couple | |
| Notes | ITT analysis: yes Only couples with an intermediate prognosis of conceiving were included, this influences the possible treatment effect. | |
| Risk of bias | ||
| Bias | Authors' judgement | Support for judgement |
| Random sequence generation (selection bias) | Low risk | Computer generated sequence in balanced blocks |
| Allocation concealment (selection bias) | Low risk | A ‐ Adequate; via opaque sealed envelopes |
| Blinding (performance bias and detection bias) | High risk | Blinding was not possible because of the nature of the interventions |
| Incomplete outcome data (attrition bias) | Low risk | IUI+OH group 3 patients lost to follow up, TI+NC group 2 lost to follow up 2 still pregnant |
| Selective reporting (reporting bias) | Low risk | Live birth and complications reported |
CC: clomiphene citrate
DIPI: direct intraperitoneal insemination
FSH: follicle stimulating hormone
hCG: human chorionic gonadotropin
hMG: human menopausal gonadotropin
IUI: intra‐uterine insemination
OH: ovarian hyperstimulation
USS: ultrasound scan
Characteristics of excluded studies [ordered by study ID]
Ir a:
| Study | Reason for exclusion |
| The trial was not randomised | |
| No pre‐crossover data available | |
| No pre‐crossover data available | |
| No pre‐crossover data available | |
| Abstract, full article not available. No separate data for couples with unexplained subfertility | |
| No pre‐crossover data available | |
| No per woman data. Biochemical pregnancies only reported | |
| No pre‐crossover data available | |
| The trial (published as full paper in 1993) was not randomised | |
| The trial (also published as an abstract in 1990) was not randomised | |
| This trial was quasi randomised, on the basis of hospital case record number | |
| The trial was not randomised | |
| The participants in this trial were all diagnosed with endometriosis | |
| No pre‐crossover data available |
Data and analyses
| Outcome or subgroup title | No. of studies | No. of participants | Statistical method | Effect size |
| 1 Live birth rate per couple (all cycles) Show forest plot | 1 | Odds Ratio (M‐H, Fixed, 95% CI) | Totals not selected | |
| Analysis 1.1  Comparison 1 IUI versus TI or expectant management both in natural cycle, Outcome 1 Live birth rate per couple (all cycles). | ||||
| 2 Pregnancy rate per couple (all cycles) Show forest plot | 1 | Odds Ratio (M‐H, Fixed, 95% CI) | Totals not selected | |
| Analysis 1.2  Comparison 1 IUI versus TI or expectant management both in natural cycle, Outcome 2 Pregnancy rate per couple (all cycles). | ||||
| 3 Multiple pregnancy rate per couple Show forest plot | 1 | Odds Ratio (M‐H, Fixed, 95% CI) | Totals not selected | |
| Analysis 1.3  Comparison 1 IUI versus TI or expectant management both in natural cycle, Outcome 3 Multiple pregnancy rate per couple. | ||||
| 4 Miscarriage rate per couple Show forest plot | 1 | Odds Ratio (M‐H, Fixed, 95% CI) | Totals not selected | |
| Analysis 1.4  Comparison 1 IUI versus TI or expectant management both in natural cycle, Outcome 4 Miscarriage rate per couple. | ||||
| 5 Ectopic pregnancy rate per couple Show forest plot | 1 | Odds Ratio (M‐H, Fixed, 95% CI) | Totals not selected | |
| Analysis 1.5  Comparison 1 IUI versus TI or expectant management both in natural cycle, Outcome 5 Ectopic pregnancy rate per couple. | ||||
| Outcome or subgroup title | No. of studies | No. of participants | Statistical method | Effect size |
| 1 Live birth rate per couple (all cycles) Show forest plot | 2 | 208 | Odds Ratio (M‐H, Fixed, 95% CI) | 1.59 [0.88, 2.88] |
| Analysis 2.1  Comparison 2 IUI versus TI both in stimulated cycle, Outcome 1 Live birth rate per couple (all cycles). | ||||
| 1.1 Gonadotropins | 2 | 208 | Odds Ratio (M‐H, Fixed, 95% CI) | 1.59 [0.88, 2.88] |
| 2 Pregnancy rate per couple (all cycles) Show forest plot | 10 | 517 | Odds Ratio (M‐H, Fixed, 95% CI) | 1.68 [1.13, 2.50] |
| Analysis 2.2  Comparison 2 IUI versus TI both in stimulated cycle, Outcome 2 Pregnancy rate per couple (all cycles). | ||||
| 2.1 Clomiphene Citrate | 1 | 40 | Odds Ratio (M‐H, Fixed, 95% CI) | 0.30 [0.03, 2.93] |
| 2.2 Gonadotropins | 4 | 319 | Odds Ratio (M‐H, Fixed, 95% CI) | 1.68 [1.03, 2.75] |
| 2.3 Clomiphene Citrate and Gonadotropins | 1 | 68 | Odds Ratio (M‐H, Fixed, 95% CI) | 2.62 [0.98, 6.98] |
| 2.4 Clomiphene citrate OR Gonadotropins | 4 | 90 | Odds Ratio (M‐H, Fixed, 95% CI) | 1.62 [0.52, 5.05] |
| 3 Ovarian Hyperstimulation Syndrome rate per women Show forest plot | 2 | Odds Ratio (M‐H, Fixed, 95% CI) | Subtotals only | |
| Analysis 2.3  Comparison 2 IUI versus TI both in stimulated cycle, Outcome 3 Ovarian Hyperstimulation Syndrome rate per women. | ||||
| 3.1 Gonadotropins | 1 | 108 | Odds Ratio (M‐H, Fixed, 95% CI) | 0.0 [0.0, 0.0] |
| 3.2 Clomiphene Citrate and Gonadotropins | 1 | 68 | Odds Ratio (M‐H, Fixed, 95% CI) | 2.75 [0.11, 69.83] |
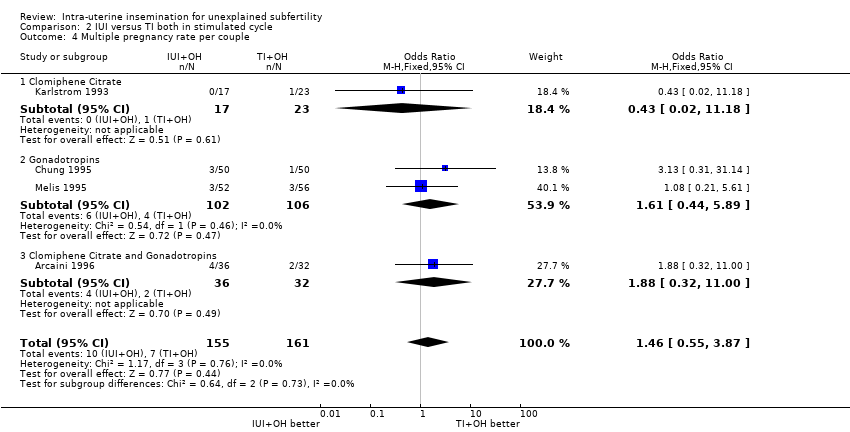
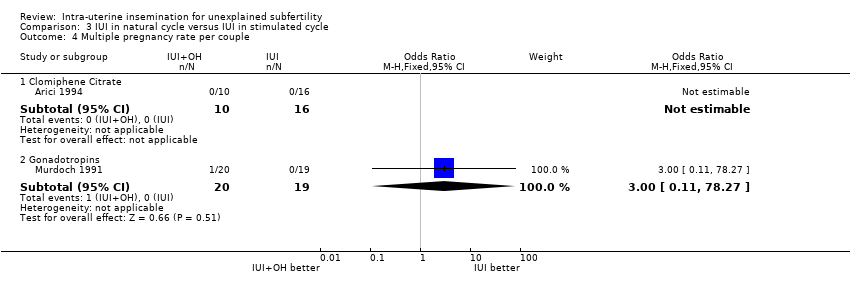
| 4 Multiple pregnancy rate per couple Show forest plot | 4 | 316 | Odds Ratio (M‐H, Fixed, 95% CI) | 1.46 [0.55, 3.87] |
| Analysis 2.4  Comparison 2 IUI versus TI both in stimulated cycle, Outcome 4 Multiple pregnancy rate per couple. | ||||
| 4.1 Clomiphene Citrate | 1 | 40 | Odds Ratio (M‐H, Fixed, 95% CI) | 0.43 [0.02, 11.18] |
| 4.2 Gonadotropins | 2 | 208 | Odds Ratio (M‐H, Fixed, 95% CI) | 1.61 [0.44, 5.89] |
| 4.3 Clomiphene Citrate and Gonadotropins | 1 | 68 | Odds Ratio (M‐H, Fixed, 95% CI) | 1.88 [0.32, 11.00] |
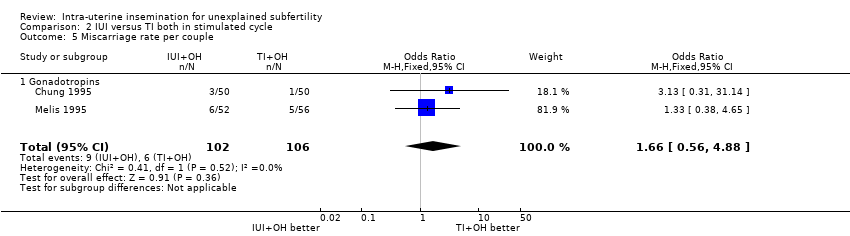
| 5 Miscarriage rate per couple Show forest plot | 2 | 208 | Odds Ratio (M‐H, Fixed, 95% CI) | 1.66 [0.56, 4.88] |
| Analysis 2.5  Comparison 2 IUI versus TI both in stimulated cycle, Outcome 5 Miscarriage rate per couple. | ||||
| 5.1 Gonadotropins | 2 | 208 | Odds Ratio (M‐H, Fixed, 95% CI) | 1.66 [0.56, 4.88] |
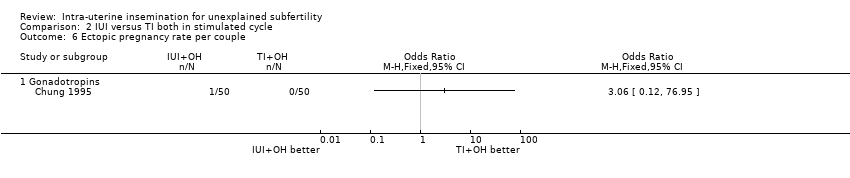
| 6 Ectopic pregnancy rate per couple Show forest plot | 1 | Odds Ratio (M‐H, Fixed, 95% CI) | Totals not selected | |
| Analysis 2.6  Comparison 2 IUI versus TI both in stimulated cycle, Outcome 6 Ectopic pregnancy rate per couple. | ||||
| 6.1 Gonadotropins | 1 | Odds Ratio (M‐H, Fixed, 95% CI) | 0.0 [0.0, 0.0] | |
| Outcome or subgroup title | No. of studies | No. of participants | Statistical method | Effect size |
| 1 Live birth rate per couple (all cycles) Show forest plot | 4 | 396 | Odds Ratio (M‐H, Fixed, 95% CI) | 2.07 [1.22, 3.50] |
| Analysis 3.1  Comparison 3 IUI in natural cycle versus IUI in stimulated cycle, Outcome 1 Live birth rate per couple (all cycles). | ||||
| 1.1 Clomiphene Citrate | 1 | 26 | Odds Ratio (M‐H, Fixed, 95% CI) | 3.75 [0.29, 47.99] |
| 1.2 Gonadotropins | 3 | 370 | Odds Ratio (M‐H, Fixed, 95% CI) | 2.02 [1.18, 3.45] |
| 2 Pregnancy rate per couple (all cycles) Show forest plot | 4 | 396 | Odds Ratio (M‐H, Fixed, 95% CI) | 2.14 [1.26, 3.61] |
| Analysis 3.2  Comparison 3 IUI in natural cycle versus IUI in stimulated cycle, Outcome 2 Pregnancy rate per couple (all cycles). | ||||
| 2.1 Clomiphene Citrate | 1 | 26 | Odds Ratio (M‐H, Fixed, 95% CI) | 6.43 [0.56, 73.35] |
| 2.2 Gonadotropins | 3 | 370 | Odds Ratio (M‐H, Fixed, 95% CI) | 2.02 [1.18, 3.45] |
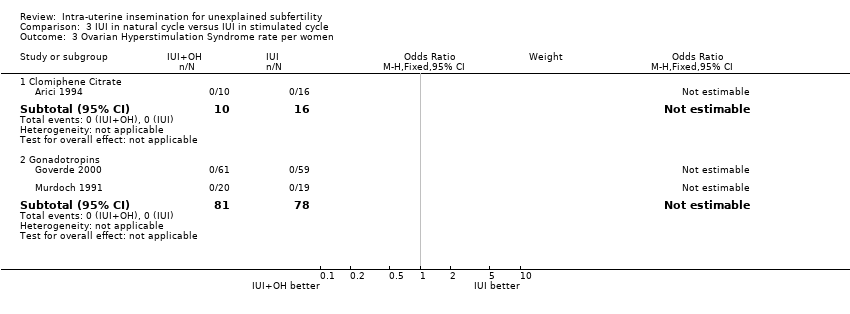
| 3 Ovarian Hyperstimulation Syndrome rate per women Show forest plot | 3 | Odds Ratio (M‐H, Fixed, 95% CI) | Subtotals only | |
| Analysis 3.3  Comparison 3 IUI in natural cycle versus IUI in stimulated cycle, Outcome 3 Ovarian Hyperstimulation Syndrome rate per women. | ||||
| 3.1 Clomiphene Citrate | 1 | 26 | Odds Ratio (M‐H, Fixed, 95% CI) | 0.0 [0.0, 0.0] |
| 3.2 Gonadotropins | 2 | 159 | Odds Ratio (M‐H, Fixed, 95% CI) | 0.0 [0.0, 0.0] |
| 4 Multiple pregnancy rate per couple Show forest plot | 2 | Odds Ratio (M‐H, Fixed, 95% CI) | Subtotals only | |
| Analysis 3.4  Comparison 3 IUI in natural cycle versus IUI in stimulated cycle, Outcome 4 Multiple pregnancy rate per couple. | ||||
| 4.1 Clomiphene Citrate | 1 | 26 | Odds Ratio (M‐H, Fixed, 95% CI) | 0.0 [0.0, 0.0] |
| 4.2 Gonadotropins | 1 | 39 | Odds Ratio (M‐H, Fixed, 95% CI) | 3.0 [0.11, 78.27] |
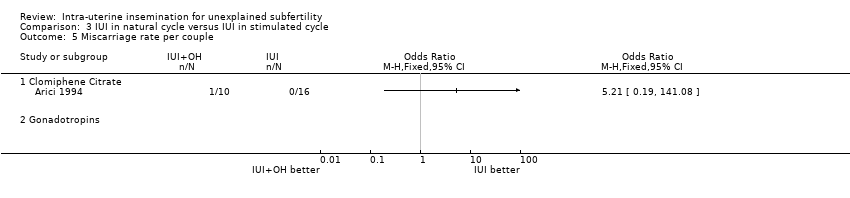
| 5 Miscarriage rate per couple Show forest plot | 1 | Odds Ratio (M‐H, Fixed, 95% CI) | Totals not selected | |
| Analysis 3.5  Comparison 3 IUI in natural cycle versus IUI in stimulated cycle, Outcome 5 Miscarriage rate per couple. | ||||
| 5.1 Clomiphene Citrate | 1 | Odds Ratio (M‐H, Fixed, 95% CI) | 0.0 [0.0, 0.0] | |
| 5.2 Gonadotropins | 0 | Odds Ratio (M‐H, Fixed, 95% CI) | 0.0 [0.0, 0.0] | |
| 6 Ectopic pregnancy rate per couple Show forest plot | 3 | Odds Ratio (M‐H, Fixed, 95% CI) | Subtotals only | |
| Analysis 3.6  Comparison 3 IUI in natural cycle versus IUI in stimulated cycle, Outcome 6 Ectopic pregnancy rate per couple. | ||||
| 6.1 Clomiphene Citrate | 1 | 26 | Odds Ratio (M‐H, Fixed, 95% CI) | 0.0 [0.0, 0.0] |
| 6.2 Gonadotropins | 2 | 250 | Odds Ratio (M‐H, Fixed, 95% CI) | 6.48 [0.33, 127.09] |
| Outcome or subgroup title | No. of studies | No. of participants | Statistical method | Effect size |
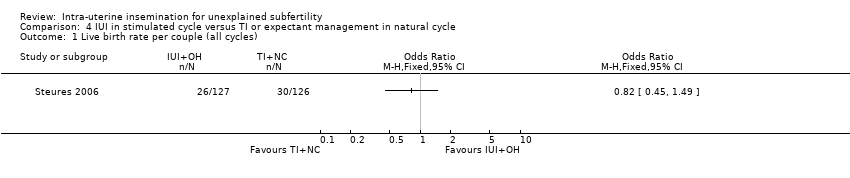
| 1 Live birth rate per couple (all cycles) Show forest plot | 1 | Odds Ratio (M‐H, Fixed, 95% CI) | Totals not selected | |
| Analysis 4.1  Comparison 4 IUI in stimulated cycle versus TI or expectant management in natural cycle, Outcome 1 Live birth rate per couple (all cycles). | ||||
| 2 Pregnancy rate per couple (all cycles) Show forest plot | 2 | Odds Ratio (M‐H, Fixed, 95% CI) | Subtotals only | |
| Analysis 4.2  Comparison 4 IUI in stimulated cycle versus TI or expectant management in natural cycle, Outcome 2 Pregnancy rate per couple (all cycles). | ||||
| 2.1 Clomiphene Citrate | 1 | 51 | Odds Ratio (M‐H, Fixed, 95% CI) | 3.2 [0.82, 12.50] |
| 2.2 Clomiphene Citrate or Gonadotropins | 1 | 253 | Odds Ratio (M‐H, Fixed, 95% CI) | 0.80 [0.45, 1.42] |
| 3 Ovarian Hyperstimulation Syndrome rate per women Show forest plot | 1 | Odds Ratio (M‐H, Fixed, 95% CI) | Totals not selected | |
| Analysis 4.3  Comparison 4 IUI in stimulated cycle versus TI or expectant management in natural cycle, Outcome 3 Ovarian Hyperstimulation Syndrome rate per women. | ||||
| 3.1 Clomiphene Citrate | 1 | Odds Ratio (M‐H, Fixed, 95% CI) | 0.0 [0.0, 0.0] | |
| 3.2 Clomiphene Citrate or Gonadotropins | 0 | Odds Ratio (M‐H, Fixed, 95% CI) | 0.0 [0.0, 0.0] | |
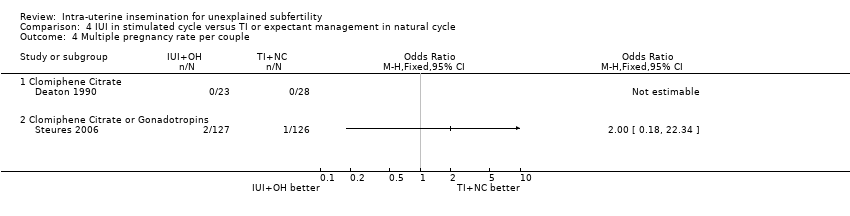
| 4 Multiple pregnancy rate per couple Show forest plot | 2 | Odds Ratio (M‐H, Fixed, 95% CI) | Totals not selected | |
| Analysis 4.4  Comparison 4 IUI in stimulated cycle versus TI or expectant management in natural cycle, Outcome 4 Multiple pregnancy rate per couple. | ||||
| 4.1 Clomiphene Citrate | 1 | Odds Ratio (M‐H, Fixed, 95% CI) | 0.0 [0.0, 0.0] | |
| 4.2 Clomiphene Citrate or Gonadotropins | 1 | Odds Ratio (M‐H, Fixed, 95% CI) | 0.0 [0.0, 0.0] | |
| 5 Miscarriage rate per couple Show forest plot | 1 | Odds Ratio (M‐H, Fixed, 95% CI) | Totals not selected | |
| Analysis 4.5  Comparison 4 IUI in stimulated cycle versus TI or expectant management in natural cycle, Outcome 5 Miscarriage rate per couple. | ||||
| Outcome or subgroup title | No. of studies | No. of participants | Statistical method | Effect size |
| 1 Live birth rate per couple (all cycles) Show forest plot | 1 | Odds Ratio (M‐H, Fixed, 95% CI) | Totals not selected | |
| Analysis 5.1  Comparison 5 IUI in natural cycle versus TI in stimulated cycle, Outcome 1 Live birth rate per couple (all cycles). | ||||
| 2 Pregnancy rate per couple (all cycles) Show forest plot | 1 | Odds Ratio (M‐H, Fixed, 95% CI) | Totals not selected | |
| Analysis 5.2  Comparison 5 IUI in natural cycle versus TI in stimulated cycle, Outcome 2 Pregnancy rate per couple (all cycles). | ||||
| 3 Multiple pregnancy rate per couple Show forest plot | 1 | Odds Ratio (M‐H, Fixed, 95% CI) | Totals not selected | |
| Analysis 5.3  Comparison 5 IUI in natural cycle versus TI in stimulated cycle, Outcome 3 Multiple pregnancy rate per couple. | ||||
| 4 Miscarriage rate per couple Show forest plot | 1 | Odds Ratio (M‐H, Fixed, 95% CI) | Totals not selected | |
| Analysis 5.4  Comparison 5 IUI in natural cycle versus TI in stimulated cycle, Outcome 4 Miscarriage rate per couple. | ||||
| 5 Ectopic pregnancy rate per couple Show forest plot | 1 | Odds Ratio (M‐H, Fixed, 95% CI) | Totals not selected | |
| Analysis 5.5  Comparison 5 IUI in natural cycle versus TI in stimulated cycle, Outcome 5 Ectopic pregnancy rate per couple. | ||||
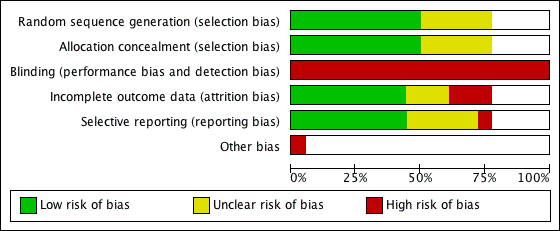
Methodological quality graph: review authors' judgements about each methodological quality item presented as percentages across all included studies.

Methodological quality summary: review authors' judgements about each methodological quality item for each included study.


Comparison 1 IUI versus TI or expectant management both in natural cycle, Outcome 1 Live birth rate per couple (all cycles).
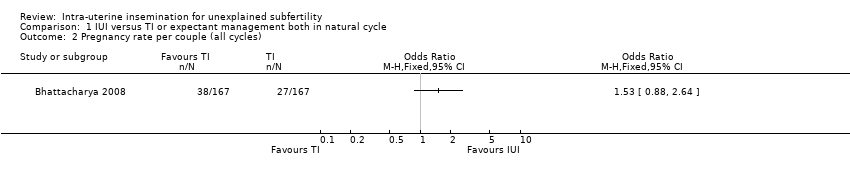
Comparison 1 IUI versus TI or expectant management both in natural cycle, Outcome 2 Pregnancy rate per couple (all cycles).
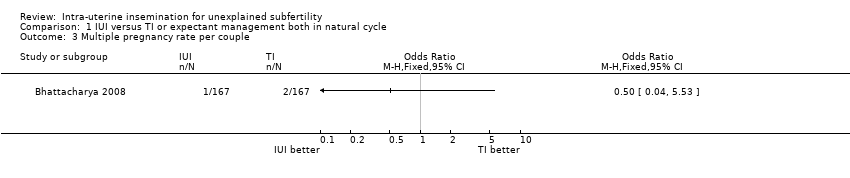
Comparison 1 IUI versus TI or expectant management both in natural cycle, Outcome 3 Multiple pregnancy rate per couple.
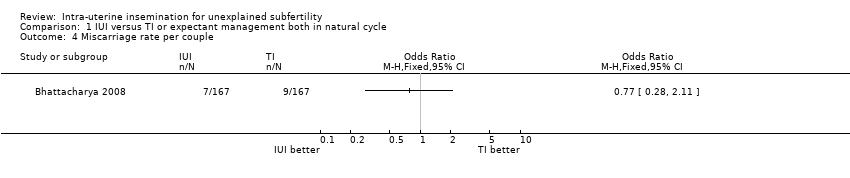
Comparison 1 IUI versus TI or expectant management both in natural cycle, Outcome 4 Miscarriage rate per couple.

Comparison 1 IUI versus TI or expectant management both in natural cycle, Outcome 5 Ectopic pregnancy rate per couple.

Comparison 2 IUI versus TI both in stimulated cycle, Outcome 1 Live birth rate per couple (all cycles).

Comparison 2 IUI versus TI both in stimulated cycle, Outcome 2 Pregnancy rate per couple (all cycles).

Comparison 2 IUI versus TI both in stimulated cycle, Outcome 3 Ovarian Hyperstimulation Syndrome rate per women.
Comparison 2 IUI versus TI both in stimulated cycle, Outcome 4 Multiple pregnancy rate per couple.
Comparison 2 IUI versus TI both in stimulated cycle, Outcome 5 Miscarriage rate per couple.
Comparison 2 IUI versus TI both in stimulated cycle, Outcome 6 Ectopic pregnancy rate per couple.

Comparison 3 IUI in natural cycle versus IUI in stimulated cycle, Outcome 1 Live birth rate per couple (all cycles).

Comparison 3 IUI in natural cycle versus IUI in stimulated cycle, Outcome 2 Pregnancy rate per couple (all cycles).
Comparison 3 IUI in natural cycle versus IUI in stimulated cycle, Outcome 3 Ovarian Hyperstimulation Syndrome rate per women.
Comparison 3 IUI in natural cycle versus IUI in stimulated cycle, Outcome 4 Multiple pregnancy rate per couple.
Comparison 3 IUI in natural cycle versus IUI in stimulated cycle, Outcome 5 Miscarriage rate per couple.

Comparison 3 IUI in natural cycle versus IUI in stimulated cycle, Outcome 6 Ectopic pregnancy rate per couple.
Comparison 4 IUI in stimulated cycle versus TI or expectant management in natural cycle, Outcome 1 Live birth rate per couple (all cycles).

Comparison 4 IUI in stimulated cycle versus TI or expectant management in natural cycle, Outcome 2 Pregnancy rate per couple (all cycles).

Comparison 4 IUI in stimulated cycle versus TI or expectant management in natural cycle, Outcome 3 Ovarian Hyperstimulation Syndrome rate per women.
Comparison 4 IUI in stimulated cycle versus TI or expectant management in natural cycle, Outcome 4 Multiple pregnancy rate per couple.

Comparison 4 IUI in stimulated cycle versus TI or expectant management in natural cycle, Outcome 5 Miscarriage rate per couple.
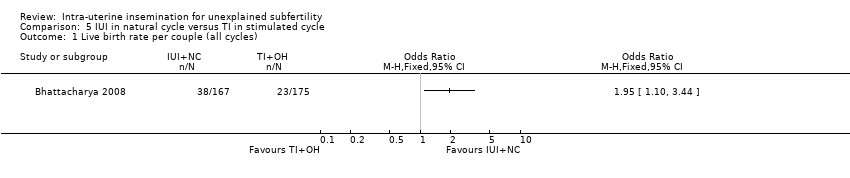
Comparison 5 IUI in natural cycle versus TI in stimulated cycle, Outcome 1 Live birth rate per couple (all cycles).

Comparison 5 IUI in natural cycle versus TI in stimulated cycle, Outcome 2 Pregnancy rate per couple (all cycles).

Comparison 5 IUI in natural cycle versus TI in stimulated cycle, Outcome 3 Multiple pregnancy rate per couple.

Comparison 5 IUI in natural cycle versus TI in stimulated cycle, Outcome 4 Miscarriage rate per couple.

Comparison 5 IUI in natural cycle versus TI in stimulated cycle, Outcome 5 Ectopic pregnancy rate per couple.
| Study ID | Randomisation method | Concealed allocation | Design | Total Pt randomised | Drop‐outs | Cancelled cycles | Intention to treat | Power calculation |
| 1. | IUI versus Timed intercourse both in natural cycle | 1 study | ||||||
| Computer generated randomisation scheme | Central telephone system | Parallel | 334 unexplained (386 total) | Total: 2 | Approximately 3% in the IUI group | Yes | Yes | |
| 2. | IUI versus Timed intercourse both in stimulated cycle | 7 studies | ||||||
| Random number table | Sealed opaque envelopes | Parallel | 140 | Total 19% | Not clear | Possible, but not representative: unbalanced groups | No | |
| Not clear | Not clear | Parallel | 68 | Total: 14 (20.6%) | 16 of 231 (7%) | Yes | No | |
| Blocked randomisation scheme | Numbered sealed envelopes | Parallel | 100 | Total: 12 (12%) | 17 of 257 (6.6%) | Yes, possible | No | |
| Not clear | Not clear | Crossover | 90 | Not clear | Not clear | Not possible | No | |
| Not clear | Not clear | Parallel | 72 | Not clear | Not clear | Yes, possible | No | |
| Not clear | Not clear | Parallel | 79 | Not clear | Not clear | Not possible | No | |
| Computer generated random number list | Numbered sealed envelopes | Parallel | 108 | Total: 5 (4.6%) | Not clear | Not possible | No | |
| 3. | IUI in natural cycle versus IUI in stimulated cycle | |||||||
| Random number table | Computer system utilising locked files | Crossover | 26 | 1st cycle: 0 (0%) | Not clear | Yes, possible | No | |
| Computer generated randomisation schedule | Numbered, masked and sealed envelopes | Parallel | 120 | Not clear | Not clear | Not clear | Yes | |
| Computer generated permuted block procedure | Computer system utilising locked files | Parallel | 211 unexplained | 72 (15.5%) | 130 (5.6%) | Not possible | No | |
| Random number sequence | Sequentially numbered opaque sealed envelopes | Parallel | 39 | Total: 5 (13%) | 30 of 111 (27%) | Yes, possible | No | |
| 4. | IUI with OH versus TI in natural cycle | 1 study | ||||||
| Not clear | Not clear | Crossover | 51 | Not clear | Not clear | Not possible | No | |
| Computer generated randomisation sequence in balanced blocks | Opaque sealed envelopes | Parallel | 253 | Not clear | 63 (14%) | Yes | Yes | |
| 5. | IUI in natural cycle versus TI with OH | No studies | ||||||
| Computer generated randomisation scheme | Central telephone system | Parallel | 342 unexplained (387 total) | Total: 4 2 in both groups | Approximately 4% in clomiphene group | Yes | Yes |
| Study ID | Age distribution | Subfertility years | Prim/Sec infertility | Previous treatment | Stimulation Method | Single insemination |
| 1. | IUI versus Timed intercourse both in natural cycle | 1 study | ||||
| TI+NC: 32 (±3.4) IUI+NC: 32 (±3.7) | TI+NC: 30 (25 ‐ 38) | Mixed 117/386 (30%) | Not stated | No stimulation | Single | |
| 2. | IUI versus Timed intercourse both in stimulated cycle | 7 studies | ||||
| IUI+OH: 29.52 (±3.65) | IUI+OH: 4.91(±2.72) | Mixed | No | CC 50‐150 mg | Single | |
| IUI+OH: 34.6 (±4.9) | IUI+OH: 4.2 (±1.6) | Mixed | Not stated | High dose: CC100mg and hMG 75‐225IU | Double | |
| IUI+OH: 31.8 (±3.1) | IUI+OH: 4.7 (±2.0) | Not clear | Not stated | hMG 150IU starting dose and GnRHa | IUI: Single | |
| < 38 yrs | > 3 yrs | Not clear | Probably | Not stated | Not stated | |
| Not stated | > 3 yrs | Not clear | Not stated | hMG (10 amp per cycle) | Not stated | |
| 32 (range 21‐38) | 5 (range 2‐14) | Mixed | No | hMG (low dose step up) 75 IU starting dose OR CC 100mg | IUI: Single | |
| 33.1 (±5.2) | 4.3 (±1.4) | Not clear | Yes, all patients | High dose: FSH 225IU | Single | |
| 3. | IUI in natural cycle versus IUI in stimulated cycle | |||||
| 33 (range 24‐41) | 3.5 (range 1‐15) | Not clear | No | CC 50 mg | IUI+NC: Double | |
| IUI+NC: 31.6 (±3.7) | IUI+NC: 3.9 (±1.7) | Mixed | Not stated | hMG 75IU starting dose | Single | |
| IUI+NC: 32 (±4) | IUI+NC: 3.8 (±2.6) | Mixed | No | FSH 150IU | Single | |
| IUI+NC: 30.5 (±3.1) IUI+OH: 30.1 (±2.9) | IUI+NC: 5.7 (±2.4) | Mixed | No | hMG (low dose) 75IU + GnRHa | IUI+OH: Single | |
| 4. | IUI with OH versus TI in natural cycle | 1 study | ||||
| 33 (±4.0) | 3.5 (±1.7) | Mixed | Not stated | CC 50 mg | Single | |
| IUI+OH: 33 (±3.4) | IUI+OH: 2.0 (±0.5) | Mixed | Not stated | FSH 37‐150 IU or CC 50‐150 mg | Not stated | |
| 5. | IUI in natural cycle versus TI with OH | |||||
| TI+OH: 32 (±3.5) IUI+NC: 32 (±3.7) | TI+OH: 30 (24 ‐ 38) | Mixed | Not stated | CC 25‐50 mg | Single | |
| * Mean age in years (± SD) or range | * Mean duration in years (± SD) or range | * Daily dose |
| Analysis | Number of studies | OR | 95% CI | Heterogeneity (P) | I2 (%) | |
| LIVE BIRTH RATE | Main analysis | 2 | 1.59 | 0.88 ‐ 2.88 | 0.06 | 71.7 |
| Not by ITT | 2 | 1.46 | 0.80 ‐ 2.66 | 0.06 | 71 | |
| Random effect | 2 | 1.65 | 0.52 ‐ 5.23 | 0.06 | 71.7 | |
| Agarwal 2004 included | 3 | 0.81 | 0.51 ‐ 1.28 | 0.0002 | 88.2 | |
| PREGNANCY RATE | Main analysis | 10 | 1.68 | 1.13 ‐ 2.50 | 0.40 | 4.7 |
| Not by ITT | 10 | 1.63 | 1.09 ‐ 2.43 | 0.39 | 5.5 | |
| Random effect | 10 | 1.71 | 1.11‐ 2.63 | 0.40 | 4.7 | |
| Agarwal 2004 included | 11 | 1.09 | 0.77 ‐ 1.54 | 0.001 | 65.4 | |
| Adequate methodology | 2 | 1.70 | 0.96 ‐ 3.02 | 0.06 | 71.7 | |
| Previous treatment excluded | 9 | 2.00 | 1.26 ‐ 3.20 | 0.50 | 0 | |
| Calculated data excluded | 9 | 1.69 | 1.11 ‐ 2.59 | 0.31 | 15.2 | |
| Trials including pt with endometriosis excluded | 8 | 1.81 | 1.19 ‐ 2.76 | 0.42 | 1.7 | |
| Duration of subfertility at least 3 years | 7 | 1.67 | 1.05 ‐ 2.66 | 0.37 | 7.1 | |
| Duration of treatment: First cycle only | 7 | 1.48 | 0.71 ‐ 3.11 | 0.48 | 0 | |
| Duration of treatment: 1 ‐ 3 Cycles | 9 | 1.54 | 1.00 ‐ 2.38 | 0.38 | 6.5 | |
| Duration of treatment: > 3 Cycles | 1 | 2.62 | 0.98 ‐ 6.98 | NA | NA | |
| Ovarian hyperstimulation: Clomiphene | 1 | 0.30 | 0.03 ‐ 2.93 | NA | NA | |
| Ovarian hyperstimulation: Gonadotropins | 4 | 1.68 | 1.03 ‐ 2.75 | 0.32 | 15.2 | |
| ADVERSE EVENTS | Multiple pregnancy rate | 4 | 1.46 | 0.55 ‐ 3.87 | 0.76 | 0 |
| Miscarriage rate | 2 | 1.66 | 0.56 ‐ 4.88 | 0.52 | 0 | |
| Ectopic pregnancy rate (only 1 event) | 3 | 3.06 | 0.12 ‐ 76.95 | NA | NA | |
| OHSS rate | 2 | 2.75 | 0.11 ‐ 69.83 | NA | NA |
| Analysis | Number of studies | OR | 95% CI | Heterogeneity (p) | I2 (%) | |
| LIVE BIRTH RATE | Main analysis | 4 | 2.07 | 1.22 ‐ 3.50 | 0.55 | 0 |
| Not by ITT | 4 | 2.02 | 1.19 ‐ 3.42 | 0.53 | 0 | |
| Random effect | 4 | 2.08 | 1.22 ‐ 3.54 | 0.55 | 0 | |
| Cross over trials excluded | 3 | 2.02 | 1.18 ‐ 3.45 | 0.39 | 0 | |
| Adequate Methodology | 3 | 1.69 | 0.83 ‐ 3.44 | 0.47 | 0 | |
| Endometriosis (Arici 1994, Guzick 1999 excl) | 2 | 1.57 | 0.75 ‐ 3.32 | 0.29 | 9.4 | |
| Ovarian hyperstimulation: Clomiphene | 1 | 3.75 | 0.29 ‐ 47.99 | NA | NA | |
| Ovarian hyperstimulation: Gonadotropins | 3 | 2.02 | 1.18 ‐ 3.45 | 0.39 | 0 | |
| Duration of treatment: First cycle only | 1 | 3.75 | 0.29 ‐ 47.99 | NA | NA | |
| PREGNANCY RATE | Main analysis (PR+LB) | 4 | 2.14 | 1.26 ‐ 3.61 | 0.44 | 0 |
| Pregnancy rates only | 2 | 1.74 | 0.38 ‐ 8.01 | 0.13 | 55.6 | |
| Not by ITT | 4 | 2.08 | 1.23 ‐ 3.52 | 0.41 | 0 | |
| Random effect | 4 | 2.14 | 1.25 ‐ 3.64 | 0.44 | 0 | |
| Duration of treatment: First cycle only | 4 | 2.14 | 1.26 ‐ 3.61 | 0.44 | 0 | |
| ADVERSE EVENTS | Multiple pregnancy rate | 2 | 3.0 | 0.11 ‐ 78.27 | NA | NA |
| Miscarriage rate | 1 | 5.21 | 0.19 ‐ 141.08 | NA | NA | |
| Ectopic pregnancy rate | 3 | 6.48 | 0.33 ‐ 127.09 | NA | NA | |
| OHSS rate | 3 | No events | NA | NA |
| Outcome or subgroup title | No. of studies | No. of participants | Statistical method | Effect size |
| 1 Live birth rate per couple (all cycles) Show forest plot | 1 | Odds Ratio (M‐H, Fixed, 95% CI) | Totals not selected | |
| 2 Pregnancy rate per couple (all cycles) Show forest plot | 1 | Odds Ratio (M‐H, Fixed, 95% CI) | Totals not selected | |
| 3 Multiple pregnancy rate per couple Show forest plot | 1 | Odds Ratio (M‐H, Fixed, 95% CI) | Totals not selected | |
| 4 Miscarriage rate per couple Show forest plot | 1 | Odds Ratio (M‐H, Fixed, 95% CI) | Totals not selected | |
| 5 Ectopic pregnancy rate per couple Show forest plot | 1 | Odds Ratio (M‐H, Fixed, 95% CI) | Totals not selected | |
| Outcome or subgroup title | No. of studies | No. of participants | Statistical method | Effect size |
| 1 Live birth rate per couple (all cycles) Show forest plot | 2 | 208 | Odds Ratio (M‐H, Fixed, 95% CI) | 1.59 [0.88, 2.88] |
| 1.1 Gonadotropins | 2 | 208 | Odds Ratio (M‐H, Fixed, 95% CI) | 1.59 [0.88, 2.88] |
| 2 Pregnancy rate per couple (all cycles) Show forest plot | 10 | 517 | Odds Ratio (M‐H, Fixed, 95% CI) | 1.68 [1.13, 2.50] |
| 2.1 Clomiphene Citrate | 1 | 40 | Odds Ratio (M‐H, Fixed, 95% CI) | 0.30 [0.03, 2.93] |
| 2.2 Gonadotropins | 4 | 319 | Odds Ratio (M‐H, Fixed, 95% CI) | 1.68 [1.03, 2.75] |
| 2.3 Clomiphene Citrate and Gonadotropins | 1 | 68 | Odds Ratio (M‐H, Fixed, 95% CI) | 2.62 [0.98, 6.98] |
| 2.4 Clomiphene citrate OR Gonadotropins | 4 | 90 | Odds Ratio (M‐H, Fixed, 95% CI) | 1.62 [0.52, 5.05] |
| 3 Ovarian Hyperstimulation Syndrome rate per women Show forest plot | 2 | Odds Ratio (M‐H, Fixed, 95% CI) | Subtotals only | |
| 3.1 Gonadotropins | 1 | 108 | Odds Ratio (M‐H, Fixed, 95% CI) | 0.0 [0.0, 0.0] |
| 3.2 Clomiphene Citrate and Gonadotropins | 1 | 68 | Odds Ratio (M‐H, Fixed, 95% CI) | 2.75 [0.11, 69.83] |
| 4 Multiple pregnancy rate per couple Show forest plot | 4 | 316 | Odds Ratio (M‐H, Fixed, 95% CI) | 1.46 [0.55, 3.87] |
| 4.1 Clomiphene Citrate | 1 | 40 | Odds Ratio (M‐H, Fixed, 95% CI) | 0.43 [0.02, 11.18] |
| 4.2 Gonadotropins | 2 | 208 | Odds Ratio (M‐H, Fixed, 95% CI) | 1.61 [0.44, 5.89] |
| 4.3 Clomiphene Citrate and Gonadotropins | 1 | 68 | Odds Ratio (M‐H, Fixed, 95% CI) | 1.88 [0.32, 11.00] |
| 5 Miscarriage rate per couple Show forest plot | 2 | 208 | Odds Ratio (M‐H, Fixed, 95% CI) | 1.66 [0.56, 4.88] |
| 5.1 Gonadotropins | 2 | 208 | Odds Ratio (M‐H, Fixed, 95% CI) | 1.66 [0.56, 4.88] |
| 6 Ectopic pregnancy rate per couple Show forest plot | 1 | Odds Ratio (M‐H, Fixed, 95% CI) | Totals not selected | |
| 6.1 Gonadotropins | 1 | Odds Ratio (M‐H, Fixed, 95% CI) | 0.0 [0.0, 0.0] | |
| Outcome or subgroup title | No. of studies | No. of participants | Statistical method | Effect size |
| 1 Live birth rate per couple (all cycles) Show forest plot | 4 | 396 | Odds Ratio (M‐H, Fixed, 95% CI) | 2.07 [1.22, 3.50] |
| 1.1 Clomiphene Citrate | 1 | 26 | Odds Ratio (M‐H, Fixed, 95% CI) | 3.75 [0.29, 47.99] |
| 1.2 Gonadotropins | 3 | 370 | Odds Ratio (M‐H, Fixed, 95% CI) | 2.02 [1.18, 3.45] |
| 2 Pregnancy rate per couple (all cycles) Show forest plot | 4 | 396 | Odds Ratio (M‐H, Fixed, 95% CI) | 2.14 [1.26, 3.61] |
| 2.1 Clomiphene Citrate | 1 | 26 | Odds Ratio (M‐H, Fixed, 95% CI) | 6.43 [0.56, 73.35] |
| 2.2 Gonadotropins | 3 | 370 | Odds Ratio (M‐H, Fixed, 95% CI) | 2.02 [1.18, 3.45] |
| 3 Ovarian Hyperstimulation Syndrome rate per women Show forest plot | 3 | Odds Ratio (M‐H, Fixed, 95% CI) | Subtotals only | |
| 3.1 Clomiphene Citrate | 1 | 26 | Odds Ratio (M‐H, Fixed, 95% CI) | 0.0 [0.0, 0.0] |
| 3.2 Gonadotropins | 2 | 159 | Odds Ratio (M‐H, Fixed, 95% CI) | 0.0 [0.0, 0.0] |
| 4 Multiple pregnancy rate per couple Show forest plot | 2 | Odds Ratio (M‐H, Fixed, 95% CI) | Subtotals only | |
| 4.1 Clomiphene Citrate | 1 | 26 | Odds Ratio (M‐H, Fixed, 95% CI) | 0.0 [0.0, 0.0] |
| 4.2 Gonadotropins | 1 | 39 | Odds Ratio (M‐H, Fixed, 95% CI) | 3.0 [0.11, 78.27] |
| 5 Miscarriage rate per couple Show forest plot | 1 | Odds Ratio (M‐H, Fixed, 95% CI) | Totals not selected | |
| 5.1 Clomiphene Citrate | 1 | Odds Ratio (M‐H, Fixed, 95% CI) | 0.0 [0.0, 0.0] | |
| 5.2 Gonadotropins | 0 | Odds Ratio (M‐H, Fixed, 95% CI) | 0.0 [0.0, 0.0] | |
| 6 Ectopic pregnancy rate per couple Show forest plot | 3 | Odds Ratio (M‐H, Fixed, 95% CI) | Subtotals only | |
| 6.1 Clomiphene Citrate | 1 | 26 | Odds Ratio (M‐H, Fixed, 95% CI) | 0.0 [0.0, 0.0] |
| 6.2 Gonadotropins | 2 | 250 | Odds Ratio (M‐H, Fixed, 95% CI) | 6.48 [0.33, 127.09] |
| Outcome or subgroup title | No. of studies | No. of participants | Statistical method | Effect size |
| 1 Live birth rate per couple (all cycles) Show forest plot | 1 | Odds Ratio (M‐H, Fixed, 95% CI) | Totals not selected | |
| 2 Pregnancy rate per couple (all cycles) Show forest plot | 2 | Odds Ratio (M‐H, Fixed, 95% CI) | Subtotals only | |
| 2.1 Clomiphene Citrate | 1 | 51 | Odds Ratio (M‐H, Fixed, 95% CI) | 3.2 [0.82, 12.50] |
| 2.2 Clomiphene Citrate or Gonadotropins | 1 | 253 | Odds Ratio (M‐H, Fixed, 95% CI) | 0.80 [0.45, 1.42] |
| 3 Ovarian Hyperstimulation Syndrome rate per women Show forest plot | 1 | Odds Ratio (M‐H, Fixed, 95% CI) | Totals not selected | |
| 3.1 Clomiphene Citrate | 1 | Odds Ratio (M‐H, Fixed, 95% CI) | 0.0 [0.0, 0.0] | |
| 3.2 Clomiphene Citrate or Gonadotropins | 0 | Odds Ratio (M‐H, Fixed, 95% CI) | 0.0 [0.0, 0.0] | |
| 4 Multiple pregnancy rate per couple Show forest plot | 2 | Odds Ratio (M‐H, Fixed, 95% CI) | Totals not selected | |
| 4.1 Clomiphene Citrate | 1 | Odds Ratio (M‐H, Fixed, 95% CI) | 0.0 [0.0, 0.0] | |
| 4.2 Clomiphene Citrate or Gonadotropins | 1 | Odds Ratio (M‐H, Fixed, 95% CI) | 0.0 [0.0, 0.0] | |
| 5 Miscarriage rate per couple Show forest plot | 1 | Odds Ratio (M‐H, Fixed, 95% CI) | Totals not selected | |
| Outcome or subgroup title | No. of studies | No. of participants | Statistical method | Effect size |
| 1 Live birth rate per couple (all cycles) Show forest plot | 1 | Odds Ratio (M‐H, Fixed, 95% CI) | Totals not selected | |
| 2 Pregnancy rate per couple (all cycles) Show forest plot | 1 | Odds Ratio (M‐H, Fixed, 95% CI) | Totals not selected | |
| 3 Multiple pregnancy rate per couple Show forest plot | 1 | Odds Ratio (M‐H, Fixed, 95% CI) | Totals not selected | |
| 4 Miscarriage rate per couple Show forest plot | 1 | Odds Ratio (M‐H, Fixed, 95% CI) | Totals not selected | |
| 5 Ectopic pregnancy rate per couple Show forest plot | 1 | Odds Ratio (M‐H, Fixed, 95% CI) | Totals not selected | |