Contenido relacionado
Revisiones y protocolos relacionados
Reuben Olugbenga Ayeleke, Joyce Danielle Asseler, Ben J Cohlen, Susanne M Veltman‐Verhulst | 3 marzo 2020
Esmée M Bordewijk, Marleen Nahuis, Michael F Costello, Fulco Van der Veen, Leopoldo O Tso, Ben Willem J Mol, Madelon van Wely | 24 enero 2017
Sesh Kamal Sunkara, Mohan S Kamath, Zabeena Pandian, Ahmed Gibreel, Siladitya Bhattacharya | 27 septiembre 2023
Lara C Morley, Thomas Tang, Ephia Yasmin, Robert J Norman, Adam H Balen | 28 noviembre 2017
Edward Hughes, Julie Brown, John J Collins, Patrick Vanderkerchove | 20 enero 2010
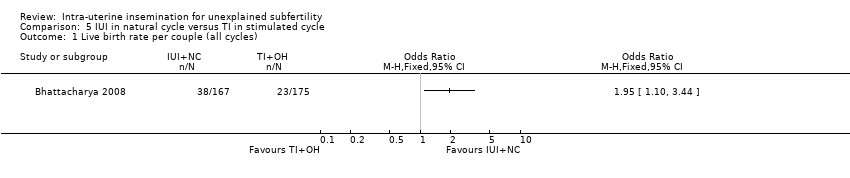
Maartje Cissen, Alexandra Bensdorp, Ben J Cohlen, Sjoerd Repping, Jan Peter de Bruin, Madelon van Wely | 26 febrero 2016
Nienke S Weiss, Elena Kostova, Marleen Nahuis, Ben Willem J Mol, Fulco van der Veen, Madelon van Wely | 16 enero 2019
Lidija Rakic, Elena Kostova, Ben J Cohlen, Astrid EP Cantineau | 14 julio 2021
Jan Bosteels, Steven Weyers, Thomas M D'Hooghe, Helen Torrance, Frank J Broekmans, Su Jen Chua, Ben Willem J Mol | 27 noviembre 2017
Esmée M Bordewijk, Ka Ying Bonnie Ng, Lidija Rakic, Ben Willem J Mol, Julie Brown, Tineke J Crawford, Madelon van Wely | 11 febrero 2020