Monoterapia con valproato de sodio versus fenitoína para la epilepsia: una revisión de datos de participantes individuales
Resumen
Antecedentes
La epilepsia es una afección neurológica frecuente en la que descargas eléctricas anormales del cerebro provocan convulsiones espontáneas recurrentes. Se considera que con un tratamiento farmacológico efectivo, hasta el 70% de los pacientes con epilepsia activa tienen la posibilidad de estar libres de convulsiones y entrar en remisión durante un largo plazo poco después de iniciar el tratamiento farmacológico con un solo fármaco antiepiléptico como monoterapia.
En todo el mundo, el valproato de sodio y la fenitoína se utilizan comúnmente como fármacos antiepilépticos para el tratamiento de monoterapia. En general, se cree que la fenitoína es más efectiva para las convulsiones de comienzo focal, y que el valproato de sodio es más efectivo para las convulsiones tónico‐clónicas de comienzo generalizado (con o sin otros tipos de convulsiones generalizadas). Esta revisión es una de una serie de revisiones Cochrane que estudia las comparaciones por pares de monoterapias. Esta es la última versión actualizada de la revisión publicada por primera vez en 2001, y actualizada en 2013 y 2016.
Objetivos
Revisar el tiempo transcurrido hasta el fracaso del tratamiento, la remisión y la primera convulsión del valproato de sodio en comparación con la fenitoína cuando se utiliza como monoterapia en pacientes con convulsiones de comienzo focal o convulsiones tónico‐clónicas generalizadas (con o sin otros tipos de convulsiones generalizadas).
Métodos de búsqueda
Se realizaron búsquedas en el registro especializado del Grupo Cochrane de Epilepsia (Cochrane Epilepsy Group), el Registro Cochrane Central de Ensayos Controlados (Cochrane Central Register of Controlled Trials, CENTRAL), MEDLINE, ClinicalTrials.gov y en la World Health Organization (WHO) International Clinical Trials Registry Platform ICTRP el 19 de febrero de 2018. Se hicieron búsquedas manuales en revistas relevantes y se estableció contacto con compañías farmacéuticas, investigadores de ensayos originales y expertos en el tema.
Criterios de selección
Ensayos controlados aleatorizados (ECA) que comparan la monoterapia con valproato de sodio o fenitoína en niños o adultos con convulsiones de inicio focal o convulsiones tónico‐clónicas de inicio generalizado
Obtención y análisis de los datos
Ésta fue una revisión de datos de pacientes individuales (DPI). El resultado primario fue el tiempo transcurrido hasta el fracaso del tratamiento y los resultados secundarios fueron el tiempo transcurrido hasta la primera convulsión después de la asignación al azar, el tiempo transcurrido hasta la remisión a los seis y doce meses, y la incidencia de eventos adversos. Se utilizaron los modelos de regresión de riesgos proporcionales de Cox para obtener las estimaciones específicas de los ensayos de los cocientes de riesgos instantáneos (CRI) con intervalos de confianza (IC) del 95% mediante el método de la varianza inversa genérica para obtener los CRI y los IC del 95% agrupados generales.
Resultados principales
Se incluyeron 11 ensayos en esta revisión y se dispuso de DPI para 669 individuos de 1119 individuos elegibles de cinco de los 11 ensayos, el 60% de los datos potenciales. Los resultados se aplican a las convulsiones de inicio focal (convulsiones tónico‐clónicas generalizadas simples, complejas y secundarias) y a las convulsiones tónico‐clónicas generalizadas, pero no a otros tipos de convulsiones generalizadas (tipos de convulsiones de ausencia o mioclónicas). Para los resultados de remisión, un CRI inferior a 1 indica una ventaja para la fenitoína, y para los resultados de la primera convulsión y el fracaso del tratamiento un CRI inferior a 1 indica una ventaja para el valproato sódico.
Los principales resultados generales fueron: tiempo transcurrido hasta el fracaso del tratamiento por cualquier motivo relacionado con el mismo (CRI agrupado ajustado por el tipo de convulsiones 0,88; IC del 95%: 0,61 a 1,27; cinco estudios; 528 participantes; evidencia de calidad moderada), tiempo transcurrido hasta el fracaso del tratamiento debido a eventos adversos (CRI agrupado ajustado por el tipo de convulsiones 0,77, IC del 95% 0,44 a 1,37; cuatro estudios; 418 participantes; evidencia de calidad moderada), tiempo transcurrido hasta el fracaso del tratamiento debido a la falta de eficacia (CRI agrupado para todos los participantes 1,16 (IC del 95% 0,71 a 1,89; cinco estudios; 451 participantes; evidencia de calidad moderada). Estos resultados sugieren que el fracaso del tratamiento por cualquier razón relacionada con el tratamiento y el fracaso del tratamiento debido a eventos adversos puede ocurrir antes con la fenitoína que con el valproato de sodio, mientras que el fracaso del tratamiento debido a la falta de eficacia puede ocurrir antes con el valproato de sodio que con la fenitoína; sin embargo, ninguno de estos resultados fue estadísticamente significativo.
Los resultados del tiempo transcurrido hasta la primera convulsión (CRI agrupado ajustado por el tipo de convulsión 1,08; IC del 95%: 0,88 a 1,33; cinco estudios; 639 participantes; evidencia de baja calidad) sugieren que la primera recurrencia de la convulsión puede ocurrir un poco antes con el valproato de sodio en comparación con la fenitoína. No hubo diferencias claras entre los fármacos en cuanto al tiempo hasta la remisión a 12 meses (CRI combinado ajustado para el tipo de convulsiones 1,02; IC del 95%: 0,81 a 1,28; cuatro estudios; 514 participantes; evidencia de calidad moderada) y el tiempo hasta la remisión a seis meses (CRI combinado ajustado para el tipo de convulsiones 1,05; IC del 95%: 0,86 a 1,27; cinco estudios; 639 participantes; evidencia de calidad moderada).
Se disponía de información limitada con respecto a los eventos adversos en los ensayos y no se pudieron hacer comparaciones entre las tasas de eventos adversos del valproato de sodio y la fenitoína. Algunos eventos adversos informados con ambos fármacos fueron somnolencia, sarpullido, mareos, náuseas y problemas gastrointestinales. También se informó de un aumento de peso con el valproato de sodio y se informó de una hipertrofia/hiperplasia gingival con la fenitoína.
La calidad metodológica de los ensayos incluidos era generalmente buena, sin embargo, cuatro de los cinco ensayos que proporcionaban DPI para el análisis eran de diseño abierto, por lo que todos los resultados corrían el riesgo de sesgo de detección. También hubo evidencia de que la clasificación errónea del tipo de convulsión puede haber confundido los resultados de esta revisión, en particular, para el resultado "tiempo hasta la primera convulsión" y la heterogeneidad estuvo presente en el análisis de los resultados del fracaso del tratamiento, que no pudo explicarse por el análisis de subgrupos por tipo de epilepsia o por el análisis de sensibilidad para la clasificación errónea del tipo de convulsión. Por lo tanto, para los resultados de fracaso del tratamiento, se juzgó que la calidad de la evidencia era de moderada a baja, para el "tiempo hasta la primera convulsión" se juzgó que la calidad de la evidencia era baja, y para los resultados de remisión, se juzgó que la calidad de la evidencia era moderada.
Conclusiones de los autores
No se ha encontrado evidencia de que exista una diferencia significativa entre el valproato y la fenitoína para ninguno de los resultados examinados en esta revisión. Sin embargo, el sesgo de detección, el sesgo de clasificación y la heterogeneidad pueden haber influido en los resultados de esta revisión. No se encontró ninguna evidencia rotunda para apoyar o refutar las políticas de tratamiento actuales. Se recomienda que los ensayos futuros se diseñen con la mayor calidad posible, teniendo en cuenta el enmascaramiento, la elección de la población, la clasificación del tipo de convulsión, la duración del seguimiento, la elección de los resultados y el análisis, y la presentación de los resultados.
PICO
Resumen en términos sencillos
Monoterapia con valproato de sodio versus fenitoína (tratamiento con un solo fármaco) para la epilepsia
Esta es una versión actualizada de la revisión Cochrane publicada anteriormente en el Número 4, 2016 de la Base de Datos Cochrane de Revisiones Sistemáticas (Cochrane Database of Systematic Reviews).
Antecedentes
La epilepsia es un trastorno neurológico frecuente en el que las descargas eléctricas anormales en el cerebro provocan convulsiones recurrentes. En esta revisión, se estudiaron dos tipos de crisis epilépticas: las convulsiones de inicio generalizado, en las que las descargas eléctricas comienzan en una parte del cerebro y se desplazan por todo el cerebro; y las convulsiones de inicio focal, en las que las convulsiones se generan en una parte del cerebro y afectan a una parte de éste (todo el hemisferio cerebral o parte de un lóbulo del cerebro). Las convulsiones focales se pueden generalizar (generalización secundaria) y desplazarse desde una parte del cerebro a través de todo el cerebro. En aproximadamente el 70% de los pacientes con epilepsia, un solo fármaco antiepiléptico puede controlar las convulsiones generalizadas o focales.
Objetivo
El valproato de sodio y la fenitoína son tratamientos comúnmente usados para los individuos con epilepsia. El objetivo de esta revisión fue comparar cuán efectivos son estos fármacos para controlar las convulsiones y si los individuos deciden dejar de tomar estos tratamientos (fracaso del tratamiento), para informar una elección entre estos fármacos.
Métodos
La última búsqueda de ensayos para esta revisión fue el 19 de febrero de 2018. Se evaluó la evidencia de 11 ensayos clínicos controlados aleatorizados que comparaban el valproato de sodio con la fenitoína y se pudieron combinar los datos de 699 pacientes de cinco de los 11 ensayos; para las 450 pacientes restantes de seis ensayos, los datos no estaban disponibles para su uso en esta revisión.
Resultados clave
Esta revisión de ensayos no encontró diferencias entre estos dos fármacos para los tipos de convulsiones estudiados en cuanto a los resultados del fracaso del tratamiento (retirada del tratamiento) y el control de las convulsiones (recurrencia de las convulsiones o logro de un período libre de convulsiones (remisión) de seis o 12 meses). La revisión tampoco encontró evidencia que apoye o refute la política de utilizar el valproato de sodio para las convulsiones tónico‐clónicas de comienzo generalizado y la fenitoína para las convulsiones de comienzo focal.
Sin embargo, hasta el 49% de los pacientes en los ensayos clasificados como con convulsiones generalizadas pueden haber tenido un diagnóstico erróneo del tipo de convulsión y estos pacientes pueden haber estado experimentando convulsiones focales o un tipo de convulsión incierto, y esta clasificación errónea puede haber influido en los resultados de esta revisión. No se pudo abordar el tema de la preferencia del valproato de sodio para los tipos de convulsiones de inicio generalizado que no sean tónico‐clónicas, como las ausencias o las convulsiones mioclónicas.
Calidad de la evidencia
La calidad de la evidencia se consideró moderada a baja para el fracaso del tratamiento, moderada para los resultados de remisión y baja para los resultados de convulsiones, ya que es probable que la clasificación errónea del tipo de convulsión influyera en los resultados de la revisión. En cuatro de los cinco ensayos que proporcionaron datos para esta revisión, el diseño del ensayo permitió que los pacientes y los médicos tratantes supieran qué medicación tomaban. Este diseño puede haber influido en los resultados.
Conclusiones
El valproato de sodio y la fenitoína se utilizan comúnmente como tratamientos para los individuos con epilepsia, pero no se encontraron diferencias entre estos tratamientos para los resultados de esta revisión o entre los tipos de convulsiones. Se necesita más información y se recomienda que todos los ensayos futuros que comparen estos fármacos, o cualquier otro medicamento antiepiléptico, se diseñen utilizando métodos de alta calidad. Los tipos de crisis epilépticas de los pacientes incluidos en los ensayos también deben clasificarse muy cuidadosamente para asegurar que los resultados sean también de alta calidad.
Authors' conclusions
Summary of findings
| Sodium valproate compared with phenytoin monotherapy for epilepsy | ||||||
| Patient or population: adults and children with newly‐onset focal onset or generalised tonic‐clonic seizures Settings: outpatients Intervention: sodium valproate Comparison: phenytoin | ||||||
| Outcomes | Illustrative comparative risks* (95% CI) | Relative effect | No. of Participants | Quality of the evidence | Comments | |
| Assumed risk | Corresponding risk | |||||
| Phenytoin | Sodium valproate | |||||
| Time to treatment failure (any reason related to treatment) All participants Range of follow‐up: 0 to 4256 days | The median time to treatment failure was 2361 days in the phenytoin group | The median time to treatment failure was 2545 days (184 days longer) in the sodium valproate group | HR 0.88 (0.61 to 1.27)a | 528 | ⊕⊕⊕⊝ | HR < 1 indicates a clinical advantage for valproate There was also no statistically significant difference between drugs in treatment failure due to adverse events: HR 0.77 (95% CI 0.44 to 1.37, P = 0.38) or treatment failure due to lack of efficacy: HR 1.16 (95% CI 0.71 to 1.89, P = 0.55) |
| Time to treatment failure (any reason related to treatment) Subgroup: focal onset seizures Range of follow‐up: 0 to 4256 days | The median time to treatment failure was 1838 days in the phenytoin group | The median time to treatment failure was 1772 days (66 days shorter) in the sodium valproate group | HR 0.83 (0.50 to 1.38) | 187 (4 studies) | ⊕⊕⊕⊝ | HR < 1 indicates a clinical advantage for valproate There was also no statistically significant difference between drugs in treatment failure due to adverse events: HR 0.81 (95% CI 0.34 to 1.90, P = 0.62) or treatment failure due to lack of efficacy: HR 1.01 (95% CI 0.55 to 1.85, P = 0.98) |
| Time to treatment failure (any reason related to treatment) Subgroup: generalised onset seizures (tonic‐clonic only) Range of follow‐up: 0 to 4394 days | The 25th percentile** of time to treatment failure was 1488 days in the phenytoin group | The 25th percentile** of time to treatment failure was 1778 days (290 days longer) in the sodium valproate group | HR 0.94 (0.55 to 1.61) | 341 | ⊕⊕⊕⊝ | HR < 1 indicates a clinical advantage for valproate There was also no statistically significant difference between drugs in treatment failure due to adverse events: HR 0.75 (95% CI 0.35 to 1.60, P = 0.46) or treatment failure due to lack of efficacy: HR 1.51 (95% CI 0.66 to 3.45, P = 0.33) |
| * Illustrative risks in the sodium valproate and phenytoin groups are calculated at the median time to treatment failure (i.e. the time to 50% of participants failing or withdrawing from allocated treatment) within each group across all trials. The relative effect (pooled HR) shows the comparison of 'time to treatment failure' between the treatment groups. ** The 25th percentile of time to treatment failure (i.e. the time to 25% of participants failing or withdrawing from allocated treatment) is presented for the subgroup with generalised seizures as less than 50% of participants failed/withdrew from treatment, therefore the median time could not be calculated. Abbreviations: CI: confidence interval; HR: hazard ratio. | ||||||
| GRADE Working Group grades of evidence | ||||||
| aPooled HR for all participants adjusted for seizure type. | ||||||
| Valproate compared with phenytoin monotherapy for epilepsy | ||||||
| Patient or population: adults and children with newly‐onset focal onset or generalised tonic‐clonic seizures Settings: outpatients Intervention: sodium valproate Comparison: phenytoin | ||||||
| Outcomes | Illustrative comparative risks* (95% CI) | Relative effect | No. of Participants | Quality of the evidence | Comments | |
| Assumed risk | Corresponding risk | |||||
| Phenytoin | Sodium valproate | |||||
| Time to first seizure (post‐randomisation) All participants Range of follow‐up: 0 to 4859 days | The median time to first seizure post‐randomisation was 275 days in the phenytoin group | The median time to first seizure post‐randomisation was 267 days (7 days shorter) in the sodium valproate group | HR 1.08 (0.88 to 1.33)a | 639 (5 studies) | ⊕⊕⊝⊝ | HR < 1 indicates a clinical |
| Time to first seizure (post‐randomisation) Subgroup: focal onset seizures Range of follow‐up: 0 to 4859 days | The median time to first seizure post‐randomisation was 75 days in the phenytoin group | The median time to first seizure post‐randomisation was 41 days (34 days shorter) in the sodium valproate group | HR 1.20 (0.90 to 1.60) | 244 (4 studies) | ⊕⊕⊝⊝ | HR < 1 indicates a clinical |
| Time to first seizure (post‐randomisation) Subgroup: generalised onset seizures (tonic‐clonic only) Range of follow‐up: 1 to 4520 days | The median time to first seizure post‐randomisation was 572 days in the phenytoin group | The median time to first seizure post‐randomisation was 549 days (23 days shorter) in the sodium valproate group | HR 0.97 (0.72 to 1.30) | 395 (5 studies) | ⊕⊕⊝⊝ | HR < 1 indicates a clinical |
| Time to achieve 12‐month remission (seizure‐free period) All participants Range of follow‐up: 5 to 4614 days | The median time to achieve 12‐month remission was 380 days in the phenytoin group | The median time to achieve 12‐month remission was 386 days (6 days longer) in the sodium valproate group | HR 1.02 (0.81 to 1.28) | 514 (4 studies) | ⊕⊕⊕⊝ | HR < 1 indicates a clinical |
| Time to achieve 12‐month remission (seizure‐free period) Subgroup: focal onset seizures Range of follow‐up: 5 to 4614 days | The median time to achieve 12‐month remission was 575 days in the phenytoin group | The median time to achieve 12‐month remission was 549 days (26 days shorter) in the sodium valproate group | HR 1.11 (0.78 to 1.60) | 244 (4 studies) | ⊕⊕⊕⊝ | HR < 1 indicates a clinical |
| Time to achieve 12‐month remission (seizure‐free period) Subgroup: generalised onset seizures (tonic‐clonic only) Range of follow‐up: 7 to 4544 days | The median time to achieve 12‐month remission was 365 days in the phenytoin group | The median time to achieve 12‐month remission was 366 days (1 day longer) in the sodium valproate group | HR 0.96 (0.71 to 1.29) | 270 (4 studies) | ⊕⊕⊕⊝ | HR < 1 indicates a clinical |
| * Illustrative risks in the phenytoin and sodium valproate groups are calculated at the median time to first seizure or time to 12‐month remission (i.e. the time to 50% of participants experiencing a first seizure or 12 months of remission) within each group across all trials. The relative effect (pooled HR) shows the comparison of 'time to first seizure' or 'time to 12‐month remission' between the treatment groups. Abbreviations: CI: confidence interval; HR: hazard ratio. | ||||||
| GRADE Working Group grades of evidence | ||||||
| aPooled HR for all participants adjusted for seizure type. | ||||||
Background
This is an updated version of the original Cochrane review published in 2001 (Tudur Smith 2001), updated in 2013 and 2016 (Nolan 2013a; Nolan 2016a).
Description of the condition
Epilepsy is a common neurological condition in which abnormal electrical discharges from the brain cause recurrent unprovoked seizures. Epilepsy is a disorder of many heterogenous seizure types, with an estimated incidence of 33 to 57 per 100,000 person‐years worldwide (Annegers 1999; Hirtz 2007; MacDonald 2000; Olafsson 2005; Sander 1996), accounting for approximately 1% of the global burden of disease (Murray 1994). The lifetime risk of epilepsy onset is estimated to be 1300 to 4000 per 100,000 person‐years (Hauser 1993; Juul Jenson 1983), and the lifetime prevalence could be as large as 70 million people worldwide (Ngugi 2010). It is believed that with effective drug treatment, up to 70% of individuals with active epilepsy have the potential to go into long‐term remission shortly after starting drug therapy (Cockerell 1995; Hauser 1993; Sander 2004), and around 70% of individuals can achieve seizure freedom using a single antiepileptic drug in monotherapy (Cockerell 1995). Current National Institute for Health and Care Excellence (NICE) guidelines recommend that both adults and children with epilepsy should be treated with monotherapy wherever possible (NICE 2012). The remaining 30% of individuals experience refractory or drug‐resistant seizures, which often require treatment with combinations of antiepileptic drugs or alternative treatments, such as epilepsy surgery (Kwan 2000).
We studied two seizure types in this review: generalised onset seizures in which electrical discharges begin in one part of the brain and move throughout the brain, and focal onset seizures in which the seizure is generated in and affects one part of the brain (the whole hemisphere of the brain or part of a lobe of the brain).
Description of the intervention
The majority of people with epilepsy have their seizures controlled by a single drug (monotherapy) (Cockerell 1995). Worldwide, sodium valproate and phenytoin are commonly used antiepileptic drugs licensed for monotherapy. Phenytoin is used as a first‐line drug in low‐ and middle‐income countries as it is a low‐cost drug and can be given as a single daily dose, but is no longer considered a first‐line agent in the USA and much of Europe due to worries over adverse events (Wallace 1997; Wilder 1995). Phenytoin is associated with long‐term cosmetic changes including gum hyperplasia, acne and coarsening of the facial features (Mattson 1985; Scheinfeld 2003), as well as low folic acid levels, predisposing participants to megaloblastic anaemia (Carl 1992), and is associated with congenital abnormalities (Gladstone 1992; Morrow 2006; Meador 2008; Nulman 1997), particularly foetal hydantoin syndrome (Scheinfeld 2003). Furthermore, due to the pharmacokinetic profile of phenytoin, the plasma concentrations are difficult to predict and dosing will usually need to be informed by measuring plasma concentration. Sodium valproate has also been shown to have teratogenic properties (Canger 1999; Morrow 2006; Tomson 2011), and is particularly associated with spina bifida and cardiac, craniofacial, skeletal and limb defects known as 'valproate syndrome' (Ornoy 2009). Systematic reviews have found sodium valproate to have the highest incidence of congenital malformations of standard antiepileptic drugs (Meador 2008; Weston 2017), and recent studies have shown an increased prevalence of neurodevelopmental disorders following prenatal sodium valproate exposure (Bromley 2013; Bromley 2014). Sodium valproate is also associated with weight gain in adults and children (Dinesen 1984; Easter 1997; Egger 1981; Novak 1999).
How the intervention might work
It is generally believed that sodium valproate monotherapy is more effective than phenytoin monotherapy in generalised onset seizures (generalised tonic‐clonic seizures, absence, and myoclonus), while phenytoin monotherapy is more effective than sodium valproate monotherapy in focal onset seizures (simple focal, complex focal, and secondary generalised tonic‐clonic seizures) (Chadwick 1994), although there is no conclusive evidence from individual randomised controlled trials (RCTs) to support this belief. Evidence in favour of sodium valproate for generalised seizures is predominantly anecdotal from observational studies, suggesting a dramatic benefit with sodium valproate in juvenile myoclonic epilepsy (Delgado‐Escueta 1984; Penry 1989), and reports of efficacy of sodium valproate against absence seizures (Bourgeois 1987; Jeavons 1977). The results of two RCTs, recruiting children indicate that sodium valproate may be better tolerated in children than phenytoin (De Silva 1996; Thilothammal 1996); twice as many children experienced at least one side effect on phenytoin than sodium valproate in Thilothammal 1996, and phenytoin was more likely to be withdrawn due to unacceptable side effects than sodium valproate in De Silva 1996.
Some animal models have suggested that phenytoin has either no effect in absence seizures or may in fact worsen seizures (Liporace 1994). There is also anecdotal evidence that phenytoin may cause paradoxical intoxication (increased seizure frequency with increased anticonvulsant dose) and encephalopathy (Troupin 1975; Vallarta 1974).
Why it is important to do this review
Accepting that phenytoin should not be a drug of first choice for individuals experiencing absence, myoclonic and atonic seizures, we still have insufficient evidence from RCTs to guide a choice between sodium valproate and phenytoin for individuals with generalised onset tonic‐clonic seizures or focal onset seizures. The aim of this review, therefore, is to summarise efficacy and tolerability data from existing trials comparing valproate and phenytoin when used as monotherapy treatments.
There are difficulties in undertaking a systematic review of epilepsy monotherapy trials, as the important efficacy outcomes require analysis of time‐to‐event data (for example, time to first seizure after randomisation). Although methods have been developed to synthesise time‐to‐event data using summary information (Parmar 1998; Williamson 2002), the appropriate statistics are not commonly reported in published epilepsy trials (Nolan 2013d; Williamson 2000).
Furthermore, although seizure data have been collected in most epilepsy monotherapy trials, there has been no uniformity in the definition and reporting of outcomes. For example, trials may report time to 12‐month remission but not time to first seizure or vice versa, or some trials may define time to first seizure from the date of randomisation, while others use date of achieving maintenance dose. Trial investigators have also adopted differing approaches to the analysis, particularly with respect to the censoring of time‐to‐event data. For these reasons, we performed this review using individual participant data (IPD) which helps to overcome these problems. This review is one in a series of Cochrane IPD reviews investigating pair‐wise monotherapy comparisons (Marson 2000; Nevitt 2017b; Nolan 2013b; Nolan 2013c; Nolan 2016b; Nolan 2016c; Nevitt 2018). These data have also been included in IPD network meta‐analyses of antiepileptic drug monotherapy (Nevitt 2017a; Tudur Smith 2007).
Objectives
To review the time to treatment failure, remission and first seizure of sodium valproate compared to phenytoin when used as monotherapy in people with focal onset seizures or generalised tonic‐clonic seizures (with or without other generalised seizure types).
Methods
Criteria for considering studies for this review
Types of studies
-
Randomised controlled trials (RCTs) using either:
-
an adequate method of allocation concealment (e.g. sealed opaque envelopes); or
-
a 'quasi' method of randomisation (e.g. allocation by date of birth).
-
-
Studies may be double‐blind, single‐blind or unblinded.
-
Studies must include a comparison of sodium valproate monotherapy with phenytoin monotherapy in individuals with epilepsy.
Types of participants
-
We included children or adults with focal onset seizures (simple focal, complex focal or secondarily generalised tonic‐clonic seizures) or generalised onset tonic‐clonic seizures, with or without other generalised seizure types (in other words, those who had only generalised tonic‐clonic seizures and those who had both generalised onset tonic‐clonic seizures and generalised seizures of other types (e.g. absence, myoclonic etc.)).
-
We excluded individuals with other generalised seizure types alone without generalised tonic‐clonic seizures (e.g. those who had only absence seizures without any generalised clonic tonic‐seizures) due to differences in first‐line treatment guidelines for other generalised seizure types (NICE 2012).
-
We included individuals with a new diagnosis of epilepsy, or who have had a relapse following withdrawal of antiepileptic monotherapy.
Types of interventions
Sodium valproate or phenytoin as monotherapy. For brevity, sodium valproate is referred to a 'valproate' herein.
Types of outcome measures
Below is a list of outcomes investigated in this review. Reporting of these outcomes in the original trial report was not an eligibility requirement for inclusion in this review.
Primary outcomes
-
Time to treatment failure (retention time).
This is a combined outcome reflecting both efficacy and tolerability, as the following may have lead to failure of treatment: continued seizures, side effects, noncompliance or the initiation of additional add‐on treatment. This is an outcome to which the participant makes a contribution and is the primary outcome measure recommended by the Commission on Antiepileptic Drugs of the International League Against Epilepsy (ILAE 1998; ILAE 2006).
Time to treatment failure is considered according to three definitions.
-
Time to treatment failure, for any treatment‐related reason (continued seizures, side effects, noncompliance or the initiation of additional add‐on treatment).
-
Time to treatment failure, due to adverse events (i.e. side effects).
-
Time to treatment failure, due to lack of efficacy (i.e. continued seizures).
Secondary outcomes
-
Time to first seizure (post‐randomisation).
-
Time to achieve 12‐month remission (seizure‐free period).
-
Time to achieve six‐month remission (seizure‐free period).
-
Incidence of adverse events.
Search methods for identification of studies
Electronic searches
We searched the following databases. We did not impose any language restrictions.
-
The Cochrane Epilepsy Group's Specialised Register (19 February 2018) using the search strategy outlined in Appendix 1.
-
The Cochrane Central Register of Controlled Trials (CENTRAL; 2018, Issue 2) in the Cochrane Library (searched 19 February 2018) using the search strategy outlined in Appendix 2.
-
MEDLINE (Ovid, 1946 to 19 February 2018) using the search strategy outlined in Appendix 3.
-
SCOPUS (last search 19 February 2013) using the search strategy outlined in Appendix 4. We searched SCOPUS as an alternative to Embase, but this is no longer necessary, because randomised and quasi‐RCTs in Embase are now included in CENTRAL, so we will not be updating the SCOPUS search.
-
ClinicalTrials.gov (19 February 2018) using the search terms 'phenytoin AND valproate | Epilepsy'.
-
WHO International Clinical Trials Registry Platform ICTRP (19 February 2018) using the search terms 'valproate and phenytoin and epilepsy'.
Searching other resources
In addition, we handsearched relevant journals, reviewed the reference lists of retrieved studies to search for additional reports of relevant studies, contacted Sanofi (manufacturers of valproate in Europe), Abbott (manufacturers of valproate in the USA), Parke‐Davis (manufacturers of phenytoin), and experts in the field for information about any ongoing studies.
Data collection and analysis
Selection of studies
Two review authors (SJN and AGM) independently assessed trials for inclusion, resolving any disagreements by mutual discussion.
Data extraction and management
We requested the following individual participant data (IPD) for all trials meeting our inclusion criteria.
-
Trial methods
-
-
method of generation of random list
-
method of concealment of randomisation
-
stratification factors
-
blinding methods
-
-
Participant covariates
-
-
gender
-
age
-
seizure types
-
time between first seizure and randomisation
-
number of seizures prior to randomisation (with dates)
-
presence of neurological signs
-
electroencephalographic (EEG) results
-
computerised tomography/magnetic resonance imaging (CT/MRI) results
-
-
Follow‐up data
-
-
treatment allocation
-
date of randomisation
-
dates of follow‐up
-
dates of seizures post‐randomisation or seizure frequency data between follow‐up visits
-
dates of treatment withdrawal or treatment failure and reasons for treatment withdrawal or treatment failure
-
dose
-
dates of dose changes
-
For each trial for which IPD were not obtained, we carried out an assessment to see whether any relevant aggregate level data had been reported. If possible, SJN extracted any aggregate level data from publications and extracted data were verified by JW.
For three trials, seizure data were provided in terms of the number of seizures recorded between clinic visits rather than specific dates of seizures (Craig 1994; Ramsay 1992; Turnbull 1985). To enable time‐to‐event outcomes to be calculated, we applied linear interpolation to approximate the dates on which seizures occurred. For example, if four seizures were recorded between two visits which occurred on 1 March and 1 May (an interval of 61 days), then date of first seizure would be approximately 13 March. This allowed an estimate of the time to achieve six‐month and 12‐month remission and the time to first seizure to be computed.
We calculated time to achieve six‐month and 12‐month remission from the date of randomisation to the date (or estimated date) the individual had first been free of seizures for six or 12 months, respectively. If the person had one or more seizure(s) in the titration period, a six‐month or 12‐month seizure‐free period could also occur between the estimated date of the last seizure in the titration period and the estimated date of the first seizure in the maintenance period.
We calculated time to first seizure from the date of randomisation to the date that their first seizure was estimated to have occurred. If seizure data were missing for a particular visit, these outcomes were censored at the previous visit. These outcomes were also censored if the individual died or if follow‐up ceased prior to the occurrence of the event of interest. These methods had been used in the remaining two trials for which outcome data were provided directly (De Silva 1996; Heller 1995).
Treatment failure data were not available for one trial (Craig 1994). For two trials, we extracted dates and reason for treatment failure from trial case report forms for the original review (De Silva 1996; Heller 1995). Two review authors (SJN and AGM) independently extracted data from all case report forms, resolving disagreements by discussion and reconsidering the case report forms. For the remaining trials (Ramsay 1992; Turnbull 1985), data on length of time spent in trial and reason for withdrawal from treatment or treatment failure were provided directly.
Time to treatment failure was calculated as date of randomisation to date of treatment failure. For the analysis of time‐to‐event, we defined an 'event' as treatment failure because of reasons related to the treatment (i.e. lack of efficacy, adverse events, or both lack of efficacy and adverse events), non‐compliance with the treatment regimen, withdrawal of consent from the trial, etc.). We censored the outcome if treatment failure or withdrawal of treatment was for reasons not related to the trial treatment: i.e. loss to follow‐up, death (not treatment or epilepsy‐related), withdrawal of treatment due to remission, etc. We also censored individuals who were still on allocated treatment at the date of the end of follow‐up. We considered documented reasons for treatment failure or treatment withdrawal on a case‐by‐case basis in relation to treatment; two authors (SJN and AGM) independently classified reasons for treatment failure as 'events' or 'censored' and resolved any disagreements by discussion.
For the analysis of 'time to treatment failure due to adverse events,' only treatment failures which were documented to be due to adverse events (either as a sole reason or due to both a lack of efficacy and adverse events) were classed as an 'event' within time‐to‐event analyses and all other reasons for treatment failure were censored. Similarly, for the analysis of 'time to treatment failure due to lack of efficacy' only treatment failures which were documented to be due to lack of efficacy (i.e. continued seizures, either as a sole reason or due to both a lack of efficacy and adverse events) were classed as an 'event' within time‐to‐event analyses and all other reasons for treatment failure were censored.
Two trials presented times at which the allocated drug was withdrawn and the reason for treatment failure in the trial publication for each individual (Forsythe 1991; Shakir 1981). Hence, these two trials could be incorporated into the analysis of 'time to treatment failure'; one of the trials also presented information by seizure type (focal onset or generalised onset seizures) and therefore could also be included in the stratified analysis for 'time to treatment failure' (Shakir 1981).
Shakir 1981 presents 'time on trial drug' in months for each participant; therefore to calculate 'time to treatment failure', we assumed that if 'time spent on trial drug' was five months, the individual spent five full months (152 full days) on the trial drug before treatment failure. Forsythe 1991 presents 'withdrawal and time of occurrence by month' for each participant; therefore to calculate 'time to treatment failure', we assumed that if treatment failure occurred during the fifth month, that the treatment failure occurred halfway between the fifth and sixth month (i.e. participants spent 167 full days on treatment before treatment failure).
Assessment of risk of bias in included studies
Two review authors (SJN and JW) independently assessed the risk of bias for each trial using the Cochrane 'Risk of bias' tool, as described in the Cochrane Handbook for Systematic Reviews of Interventions (Higgins 2011). We rated each of the following six domains as low, unclear or high risk of bias: method of generating random sequence, allocation concealment, blinding methods, incomplete outcome data, selective outcome reporting and other sources of bias. Any discrepancies in risk of bias judgements of the two review authors were resolved by discussion. In the event of the presence of high risk of bias in included trials (due to inadequate allocation concealment or lack of blinding), we planned sensitivity analyses excluding these trials.
Measures of treatment effect
We measured all outcomes in this review as time‐to‐event outcomes with the hazard ratio (HR) and 95% confidence interval (CI) used as the measure of treatment effect. We calculated outcomes from IPD provided, where possible, or extracted from published trials if possible.
Unit of analysis issues
We did not have any unit of analysis issues. The unit of allocation and analysis was the individual for all included trials; and no trials included in meta‐analyses were of a repeated measures (longitudinal) nature or of a cross‐over design.
Dealing with missing data
For each trial that supplied IPD, we reproduced results from trial results where possible and performed the following consistency checks.
-
We cross‐checked trial details against any published report of the trial and contacted original trial authors if we found missing data, errors or inconsistencies. If trial authors could not resolve inconsistencies between the IPD and the published data, depending on the extent of the inconsistencies, we planned to perform sensitivity analysis or excluded the data from the meta‐analysis.
-
We reviewed the chronological randomisation sequence and checked the balance of prognostic factors, taking account of factors stratified for in the randomisation procedure.
Assessment of heterogeneity
We assessed heterogeneity statistically using the Q test (P < 0.10 for significance) and the I² statistic (greater than 50% indicating considerable heterogeneity; Higgins 2003), and visually by inspecting forest plots.
Assessment of reporting biases
Two review authors (SJN and JW) undertook all full quality and risk of bias assessments. In theory, a review using IPD should overcome issues of reporting biases, as unpublished data can be provided and unpublished outcomes calculated. Any selective reporting bias detected could be assessed with the ORBIT classification system (Kirkham 2010).
Data synthesis
We carried out our analysis on an intention‐to‐treat basis (that is, we analysed participants in the group to which they were randomised, irrespective of which treatment they actually received). Therefore, for the time‐to‐event outcomes, 'time to six‐month remission', 'time to 12‐month remission', 'time to 24 month remission' and 'time to first seizure post‐randomisation', we did not censor participants if treatment was withdrawn or if treatment failure occurred but follow‐up within the trial continued (e.g. if a participant continued to be followed up on a different treatment).
For all outcomes, we investigated the relationship between the time‐to‐event and treatment effect of the antiepileptic drugs. We used Cox proportional hazards regression models to obtain trial‐specific estimates of log (HR) or treatment effect and associated standard errors in Stata Statistical Software, version 14 (Stata 2015). The model assumes that the ratio of hazards (risks) between the two treatment groups is constant over time (i.e. hazards are proportional). We tested this proportional hazards assumption of the Cox regression model for each outcome of each trial by testing the statistical significance of a time varying covariate in the model. We evaluated overall pooled estimates of HRs (with 95% CIs) using the generic inverse variance method. We expressed results as a HR and a 95% CI.
By convention, a HR greater than 1 indicates that an event is more likely to occur earlier on valproate than on phenytoin. Hence, for time to treatment failure or time to first seizure, a HR less than 1 indicates a clinical advantage for valproate (e.g. HR = 0.8 would suggest a 20% reduction in hazard of treatment failure from valproate compared to phenytoin), and for time to achieve six‐month and 12‐month remission, a HR less than 1 indicates a clinical advantage for phenytoin.
Subgroup analysis and investigation of heterogeneity
Due to the strong clinical belief that valproate is more effective in generalised onset seizures, while phenytoin is more effective in focal onset seizures, we have stratified all analyses by seizure type (focal onset versus generalised onset), according to the classification of main seizure type at baseline. We classified focal seizures (simple or complex) and focal secondarily generalised seizures as 'focal epilepsy'. We classified primarily generalised seizures as 'generalised epilepsy'. We conducted a Chi² test of interaction between treatment and epilepsy type.
If we found significant statistical heterogeneity to be present, we performed meta‐analysis with a random‐effects model in addition to a fixed‐effect model, presenting the result of both models and performing sensitivity analyses to investigate differences in study characteristics.
Sensitivity analysis
One trial recruited only individuals with generalised onset tonic‐clonic seizures, some of whom were experiencing other generalised seizure types, such as absence or myoclonus (Ramsay 1992), and all generalised seizure types were recorded during follow‐up for this trial. The remaining four trials recruited individuals with focal onset seizures (simple/complex focal or secondarily generalised tonic‐clonic) and individuals with generalised onset tonic‐clonic seizures. For the individuals with generalised onset tonic‐clonic seizures recruited into these four trials, other generalised seizure types were not recorded during follow‐up. As a result, the majority of the data from the five trials does not address the treatment of generalised seizure types, such as absence or myoclonus, but applies only to generalised onset tonic‐clonic seizures. In our primary analysis, we use only the data for generalised onset tonic‐clonic seizures during follow‐up as this is the most consistent approach; we also report a sensitivity analysis which includes data on all generalised seizure types from Ramsay 1992 for the outcomes 'time to first seizure' and 'time to six‐month remission' (Ramsay 1992 was less than one year duration so does not contribute to 'time to‐12 month remission').
Misclassification of seizure type is a recognised problem in epilepsy, whereby some people with generalised seizures have been mistakenly classed as having focal onset seizures and vice versa. There is clinical evidence that individuals with generalised onset seizures are unlikely to have an 'age of onset' greater than 25 to 30 years (Malafosse 1994). Such misclassification impacted upon the results of three reviews in our series of pair‐wise reviews for monotherapy in epilepsy comparing carbamazepine to phenobarbitone, phenytoin and sodium valproate in which around 30% to 50% of participants analysed may have had their seizure type misclassified as generalised onset (Marson 2000; Nolan 2016c; Nevitt 2017b). Given the potential biases introduced into those reviews, we examined the distribution of age at onset for individuals with generalised seizures in the trials included in this review, to assess the potential impact of misclassification of seizure type on the outcomes:
-
84 out of 86 individuals classified as having generalised onset seizures (98%) in Craig 1994;
-
37 out of 71 individuals (52%) in Heller 1995;
-
30 out of 136 (22%) in Ramsay 1992;
-
2 out of 14 (14%) in Shakir 1981; and
-
35 out of 77 (45%) in Turnbull 1985.
Therefore, a total of up to 188 out of 384 individuals (49%) classified as having generalised onset seizures may have had their seizure type misclassified (De Silva 1996 was a paediatric trial so no individuals over the age of 30 were recruited). Such a misclassification could bias our results against finding an interaction between treatment and seizure types (focal onset versus generalised onset). We undertook the following two analyses to investigate misclassification.
-
We reclassified all individuals with generalised seizures and age at onset greater than 30 into an 'uncertain seizure type' group.
-
We reclassified individuals with generalised seizures and age at onset greater than 30 as having focal onset seizures.
Summary of findings and quality of the evidence (GRADE)
For the 2013 update, in a post hoc change from protocol, we have added two 'Summary of findings' tables to the review (outcomes in the tables decided before the update started based on clinical relevance).
summary of findings Table for the main comparison reports the primary outcome of 'time to treatment failure' in the subgroups of participants with focal onset seizures, generalised onset seizures and overall adjusted by epilepsy type.
summary of findings Table 2 reports the secondary outcomes of 'time to first seizure' and 'time to 12‐month remission' in the subgroups of participants with focal onset seizures, generalised onset seizures and overall adjusted by epilepsy type.
We determined the quality of the evidence using the GRADE approach (Schünemann 2013), where we downgraded evidence in the presence of high risk of bias in at least one trial, indirectness of the evidence, unexplained heterogeneity or inconsistency, imprecision of results and high probability of publication bias. We downgraded evidence by one level if the limitation was considered serious and two levels if considered very serious, as judged by the review authors.
Results
Description of studies
Results of the search
We identified 334 records from the databases and search strategies outlined in Electronic searches. We found no further records by searching other resources. We removed 126 duplicate records and screened 208 records (title and abstract) for inclusion in the review. We excluded 178 records based on title and abstract and assessed 30 full‐text articles for inclusion in the review. We excluded 19 studies from the review (see Excluded studies below) and included 11 trials in the review (see Included studies below). We updated the searches in May 2015, resulting in 35 hits. We removed seven duplicate records and screened 28 records (title and abstract); we excluded all 28 records.
For the 2018 update of this review we identified 129 records from the databases and search strategies outlined in Electronic searches. We removed 21 duplicate records and screened 108 records (title and abstract) for inclusion in the review. All 108 records were clearly irrelevant and we excluded them.
See Figure 1 for PRISMA study flow diagram for the eligibility screening of all studies identified in searches for all versions of this review (previous searches and the most recent search in February 2018).

Study flow diagram.
Included studies
We included 11 trials in the review (Callaghan 1985; Czapinski 1997a; Craig 1994; De Silva 1996; Forsythe 1991; Heller 1995; Ramsay 1992; Rastogi 1991; Shakir 1981; Thilothammal 1996; Turnbull 1985). One trial was available in abstract form only (Czapinski 1997a).
Four trials recruited individuals of all ages (Callaghan 1985; Ramsay 1992; Rastogi 1991; Shakir 1981), three trials recruited adults only (Czapinski 1997a; Heller 1995; Turnbull 1985), three trials recruited children only (De Silva 1996; Forsythe 1991; Thilothammal 1996), and one trial recruited elderly individuals only (Craig 1994).
One trial recruited individuals with focal onset seizures only (Czapinski 1997a), two trials recruited individuals with generalised onset seizures only (Ramsay 1992; Thilothammal 1996), seven trials recruited individuals with focal onset seizures and generalised onset seizures (Callaghan 1985; Craig 1994; De Silva 1996; Heller 1995; Rastogi 1991; Shakir 1981; Turnbull 1985), and one trial did not provide information on the seizure types of individuals recruited (Forsythe 1991).
Nine trials recruited individuals with new onset seizures only (Callaghan 1985; Craig 1994; Czapinski 1997a; De Silva 1996; Forsythe 1991; Heller 1995; Ramsay 1992; Thilothammal 1996; Turnbull 1985), 64% of individuals in one trial had new onset seizures, while the remaining individuals had uncontrolled seizures on current therapy (Shakir 1981), and one trial did not specify whether individuals were newly diagnosed (Rastogi 1991). Seven trials were conducted in Europe (Callaghan 1985; Craig 1994; Czapinski 1997a; De Silva 1996; Forsythe 1991; Heller 1995; Turnbull 1985), one trial in the USA (Ramsay 1992), two trials in India (Rastogi 1991; Thilothammal 1996), and one trial in two centres in Europe and New Zealand (Shakir 1981).
Individual participant data (IPD) were provided by trial authors for five trials which recruited a total of 669 participants, representing 60% of individuals from all 1119 eligible participants identified in eligible trials (Craig 1994; De Silva 1996; Heller 1995; Ramsay 1992; Turnbull 1985). Data were converted from paper format to computer datasets in two trials (Ramsay 1992; Turnbull 1985), computerised data were provided directly in one trial (Craig 1994), and a combination of both (although mostly computerised) were supplied by the authors of two trials (De Silva 1996; Heller 1995).
Data were available for the following participant characteristics (percentage of participants with data available): seizure type (100%); gender (99.6%) age at randomisation (99.3%); number of seizures in the six months prior to randomisation (79%); and epilepsy duration (i.e. time since first seizure to randomisation, 73%). Electroencephalographic (EEG) data had been recorded for all five trials, but only computerised in two trials (Craig 1994; Turnbull 1985). Similar difficulties were encountered with computerised tomography/magnetic resonance imaging (CT/MRI) data available for only one trial (Turnbull 1985), and neurological examination findings, available for only two trials (De Silva 1996; Heller 1995). See the Characteristics of included studies tables, Table 1 and Table 2 for further details.
| Focal seizures: n (%) | Male gender: n (%) | Age at entry (years): Mean (SD), range | Aged > 30 years and generalised seizures: n (%) | Epilepsy duration (years): mean (SD), range | Number of seizures in prior 6 months: median (range) | |||||||||||||
| SV | PHT | Missing | SV | PHT | Missing | SV | PHT | Missing | SV | PHT | Missing | SV | PHT | Missing | SV | PHT | Missing | |
| 37 (44%) | 43 (53%) | 0 | 38 (46%) | 33 (41%) | 3 | 77.6 (7.2), 61 to 95 | 78.7 (7.0), 64 to 95 | 3 | 46 | 38 | 0 | NA | NA | 166 | 2 (0 to 60) | 3 (1 to 99) | 3 | |
| 25 (51%) | 30 (56%) | 0 | 18 (37%) | 34 (63%) | 0 | 11.3 (3.3), 2 to 15 | 9.5 (3.4), 3 to 15 | 0 | 0 | 0 | 0 | 1.2 (1.5), 0 to 4.9 | 1.0 (2.1), 0 to 13.7 | 0 | 3 (1 to 900) | 3 (1 to 404) | 0 | |
| 25 (41%) | 28 (44%) | 0 | 28 (46%) | 34 (54%) | 0 | 32.0 (15.6), 14 to 67 | 33.5 (14.3), 14 to 72 | 2 | 17 | 20 | 0 | 2.6 (3.9), 0 to 17.9 | 3.8 (5.4), 0 to 24.3 | 2 | 2 (1 to 181) | 2 (1 to 575) | 2 | |
| 0 (0%) | 0 (0%) | 0 | 48 (56%) | 25 (50%) | 0 | 21.1 (14.4), 3 to 64 | 20.6 (14.0), 4 to 63 | 0 | 16 | 10 | 0 | 0.1 (0.3), 0 to 1.9 | 0.2 (0.5), 0 to 3.0 | 15 | NA | NA | 136 | |
| 32 (46%) | 31 (44%) | 0 | 34 (49%) | 39 (56%) | 0 | 35.1 (16.5), 14 to 69 | 35.3 (15.9), 16 to 70 | 0 | 16 | 19 | 0 | 2.2 (2.9), 0.1 to 11.0 | 2.1 (4.2), 0.1 to 30.0 | 0 | 2 (0 to 60) | 2 (1 to 60) | 0 | |
SV= sodium valproate; PHT= Phenytoin; n = number of participants; NA = not available; SD = standard deviation.
Proportions (%) are calculated based on non‐missing data.
| EEG normal: n (%) | CT scan normal: n (%) | Neurological exam normal: n (%) | |||||||
| SV | PHT | Missing | SV | PHT | Missing | SV | PHT | Missing | |
| 20 (30%) | 8 (16%) | 64 | NA | NA | 166 | NA | NA | 166 | |
| NA | NA | 103 | NA | NA | 103 | 43 (88%) | 48 (89%) | 0 | |
| NA | NA | 124 | NA | NA | 124 | 56 (95%) | 54 (86%) | 2 | |
| NA | NA | 136 | NA | NA | 136 | NA | NA | 136 | |
| 30 (46%) | 38 (54%) | 0 | 6 (50%) | 11 (73%) | 43 | NA | NA | 70 | |
EEG = electroencephalographic; SV= sodium valproate; PHT= Phenytoin; n = number of participants; NA = not available.
Proportions (%) are calculated based on non‐missing data.
IIPD were not provided for the remaining six of these trials (Callaghan 1985; Czapinski 1997a; Forsythe 1991; Rastogi 1991; Shakir 1981; Thilothammal 1996), in which a total of 450 individuals had been randomised to either phenytoin or valproate. Sufficient participant level data were presented in the trial publications of Forsythe 1991 and Shakir 1981 to include these studies within the analysis of 'time to treatment failure' (see Data extraction and management and Effects of interventions). We could not extract sufficient aggregate data from the trial publication in any other trial, or for any other outcomes to include in data synthesis. Full details of outcomes considered and a summary of results of each trial for which IPD were not available to us can be found in Table 3.
| Trial | Outcomes reported | Summary of results |
|
|
| |
|
| ||
|
|
No significant differences between treatment groups for any other cognitive tests
| |
|
|
| |
|
|
| |
|
|
|
n = number of participants; PHT: phenytoin; SV: sodium valproate.
Excluded studies
We excluded 14 duplicate trials (Berg 1993; Callaghan 1981; Callaghan 1983; Callaghan 1984; Craig 1993; Czapinski 1997b; Czapinski 1997c; Goggin 1984; Goggin 1986; Shakir 1980; Tallis 1994a; Tallis 1994b; Turnbull 1982; Wilder 1983), and we retained the most relevant primary reference for each trial in the review. One trial was not randomised (Zeng 2010), and four did not make a randomised comparison between valproate and phenytoin (Jannuzzi 2000; Kaminow 2003; Sabers 1995; Schmidt 2007; see Characteristics of excluded studies for detailed reasons for exclusion).
Risk of bias in included studies
For further details see Characteristics of included studies, Figure 2 and Figure 3.

'Risk of bias' graph: review authors' judgements about each risk of bias item presented as percentages across all included studies.

'Risk of bias' summary: review authors' judgements about each risk of bias item for each included study.
Allocation
(1) Trials for which individual participant data (IPD) were provided
Three trials reported adequate methods of randomisation and allocation concealment; two trials used permuted blocks to generate a random list and concealed allocation by using sealed opaque envelopes (De Silva 1996; Heller 1995). One trial used a computer minimisation programme and a pharmacy‐controlled allocation (Craig 1994); we judged these trials to be at low risk of bias for random sequence generation and allocation concealment. One trail reported that random number tables were used but did not report sufficient information about methods of allocation concealment (Ramsay 1992). One trial did not report sufficient information about methods of randomisation and allocation concealment (Turnbull 1985).
(2) Trials for which no IPD were available
Two trials reported adequate methods of randomisation: telephone randomisation in Shakir 1981, and a computer‐generated list of randomised numbers in Thilothammal 1996; we judged these studies at low risk of bias for random sequence generation. Two trials reported no information on methods of randomisation (Czapinski 1997a; Rastogi 1991) (unclear risk of bias), one trial reported unclear information on randomisation (Callaghan 1985) (unclear risk of bias), and one trial reported an inadequate method of randomisation, i.e. quota allocation (Forsythe 1991) (high risk of bias). We judged five of the six trials to be at unclear risk of bias as they reported no information on allocation concealment (Czapinski 1997a; Forsythe 1991; Rastogi 1991; Shakir 1981; Thilothammal 1996), and one trial at high risk of bias as it reported an inadequate method of allocation concealment based on 'drug of first preference' (Callaghan 1985).
Blinding
(1) Trials for which IPD were provided
One trial was single‐blinded (outcome assessor for cognitive testing) (Craig 1994) (low risk of bias), three trials were unblinded for "practical and ethical reasons" (De Silva 1996; Heller 1995; Ramsay 1992) (high risk of bias), and one trial provided no information on blinding (Turnbull 1985) (unclear risk of bias).
(2) Trials for which no IPD were available
One trial was described as double‐blinded (Thilothammal 1996) but it was unclear who was blinded, one trial was single‐blinded (outcome assessor for cognitive testing) (Forsythe 1991), and no information was provided on blinding in the other trials (Callaghan 1985; Czapinski 1997a; Rastogi 1991; Shakir 1981).
Incomplete outcome data
(1) Trials for which IPD were provided
In theory, a review using IPD should overcome issues of attrition bias, as unpublished data can be provided, unpublished outcomes calculated and all randomised participants can be analysed by an intention‐to‐treat approach. All five trials reported attrition rates and provided IPD for all randomised individuals (Craig 1994; De Silva 1996; Heller 1995; Ramsay 1992; Turnbull 1985); we judged all five trials at low risk of attrition bias.
(2) Trials for which no IPD were available
Four trials reported attrition rates and analysed all randomised participants using an intention‐to‐treat approach (Callaghan 1985; Forsythe 1991; Shakir 1981; Thilothammal 1996); low risk of attrition bias. Two trials did not provide sufficient information to assess attrition bias (Czapinski 1997a; Rastogi 1991); unclear risk of attrition bias.
Selective reporting
The authors of Craig 1994 provided a protocol; the outcomes specified in the protocol were consistent with the outcomes reported in the publication, and we therefore judged the risk of selective reporting bias to be low. Protocols were not available for any of the other 10 included trials so we made a judgement of the risk of bias based on the information included in the publications (see Characteristics of included studies for more information). We judged eight of the other 10 studies at low risk of reporting bias; Czapinski 1997a and Forsythe 1991 were judged at unclear risk of reporting bias.
(1) Trials for which IPD were provided
In theory, a review using IPD should overcome issues of reporting biases, as unpublished data can be provided and unpublished outcomes calculated. Sufficient IPD were provided to calculate the four outcomes: 'time to treatment failure', 'time to achieve six‐month remission', 'time to achieve 12‐month remission' and 'time to first seizure' for four of the five trials (De Silva 1996; Heller 1995; Ramsay 1992; Turnbull 1985). Treatment failure information was not provided for one trial (Craig 1994), so we could not calculate 'time to treatment failure', but we had sufficient information to calculate the other three outcomes.
(2) Trials for which no IPD were available
Seizure outcomes and adverse events were well reported in four trials (Callaghan 1985; Rastogi 1991; Shakir 1981; Thilothammal 1996); low risk of reporting bias. One trial reported cognitive outcomes and adverse events, but no seizure outcomes (Forsythe 1991); however as no protocol was available for this trial we do not know whether seizure outcomes were planned a priori, and we judged this trial at unclear risk of reporting bias. One trial was in abstract form only and did not provide sufficient information to assess selective reporting bias (Czapinski 1997a); also judged at unclear risk of reporting bias.
Other potential sources of bias
We detected no other potential sources of bias in any of the 10 of the 11 trials included in the review, however limited information was available for Czapinski 1997a which was only available as an abstract so we judged this trial to be at unclear risk of other bias.
Effects of interventions
See: Summary of findings for the main comparison Sodium valproate compared with phenytoin monotherapy for epilepsy (primary outcome); Summary of findings 2 Sodium valproate compared with phenytoin monotherapy for epilepsy (secondary outcomes)
A summary of the outcomes reported in trials for which no IPD were available are reported in Table 3.
See Table 4 for details regarding the number of individuals (with IPD) contributing to each analysis, summary of findings Table for the main comparison for a summary of the results for the primary outcome 'time to treatment failure' (stratified by epilepsy type), and summary of findings Table 2 for a summary of results for the secondary outcomes 'time to first seizure' and 'time to 12‐month remission'. Survival curve plots are shown in Figure 4; Figure 5; Figure 6; Figure 7; Figure 8; Figure 9; Figure 10; Figure 11; Figure 12; Figure 13; Figure 14 and Figure 15 . All survival curve plots were produced in Stata software version 14 (Stata 2015). using data from all trials providing IPD combined.

Time to treatment failure ‐ any reason related to the treatment (PHT: phenytoin; SV: sodium valproate)

Time to treatment failure ‐ any reason related to the treatment, by epilepsy type (PHT: phenytoin; SV: sodium valproate)

Time to treatment failure due to adverse events (PHT: phenytoin; SV: sodium valproate)

Time to treatment failure due to adverse events, by epilepsy type (PHT: phenytoin; SV: sodium valproate)

Time to treatment failure due to lack of efficacy (PHT: phenytoin; SV: sodium valproate)
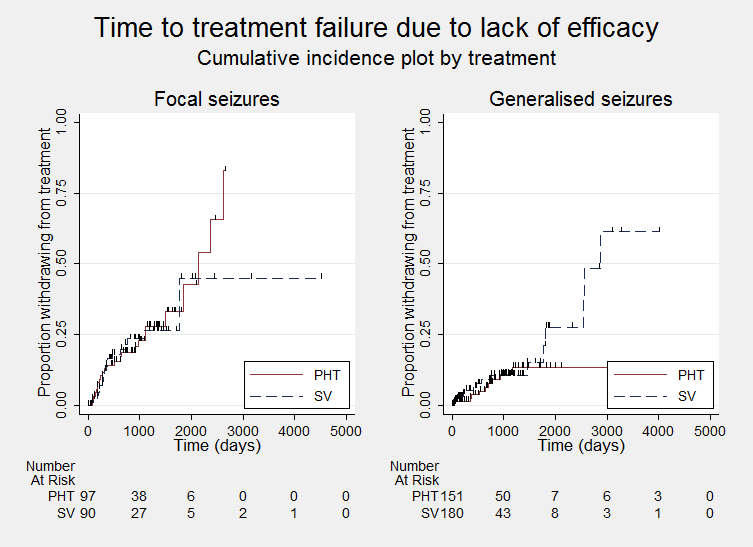
Time to treatment failure due to lack of efficacy, by epilepsy type (PHT: phenytoin; SV: sodium valproate)

Time to first seizure (PHT: phenytoin; SV: sodium valproate)

Time to first seizure ‐ by epilepsy type. (PHT: phenytoin; SV: sodium valproate)
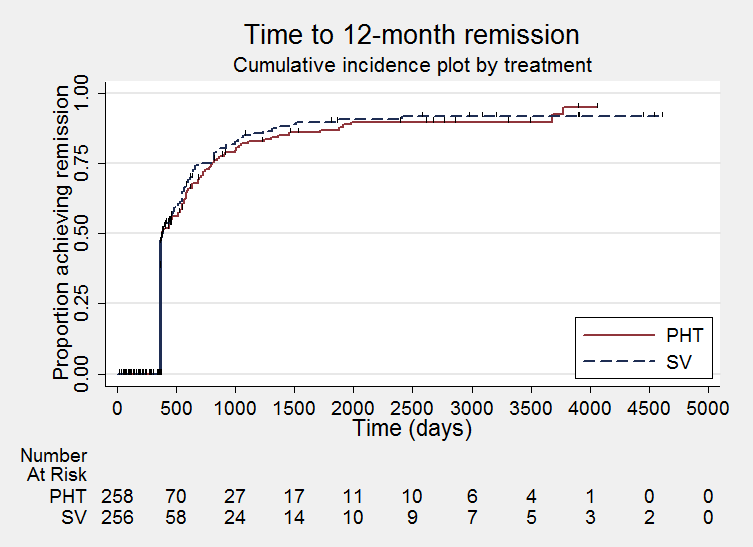
Time to achieve 12‐month remission (PHT: phenytoin; SV: sodium valproate)

Time to achieve 12‐month remission ‐ by epilepsy type. (PHT: phenytoin; SV: sodium valproate)

Time to achieve six‐month remission (PHT: phenytoin; SV: sodium valproate)

Time to achieve six‐month remission (PHT: phenytoin; SV: sodium valproate)
| Trial | Number randomised | Time to treatment failure (for any reason related to treatment) | Time to achieve 12‐month remission | Time to achieve 6‐month remission | Time to first seizure | ||||||||||
| PHT | SV | Total | PHT | SV | Total | PHT | SV | Total | PHT | SV | Total | PHT | SV | Total | |
| 81 | 85 | 166 | 0 | 0 | 0 | 71 | 76 | 147 | 71 | 76 | 147 | 71 | 76 | 147 | |
| 54 | 49 | 103 | 53 | 47 | 100 | 54 | 49 | 103 | 54 | 49 | 103 | 54 | 49 | 103 | |
| 20 | 21 | 41 | 20 | 21 | 41 | 0 | 0 | 0 | 0 | 0 | 0 | 0 | 0 | 0 | |
| 63 | 61 | 124 | 61 | 58 | 119 | 63 | 61 | 124 | 63 | 61 | 124 | 63 | 61 | 124 | |
| 50 | 86 | 136 | 50 | 86 | 136 | 0 | 0 | 0 | 48 | 77 | 125 | 48 | 77 | 125 | |
| 70 | 70 | 140 | 70 | 70 | 140 | 70 | 70 | 140 | 70 | 70 | 140 | 70 | 70 | 140 | |
| 15 | 18 | 33 | 15 | 18 | 33 | 0 | 0 | 0 | 0 | 0 | 0 | 0 | 0 | 0 | |
| Total | 353 | 390 | 743 | 269 | 300 | 569 | 258 | 256 | 514 | 306 | 333 | 639 | 306 | 333 | 639 |
aTreatment failure information not provided for Craig 1994, so cannot contribute to 'time to treatment failure'.
bData extracted from Forsythe 1991 and Shakir 1981 publications to calculate time to treatment failure. Insufficient published data to calculate other outcomes.
cFollow‐up for Ramsay 1992 is less than 12 months so cannot contribute to 'time to achieve 12‐month remission'.
PHT: phenytoin; SV: sodium valproate.
We note that participants with event times of zero (i.e. those who experienced treatment failure or experienced seizure recurrence on the day of randomisation) are not included in the 'numbers at risk' on the graphs and that data is not stratified by trial within these survival curve plots. All figures are intended to provide a visual representation of outcomes, extent of follow‐up and visual differences between seizure types. These graphs are not intended to show statistical significance and numerical values may vary compared to the text due to differences in methodology.
We calculated all HRs presented below by generic inverse variance fixed‐effect meta‐analysis unless otherwise stated. All analyses met the assumption of proportional hazards (the addition of a time‐varying covariate into the model was non‐significant).
Primary outcome
Time to treatment failure (retention time)
For this outcome, a HR less than one indicates a clinical advantage for valproate.
Time to treatment failure and reason for treatment withdrawal or treatment failure were available for 495 individuals from four trials (De Silva 1996; Heller 1995; Ramsay 1992; Turnbull 1985); 74% of individuals from five trials providing IPD (44% of all 1119 eligible individuals). Treatment failure data were not available for the fifth trial (Craig 1994). Sufficient IPD were available in the trial publications for a further 74 individuals from two trials (Forsythe 1991; Shakir 1981). Therefore, a total of 569 individuals (51% of 1119 eligible individuals) from six trials could contribute to the analysis of this outcome.
Reasons for premature discontinuation of treatment (treatment failure) were provided for 571 participants in the six trials (reasons for treatment failure but no date of treatment failure provided for two participants). See Table 5 for reasons for premature termination of the study by treatment and how we classified these reasons in analysis.
| Reason for early termination (and classification in time‐to‐event analysis) | Heller 1995b, c | Totala | |||||||||||||
| SV | PHT | SV | PHT | SV | PHT | SV | PHT | SV | PHT | SV | PHT | SV | PHT | All | |
| Adverse events (event) | 2 | 2 | 4 | 1 | 4 | 8 | 6 | 14 | 0 | 1 | 0 | 0 | 16 | 26 | 42 |
| Lack of efficacy (event) | 11 | 10 | 9 | 8 | 1 | 1 | 2 | 0 | 2 | 1 | 3 | 6 | 28 | 26 | 54 |
| Both adverse events and lack of efficacy (event) | 4 | 5 | 6 | 2 | 0 | 0 | 1 | 2 | 0 | 0 | 0 | 0 | 11 | 9 | 20 |
| Non‐compliance/protocol violation (event) | 0 | 0 | 0 | 0 | 7 | 2 | 2 | 2 | 5 | 4 | 0 | 0 | 14 | 8 | 22 |
| Illness or death (not treatment‐related, censored)e | 0 | 0 | 0 | 0 | 1 | 1 | 3 | 3 | 0 | 0 | 0 | 0 | 4 | 4 | 8 |
| Participant went into remission (censored) | 16 | 24 | 13 | 14 | 0 | 0 | 0 | 0 | 0 | 0 | 0 | 0 | 29 | 38 | 67 |
| Lost to follow‐up (censored) | 0 | 0 | 0 | 0 | 10 | 3 | 7 | 7 | 0 | 0 | 0 | 0 | 17 | 10 | 27 |
| Other (censored)f | 0 | 0 | 0 | 0 | 3 | 0 | 0 | 0 | 0 | 0 | 0 | 0 | 3 | 0 | 3 |
| Completed the study (censored) | 14 | 12 | 26 | 38 | 60 | 35 | 49 | 42 | 14 | 14 | 15 | 9 | 178 | 150 | 328 |
| Total | 47 | 53 | 58 | 63 | 86 | 50 | 70 | 70 | 21 | 20 | 18 | 15 | 300 | 271 | 571 |
PHT: phenytoin; SV: sodium valproate
aIPD for 'time to treatment failure' was not provided for Craig 1994.
bThree participants for Heller 1995 (all SV) and three for De Silva 1996 (one PHT and two SV) have missing reasons for treatment failure.
cFour participants from Heller 1995 had missing treatment failure times and did not contribute to analysis but reasons for treatment failure are given.
dNine participants in Shakir 1981 were listed as having started on a second drug due to 'failure to respond.' This reason was classified as treatment failure due to lack of efficacy.
eDeath due to reasons not related to the study drug.
fOther reasons from Ramsay 1992 – two participants withdrew due to pregnancy and one for personal reasons.
Out of 571 participants for whom we had reasons for treatment failure or withdrawal, 243 participants prematurely withdrew from treatment (43%): 122 out of 300 (41%) participants randomised to valproate and 121 out of 271 (45%) participants randomised to phenytoin.
We deemed 138 participants (57% of total treatment failures) to have withdrawn for reasons related to the allocated drug: 69 (57% of treatment failures) on valproate and 69 (57% of treatment failures) on phenytoin and we classified these reasons as 'events' in the analysis. The most common treatment‐related reasons for treatment failure were lack of efficacy: 54 withdrawals (22% of total treatment failures), 28 (23% of total treatment failures) on valproate and 26 (21% of total treatment failures) on phenytoin; and adverse events: 42 withdrawals (17% of total treatment failures), 16 (13% of total treatment failures) on valproate and 26 (21% of total treatment failures) on phenytoin.
We classed the other 105 reasons (53 on valproate and 52 on phenytoin), which were mostly withdrawal from treatment due to seizure remission (64% of other withdrawals), to be not related to the treatment and censored these participants in the analysis, in addition to the 328 participants (178 on valproate and 150 on carbamazepine) who completed the trial without withdrawing or failing treatment.
Considering time to treatment failure for any reason related to the treatment, the overall pooled HR (for 569 participants providing IPD from 6 trials) was 0.94 (95% confidence interval (CI) 0.67 to 1.32, P = 0.17; moderate‐quality evidence) indicating no clear advantage for either drug (Analysis 1.1). No important heterogeneity was present between trials (I2= 15%).
Considering time to treatment failure due to adverse events (all other reasons for treatment failure or treatment withdrawal censored in analysis), 495 participants provided IPD from four trials; no participants withdrew from one or both of the drugs due to lack of efficacy in two of the trials (Forsythe 1991; Shakir 1981, see Table 5). The overall pooled HR was 0.68 (95% CI 0.40 to 1.17, P = 0.16; moderate‐quality evidence) which suggests a slight advantage towards valproate (i.e. a suggestion that treatment failures due to adverse events may occur later on valproate than on phenytoin), but this is not statistically significant (Analysis 1.2). A substantial amount of heterogeneity was present between trials (I2= 67%) and when analysis is repeated with random‐effects, the CIs of the pooled HR are substantially wider 0.75 (95% CI 0.28 to 1.98). This heterogeneity is investigated further in subgroup analysis by epilepsy type below.
Considering time to treatment failure due to lack of efficacy (all other reasons for treatment failure or treatment withdrawal censored in analysis), the overall pooled HR (for 569 participants providing IPD from 6 trials) was 1.23 (95% CI 0.77 to 1.97, P = 0.38; moderate‐quality evidence) which suggests a slight advantage towards phenytoin (i.e. a suggestion that treatment failures due to lack of efficacy may occur later on phenytoin than on valproate), but this is not statistically significant (Analysis 1.3). No heterogeneity was present between trials (I2= 0%).
Subgroup analyses: epilepsy type (focal versus generalised onset)
Treatment failure data for 41 participants extracted from Forsythe 1991 did not distinguish between epilepsy type (focal onset or generalised onset) and therefore could not be included in the meta‐analysis stratified by epilepsy type.
Considering time to treatment failure for any reason related to the treatment, the overall pooled HR (adjusted by epilepsy type for 528 participants from 5 trials) was 0.88 (95% CI 0.61 to 1.27, P = 0.51, I2= 29%; moderate‐quality evidence; Analysis 1.4). This result is similar to the unadjusted pooled HR (Analysis 1.1), and conclusions remain unchanged following the exclusion of 41 individuals in the stratified analysis (Forsythe 1991).
For individuals with generalised onset seizures (341 participants from 5 trials), the pooled HR was 0.94 (95% CI 0.55 to 1.61, P = 0.82, I² = 59%; low‐quality evidence), indicating no clear advantage for either drug. For individuals with focal onset seizures (187 participants from 4 trials), the pooled HR was 0.83 (95% CI 0.50 to 1.38, P = 0.48, I² = 0%; moderate‐quality evidence), suggesting a slight advantage for valproate which is not statistically significant. There was no evidence of an interaction between epilepsy type (focal onset versus generalised onset) and treatment effect (Chi² = 0.10, df = 1, P = 0.75, I² = 0%; Analysis 1.4).
A large amount of heterogeneity was present between trials within the generalised onset seizure subgroup (I² = 59%) and when analysis is repeated with random‐effects, the CIs of the pooled HR become much wider: 0.93 (95% CI 0.37 to 231). On visual inspection of the forest plot (see Analysis 1.4), one trial appears to be the source of this variability (Heller 1995), as this trial shows a large statistically significant treatment effect in favour of phenytoin, while the other four trials show general non‐significant results, mostly in favour of valproate (De Silva 1996; Ramsay 1992; Shakir 1981; Turnbull 1985). Additionally, this heterogeneity may be due to misclassification of epilepsy type (specifically where generalised onset seizures have been incorrectly classified); this is investigated further in sensitivity analysis below.
Considering time to treatment failure due to adverse events, no individuals withdrew from either drug due to adverse events in Shakir 1981 so this trial is not included in this analysis and no individuals with generalised onset seizures withdrew from valproate due to adverse events in Turnbull 1985 so this epilepsy type subgroup was not included in this analysis. The overall pooled HR (adjusted by epilepsy type for 418 participants from 4 trials) was 0.77 (95% CI 0.44 to 1.37, P = 0.38, I2=37%; moderate‐quality evidence; Analysis 1.5). This result is similar to the unadjusted pooled HR (Analysis 1.2), and conclusions remain unchanged following the exclusion of participants from Shakir 1981 and Turnbull 1985.
For individuals with generalised onset seizures (250 participants from 3 trials), the pooled HR was 0.75 (95% CI 0.35 to 1.60, P = 0.46, I² = 71%; low‐quality evidence), suggesting a slight advantage for valproate which is not statistically significant. For individuals with focal onset seizures (168 participants from 3 trials), the pooled HR was 0.81 (95% CI 0.34 to 1.90, P = 0.62, I² = 0%; moderate‐quality evidence), again suggesting a slight advantage for valproate which is not statistically significant. There was no evidence of an interaction between epilepsy type (focal onset versus generalised onset) and treatment effect (Chi² = 0.02, df = 1, P = 0.90, I² = 0%; Analysis 1.5).
Again, a large amount of heterogeneity was present between trials within the generalised onset seizure subgroup (I² = 71%), and when analysis is repeated with random‐effects, the CIs of the pooled HR are substantially wider 1.15 (95% CI 0.21 to 6.23). This variability may also originate from fairly small numbers of individuals with generalised seizures failing treatment due to adverse events (see Table 5), or similarly to the analysis of 'time to treatment failure' for any reason related to treatment, this may be due to potential misclassification of epilepsy type; this is investigated further in sensitivity analysis below.
Considering time to treatment failure due to lack of efficacy, no individuals with generalised onset seizures withdrew from either drug due to lack of efficacy in Turnbull 1985 so this epilepsy type subgroup was not included in this analysis. The overall pooled HR (adjusted by epilepsy type for 451 participants from 5 trials) was 1.16 (95% CI 0.71 to 1.89, P = 0.55, I2=0%; moderate‐quality evidence; Analysis 1.6). This result is similar to the unadjusted pooled HR (Analysis 1.3), and conclusions remain unchanged following the exclusion of participants from Turnbull 1985.
For individuals with generalised onset seizures (264 participants from 4 trials), the pooled HR was 1.51 (95% CI 0.66 to 3.45, P = 0.33, I² = 23%; low‐quality evidence), suggesting a slight advantage for phenytoin which is not statistically significant. For individuals with focal onset seizures (187 participants from 4 trials), the pooled HR was 1.01 (95% CI 0.55 to 1.85, P = 0.98, I² = 0%; moderate‐quality evidence), indicating no clear advantage for either drug. There was no evidence of an interaction between epilepsy type (focal onset versus generalised onset) and treatment effect (Chi² = 0.60, df = 1, P = 0.44, I² = 0%; Analysis 1.6). No important heterogeneity was present in overall analysis or within epilepsy type subgroups (I2 < 25% for all analyses).
Sensitivity analysis
Sensitivity analyses were conducted to investigate misclassification of seizure type, reclassifying up to 100 individuals from four trials (Heller 1995; Ramsay 1992; Shakir 1981; Turnbull 1985) aged 30 or older with new onset generalised seizures to focal onset seizures or an uncertain seizure type. The results of the two sensitivity analyses are shown in Table 6.
| Outcome | Original analysis | Generalised onset and age at onset > 30 years classified as focal onset | Generalised onset and age at onset > 30 years classified as uncertain seizure type | |||
| Pooled HR (95% CI) fixed‐effects | Test of subgroup differences | Pooled HR (95% CI) fixed‐effects | Test of subgroup differences | Pooled HR (95% CI) fixed‐effects | Test of subgroup differences | |
| Time to treatment failure (for any reason related to treatment)a | F: 0.83 (0.50 to 1.38) G: 0.94 (0.55 to 1.61) O: 0.88 (0.61 to 1.27) | Chi² = 0.10, df = 1 (P = 0.75), I² = 0% | F: 0.95 (0.59 to 1.52) G: 0.77 (0.42 to 1.41) O: 0.88 (0.60 to 1.27) | Chi² = 0.29, df = 1 (P = 0.59), I² = 0% | F: 0.83 (0.50 to 1.38) G: 0.77 (0.42 to 1.41) U: 6.83 (0.82 to 57.16) O: 0.86 (0.59 to 1.27) | Chi² = 3.80, df = 2 (P = 0.15), I² = 47.3% |
| Time to treatment failure due to adverse eventsb | F: 0.75 (0.35 to 1.60) G: 0.81 (0.34 to 1.90) O: 0.77 (0.44 to 1.37) | Chi² = 0.02, df = 1 (P = 0.90), I² = 0% | F: 0.87 (0.42 to 1.80) G: 0.64 (0.26 to 1.59) O: 0.77 (0.44 to 1.36) | Chi² = 0.26, df = 1 (P = 0.61), I² = 0% | Not calculatedb | Not calculatedb |
| Time to treatment failure due to lack of efficacyb | F: 1.01 (0.55 to 1.85) G: 1.51 (0.66 to 3.45) O: 1.16 (0.71 to 1.89) | Chi² = 0.60, df = 1 (P = 0.44), I² = 0% | F: 1.00 (0.51 to 1.96) G: 1.73 (0.56 to 5.35) O: 1.16 (0.65 to 2.06) | Chi² = 0.66, df = 1 (P = 0.42), I² = 0% | Not calculatedb | Not calculatedb |
| Time to first seizurec | F: 1.20 (0.90 to 1.60) G: 0.97 (0.72 to 1.30) O: 1.08 (0.88 to 1.33) | Chi² = 1.06, df = 1 (P = 0.30), I² = 5.6% | F: 1.23 (0.96 to 1.57) G: 0.72 (0.50 to 1.05) O: 1.05 (0.86 to 1.29) | Chi² = 5.46, df = 1 (P = 0.02), I² = 81.7% | F: 1.20 (0.90 to 1.60) G: 0.72 (0.50 to 1.05) U: 1.35 (0.85 to 2.14) O: 1.06 (0.86 to 1.30) | Chi² = 5.79, df = 2 (P = 0.06), I² = 65.5% |
| Time to 12‐month remissiond | F: 1.11 (0.78 to 1.60) G: 0.96 (0.71 to 1.29) O: 1.02 (0.81 to 1.28) | Chi² = 0.39, df = 1 (P = 0.53), I² = 0% | F: 0.99 (0.75 to 1.32) G: 1.07 (0.72 to 1.59) O: 1.02 (0.81 to 1.28) | Chi² = 0.10, df = 1 (P = 0.75), I² = 0% | F: 1.11 (0.78 to 1.60) G: 1.07 (0.72 to 1.59) U: 0.74 (0.46 to 1.18) O: 0.99 (0.79 to 1.25) | Chi² = 2.07, df = 2 (P = 0.36), I² = 3.3% |
| Time to 6‐month remissione | F: 1.00 (0.73 to 1.35) G: 1.08 (0.84 to 1.38) O: 1.05 (0.86 to 1.27) | Chi² = 0.16, df = 1 (P = 0.69), I² = 0% | F: 1.00 (0.79 to 1.26) G: 1.14 (0.80 to 1.61) O: 1.04 (0.85 to 1.26) | Chi² = 0.38, df = 1 (P = 0.54), I² = 0% | F: 1.00 (0.73 to 1.35) G: 1.14 (0.80 to 1.61) U: 0.90 (0.62 to 1.31) O: 1.01 (0.83 to 1.23) | Chi² = 0.80, df = 2 (P = 0.67), I² = 0% |
Chi²: Chi² statistic; df: degrees of freedom of Chi² distribution; F: focal epilepsy; G: generalised epilepsy; O: overall (all participants); U: uncertain epilepsy; P: P value (< 0.05 are classified as statistically significant).
a100 participants reclassified to focal epilepsy or uncertain epilepsy type for outcome 'time to treatment failure (for any reason related to treatment)'; see Analysis 1.4 for original analysis.
b100 participants reclassified to focal epilepsy or uncertain epilepsy type for outcomes 'time to treatment failure due to adverse events' and 'time to treatment failure due to lack of efficacy'; see Analysis 1.5 and Analysis 1.6 for original analyses. Forest plots not presented for sensitivity analysis for generalised and age at onset > 30 years reclassified as focal epilepsy as results were numerically similar and conclusions are unchanged. Sensitivity analysis for generalised and age at onset > 30 years reclassified as uncertain epilepsy type not performed due to small numbers of participants failing treatment for these reasons in the uncertain epilepsy type groups in each trial.
c171 participants reclassified to focal epilepsy or uncertain epilepsy type for outcome 'time to first seizure'; see Analysis 1.8 for original analysis and see Analysis 1.10 and Analysis 1.9 for forest plots of 'time to first seizure' sensitivity analyses for generalised and age at onset > 30 years reclassified as focal epilepsy and uncertain epilepsy type, respectively.
d145 participants reclassified to focal epilepsy or uncertain epilepsy type for outcome 'time to achieve 12‐month remission', see Analysis 1.12 for original analysis. As results were numerically similar and conclusions are unchanged, forest plots are not presented.
e171 participants reclassified to focal epilepsy or uncertain epilepsy type for outcome 'time to achieve 6‐month remission', see Analysis 1.14 for original analysis. As results were numerically similar and conclusions are unchanged, forest plots are not presented.
For all three treatment failure outcomes: time to treatment failure for any reason related to treatment; due to adverse events; and due to lack of efficacy, sensitivity analyses in which individuals classified as experiencing generalised onset seizures and age at onset > 30 years reclassified as experiencing focal onset seizures, show numerically similar results and conclusions remain unchanged. There was no evidence of an association between epilepsy type and treatment effect following reclassification for any of the treatment failure outcomes
Sensitivity analysis in which individuals classified as experiencing generalised onset seizures and age at onset > 30 years were reclassified as experiencing uncertain seizure type was performed only for time to treatment failure for any reason related to treatment.
In the sensitivity analysis of 'time to treatment failure for any reason related to treatment' in which individuals classified as experiencing generalised onset seizures and age at onset > 30 years were reclassified as uncertain seizure type, a large, but non‐significant advantage for phenytoin was shown in the uncertain seizure type group: (pooled HR 6.83, 0.82 to 57.16), which was substantially different in the direction of effect from estimates for the 'focal onset seizures' subgroup (pooled HR 0.83, 95% CI 0.50 to 1.38), and 'generalised onset seizures' groups (pooled HR 0.77, 95% CI 0.42 to 1.41), both indicating a non‐significant advantage for valproate. There was, however, still no evidence of an association between epilepsy type and treatment effect in this analysis (Chi² = 3.80, df = 2; (P = 0.15), I² = 47.3%) and the result within the uncertain seizure type group should be interpreted with caution due to relatively small numbers of individuals with uncertain seizure types failing treatment in each trial.
The sensitivity analysis could not be performed for 'time to treatment failure due to adverse events' or 'due to lack of efficacy' due to very small numbers of participants failing treatment for these reasons in the uncertain epilepsy type groups in each trial.
Heterogeneity present within analyses for individuals with generalised onset seizures (see Analysis 1.4 and Analysis 1.5), does not seem to be explained by the potential misclassification of seizure type; therefore results for individuals with generalised onset seizures should be interpreted with caution due to this unexplained inconsistency in results.
Secondary outcomes
Time to first seizure post‐randomisation
For this outcome, a HR less than one indicates a clinical advantage for valproate.
Data for 639 individuals (96% of those providing IPD) from five trials were available for the analysis of this outcome. Seizure recurrence occurred in 371 out of 639 participants (58%), 189 out of 333 (57%) on valproate and 181 out of 306 (59%) on phenytoin.
The overall pooled HR (for 639 participants) was 1.04 (95% CI 0.85 to 1.28, P = 0.70; low‐quality evidence) indicating no clear advantage for either drug. There was no important statistical heterogeneity between trials (I² = 5%; Analysis 1.7).
Subgroup analyses: epilepsy type (focal versus generalised onset)
For individuals with generalised seizures (395 participants from 5 trials), the pooled HR was 0.97 (95% CI 0.72 to 1.30, P = 0.82; low‐quality evidence), indicating no clear advantage for either drug. For individuals with focal onset seizures (244 participants from 4 trials), the pooled HR was 1.20 (95% CI 0.90 to 1.60, P = 0.22; low‐quality evidence), suggesting an advantage for phenytoin (i.e. that first seizure recurrence may occur later on phenytoin compared to valproate), but this advantage is not statistically significant. Overall, the pooled HR (adjusted for seizure type for 639 participants) was 1.08 (95% CI 0.88 to 1.33, P = 0.47; low‐quality evidence), suggesting a slight advantage for phenytoin which is not statistically significant. There was no evidence of an interaction between epilepsy type (focal onset versus generalised onset) and treatment effect (Chi² = 1.06, df = 1 (P = 0.30), I² = 5.6%) and no heterogeneity was present in any analysis (I² = 0%; Analysis 1.8).
Sensitivity analysis
A sensitivity analysis including generalised seizures of all types during follow‐up (only recorded in Ramsay 1992), produced the following results: for individuals with generalised seizures, the pooled HR was 0.95 (95% CI 0.71 to 1.27, P = 0.74), indicating no clear advantage for either drug. For individuals with focal onset seizures, the pooled HR was unchanged: 1.20 (95% CI 0.90 to 1.60, P = 0.22), suggesting an advantage for phenytoin which is not statistically significant. Overall, the pooled HR (adjusted for seizure type) was 1.08 (95% CI 0.86 to 1.32, P = 0.49), suggesting an advantage for phenytoin which is not statistically significant. Numerical results are very similar to those presented in Analysis 1.7 and Analysis 1.8 and overall conclusions are unchanged, therefore, results for time to first seizure (post‐randomisation) seem robust to the exclusion of other generalised seizure types (other than generalised tonic‐clonic seizures) in Ramsay 1992.
Sensitivity analyses were conducted to investigate misclassification of seizure type, reclassifying 171 individuals from four trials (Craig 1994; Heller 1995; Ramsay 1992; Turnbull 1985) aged 30 or older with new onset generalised seizures to focal onset seizures or an uncertain seizure type. The results of the two sensitivity analyses are shown in Table 6.
Within both of the sensitivity analyses, following reclassification, an association between epilepsy type and treatment effect is suggested. For generalised seizures, and age of onset > 30 years reclassified as 'focal onset seizures', the result of the test for subgroup differences is statistically significant: Chi² = 5.46, df = 1 (P = 0.02), I² = 81.7% (Analysis 1.9). Within the focal onset seizure group, a non‐significant advantage to phenytoin is suggested: 1.23 (9% CI (0.96 to 1.57, P = 0.09), while in the generalised onset seizure group, a non‐significant advantage to valproate is suggested: pooled HR 0.72 (95% CI 0.50 to 1.05, P = 0.09); although neither result is statistically significant, the observed directions of effect within this sensitivity analysis was anticipated a priori (see How the intervention might work and Subgroup analysis and investigation of heterogeneity).
For generalised seizures, and age of onset > 30 years reclassified as 'uncertain seizure type', the result of the test for subgroup differences is not statistically significant, but subgroup analysis does suggest some potential differences between the epilepsy type subgroups: Chi² = 5.79, df = 2 (P = 0.06), I² = 65.5% (Analysis 1.10).
The direction of effect for the 'uncertain seizure type' subgroup (pooled HR 1.35, 95% CI 0.85 to 2.14; P = 0.22) is similar to that of the 'focal onset' subgroup (pooled HR 1.20, 95% CI 0.90 to 1.60; P = 0.22), both indicating a non‐significant advantage for phenytoin and also suggesting that these individuals with 'uncertain' seizure types (who were originally classified as experiencing generalised onset seizures) are actually experiencing focal onset seizures. Furthermore, valproate now appears more effective in generalised onset seizures (pooled HR 0.72, 95% CI 0.50 to 1.05; P = 0.09) when compared to the original analysis (Analysis 1.8; Analysis 1.10). Again, although neither result is statistically significant, the observed directions of effect within this sensitivity analysis were anticipated a priori (see How the intervention might work and Subgroup analysis and investigation of heterogeneity).
Therefore, due to the potential impact of any misclassification of epilepsy type on the numerical results and conclusions for the outcome, 'time to first seizure', results of Analysis 1.7, Analysis 1.8, Analysis 1.9 and Analysis 1.10 should be interpreted with caution.
Time to achieve 12‐month remission (seizure‐free period)
For this outcome, a HR less than one indicates a clinical advantage for phenytoin.
Data for 514 individuals (77% of those providing IPD) from four trials were available for the analysis of this outcome (Craig 1994; De Silva 1996; Heller 1995; Turnbull 1985; see Table 4). Individuals were only followed up for six months in the fifth trial (Ramsay 1992), which could not contribute data to this outcome. Twelve‐month remission was achieved by 302 out of 514 participants (59%); 147 out of 256 (57%) on valproate and 155 out of 258 (60%) on phenytoin. The overall pooled HR (for 514 participants) was 1.03 (95% CI 0.82 to 1.29, P = 0.80; moderate‐quality evidence), indicating no clear advantage to either drug. There is no evidence of statistical heterogeneity between trials (I² = 0%; Analysis 1.11).
Subgroup analyses: epilepsy type (focal versus generalised onset)
For individuals with generalised seizures (270 participants from 4 trials), the pooled HR was 0.96 (95% CI 0.71 to 1.29, P = 0.79; moderate‐quality evidence), indicating no clear advantage for either drug. For individuals with focal onset seizures (244 participants from 4 trials), the pooled HR was 1.11 (95% CI 0.78 to 1.60, P = 0.56; moderate‐quality evidence), indicating a slight advantage for valproate ((i.e. that 12‐month remission may occur slightly earlier on valproate than phenytoin), but this advantage is not statistically significant. Overall, the pooled HR (adjusted for epilepsy type for 514 participants) was 1.02 (95% CI 0.81 to 1.28, P = 0.87; moderate‐quality evidence), suggesting no clear clinical advantage for either drug. There was no evidence of an interaction between epilepsy type (focal onset versus generalised onset) and treatment (Chi² = 0.39, df = 1, P = 0.53, I² = 0%) and no heterogeneity was present in any analysis (I² = 0%; Analysis 1.12).
Sensitivity analysis
Sensitivity analyses were conducted to investigate misclassification of seizure type, reclassifying 145 individuals from three (Craig 1994; Heller 1995; Turnbull 1985) aged 30 or older with new onset generalised seizures to focal onset seizures or an uncertain seizure type. The results of the two sensitivity analyses are shown in Table 6.
Results are numerically similar for individuals with focal onset seizures, individuals with generalised onset seizures and overall for all participants; conclusions are unchanged and there is no evidence of an association between epilepsy type and treatment effect following reclassification.
Time to achieve six‐month remission (seizure‐free period)
For this outcome, a HR less than one indicates a clinical advantage for phenytoin.
Data for 639 individuals (96% of those providing IPD) from five trials were available for the analysis of this outcome (see Table 4). Six‐month remission was achieved by 434 out of 639 participants (68%); 228 out of 333 (68%) on valproate and 206 out of 306 (67%) on phenytoin. The overall pooled HR (for 639 participants) was 1.08 (95% CI 0.89 to 1.30, P = 0.44; moderate‐quality evidence), suggesting a slight advantage to valproate (i.e. that six‐month remission may occur slightly earlier on valproate than phenytoin), but this advantage is not statistically significant. There is no evidence of statistical heterogeneity between trials (I² = 0%; see Analysis 1.13).
Subgroup analyses: epilepsy type (focal versus generalised onset)
For individuals with generalised seizures (395 participants from 5 trials), the pooled HR was 1.08 (95% CI 0.84 to 1.38, P = 0.54; moderate‐quality evidence), suggesting an advantage for valproate which is not statistically significant. For individuals with focal onset seizures (244 participants from 4 trials), the pooled HR was 1.00 (95% CI 0.73 to 1.35, P = 0.98; moderate‐quality evidence), indicating no clear advantage for either drug. Overall, the pooled HR (adjusted for epilepsy type for 639 participants) was 1.05 (95% CI 0.86 to 1.27, P = 0.64; moderate‐quality evidence), suggesting no clear advantage for either drug. There was no evidence of an interaction between epilepsy type (focal onset versus generalised onset) and treatment (Chi² = 0.16, df = 1, P = 0.69, I² = 0%) and no heterogeneity was present in any analysis (I² = 0%; Analysis 1.14).
Sensitivity analyses
A sensitivity analysis including generalised seizures of all types during follow‐up (only recorded in Ramsay 1992) produced the following results: for individuals with generalised seizures (395 participants from 5 trials), the pooled HR was 1.19 (95% CI 0.88 to 1.61, P = 0.26), suggesting an advantage for valproate, which is not statistically significant. For individuals with focal onset seizures (244 participants from 4 trials), the pooled HR was unchanged: 1.00 (95% CI 0.73 to 1.35, P = 0.98), indicating no clear advantage for either drug. Overall, the pooled HR (adjusted for epilepsy type) was 1.09 (95% CI 0.88 to 1.37, P = 0.40), suggesting an advantage for valproate, which is not statistically significant.
By including information on other generalised seizure types in the trial by Ramsay 1992, a very slightly greater advantage for valproate emerges. However, as numerical results are similar to those presented in Analysis 1.13 and Analysis 1.14 and overall conclusions are unchanged, results for time to six‐month remission seem robust to the exclusion of other generalised seizure types (other than generalised tonic‐clonic seizures) in Ramsay 1992.
Sensitivity analyses were conducted to investigate misclassification of seizure type, reclassifying 171 individuals from four trials (Craig 1994; Heller 1995; Ramsay 1992; Turnbull 1985) aged 30 or older with new onset generalised seizures to focal onset seizures or an uncertain seizure type. The results of the two sensitivity analyses are shown in Table 6.
Results are numerically similar for individuals with focal onset seizures, individuals with generalised onset seizures and overall for all participants; conclusions are unchanged and there is no evidence of an association between epilepsy type and treatment effect following reclassification.
Incidence of adverse events
See Table 7 for details of all adverse event data provided in the studies included in this review. It is difficult to summarise the 'most common' adverse events overall across the 11 studies due to the differences in methods and differences in the levels of detail in the reporting of adverse event data across the studies. In summary, the adverse events reported by two or more studies in this review are the following.
| Trial | Adverse event dataa | Summary of reported results | |
| Phenytoin (PHT) | SV (sodium valproate) | ||
| All adverse events developed (by drug) and adverse events leading to discontinuation of treatment | PHT (n = 58): gum hypertrophy (n = 2), rash (n = 2), ataxia (n = 2)
| SV (n = 64): weight gain (n = 4: all discontinued treatment), drowsiness (n = 2), aggressive behaviour (n = 1: discontinued treatment) | |
| Adverse event frequency (spontaneous reports)b Discontinuations due to adverse eventsc | PHT (n = 25): unsteadiness (n = 9), sleepiness (n = 7), drowsiness (n = 2), impaired concentration (n = 2), confusion (n = 1), constipation (n = 1), diarrhoea (n = 1), dysarthria (n = 1), lethargy (n = 1), nystagmus (n = 1), rash (n = 1), tired legs (n = 1) PHT discontinuations (n = 6): rash (n =1), diarrhoea (n = 1), confusion (n = 1), unsteadiness (n = 1), constipation (n = 1), sleepiness (n = 1) | SV (n = 17): unsteadiness (n = 2), sleepiness (n = 3), tremor (n = 5), oedema (n = 3), alopecia (n = 2), depression (n = 2), weight gain (n = 2) SV discontinuations (n = 2): weight gain and depression (n = 1), unsteadiness (n =1) | |
| "Exclusions" due to adverse events or no efficacyd | Proportion "excluded": PHT: 33.3% | Proportion "excluded": SV: 23.3% | |
| "Unacceptable" adverse events leading to drug withdrawale | PHT (n = 54): drowsiness (n = 2), skin rash (n = 1) blood dyscrasia (n = 1), hirsutism (n = 1) | SV (n = 49): behavioural (n = 1), tremor (n = 1) | |
| No adverse event data reported (treatment withdrawal data only reported) | 1 participant (PHT) withdrew from the study due to depression and anorexia | No adverse event data (or treatment withdrawals due to adverse events) reported | |
| “Unacceptable” adverse events leading to drug withdrawale | PHT (n = 63): myalgia (n = 1), irritability (n = 1)
| SV (n = 61): dizziness (n = 2) abnormal liver function test (n = 1) | |
| Most common adverse events (by treatment group)f | PHT (n = 50): dyspepsia (n = 1), nausea (n = 2), dizziness (n = 2), somnolence (n = 5), tremor (n = 2), rash (n = 4)
| SV (n = 86): dyspepsia (n = 7), nausea (n = 10), dizziness (n = 5), somnolence (n = 8), tremor (n = 5), rash (n = 3) | |
| Commonest adverse events (reported as percentages by treatment group)f | PHT (n = 45): gum hyperplasia (17.7%), nystagmus (13.33%), ataxia (2.2%), gastrointestinal disturbances (4.44%), drowsiness (4.44%) | SV (n = 49): gastrointestinal disturbances (12%), drowsiness (6.12%), weight gain (2.04%) | |
| Adverse events (narrative description)b | PHT (n = 15): 1 case of ataxia, 5 cases of acne | SV (n = 18): 2 cases of gastrointestinal symptoms, 2 cases of hair loss, 4 cases of weight gain | |
| Assessment of adverse eventsb | PHT (n = 52): 33 participants reported at least one side effect Reported frequencies: gingival hypertrophy (n = 30), ataxia (n = 13), sedation (n = 12), nausea and vomiting (n = 1) Other reported adverse events (no frequencies): nystagmus, confusion | SV (n = 48): 15 participants reported at least one side effect Reported frequencies: hyperactivity (n = 6), impaired school performance (n = 4), severe skin allergy (n = 1) | |
| Treatment withdrawals due to dose‐related and idiosyncratic adverse events | PHT (n = 70): 11 treatment withdrawals due to dose‐related adverse events (nystagmus, ataxia, tremor, diplopia and mental change) 5 treatment withdrawals due to idiosyncratic adverse events (skin eruption, erythroderma and jaundice) | SV (n = 70): 9 treatment withdrawals due to dose‐related adverse events (tremor, irritability, restlessness and alopecia) No treatment withdrawals due to idiosyncratic adverse events | |
aAdverse event data, as reported narratively in the publications. Adverse event data were not requested in original IPD requests but will be for all future IPD requests. For numbers of treatment withdrawals due to adverse events in studies for which IPD were provided (De Silva 1996; Heller 1995; Ramsay 1992; Turnbull 1985) see Table 5.
bParticipants may report more than one adverse event.
cThe published paper, Craig 1994, reports on a subset of 38 participants, so the adverse event data summary applies only to this subset. IPD were provided for 166 participants (no additional adverse event data provided).
dCzapinski 1997a is an abstract only so very little information is reported.
eParticipants may have withdrawn due to adverse event alone or a combination of adverse events and poor efficacy (seizures).
fMost commonly reported adverse events only, no indication of overall frequency of all adverse events.
For valproate:
-
drowsiness/somnolence/sedation (reported by Callaghan 1985; Craig 1994; De Silva 1996; Ramsay 1992; Rastogi 1991);
-
weight gain (reported by Callaghan 1985; Craig 1994; Rastogi 1991; Shakir 1981);
-
tremor (reported by Craig 1994; De Silva 1996; Ramsay 1992; Turnbull 1985);
-
alopecia/hair loss (reported by Craig 1994; Shakir 1981; Turnbull 1985);
-
dizziness/unsteadiness (reported by Craig 1994; Heller 1995; Ramsay 1992);
-
skin allergy/rash (reported by Ramsay 1992; Thilothammal 1996); and
-
gastrointestinal problems (reported by Rastogi 1991; Shakir 1981).
For phenytoin:
-
gingival (gum) hypertrophy/hyperplasia (reported by Callaghan 1985; Rastogi 1991; Thilothammal 1996);
-
rash (reported by Callaghan 1985; Craig 1994; De Silva 1996; Ramsay 1992);
-
ataxia (reported by Callaghan 1985; Rastogi 1991; Shakir 1981; Thilothammal 1996; Turnbull 1985);
-
nausea (reported by Ramsay 1992; Thilothammal 1996);
-
dizziness/unsteadiness (reported by Craig 1994; Ramsay 1992);
-
nystagmus (reported by Craig 1994; Rastogi 1991; Thilothammal 1996; Turnbull 1985);
-
drowsiness/somnolence/sedation (reported by Craig 1994; De Silva 1996; Ramsay 1992; Rastogi 1991; Thilothammal 1996); and
-
tremor (reported by Ramsay 1992; Turnbull 1985).
Discussion
Summary of main results
The results of this review do not demonstrate a statistically significant effect in favour of either valproate or phenytoin for the primary global outcome 'time to treatment failure for any reason related to the treatment (retention time)'. This outcome is influenced by both the relative efficacy of the two drugs, and differences in tolerability and safety.
As a difference in efficacy in one direction may be confounded by a difference in tolerability in the other, it may not be surprising that any estimated differences are small, yet when considering specific reasons for treatment failure (adverse events or lack of efficacy), still no statistically significant differences were found between the two drugs. The confidence intervals for the treatment failure outcomes are relatively wide; too wide to confirm equivalence and clinically important differences have not been excluded, particularly when results for generalised and focal onset seizure subgroups are examined. Furthermore, as at least three of the trials contributing individual participant data (IPD) to this outcome were open‐label, clinical preconceptions about the two treatments, such as that valproate is more effective in generalised seizures, while phenytoin is more effective in focal onset seizures, and lack of masking, may have influenced the treatment failure rates of the two treatments.
Similarly for the secondary outcomes 'time to achieve 12‐month remission (seizure‐free period)', 'time to achieve six‐month remission (seizure‐free period)', and 'time to first seizure', although no statistically significant differences were found between valproate and phenytoin, the confidence intervals are too wide to confirm equivalence.
Overall completeness and applicability of evidence
We have gratefully received IPD for 669 individuals (60% of individuals from all eligible trials) from the authors of five trials, which included a comparison of phenytoin with valproate for the treatment of epilepsy (Craig 1994; De Silva 1996; Heller 1995; Ramsay 1992; Turnbull 1985). However, 376 individuals (34%) from four relevant trials could not be included in any analysis, as IPD were not available and outcomes of interest were not reported in the published reports (Callaghan 1985; Czapinski 1997a; Rastogi 1991; Thilothammal 1996). Sufficient data for 74 individuals (6%) were published in two trials to contribute to analysis for the primary outcome 'time to treatment failure' (Forsythe 1991; Shakir 1981), but insufficient data were available to include these individuals in the analyses of other outcomes. Having to exclude data for one‐third of eligible participants due to lack of IPD and insufficient reporting in study publications is likely to impact on the applicability of the evidence, however it is difficult to quantify exactly how large this impact could be.
We did not find evidence of an interaction between treatment and seizure type in any analysis using the epileptic seizure types that participants were classified with in the original analysis. This result is surprising, given the strong clinical impression that valproate is more effective in generalised onset seizures while phenytoin is more effective in focal onset seizures.
It may well be that an interaction does not exist. Alternatively, it may be that an interaction does exist but that our meta‐analysis may not have the statistical power needed to detect an interaction; it must be understood that the confidence intervals around the estimates are wide, and that these results do not exclude the possibility of important differences existing. Additionally, subgroup analyses by epilepsy type show some inconsistent results, such as for our primary outcome 'time to treatment failure for any reason related to the treatment', treatment effect estimates indicate a potentially important advantage for valproate for focal onset seizures, with no clear advantage for either drug for generalised tonic‐clonic seizures, which goes against current practice and belief. Furthermore, a substantial amount of statistical heterogeneity was present in some analyses of 'time to treatment failure,' particularly within analyses of individuals with generalised onset seizures, which could not be explained by sensitivity analyses.
The impression that valproate is better for generalised seizures may derive from its effects on generalised seizures other than tonic‐clonic, but important differences could exist for absence and myoclonus seizure types. However, were this the case, we might have expected to see a treatment‐seizure type interaction for the outcome 'time to treatment failure', if treatment had failed or a further drug added to combat other seizure types. We were unable to investigate these seizure types in detail in this review as most of the trials providing IPD did not record post‐randomisation generalised seizure types other than tonic‐clonic occurring post‐randomisation.
The results of the original trials, and hence this meta‐analysis, may have been confounded by classification bias, i.e. individuals with generalised seizures may have been misclassified as having focal onset seizures and vice versa. There is good evidence from our three reviews in our series of pair‐wise reviews for monotherapy in epilepsy comparing carbamazepine to phenobarbitone, phenytoin and valproate that misclassification is indeed an important issue in epilepsy trials (Marson 2000; Nolan 2016c; Nevitt 2017b). Within our review, the most striking indication that misclassification may be a problem is the classification of subjects in Craig 1994. In this trial, 95 out of 166 (56%) of the recruited individuals were classified as having a generalised epilepsy, which seems unlikely given that the individuals were newly diagnosed and over the age of 60 (Malafosse 1994). It is also interesting to note that Ramsay 1992 is the only trial in this review that attempted to recruit only individuals with generalised tonic‐clonic seizures, However, this trial recruited too few individuals to have the power to detect a difference between valproate and phenytoin. In this trial, for a subgroup of individuals with definite electroencephalographic (EEG) changes to support a diagnosis of an idiopathic generalised epilepsy, there appeared to be a greater (but not significant) advantage for valproate, compared to the trial population overall. This could again be interpreted as supporting the potential for misclassification, which in turn could confound an interaction between treatment and seizure type. We were unable to test for the effects of EEG changes on the interaction between treatment and seizure type due to EEG data not being collected for all trials, and even where it was available, it was not done in a uniform way. It is likely that these trials were initiated before the publication of the International League Against Epilepsy Classification of Epileptic Syndromes in 1989 (Commission 1989), but they did use the International League Against Epilepsy Classification of Epileptic Seizures that was published in 1981 (Commission 1981), which does allow individuals to be classified as those with focal onset or generalised seizures. The age of onset distribution of individuals classified as having generalised seizures indicates misclassification is likely to have occurred in up to 188 out of 384 (49%) individuals classified as having generalised onset seizures. Our results, based on reclassifying the 188 individuals, indicate that classification bias is a potentially important confounder of the results of this review, particularly the outcome 'time to first seizure'.
Finally, it should be mentioned that the preparation of valproate used in the included trials may have influenced the results. The trials conducted in the UK all used valproate (Epilim) (Craig 1994; De Silva 1996; Heller 1995; Turnbull 1985). Ramsay 1992, conducted in the USA, used valproic acid (Depakene) which is thought to cause more gastrointestinal side effects than preparations containing either a mixture of valproate and valproic acid, or valproate alone. There is no evidence from RCTs to support this, but there are some data from observational studies (Brasfield 1999; Cranor 1997; Wilder 1983a). Given that this meta‐analysis, and a similar meta‐analysis comparing valproate and carbamazepine have failed to find convincing evidence of differences in effect between different drugs (Marson 2000), it seems unlikely that differing preparations of the same drug are likely to have a major effect.
Quality of the evidence
The five trials for which IPD were made available were of generally good quality, with all five trials describing adequate methods of randomisation, and Craig 1994, De Silva 1996 and Heller 1995 also describing adequate methods of allocation concealment. However, none of the five trials described a method of blinding of participants and personnel, and only one trial stated that cognitive outcome assessors were blinded to treatment allocation, raising the possibility of performance and detection bias (Craig 1994). Three trials were designed as open‐label for "practical and ethical reasons" (De Silva 1996; Heller 1995; Ramsay 1992); for example, Ramsay 1992 stated that the side effects of the respective drugs would "quickly unblind" the trial anyway. A further difference between the five trials was the population recruited; two trials recruited adults of all ages (Heller 1995; Turnbull 1985), one recruited children only (De Silva 1996), one recruited adults and children (Ramsay 1992), and one recruited adults over the age of 60 only (Craig 1994).
As explained within Overall completeness and applicability of evidence, misclassification of seizure type (classification bias) is likely to have impacted upon the results of the outcome 'time to first seizure' and for treatment failure outcomes, unexplained heterogeneity was present in analysis, following subgroup analysis and sensitivity analysis (including reclassification of seizure type).
For the reasons outlined in this section, we judged the quality of the evidence to be moderate to low for 'time to treatment failure' due to risk of detection bias and unexplained heterogeneity (summary of findings Table for the main comparison), and low/moderate for the outcomes of 'time to first seizure' and 'time to 12‐month remission' respectively, due to risk of detection bias and classification bias (see summary of findings Table 2).
Potential biases in the review process
We were able to include IPD up to 743 out of 1119 eligible participants (66%) from seven out of 11 trials in this review in the analysis of at least one outcome. Such an approach has many advantages, such as allowing the standardisation of definitions of outcomes across trials, and attrition and reporting biases are reduced as we can perform additional analyses and calculate additional outcomes from unpublished data. For the outcomes we used in this review that are of a time‐to‐event nature, an IPD approach is considered to be the 'gold standard' approach to analysis (Parmar 1998).
For reasons outside of our control, we were unable to obtain or extract any IPD for 376 participants (34%) from four trials for inclusion in any outcomes of this review; it is difficult to quantify whether the exclusion of at least 34% of eligible participants from analyses is likely to have impacted on the conclusions of this review.
Finally, we made some assumptions in the statistical methodology used in this review. Firstly, when we received only follow‐up dates and seizure frequencies, we used linear interpolation to estimate. We are aware that an individual's seizure patterns may be non‐linear; therefore for this reason, in addition to the reasons outlined in Overall completeness and applicability of evidence, we recommend caution when interpreting the numerical results of the seizure‐related outcomes.
Agreements and disagreements with other studies or reviews
No single trial has found convincing differences between valproate and phenytoin with respect to seizure control or seizure type (Callaghan 1985; Craig 1994; Czapinski 1997a; De Silva 1996; Forsythe 1991; Heller 1995; Ramsay 1992; Rastogi 1991; Shakir 1981; Thilothammal 1996; Turnbull 1985). However, confidence intervals around estimates have been wide and equivalence cannot be inferred. Furthermore, this systematic review and meta‐analysis has not found any statistically significant differences between valproate and phenytoin for any of the outcomes measures. To our knowledge, this is the only systematic review and meta‐analysis which compares valproate and phenytoin monotherapy for focal onset seizures and generalised onset tonic‐clonic seizures. A network meta‐analysis has been published (Nevitt 2017a), comparing all direct and indirect evidence from phenytoin, valproate and other standard and new antiepileptic drugs licensed for monotherapy, and it also found no differences between valproate and phenytoin for the outcomes specified in this review.

Study flow diagram.
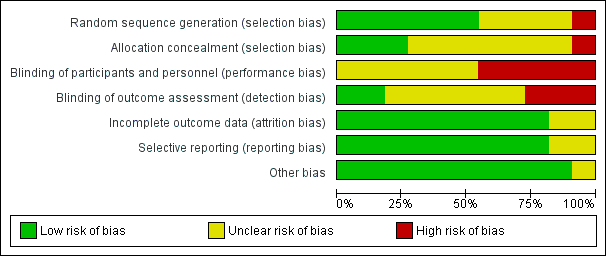
'Risk of bias' graph: review authors' judgements about each risk of bias item presented as percentages across all included studies.

'Risk of bias' summary: review authors' judgements about each risk of bias item for each included study.
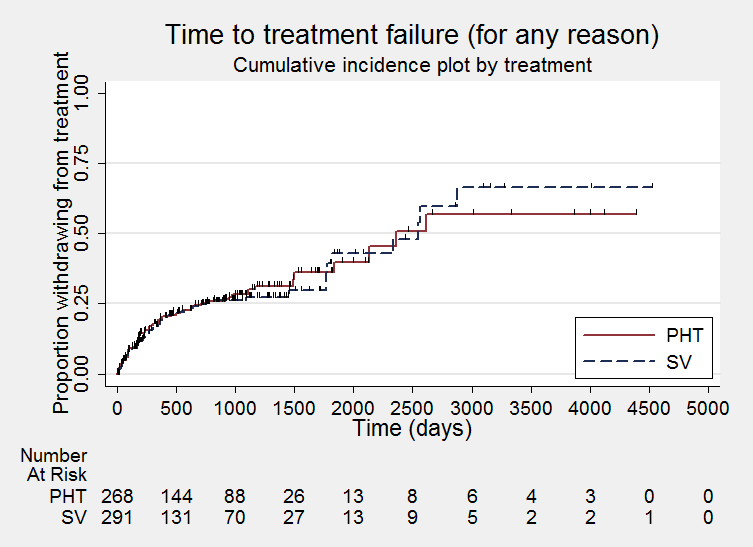
Time to treatment failure ‐ any reason related to the treatment (PHT: phenytoin; SV: sodium valproate)
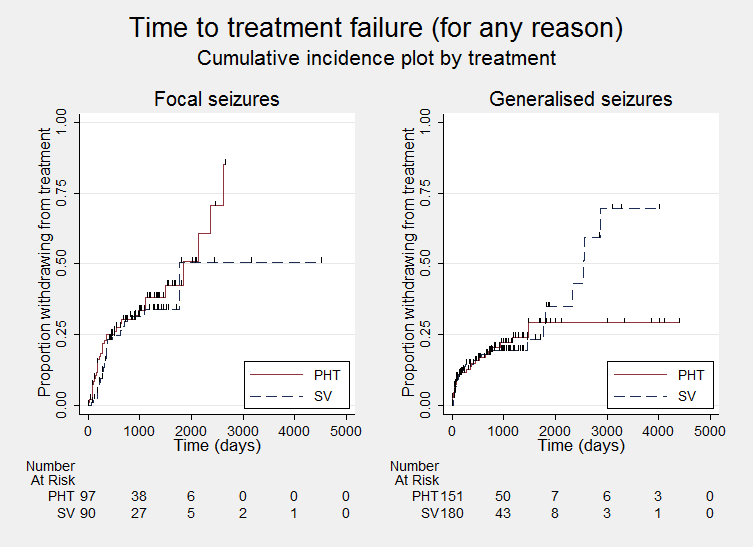
Time to treatment failure ‐ any reason related to the treatment, by epilepsy type (PHT: phenytoin; SV: sodium valproate)
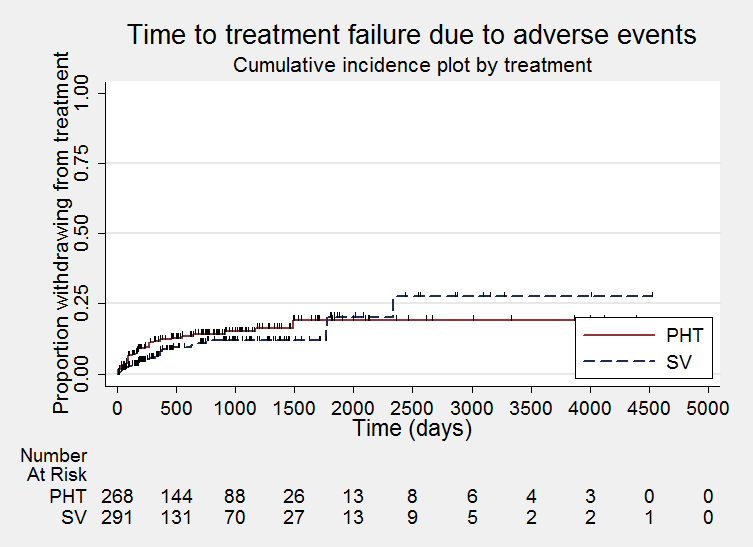
Time to treatment failure due to adverse events (PHT: phenytoin; SV: sodium valproate)

Time to treatment failure due to adverse events, by epilepsy type (PHT: phenytoin; SV: sodium valproate)

Time to treatment failure due to lack of efficacy (PHT: phenytoin; SV: sodium valproate)

Time to treatment failure due to lack of efficacy, by epilepsy type (PHT: phenytoin; SV: sodium valproate)

Time to first seizure (PHT: phenytoin; SV: sodium valproate)

Time to first seizure ‐ by epilepsy type. (PHT: phenytoin; SV: sodium valproate)

Time to achieve 12‐month remission (PHT: phenytoin; SV: sodium valproate)
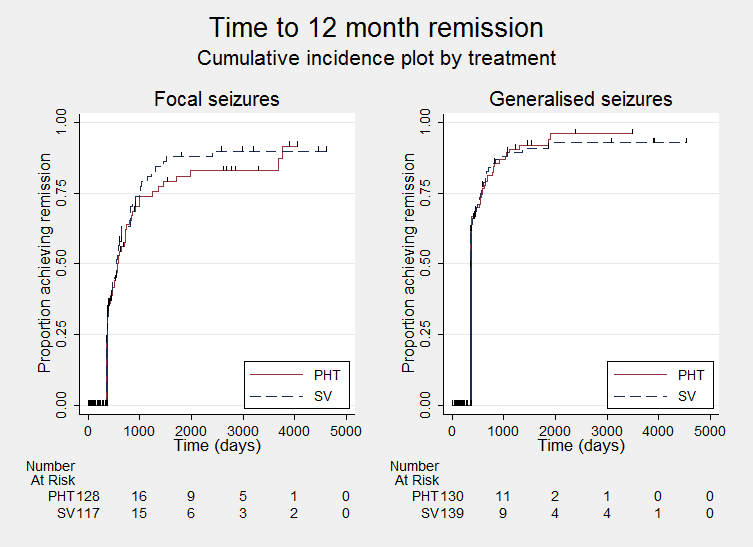
Time to achieve 12‐month remission ‐ by epilepsy type. (PHT: phenytoin; SV: sodium valproate)
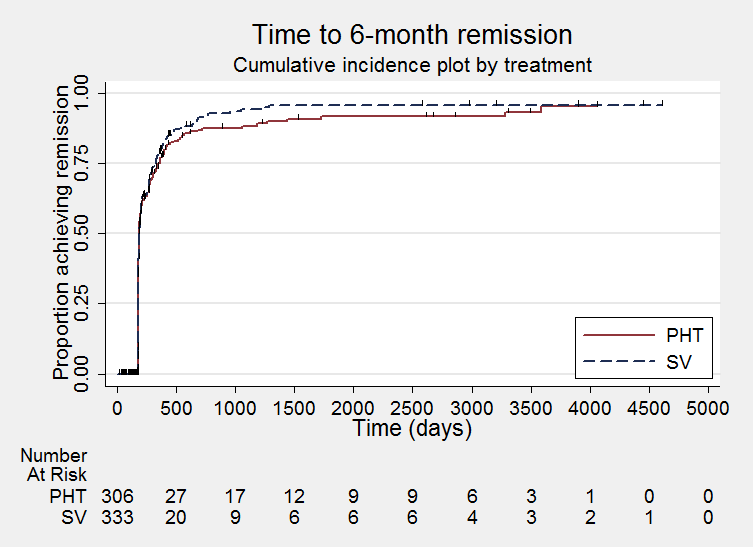
Time to achieve six‐month remission (PHT: phenytoin; SV: sodium valproate)

Time to achieve six‐month remission (PHT: phenytoin; SV: sodium valproate)

Comparison 1 Sodium valproate versus phenytoin, Outcome 1 Time to treatment failure (any reason related to the treatment).
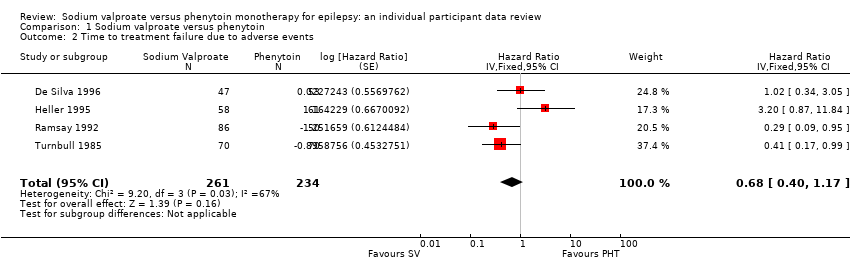
Comparison 1 Sodium valproate versus phenytoin, Outcome 2 Time to treatment failure due to adverse events.

Comparison 1 Sodium valproate versus phenytoin, Outcome 3 Time to treatment failure due to lack of efficacy.

Comparison 1 Sodium valproate versus phenytoin, Outcome 4 Time to treatment failure (any reason related to the treatment) ‐ by epilepsy type.
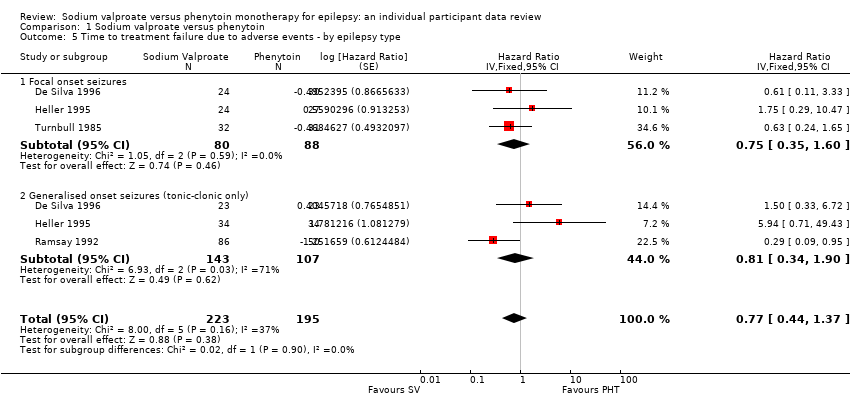
Comparison 1 Sodium valproate versus phenytoin, Outcome 5 Time to treatment failure due to adverse events ‐ by epilepsy type.

Comparison 1 Sodium valproate versus phenytoin, Outcome 6 Time to treatment failure due to lack of efficacy ‐ by epilepsy type.

Comparison 1 Sodium valproate versus phenytoin, Outcome 7 Time to first seizure.

Comparison 1 Sodium valproate versus phenytoin, Outcome 8 Time to first seizure ‐ by epilepsy type.
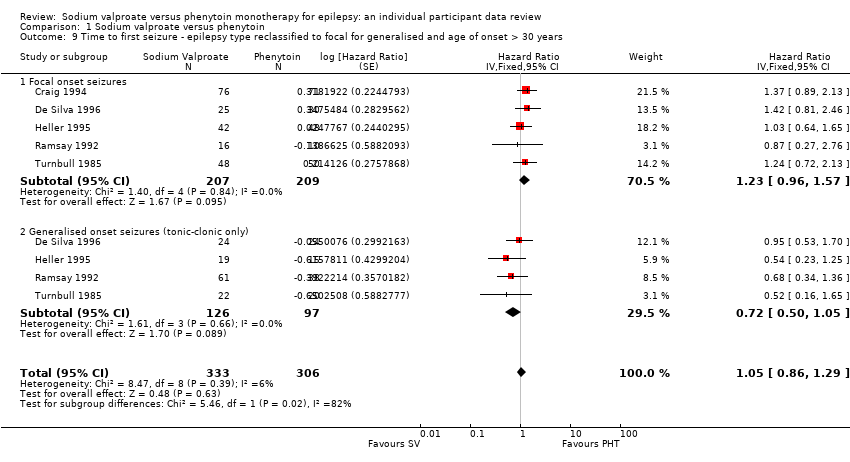
Comparison 1 Sodium valproate versus phenytoin, Outcome 9 Time to first seizure ‐ epilepsy type reclassified to focal for generalised and age of onset > 30 years.
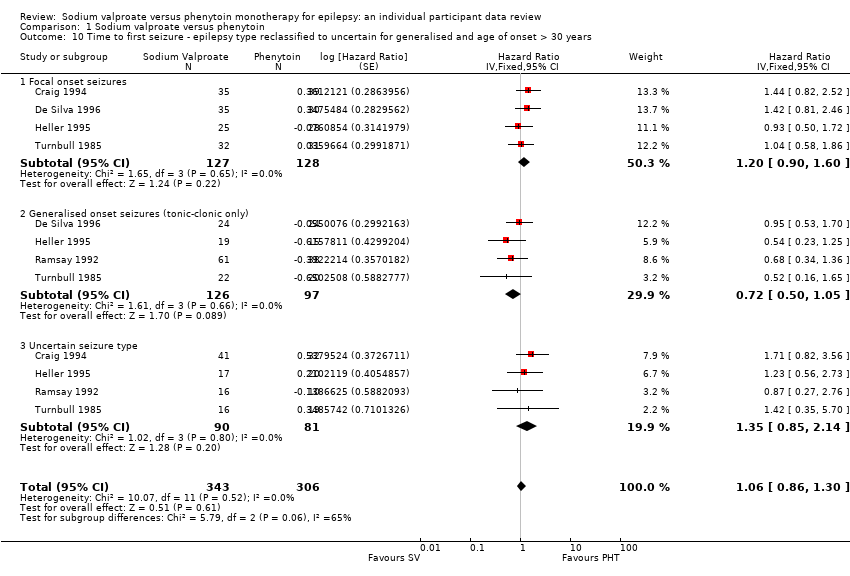
Comparison 1 Sodium valproate versus phenytoin, Outcome 10 Time to first seizure ‐ epilepsy type reclassified to uncertain for generalised and age of onset > 30 years.
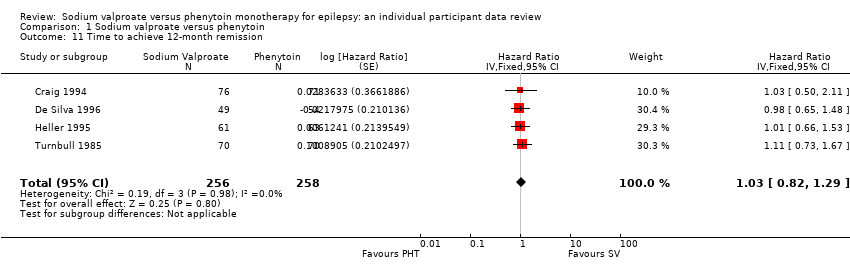
Comparison 1 Sodium valproate versus phenytoin, Outcome 11 Time to achieve 12‐month remission.
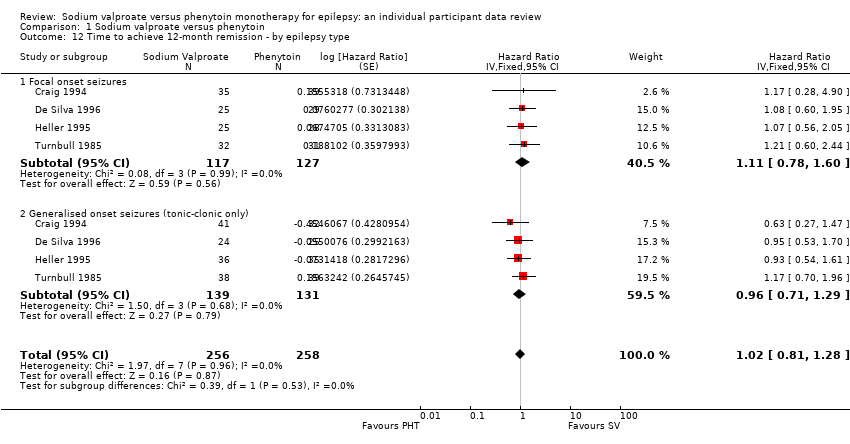
Comparison 1 Sodium valproate versus phenytoin, Outcome 12 Time to achieve 12‐month remission ‐ by epilepsy type.

Comparison 1 Sodium valproate versus phenytoin, Outcome 13 Time to achieve six‐month remission.

Comparison 1 Sodium valproate versus phenytoin, Outcome 14 Time to achieve six‐month remission ‐ by epilepsy type.
| Sodium valproate compared with phenytoin monotherapy for epilepsy | ||||||
| Patient or population: adults and children with newly‐onset focal onset or generalised tonic‐clonic seizures Settings: outpatients Intervention: sodium valproate Comparison: phenytoin | ||||||
| Outcomes | Illustrative comparative risks* (95% CI) | Relative effect | No. of Participants | Quality of the evidence | Comments | |
| Assumed risk | Corresponding risk | |||||
| Phenytoin | Sodium valproate | |||||
| Time to treatment failure (any reason related to treatment) All participants Range of follow‐up: 0 to 4256 days | The median time to treatment failure was 2361 days in the phenytoin group | The median time to treatment failure was 2545 days (184 days longer) in the sodium valproate group | HR 0.88 (0.61 to 1.27)a | 528 | ⊕⊕⊕⊝ | HR < 1 indicates a clinical advantage for valproate There was also no statistically significant difference between drugs in treatment failure due to adverse events: HR 0.77 (95% CI 0.44 to 1.37, P = 0.38) or treatment failure due to lack of efficacy: HR 1.16 (95% CI 0.71 to 1.89, P = 0.55) |
| Time to treatment failure (any reason related to treatment) Subgroup: focal onset seizures Range of follow‐up: 0 to 4256 days | The median time to treatment failure was 1838 days in the phenytoin group | The median time to treatment failure was 1772 days (66 days shorter) in the sodium valproate group | HR 0.83 (0.50 to 1.38) | 187 (4 studies) | ⊕⊕⊕⊝ | HR < 1 indicates a clinical advantage for valproate There was also no statistically significant difference between drugs in treatment failure due to adverse events: HR 0.81 (95% CI 0.34 to 1.90, P = 0.62) or treatment failure due to lack of efficacy: HR 1.01 (95% CI 0.55 to 1.85, P = 0.98) |
| Time to treatment failure (any reason related to treatment) Subgroup: generalised onset seizures (tonic‐clonic only) Range of follow‐up: 0 to 4394 days | The 25th percentile** of time to treatment failure was 1488 days in the phenytoin group | The 25th percentile** of time to treatment failure was 1778 days (290 days longer) in the sodium valproate group | HR 0.94 (0.55 to 1.61) | 341 | ⊕⊕⊕⊝ | HR < 1 indicates a clinical advantage for valproate There was also no statistically significant difference between drugs in treatment failure due to adverse events: HR 0.75 (95% CI 0.35 to 1.60, P = 0.46) or treatment failure due to lack of efficacy: HR 1.51 (95% CI 0.66 to 3.45, P = 0.33) |
| * Illustrative risks in the sodium valproate and phenytoin groups are calculated at the median time to treatment failure (i.e. the time to 50% of participants failing or withdrawing from allocated treatment) within each group across all trials. The relative effect (pooled HR) shows the comparison of 'time to treatment failure' between the treatment groups. ** The 25th percentile of time to treatment failure (i.e. the time to 25% of participants failing or withdrawing from allocated treatment) is presented for the subgroup with generalised seizures as less than 50% of participants failed/withdrew from treatment, therefore the median time could not be calculated. Abbreviations: CI: confidence interval; HR: hazard ratio. | ||||||
| GRADE Working Group grades of evidence | ||||||
| aPooled HR for all participants adjusted for seizure type. | ||||||
| Valproate compared with phenytoin monotherapy for epilepsy | ||||||
| Patient or population: adults and children with newly‐onset focal onset or generalised tonic‐clonic seizures Settings: outpatients Intervention: sodium valproate Comparison: phenytoin | ||||||
| Outcomes | Illustrative comparative risks* (95% CI) | Relative effect | No. of Participants | Quality of the evidence | Comments | |
| Assumed risk | Corresponding risk | |||||
| Phenytoin | Sodium valproate | |||||
| Time to first seizure (post‐randomisation) All participants Range of follow‐up: 0 to 4859 days | The median time to first seizure post‐randomisation was 275 days in the phenytoin group | The median time to first seizure post‐randomisation was 267 days (7 days shorter) in the sodium valproate group | HR 1.08 (0.88 to 1.33)a | 639 (5 studies) | ⊕⊕⊝⊝ | HR < 1 indicates a clinical |
| Time to first seizure (post‐randomisation) Subgroup: focal onset seizures Range of follow‐up: 0 to 4859 days | The median time to first seizure post‐randomisation was 75 days in the phenytoin group | The median time to first seizure post‐randomisation was 41 days (34 days shorter) in the sodium valproate group | HR 1.20 (0.90 to 1.60) | 244 (4 studies) | ⊕⊕⊝⊝ | HR < 1 indicates a clinical |
| Time to first seizure (post‐randomisation) Subgroup: generalised onset seizures (tonic‐clonic only) Range of follow‐up: 1 to 4520 days | The median time to first seizure post‐randomisation was 572 days in the phenytoin group | The median time to first seizure post‐randomisation was 549 days (23 days shorter) in the sodium valproate group | HR 0.97 (0.72 to 1.30) | 395 (5 studies) | ⊕⊕⊝⊝ | HR < 1 indicates a clinical |
| Time to achieve 12‐month remission (seizure‐free period) All participants Range of follow‐up: 5 to 4614 days | The median time to achieve 12‐month remission was 380 days in the phenytoin group | The median time to achieve 12‐month remission was 386 days (6 days longer) in the sodium valproate group | HR 1.02 (0.81 to 1.28) | 514 (4 studies) | ⊕⊕⊕⊝ | HR < 1 indicates a clinical |
| Time to achieve 12‐month remission (seizure‐free period) Subgroup: focal onset seizures Range of follow‐up: 5 to 4614 days | The median time to achieve 12‐month remission was 575 days in the phenytoin group | The median time to achieve 12‐month remission was 549 days (26 days shorter) in the sodium valproate group | HR 1.11 (0.78 to 1.60) | 244 (4 studies) | ⊕⊕⊕⊝ | HR < 1 indicates a clinical |
| Time to achieve 12‐month remission (seizure‐free period) Subgroup: generalised onset seizures (tonic‐clonic only) Range of follow‐up: 7 to 4544 days | The median time to achieve 12‐month remission was 365 days in the phenytoin group | The median time to achieve 12‐month remission was 366 days (1 day longer) in the sodium valproate group | HR 0.96 (0.71 to 1.29) | 270 (4 studies) | ⊕⊕⊕⊝ | HR < 1 indicates a clinical |
| * Illustrative risks in the phenytoin and sodium valproate groups are calculated at the median time to first seizure or time to 12‐month remission (i.e. the time to 50% of participants experiencing a first seizure or 12 months of remission) within each group across all trials. The relative effect (pooled HR) shows the comparison of 'time to first seizure' or 'time to 12‐month remission' between the treatment groups. Abbreviations: CI: confidence interval; HR: hazard ratio. | ||||||
| GRADE Working Group grades of evidence | ||||||
| aPooled HR for all participants adjusted for seizure type. | ||||||
| Focal seizures: n (%) | Male gender: n (%) | Age at entry (years): Mean (SD), range | Aged > 30 years and generalised seizures: n (%) | Epilepsy duration (years): mean (SD), range | Number of seizures in prior 6 months: median (range) | |||||||||||||
| SV | PHT | Missing | SV | PHT | Missing | SV | PHT | Missing | SV | PHT | Missing | SV | PHT | Missing | SV | PHT | Missing | |
| 37 (44%) | 43 (53%) | 0 | 38 (46%) | 33 (41%) | 3 | 77.6 (7.2), 61 to 95 | 78.7 (7.0), 64 to 95 | 3 | 46 | 38 | 0 | NA | NA | 166 | 2 (0 to 60) | 3 (1 to 99) | 3 | |
| 25 (51%) | 30 (56%) | 0 | 18 (37%) | 34 (63%) | 0 | 11.3 (3.3), 2 to 15 | 9.5 (3.4), 3 to 15 | 0 | 0 | 0 | 0 | 1.2 (1.5), 0 to 4.9 | 1.0 (2.1), 0 to 13.7 | 0 | 3 (1 to 900) | 3 (1 to 404) | 0 | |
| 25 (41%) | 28 (44%) | 0 | 28 (46%) | 34 (54%) | 0 | 32.0 (15.6), 14 to 67 | 33.5 (14.3), 14 to 72 | 2 | 17 | 20 | 0 | 2.6 (3.9), 0 to 17.9 | 3.8 (5.4), 0 to 24.3 | 2 | 2 (1 to 181) | 2 (1 to 575) | 2 | |
| 0 (0%) | 0 (0%) | 0 | 48 (56%) | 25 (50%) | 0 | 21.1 (14.4), 3 to 64 | 20.6 (14.0), 4 to 63 | 0 | 16 | 10 | 0 | 0.1 (0.3), 0 to 1.9 | 0.2 (0.5), 0 to 3.0 | 15 | NA | NA | 136 | |
| 32 (46%) | 31 (44%) | 0 | 34 (49%) | 39 (56%) | 0 | 35.1 (16.5), 14 to 69 | 35.3 (15.9), 16 to 70 | 0 | 16 | 19 | 0 | 2.2 (2.9), 0.1 to 11.0 | 2.1 (4.2), 0.1 to 30.0 | 0 | 2 (0 to 60) | 2 (1 to 60) | 0 | |
| SV= sodium valproate; PHT= Phenytoin; n = number of participants; NA = not available; SD = standard deviation. Proportions (%) are calculated based on non‐missing data. | ||||||||||||||||||
| EEG normal: n (%) | CT scan normal: n (%) | Neurological exam normal: n (%) | |||||||
| SV | PHT | Missing | SV | PHT | Missing | SV | PHT | Missing | |
| 20 (30%) | 8 (16%) | 64 | NA | NA | 166 | NA | NA | 166 | |
| NA | NA | 103 | NA | NA | 103 | 43 (88%) | 48 (89%) | 0 | |
| NA | NA | 124 | NA | NA | 124 | 56 (95%) | 54 (86%) | 2 | |
| NA | NA | 136 | NA | NA | 136 | NA | NA | 136 | |
| 30 (46%) | 38 (54%) | 0 | 6 (50%) | 11 (73%) | 43 | NA | NA | 70 | |
| EEG = electroencephalographic; SV= sodium valproate; PHT= Phenytoin; n = number of participants; NA = not available. Proportions (%) are calculated based on non‐missing data. | |||||||||
| Trial | Outcomes reported | Summary of results |
|
|
| |
|
| ||
|
|
No significant differences between treatment groups for any other cognitive tests
| |
|
|
| |
|
|
| |
|
|
| |
| n = number of participants; PHT: phenytoin; SV: sodium valproate. | ||
| Trial | Number randomised | Time to treatment failure (for any reason related to treatment) | Time to achieve 12‐month remission | Time to achieve 6‐month remission | Time to first seizure | ||||||||||
| PHT | SV | Total | PHT | SV | Total | PHT | SV | Total | PHT | SV | Total | PHT | SV | Total | |
| 81 | 85 | 166 | 0 | 0 | 0 | 71 | 76 | 147 | 71 | 76 | 147 | 71 | 76 | 147 | |
| 54 | 49 | 103 | 53 | 47 | 100 | 54 | 49 | 103 | 54 | 49 | 103 | 54 | 49 | 103 | |
| 20 | 21 | 41 | 20 | 21 | 41 | 0 | 0 | 0 | 0 | 0 | 0 | 0 | 0 | 0 | |
| 63 | 61 | 124 | 61 | 58 | 119 | 63 | 61 | 124 | 63 | 61 | 124 | 63 | 61 | 124 | |
| 50 | 86 | 136 | 50 | 86 | 136 | 0 | 0 | 0 | 48 | 77 | 125 | 48 | 77 | 125 | |
| 70 | 70 | 140 | 70 | 70 | 140 | 70 | 70 | 140 | 70 | 70 | 140 | 70 | 70 | 140 | |
| 15 | 18 | 33 | 15 | 18 | 33 | 0 | 0 | 0 | 0 | 0 | 0 | 0 | 0 | 0 | |
| Total | 353 | 390 | 743 | 269 | 300 | 569 | 258 | 256 | 514 | 306 | 333 | 639 | 306 | 333 | 639 |
| aTreatment failure information not provided for Craig 1994, so cannot contribute to 'time to treatment failure'. PHT: phenytoin; SV: sodium valproate. | |||||||||||||||
| Reason for early termination (and classification in time‐to‐event analysis) | Heller 1995b, c | Totala | |||||||||||||
| SV | PHT | SV | PHT | SV | PHT | SV | PHT | SV | PHT | SV | PHT | SV | PHT | All | |
| Adverse events (event) | 2 | 2 | 4 | 1 | 4 | 8 | 6 | 14 | 0 | 1 | 0 | 0 | 16 | 26 | 42 |
| Lack of efficacy (event) | 11 | 10 | 9 | 8 | 1 | 1 | 2 | 0 | 2 | 1 | 3 | 6 | 28 | 26 | 54 |
| Both adverse events and lack of efficacy (event) | 4 | 5 | 6 | 2 | 0 | 0 | 1 | 2 | 0 | 0 | 0 | 0 | 11 | 9 | 20 |
| Non‐compliance/protocol violation (event) | 0 | 0 | 0 | 0 | 7 | 2 | 2 | 2 | 5 | 4 | 0 | 0 | 14 | 8 | 22 |
| Illness or death (not treatment‐related, censored)e | 0 | 0 | 0 | 0 | 1 | 1 | 3 | 3 | 0 | 0 | 0 | 0 | 4 | 4 | 8 |
| Participant went into remission (censored) | 16 | 24 | 13 | 14 | 0 | 0 | 0 | 0 | 0 | 0 | 0 | 0 | 29 | 38 | 67 |
| Lost to follow‐up (censored) | 0 | 0 | 0 | 0 | 10 | 3 | 7 | 7 | 0 | 0 | 0 | 0 | 17 | 10 | 27 |
| Other (censored)f | 0 | 0 | 0 | 0 | 3 | 0 | 0 | 0 | 0 | 0 | 0 | 0 | 3 | 0 | 3 |
| Completed the study (censored) | 14 | 12 | 26 | 38 | 60 | 35 | 49 | 42 | 14 | 14 | 15 | 9 | 178 | 150 | 328 |
| Total | 47 | 53 | 58 | 63 | 86 | 50 | 70 | 70 | 21 | 20 | 18 | 15 | 300 | 271 | 571 |
| PHT: phenytoin; SV: sodium valproate | |||||||||||||||
| Outcome | Original analysis | Generalised onset and age at onset > 30 years classified as focal onset | Generalised onset and age at onset > 30 years classified as uncertain seizure type | |||
| Pooled HR (95% CI) fixed‐effects | Test of subgroup differences | Pooled HR (95% CI) fixed‐effects | Test of subgroup differences | Pooled HR (95% CI) fixed‐effects | Test of subgroup differences | |
| Time to treatment failure (for any reason related to treatment)a | F: 0.83 (0.50 to 1.38) G: 0.94 (0.55 to 1.61) O: 0.88 (0.61 to 1.27) | Chi² = 0.10, df = 1 (P = 0.75), I² = 0% | F: 0.95 (0.59 to 1.52) G: 0.77 (0.42 to 1.41) O: 0.88 (0.60 to 1.27) | Chi² = 0.29, df = 1 (P = 0.59), I² = 0% | F: 0.83 (0.50 to 1.38) G: 0.77 (0.42 to 1.41) U: 6.83 (0.82 to 57.16) O: 0.86 (0.59 to 1.27) | Chi² = 3.80, df = 2 (P = 0.15), I² = 47.3% |
| Time to treatment failure due to adverse eventsb | F: 0.75 (0.35 to 1.60) G: 0.81 (0.34 to 1.90) O: 0.77 (0.44 to 1.37) | Chi² = 0.02, df = 1 (P = 0.90), I² = 0% | F: 0.87 (0.42 to 1.80) G: 0.64 (0.26 to 1.59) O: 0.77 (0.44 to 1.36) | Chi² = 0.26, df = 1 (P = 0.61), I² = 0% | Not calculatedb | Not calculatedb |
| Time to treatment failure due to lack of efficacyb | F: 1.01 (0.55 to 1.85) G: 1.51 (0.66 to 3.45) O: 1.16 (0.71 to 1.89) | Chi² = 0.60, df = 1 (P = 0.44), I² = 0% | F: 1.00 (0.51 to 1.96) G: 1.73 (0.56 to 5.35) O: 1.16 (0.65 to 2.06) | Chi² = 0.66, df = 1 (P = 0.42), I² = 0% | Not calculatedb | Not calculatedb |
| Time to first seizurec | F: 1.20 (0.90 to 1.60) G: 0.97 (0.72 to 1.30) O: 1.08 (0.88 to 1.33) | Chi² = 1.06, df = 1 (P = 0.30), I² = 5.6% | F: 1.23 (0.96 to 1.57) G: 0.72 (0.50 to 1.05) O: 1.05 (0.86 to 1.29) | Chi² = 5.46, df = 1 (P = 0.02), I² = 81.7% | F: 1.20 (0.90 to 1.60) G: 0.72 (0.50 to 1.05) U: 1.35 (0.85 to 2.14) O: 1.06 (0.86 to 1.30) | Chi² = 5.79, df = 2 (P = 0.06), I² = 65.5% |
| Time to 12‐month remissiond | F: 1.11 (0.78 to 1.60) G: 0.96 (0.71 to 1.29) O: 1.02 (0.81 to 1.28) | Chi² = 0.39, df = 1 (P = 0.53), I² = 0% | F: 0.99 (0.75 to 1.32) G: 1.07 (0.72 to 1.59) O: 1.02 (0.81 to 1.28) | Chi² = 0.10, df = 1 (P = 0.75), I² = 0% | F: 1.11 (0.78 to 1.60) G: 1.07 (0.72 to 1.59) U: 0.74 (0.46 to 1.18) O: 0.99 (0.79 to 1.25) | Chi² = 2.07, df = 2 (P = 0.36), I² = 3.3% |
| Time to 6‐month remissione | F: 1.00 (0.73 to 1.35) G: 1.08 (0.84 to 1.38) O: 1.05 (0.86 to 1.27) | Chi² = 0.16, df = 1 (P = 0.69), I² = 0% | F: 1.00 (0.79 to 1.26) G: 1.14 (0.80 to 1.61) O: 1.04 (0.85 to 1.26) | Chi² = 0.38, df = 1 (P = 0.54), I² = 0% | F: 1.00 (0.73 to 1.35) G: 1.14 (0.80 to 1.61) U: 0.90 (0.62 to 1.31) O: 1.01 (0.83 to 1.23) | Chi² = 0.80, df = 2 (P = 0.67), I² = 0% |
| Chi²: Chi² statistic; df: degrees of freedom of Chi² distribution; F: focal epilepsy; G: generalised epilepsy; O: overall (all participants); U: uncertain epilepsy; P: P value (< 0.05 are classified as statistically significant). a100 participants reclassified to focal epilepsy or uncertain epilepsy type for outcome 'time to treatment failure (for any reason related to treatment)'; see Analysis 1.4 for original analysis. | ||||||
| Trial | Adverse event dataa | Summary of reported results | |
| Phenytoin (PHT) | SV (sodium valproate) | ||
| All adverse events developed (by drug) and adverse events leading to discontinuation of treatment | PHT (n = 58): gum hypertrophy (n = 2), rash (n = 2), ataxia (n = 2)
| SV (n = 64): weight gain (n = 4: all discontinued treatment), drowsiness (n = 2), aggressive behaviour (n = 1: discontinued treatment) | |
| Adverse event frequency (spontaneous reports)b Discontinuations due to adverse eventsc | PHT (n = 25): unsteadiness (n = 9), sleepiness (n = 7), drowsiness (n = 2), impaired concentration (n = 2), confusion (n = 1), constipation (n = 1), diarrhoea (n = 1), dysarthria (n = 1), lethargy (n = 1), nystagmus (n = 1), rash (n = 1), tired legs (n = 1) PHT discontinuations (n = 6): rash (n =1), diarrhoea (n = 1), confusion (n = 1), unsteadiness (n = 1), constipation (n = 1), sleepiness (n = 1) | SV (n = 17): unsteadiness (n = 2), sleepiness (n = 3), tremor (n = 5), oedema (n = 3), alopecia (n = 2), depression (n = 2), weight gain (n = 2) SV discontinuations (n = 2): weight gain and depression (n = 1), unsteadiness (n =1) | |
| "Exclusions" due to adverse events or no efficacyd | Proportion "excluded": PHT: 33.3% | Proportion "excluded": SV: 23.3% | |
| "Unacceptable" adverse events leading to drug withdrawale | PHT (n = 54): drowsiness (n = 2), skin rash (n = 1) blood dyscrasia (n = 1), hirsutism (n = 1) | SV (n = 49): behavioural (n = 1), tremor (n = 1) | |
| No adverse event data reported (treatment withdrawal data only reported) | 1 participant (PHT) withdrew from the study due to depression and anorexia | No adverse event data (or treatment withdrawals due to adverse events) reported | |
| “Unacceptable” adverse events leading to drug withdrawale | PHT (n = 63): myalgia (n = 1), irritability (n = 1)
| SV (n = 61): dizziness (n = 2) abnormal liver function test (n = 1) | |
| Most common adverse events (by treatment group)f | PHT (n = 50): dyspepsia (n = 1), nausea (n = 2), dizziness (n = 2), somnolence (n = 5), tremor (n = 2), rash (n = 4)
| SV (n = 86): dyspepsia (n = 7), nausea (n = 10), dizziness (n = 5), somnolence (n = 8), tremor (n = 5), rash (n = 3) | |
| Commonest adverse events (reported as percentages by treatment group)f | PHT (n = 45): gum hyperplasia (17.7%), nystagmus (13.33%), ataxia (2.2%), gastrointestinal disturbances (4.44%), drowsiness (4.44%) | SV (n = 49): gastrointestinal disturbances (12%), drowsiness (6.12%), weight gain (2.04%) | |
| Adverse events (narrative description)b | PHT (n = 15): 1 case of ataxia, 5 cases of acne | SV (n = 18): 2 cases of gastrointestinal symptoms, 2 cases of hair loss, 4 cases of weight gain | |
| Assessment of adverse eventsb | PHT (n = 52): 33 participants reported at least one side effect Reported frequencies: gingival hypertrophy (n = 30), ataxia (n = 13), sedation (n = 12), nausea and vomiting (n = 1) Other reported adverse events (no frequencies): nystagmus, confusion | SV (n = 48): 15 participants reported at least one side effect Reported frequencies: hyperactivity (n = 6), impaired school performance (n = 4), severe skin allergy (n = 1) | |
| Treatment withdrawals due to dose‐related and idiosyncratic adverse events | PHT (n = 70): 11 treatment withdrawals due to dose‐related adverse events (nystagmus, ataxia, tremor, diplopia and mental change) 5 treatment withdrawals due to idiosyncratic adverse events (skin eruption, erythroderma and jaundice) | SV (n = 70): 9 treatment withdrawals due to dose‐related adverse events (tremor, irritability, restlessness and alopecia) No treatment withdrawals due to idiosyncratic adverse events | |
| aAdverse event data, as reported narratively in the publications. Adverse event data were not requested in original IPD requests but will be for all future IPD requests. For numbers of treatment withdrawals due to adverse events in studies for which IPD were provided (De Silva 1996; Heller 1995; Ramsay 1992; Turnbull 1985) see Table 5. | |||
| Outcome or subgroup title | No. of studies | No. of participants | Statistical method | Effect size |
| 1 Time to treatment failure (any reason related to the treatment) Show forest plot | 6 | 569 | Hazard Ratio (Fixed, 95% CI) | 0.94 [0.67, 1.32] |
| 2 Time to treatment failure due to adverse events Show forest plot | 4 | 495 | Hazard Ratio (Fixed, 95% CI) | 0.68 [0.40, 1.17] |
| 3 Time to treatment failure due to lack of efficacy Show forest plot | 6 | 569 | Hazard Ratio (Fixed, 95% CI) | 1.23 [0.77, 1.97] |
| 4 Time to treatment failure (any reason related to the treatment) ‐ by epilepsy type Show forest plot | 5 | 528 | Hazard Ratio (Fixed, 95% CI) | 0.88 [0.61, 1.27] |
| 4.1 Focal onset seizures | 4 | 187 | Hazard Ratio (Fixed, 95% CI) | 0.83 [0.50, 1.38] |
| 4.2 Generalised onset seizures (tonic‐clonic only) | 5 | 341 | Hazard Ratio (Fixed, 95% CI) | 0.94 [0.55, 1.61] |
| 5 Time to treatment failure due to adverse events ‐ by epilepsy type Show forest plot | 4 | 418 | Hazard Ratio (Fixed, 95% CI) | 0.77 [0.44, 1.37] |
| 5.1 Focal onset seizures | 3 | 168 | Hazard Ratio (Fixed, 95% CI) | 0.75 [0.35, 1.60] |
| 5.2 Generalised onset seizures (tonic‐clonic only) | 3 | 250 | Hazard Ratio (Fixed, 95% CI) | 0.81 [0.34, 1.90] |
| 6 Time to treatment failure due to lack of efficacy ‐ by epilepsy type Show forest plot | 5 | 451 | Hazard Ratio (Fixed, 95% CI) | 1.16 [0.71, 1.89] |
| 6.1 Focal onset seizures | 4 | 187 | Hazard Ratio (Fixed, 95% CI) | 1.01 [0.55, 1.85] |
| 6.2 Generalised onset seizures (tonic‐clonic only) | 4 | 264 | Hazard Ratio (Fixed, 95% CI) | 1.51 [0.66, 3.45] |
| 7 Time to first seizure Show forest plot | 5 | 639 | Hazard Ratio (Fixed, 95% CI) | 1.04 [0.85, 1.28] |
| 8 Time to first seizure ‐ by epilepsy type Show forest plot | 5 | 639 | Hazard Ratio (Fixed, 95% CI) | 1.08 [0.88, 1.33] |
| 8.1 Focal onset seizures | 4 | 244 | Hazard Ratio (Fixed, 95% CI) | 1.20 [0.90, 1.60] |
| 8.2 Generalised onset seizures (tonic‐clonic only) | 5 | 395 | Hazard Ratio (Fixed, 95% CI) | 0.97 [0.72, 1.30] |
| 9 Time to first seizure ‐ epilepsy type reclassified to focal for generalised and age of onset > 30 years Show forest plot | 5 | 639 | Hazard Ratio (Fixed, 95% CI) | 1.05 [0.86, 1.29] |
| 9.1 Focal onset seizures | 5 | 416 | Hazard Ratio (Fixed, 95% CI) | 1.23 [0.96, 1.57] |
| 9.2 Generalised onset seizures (tonic‐clonic only) | 4 | 223 | Hazard Ratio (Fixed, 95% CI) | 0.72 [0.50, 1.05] |
| 10 Time to first seizure ‐ epilepsy type reclassified to uncertain for generalised and age of onset > 30 years Show forest plot | 5 | 649 | Hazard Ratio (Fixed, 95% CI) | 1.06 [0.86, 1.30] |
| 10.1 Focal onset seizures | 4 | 255 | Hazard Ratio (Fixed, 95% CI) | 1.20 [0.90, 1.60] |
| 10.2 Generalised onset seizures (tonic‐clonic only) | 4 | 223 | Hazard Ratio (Fixed, 95% CI) | 0.72 [0.50, 1.05] |
| 10.3 Uncertain seizure type | 4 | 171 | Hazard Ratio (Fixed, 95% CI) | 1.35 [0.85, 2.14] |
| 11 Time to achieve 12‐month remission Show forest plot | 4 | 514 | Hazard Ratio (Fixed, 95% CI) | 1.03 [0.82, 1.29] |
| 12 Time to achieve 12‐month remission ‐ by epilepsy type Show forest plot | 4 | 514 | Hazard Ratio (Fixed, 95% CI) | 1.02 [0.81, 1.28] |
| 12.1 Focal onset seizures | 4 | 244 | Hazard Ratio (Fixed, 95% CI) | 1.11 [0.78, 1.60] |
| 12.2 Generalised onset seizures (tonic‐clonic only) | 4 | 270 | Hazard Ratio (Fixed, 95% CI) | 0.96 [0.71, 1.29] |
| 13 Time to achieve six‐month remission Show forest plot | 5 | 639 | Hazard Ratio (Fixed, 95% CI) | 1.08 [0.89, 1.30] |
| 14 Time to achieve six‐month remission ‐ by epilepsy type Show forest plot | 5 | 639 | Hazard Ratio (Fixed, 95% CI) | 1.05 [0.86, 1.27] |
| 14.1 Focal onset seizures | 4 | 244 | Hazard Ratio (Fixed, 95% CI) | 1.00 [0.73, 1.35] |
| 14.2 Generalised onset seizures (tonic‐clonic only) | 5 | 395 | Hazard Ratio (Fixed, 95% CI) | 1.08 [0.84, 1.38] |