Sodium valproate versus phenytoin monotherapy for epilepsy: an individual participant data review
Information
- DOI:
- https://doi.org/10.1002/14651858.CD001769.pub4Copy DOI

- Database:
-
- Cochrane Database of Systematic Reviews
- Version published:
-
- 09 August 2018see what's new
- Type:
-
- Intervention
- Stage:
-
- Review
- Cochrane Editorial Group:
-
Cochrane Epilepsy Group
- Copyright:
-
- Copyright © 2018 The Cochrane Collaboration. Published by John Wiley & Sons, Ltd.
Article metrics
Altmetric:
Cited by:
Authors
Contributions of authors
SJ Nevitt assessed studies for inclusion in the review update, obtained individual participant data (IPD) from trial investigators for the review update, assessed risk of bias in all included studies, performed analyses in Stata version 14, added survival plots and a 'Summary of findings' table, and updated the text of the review.
AG Marson obtained IPD from trial investigators, provided guidance with the clinical interpretation of results, assessed eligibility and methodological quality of individual studies and co‐wrote the original review.
J Weston independently assessed risk of bias in all included studies.
C Tudur Smith was the lead investigator on the original review, assessed eligibility and methodological quality of original individual studies, organised and cleaned the IPD sets, performed data validation checks and statistical analyses and co‐wrote the original review.
Sources of support
Internal sources
-
University of Liverpool, UK.
-
Walton Centre for Neurology and Neurosurgery, UK.
External sources
-
Medical Research Council, UK.
-
National Institute for Health Research (NIHR), UK.
This review was supported by the National Institute for Health Research, via Cochrane Infrastructure funding to the Epilepsy Group. The views and opinions expressed therein are those of the authors and do not necessarily reflect those of the Systematic Reviews Programme, NIHR, National Health Service (NHS) or the Department of Health.
Declarations of interest
SJ Nevitt has no declarations of interest.
AG Marson: A consortium of pharmaceutical companies (GSK, EISAI, UCB Pharma) funded the National Audit of Seizure Management in Hospitals (NASH) through grants paid to University of Liverpool. Professor Tony Marson is part funded by National Institute for Health Research Collaboration for Leadership in Applied Health Research and Care North West Coast (NIHR CLAHRC NWC).
J Weston has no declarations of interest.
C Tudur Smith has no declarations of interest.
Acknowledgements
This review update was supported by the National Institute for Health Research (NIHR), via Cochrane Infrastructure funding to the Epilepsy Group. The views and opinions expressed therein are those of the authors and do not necessarily reflect those of the Systematic Reviews Programme, NIHR, National Health Service (NHS) of the Department of Health.
We are greatly indebted to all of the trialists who have provided individual participant data (IPD) and input and review, Kenneth Sommerville and Roger Deaton at Abbott Laboratories. They have shown great patience in the way our data queries were handled.
We acknowledge Paula Williamson for contributions to the original review.
Version history
| Published | Title | Stage | Authors | Version |
| 2018 Aug 09 | Sodium valproate versus phenytoin monotherapy for epilepsy: an individual participant data review | Review | Sarah J Nevitt, Anthony G Marson, Jennifer Weston, Catrin Tudur Smith | |
| 2016 Apr 28 | Phenytoin versus valproate monotherapy for partial onset seizures and generalised onset tonic‐clonic seizures: an individual participant data review | Review | Sarah J Nevitt, Anthony G Marson, Jennifer Weston, Catrin Tudur Smith | |
| 2013 Aug 23 | Phenytoin versus valproate monotherapy for partial onset seizures and generalised onset tonic‐clonic seizures | Review | Sarah J Nolan, Anthony G Marson, Jennifer Pulman, Catrin Tudur Smith | |
| 2001 Oct 23 | Phenytoin versus valproate monotherapy for partial onset seizures and generalized onset tonic‐clonic seizures | Review | Catrin Tudur Smith, Anthony G Marson, Paula R Williamson | |
Differences between protocol and review
For the 2018 update: we changed the title in line with the titles of other pair‐wise monotherapy comparisons in the series (i.e. 'monotherapy for epilepsy' instead of 'for focal onset seizures and generalised onset tonic‐clonic seizures) and in line with Cochrane Style guidelines of intervention (i.e. sodium valproate) first and comparator (i.e. phenytoin) second.
We redefined 'time to withdrawal of allocated treatment' as 'time to treatment failure' due to feedback received from the Cochrane Editorial Unit regarding potential confusion regarding 'withdrawal' as a positive or negative outcome of antiepileptic monotherapy.
We conducted additional analyses of 'time to treatment failure' (due to lack of efficacy and due to adverse events) following feedback on published antiepileptic drug monotherapy reviews that these suboutcomes would be useful for clinical practice.
We replaced the term 'partial' by 'focal', in accordance with the most recent classification of epilepsies of the International League Against Epilepsy (Scheffer 2017).
We presented adverse event information as a separate secondary outcome, 'incidence of adverse events' in line with other Cochrane IPD reviews investigating pair‐wise monotherapy comparisons.
In December 2014, we changed the title to specify that the review uses individual participant data (IPD).
For the 2013 update, in a post hoc change, we added 'Summary of findings' tables to the review.
We added sensitivity analyses following identification of potential misclassification of seizure type. The existence of misclassification in the individual studies could not have been known at the time of writing the original protocol.
We added the outcome 'time to six‐month remission' for consistency with the other reviews in the series of Cochrane IPD reviews investigating pair‐wise monotherapy comparisons and removed the outcome 'quality of Life' which was found to not be readily available in an analysable format from early IPD requests.
Notes
The protocol for this review was published with Catrin Tudur as the contact review author. Catrin is now known as Catrin Tudur Smith.
Sarah J Nolan (lead author of the 2013 and 2016 update) is now Sarah J Nevitt.
Jennifer Pulman (author of the 2013 update) is now Jennifer Weston.
Keywords
MeSH
Medical Subject Headings (MeSH) Keywords
Medical Subject Headings Check Words
Humans;
PICOs


'Risk of bias' graph: review authors' judgements about each risk of bias item presented as percentages across all included studies.

'Risk of bias' summary: review authors' judgements about each risk of bias item for each included study.
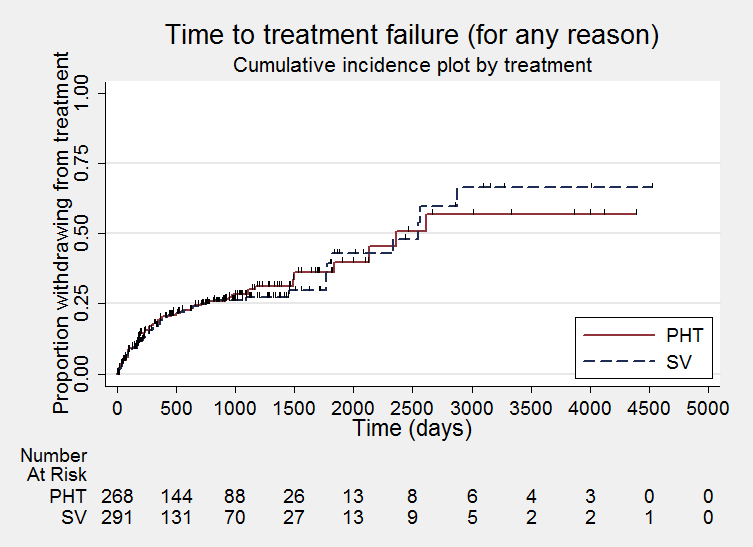
Time to treatment failure ‐ any reason related to the treatment (PHT: phenytoin; SV: sodium valproate)

Time to treatment failure ‐ any reason related to the treatment, by epilepsy type (PHT: phenytoin; SV: sodium valproate)
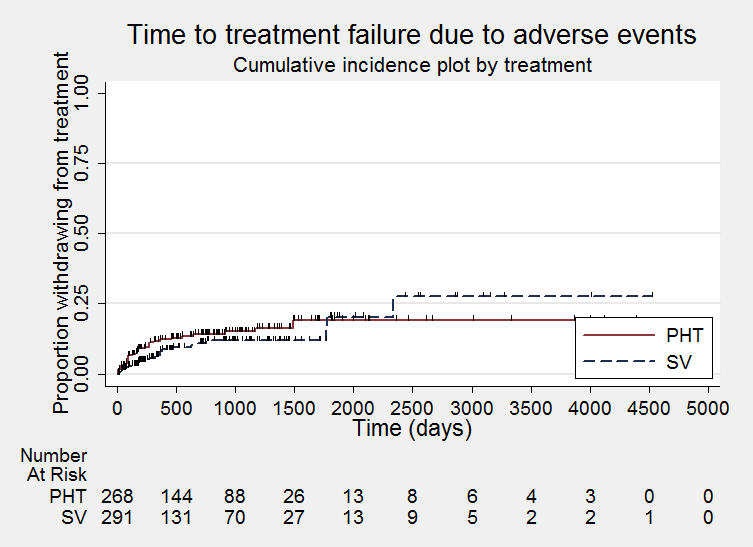
Time to treatment failure due to adverse events (PHT: phenytoin; SV: sodium valproate)

Time to treatment failure due to adverse events, by epilepsy type (PHT: phenytoin; SV: sodium valproate)

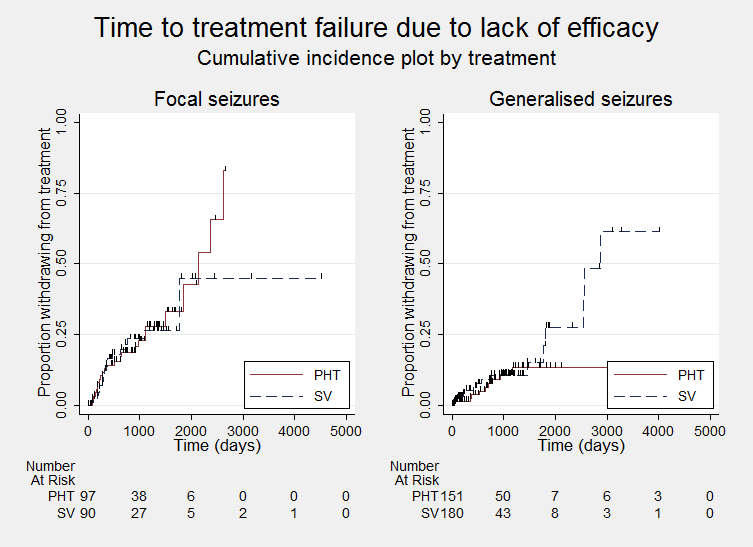
Time to treatment failure due to lack of efficacy (PHT: phenytoin; SV: sodium valproate)
Time to treatment failure due to lack of efficacy, by epilepsy type (PHT: phenytoin; SV: sodium valproate)

Time to first seizure (PHT: phenytoin; SV: sodium valproate)

Time to first seizure ‐ by epilepsy type. (PHT: phenytoin; SV: sodium valproate)
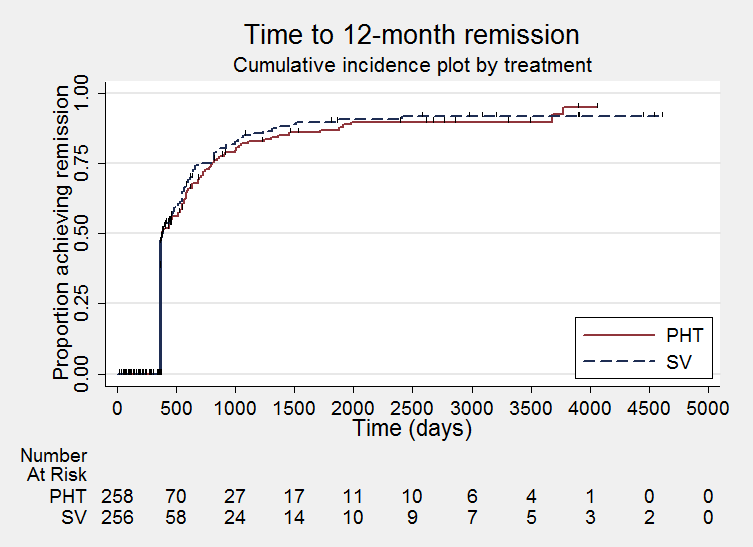
Time to achieve 12‐month remission (PHT: phenytoin; SV: sodium valproate)
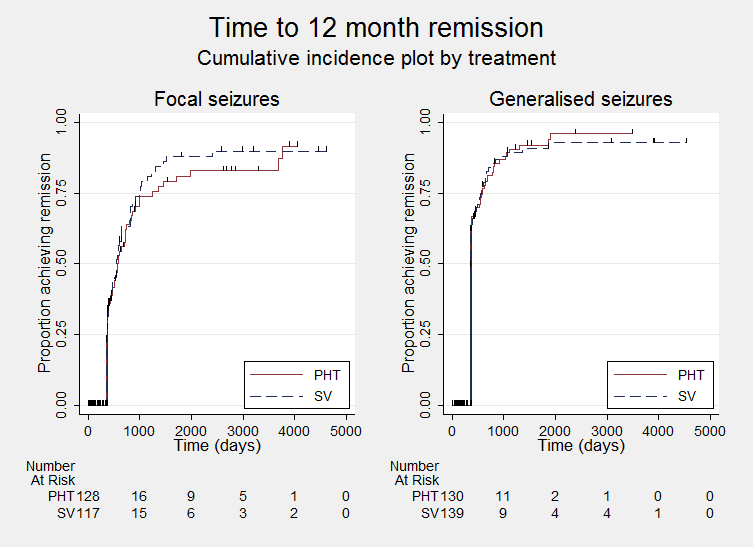
Time to achieve 12‐month remission ‐ by epilepsy type. (PHT: phenytoin; SV: sodium valproate)
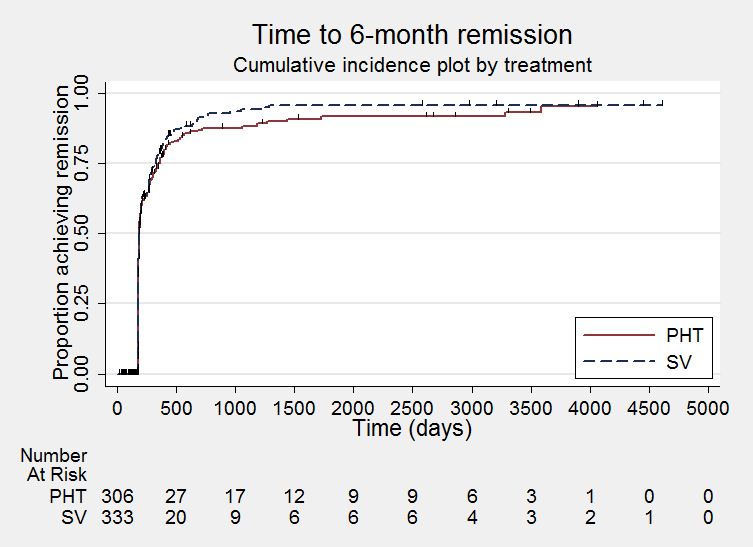
Time to achieve six‐month remission (PHT: phenytoin; SV: sodium valproate)

Time to achieve six‐month remission (PHT: phenytoin; SV: sodium valproate)

Comparison 1 Sodium valproate versus phenytoin, Outcome 1 Time to treatment failure (any reason related to the treatment).

Comparison 1 Sodium valproate versus phenytoin, Outcome 2 Time to treatment failure due to adverse events.

Comparison 1 Sodium valproate versus phenytoin, Outcome 3 Time to treatment failure due to lack of efficacy.

Comparison 1 Sodium valproate versus phenytoin, Outcome 4 Time to treatment failure (any reason related to the treatment) ‐ by epilepsy type.

Comparison 1 Sodium valproate versus phenytoin, Outcome 5 Time to treatment failure due to adverse events ‐ by epilepsy type.

Comparison 1 Sodium valproate versus phenytoin, Outcome 6 Time to treatment failure due to lack of efficacy ‐ by epilepsy type.

Comparison 1 Sodium valproate versus phenytoin, Outcome 7 Time to first seizure.

Comparison 1 Sodium valproate versus phenytoin, Outcome 8 Time to first seizure ‐ by epilepsy type.

Comparison 1 Sodium valproate versus phenytoin, Outcome 9 Time to first seizure ‐ epilepsy type reclassified to focal for generalised and age of onset > 30 years.

Comparison 1 Sodium valproate versus phenytoin, Outcome 10 Time to first seizure ‐ epilepsy type reclassified to uncertain for generalised and age of onset > 30 years.

Comparison 1 Sodium valproate versus phenytoin, Outcome 11 Time to achieve 12‐month remission.

Comparison 1 Sodium valproate versus phenytoin, Outcome 12 Time to achieve 12‐month remission ‐ by epilepsy type.

Comparison 1 Sodium valproate versus phenytoin, Outcome 13 Time to achieve six‐month remission.

Comparison 1 Sodium valproate versus phenytoin, Outcome 14 Time to achieve six‐month remission ‐ by epilepsy type.
| Sodium valproate compared with phenytoin monotherapy for epilepsy | ||||||
| Patient or population: adults and children with newly‐onset focal onset or generalised tonic‐clonic seizures Settings: outpatients Intervention: sodium valproate Comparison: phenytoin | ||||||
| Outcomes | Illustrative comparative risks* (95% CI) | Relative effect | No. of Participants | Quality of the evidence | Comments | |
| Assumed risk | Corresponding risk | |||||
| Phenytoin | Sodium valproate | |||||
| Time to treatment failure (any reason related to treatment) All participants Range of follow‐up: 0 to 4256 days | The median time to treatment failure was 2361 days in the phenytoin group | The median time to treatment failure was 2545 days (184 days longer) in the sodium valproate group | HR 0.88 (0.61 to 1.27)a | 528 | ⊕⊕⊕⊝ | HR < 1 indicates a clinical advantage for valproate There was also no statistically significant difference between drugs in treatment failure due to adverse events: HR 0.77 (95% CI 0.44 to 1.37, P = 0.38) or treatment failure due to lack of efficacy: HR 1.16 (95% CI 0.71 to 1.89, P = 0.55) |
| Time to treatment failure (any reason related to treatment) Subgroup: focal onset seizures Range of follow‐up: 0 to 4256 days | The median time to treatment failure was 1838 days in the phenytoin group | The median time to treatment failure was 1772 days (66 days shorter) in the sodium valproate group | HR 0.83 (0.50 to 1.38) | 187 (4 studies) | ⊕⊕⊕⊝ | HR < 1 indicates a clinical advantage for valproate There was also no statistically significant difference between drugs in treatment failure due to adverse events: HR 0.81 (95% CI 0.34 to 1.90, P = 0.62) or treatment failure due to lack of efficacy: HR 1.01 (95% CI 0.55 to 1.85, P = 0.98) |
| Time to treatment failure (any reason related to treatment) Subgroup: generalised onset seizures (tonic‐clonic only) Range of follow‐up: 0 to 4394 days | The 25th percentile** of time to treatment failure was 1488 days in the phenytoin group | The 25th percentile** of time to treatment failure was 1778 days (290 days longer) in the sodium valproate group | HR 0.94 (0.55 to 1.61) | 341 | ⊕⊕⊕⊝ | HR < 1 indicates a clinical advantage for valproate There was also no statistically significant difference between drugs in treatment failure due to adverse events: HR 0.75 (95% CI 0.35 to 1.60, P = 0.46) or treatment failure due to lack of efficacy: HR 1.51 (95% CI 0.66 to 3.45, P = 0.33) |
| * Illustrative risks in the sodium valproate and phenytoin groups are calculated at the median time to treatment failure (i.e. the time to 50% of participants failing or withdrawing from allocated treatment) within each group across all trials. The relative effect (pooled HR) shows the comparison of 'time to treatment failure' between the treatment groups. ** The 25th percentile of time to treatment failure (i.e. the time to 25% of participants failing or withdrawing from allocated treatment) is presented for the subgroup with generalised seizures as less than 50% of participants failed/withdrew from treatment, therefore the median time could not be calculated. Abbreviations: CI: confidence interval; HR: hazard ratio. | ||||||
| GRADE Working Group grades of evidence | ||||||
| aPooled HR for all participants adjusted for seizure type. | ||||||
| Valproate compared with phenytoin monotherapy for epilepsy | ||||||
| Patient or population: adults and children with newly‐onset focal onset or generalised tonic‐clonic seizures Settings: outpatients Intervention: sodium valproate Comparison: phenytoin | ||||||
| Outcomes | Illustrative comparative risks* (95% CI) | Relative effect | No. of Participants | Quality of the evidence | Comments | |
| Assumed risk | Corresponding risk | |||||
| Phenytoin | Sodium valproate | |||||
| Time to first seizure (post‐randomisation) All participants Range of follow‐up: 0 to 4859 days | The median time to first seizure post‐randomisation was 275 days in the phenytoin group | The median time to first seizure post‐randomisation was 267 days (7 days shorter) in the sodium valproate group | HR 1.08 (0.88 to 1.33)a | 639 (5 studies) | ⊕⊕⊝⊝ | HR < 1 indicates a clinical |
| Time to first seizure (post‐randomisation) Subgroup: focal onset seizures Range of follow‐up: 0 to 4859 days | The median time to first seizure post‐randomisation was 75 days in the phenytoin group | The median time to first seizure post‐randomisation was 41 days (34 days shorter) in the sodium valproate group | HR 1.20 (0.90 to 1.60) | 244 (4 studies) | ⊕⊕⊝⊝ | HR < 1 indicates a clinical |
| Time to first seizure (post‐randomisation) Subgroup: generalised onset seizures (tonic‐clonic only) Range of follow‐up: 1 to 4520 days | The median time to first seizure post‐randomisation was 572 days in the phenytoin group | The median time to first seizure post‐randomisation was 549 days (23 days shorter) in the sodium valproate group | HR 0.97 (0.72 to 1.30) | 395 (5 studies) | ⊕⊕⊝⊝ | HR < 1 indicates a clinical |
| Time to achieve 12‐month remission (seizure‐free period) All participants Range of follow‐up: 5 to 4614 days | The median time to achieve 12‐month remission was 380 days in the phenytoin group | The median time to achieve 12‐month remission was 386 days (6 days longer) in the sodium valproate group | HR 1.02 (0.81 to 1.28) | 514 (4 studies) | ⊕⊕⊕⊝ | HR < 1 indicates a clinical |
| Time to achieve 12‐month remission (seizure‐free period) Subgroup: focal onset seizures Range of follow‐up: 5 to 4614 days | The median time to achieve 12‐month remission was 575 days in the phenytoin group | The median time to achieve 12‐month remission was 549 days (26 days shorter) in the sodium valproate group | HR 1.11 (0.78 to 1.60) | 244 (4 studies) | ⊕⊕⊕⊝ | HR < 1 indicates a clinical |
| Time to achieve 12‐month remission (seizure‐free period) Subgroup: generalised onset seizures (tonic‐clonic only) Range of follow‐up: 7 to 4544 days | The median time to achieve 12‐month remission was 365 days in the phenytoin group | The median time to achieve 12‐month remission was 366 days (1 day longer) in the sodium valproate group | HR 0.96 (0.71 to 1.29) | 270 (4 studies) | ⊕⊕⊕⊝ | HR < 1 indicates a clinical |
| * Illustrative risks in the phenytoin and sodium valproate groups are calculated at the median time to first seizure or time to 12‐month remission (i.e. the time to 50% of participants experiencing a first seizure or 12 months of remission) within each group across all trials. The relative effect (pooled HR) shows the comparison of 'time to first seizure' or 'time to 12‐month remission' between the treatment groups. Abbreviations: CI: confidence interval; HR: hazard ratio. | ||||||
| GRADE Working Group grades of evidence | ||||||
| aPooled HR for all participants adjusted for seizure type. | ||||||
| Focal seizures: n (%) | Male gender: n (%) | Age at entry (years): Mean (SD), range | Aged > 30 years and generalised seizures: n (%) | Epilepsy duration (years): mean (SD), range | Number of seizures in prior 6 months: median (range) | |||||||||||||
| SV | PHT | Missing | SV | PHT | Missing | SV | PHT | Missing | SV | PHT | Missing | SV | PHT | Missing | SV | PHT | Missing | |
| 37 (44%) | 43 (53%) | 0 | 38 (46%) | 33 (41%) | 3 | 77.6 (7.2), 61 to 95 | 78.7 (7.0), 64 to 95 | 3 | 46 | 38 | 0 | NA | NA | 166 | 2 (0 to 60) | 3 (1 to 99) | 3 | |
| 25 (51%) | 30 (56%) | 0 | 18 (37%) | 34 (63%) | 0 | 11.3 (3.3), 2 to 15 | 9.5 (3.4), 3 to 15 | 0 | 0 | 0 | 0 | 1.2 (1.5), 0 to 4.9 | 1.0 (2.1), 0 to 13.7 | 0 | 3 (1 to 900) | 3 (1 to 404) | 0 | |
| 25 (41%) | 28 (44%) | 0 | 28 (46%) | 34 (54%) | 0 | 32.0 (15.6), 14 to 67 | 33.5 (14.3), 14 to 72 | 2 | 17 | 20 | 0 | 2.6 (3.9), 0 to 17.9 | 3.8 (5.4), 0 to 24.3 | 2 | 2 (1 to 181) | 2 (1 to 575) | 2 | |
| 0 (0%) | 0 (0%) | 0 | 48 (56%) | 25 (50%) | 0 | 21.1 (14.4), 3 to 64 | 20.6 (14.0), 4 to 63 | 0 | 16 | 10 | 0 | 0.1 (0.3), 0 to 1.9 | 0.2 (0.5), 0 to 3.0 | 15 | NA | NA | 136 | |
| 32 (46%) | 31 (44%) | 0 | 34 (49%) | 39 (56%) | 0 | 35.1 (16.5), 14 to 69 | 35.3 (15.9), 16 to 70 | 0 | 16 | 19 | 0 | 2.2 (2.9), 0.1 to 11.0 | 2.1 (4.2), 0.1 to 30.0 | 0 | 2 (0 to 60) | 2 (1 to 60) | 0 | |
| SV= sodium valproate; PHT= Phenytoin; n = number of participants; NA = not available; SD = standard deviation. Proportions (%) are calculated based on non‐missing data. | ||||||||||||||||||
| EEG normal: n (%) | CT scan normal: n (%) | Neurological exam normal: n (%) | |||||||
| SV | PHT | Missing | SV | PHT | Missing | SV | PHT | Missing | |
| 20 (30%) | 8 (16%) | 64 | NA | NA | 166 | NA | NA | 166 | |
| NA | NA | 103 | NA | NA | 103 | 43 (88%) | 48 (89%) | 0 | |
| NA | NA | 124 | NA | NA | 124 | 56 (95%) | 54 (86%) | 2 | |
| NA | NA | 136 | NA | NA | 136 | NA | NA | 136 | |
| 30 (46%) | 38 (54%) | 0 | 6 (50%) | 11 (73%) | 43 | NA | NA | 70 | |
| EEG = electroencephalographic; SV= sodium valproate; PHT= Phenytoin; n = number of participants; NA = not available. Proportions (%) are calculated based on non‐missing data. | |||||||||
| Trial | Outcomes reported | Summary of results |
|
|
| |
|
| ||
|
|
No significant differences between treatment groups for any other cognitive tests
| |
|
|
| |
|
|
| |
|
|
| |
| n = number of participants; PHT: phenytoin; SV: sodium valproate. | ||
| Trial | Number randomised | Time to treatment failure (for any reason related to treatment) | Time to achieve 12‐month remission | Time to achieve 6‐month remission | Time to first seizure | ||||||||||
| PHT | SV | Total | PHT | SV | Total | PHT | SV | Total | PHT | SV | Total | PHT | SV | Total | |
| 81 | 85 | 166 | 0 | 0 | 0 | 71 | 76 | 147 | 71 | 76 | 147 | 71 | 76 | 147 | |
| 54 | 49 | 103 | 53 | 47 | 100 | 54 | 49 | 103 | 54 | 49 | 103 | 54 | 49 | 103 | |
| 20 | 21 | 41 | 20 | 21 | 41 | 0 | 0 | 0 | 0 | 0 | 0 | 0 | 0 | 0 | |
| 63 | 61 | 124 | 61 | 58 | 119 | 63 | 61 | 124 | 63 | 61 | 124 | 63 | 61 | 124 | |
| 50 | 86 | 136 | 50 | 86 | 136 | 0 | 0 | 0 | 48 | 77 | 125 | 48 | 77 | 125 | |
| 70 | 70 | 140 | 70 | 70 | 140 | 70 | 70 | 140 | 70 | 70 | 140 | 70 | 70 | 140 | |
| 15 | 18 | 33 | 15 | 18 | 33 | 0 | 0 | 0 | 0 | 0 | 0 | 0 | 0 | 0 | |
| Total | 353 | 390 | 743 | 269 | 300 | 569 | 258 | 256 | 514 | 306 | 333 | 639 | 306 | 333 | 639 |
| aTreatment failure information not provided for Craig 1994, so cannot contribute to 'time to treatment failure'. PHT: phenytoin; SV: sodium valproate. | |||||||||||||||
| Reason for early termination (and classification in time‐to‐event analysis) | Heller 1995b, c | Totala | |||||||||||||
| SV | PHT | SV | PHT | SV | PHT | SV | PHT | SV | PHT | SV | PHT | SV | PHT | All | |
| Adverse events (event) | 2 | 2 | 4 | 1 | 4 | 8 | 6 | 14 | 0 | 1 | 0 | 0 | 16 | 26 | 42 |
| Lack of efficacy (event) | 11 | 10 | 9 | 8 | 1 | 1 | 2 | 0 | 2 | 1 | 3 | 6 | 28 | 26 | 54 |
| Both adverse events and lack of efficacy (event) | 4 | 5 | 6 | 2 | 0 | 0 | 1 | 2 | 0 | 0 | 0 | 0 | 11 | 9 | 20 |
| Non‐compliance/protocol violation (event) | 0 | 0 | 0 | 0 | 7 | 2 | 2 | 2 | 5 | 4 | 0 | 0 | 14 | 8 | 22 |
| Illness or death (not treatment‐related, censored)e | 0 | 0 | 0 | 0 | 1 | 1 | 3 | 3 | 0 | 0 | 0 | 0 | 4 | 4 | 8 |
| Participant went into remission (censored) | 16 | 24 | 13 | 14 | 0 | 0 | 0 | 0 | 0 | 0 | 0 | 0 | 29 | 38 | 67 |
| Lost to follow‐up (censored) | 0 | 0 | 0 | 0 | 10 | 3 | 7 | 7 | 0 | 0 | 0 | 0 | 17 | 10 | 27 |
| Other (censored)f | 0 | 0 | 0 | 0 | 3 | 0 | 0 | 0 | 0 | 0 | 0 | 0 | 3 | 0 | 3 |
| Completed the study (censored) | 14 | 12 | 26 | 38 | 60 | 35 | 49 | 42 | 14 | 14 | 15 | 9 | 178 | 150 | 328 |
| Total | 47 | 53 | 58 | 63 | 86 | 50 | 70 | 70 | 21 | 20 | 18 | 15 | 300 | 271 | 571 |
| PHT: phenytoin; SV: sodium valproate | |||||||||||||||
| Outcome | Original analysis | Generalised onset and age at onset > 30 years classified as focal onset | Generalised onset and age at onset > 30 years classified as uncertain seizure type | |||
| Pooled HR (95% CI) fixed‐effects | Test of subgroup differences | Pooled HR (95% CI) fixed‐effects | Test of subgroup differences | Pooled HR (95% CI) fixed‐effects | Test of subgroup differences | |
| Time to treatment failure (for any reason related to treatment)a | F: 0.83 (0.50 to 1.38) G: 0.94 (0.55 to 1.61) O: 0.88 (0.61 to 1.27) | Chi² = 0.10, df = 1 (P = 0.75), I² = 0% | F: 0.95 (0.59 to 1.52) G: 0.77 (0.42 to 1.41) O: 0.88 (0.60 to 1.27) | Chi² = 0.29, df = 1 (P = 0.59), I² = 0% | F: 0.83 (0.50 to 1.38) G: 0.77 (0.42 to 1.41) U: 6.83 (0.82 to 57.16) O: 0.86 (0.59 to 1.27) | Chi² = 3.80, df = 2 (P = 0.15), I² = 47.3% |
| Time to treatment failure due to adverse eventsb | F: 0.75 (0.35 to 1.60) G: 0.81 (0.34 to 1.90) O: 0.77 (0.44 to 1.37) | Chi² = 0.02, df = 1 (P = 0.90), I² = 0% | F: 0.87 (0.42 to 1.80) G: 0.64 (0.26 to 1.59) O: 0.77 (0.44 to 1.36) | Chi² = 0.26, df = 1 (P = 0.61), I² = 0% | Not calculatedb | Not calculatedb |
| Time to treatment failure due to lack of efficacyb | F: 1.01 (0.55 to 1.85) G: 1.51 (0.66 to 3.45) O: 1.16 (0.71 to 1.89) | Chi² = 0.60, df = 1 (P = 0.44), I² = 0% | F: 1.00 (0.51 to 1.96) G: 1.73 (0.56 to 5.35) O: 1.16 (0.65 to 2.06) | Chi² = 0.66, df = 1 (P = 0.42), I² = 0% | Not calculatedb | Not calculatedb |
| Time to first seizurec | F: 1.20 (0.90 to 1.60) G: 0.97 (0.72 to 1.30) O: 1.08 (0.88 to 1.33) | Chi² = 1.06, df = 1 (P = 0.30), I² = 5.6% | F: 1.23 (0.96 to 1.57) G: 0.72 (0.50 to 1.05) O: 1.05 (0.86 to 1.29) | Chi² = 5.46, df = 1 (P = 0.02), I² = 81.7% | F: 1.20 (0.90 to 1.60) G: 0.72 (0.50 to 1.05) U: 1.35 (0.85 to 2.14) O: 1.06 (0.86 to 1.30) | Chi² = 5.79, df = 2 (P = 0.06), I² = 65.5% |
| Time to 12‐month remissiond | F: 1.11 (0.78 to 1.60) G: 0.96 (0.71 to 1.29) O: 1.02 (0.81 to 1.28) | Chi² = 0.39, df = 1 (P = 0.53), I² = 0% | F: 0.99 (0.75 to 1.32) G: 1.07 (0.72 to 1.59) O: 1.02 (0.81 to 1.28) | Chi² = 0.10, df = 1 (P = 0.75), I² = 0% | F: 1.11 (0.78 to 1.60) G: 1.07 (0.72 to 1.59) U: 0.74 (0.46 to 1.18) O: 0.99 (0.79 to 1.25) | Chi² = 2.07, df = 2 (P = 0.36), I² = 3.3% |
| Time to 6‐month remissione | F: 1.00 (0.73 to 1.35) G: 1.08 (0.84 to 1.38) O: 1.05 (0.86 to 1.27) | Chi² = 0.16, df = 1 (P = 0.69), I² = 0% | F: 1.00 (0.79 to 1.26) G: 1.14 (0.80 to 1.61) O: 1.04 (0.85 to 1.26) | Chi² = 0.38, df = 1 (P = 0.54), I² = 0% | F: 1.00 (0.73 to 1.35) G: 1.14 (0.80 to 1.61) U: 0.90 (0.62 to 1.31) O: 1.01 (0.83 to 1.23) | Chi² = 0.80, df = 2 (P = 0.67), I² = 0% |
| Chi²: Chi² statistic; df: degrees of freedom of Chi² distribution; F: focal epilepsy; G: generalised epilepsy; O: overall (all participants); U: uncertain epilepsy; P: P value (< 0.05 are classified as statistically significant). a100 participants reclassified to focal epilepsy or uncertain epilepsy type for outcome 'time to treatment failure (for any reason related to treatment)'; see Analysis 1.4 for original analysis. | ||||||
| Trial | Adverse event dataa | Summary of reported results | |
| Phenytoin (PHT) | SV (sodium valproate) | ||
| All adverse events developed (by drug) and adverse events leading to discontinuation of treatment | PHT (n = 58): gum hypertrophy (n = 2), rash (n = 2), ataxia (n = 2)
| SV (n = 64): weight gain (n = 4: all discontinued treatment), drowsiness (n = 2), aggressive behaviour (n = 1: discontinued treatment) | |
| Adverse event frequency (spontaneous reports)b Discontinuations due to adverse eventsc | PHT (n = 25): unsteadiness (n = 9), sleepiness (n = 7), drowsiness (n = 2), impaired concentration (n = 2), confusion (n = 1), constipation (n = 1), diarrhoea (n = 1), dysarthria (n = 1), lethargy (n = 1), nystagmus (n = 1), rash (n = 1), tired legs (n = 1) PHT discontinuations (n = 6): rash (n =1), diarrhoea (n = 1), confusion (n = 1), unsteadiness (n = 1), constipation (n = 1), sleepiness (n = 1) | SV (n = 17): unsteadiness (n = 2), sleepiness (n = 3), tremor (n = 5), oedema (n = 3), alopecia (n = 2), depression (n = 2), weight gain (n = 2) SV discontinuations (n = 2): weight gain and depression (n = 1), unsteadiness (n =1) | |
| "Exclusions" due to adverse events or no efficacyd | Proportion "excluded": PHT: 33.3% | Proportion "excluded": SV: 23.3% | |
| "Unacceptable" adverse events leading to drug withdrawale | PHT (n = 54): drowsiness (n = 2), skin rash (n = 1) blood dyscrasia (n = 1), hirsutism (n = 1) | SV (n = 49): behavioural (n = 1), tremor (n = 1) | |
| No adverse event data reported (treatment withdrawal data only reported) | 1 participant (PHT) withdrew from the study due to depression and anorexia | No adverse event data (or treatment withdrawals due to adverse events) reported | |
| “Unacceptable” adverse events leading to drug withdrawale | PHT (n = 63): myalgia (n = 1), irritability (n = 1)
| SV (n = 61): dizziness (n = 2) abnormal liver function test (n = 1) | |
| Most common adverse events (by treatment group)f | PHT (n = 50): dyspepsia (n = 1), nausea (n = 2), dizziness (n = 2), somnolence (n = 5), tremor (n = 2), rash (n = 4)
| SV (n = 86): dyspepsia (n = 7), nausea (n = 10), dizziness (n = 5), somnolence (n = 8), tremor (n = 5), rash (n = 3) | |
| Commonest adverse events (reported as percentages by treatment group)f | PHT (n = 45): gum hyperplasia (17.7%), nystagmus (13.33%), ataxia (2.2%), gastrointestinal disturbances (4.44%), drowsiness (4.44%) | SV (n = 49): gastrointestinal disturbances (12%), drowsiness (6.12%), weight gain (2.04%) | |
| Adverse events (narrative description)b | PHT (n = 15): 1 case of ataxia, 5 cases of acne | SV (n = 18): 2 cases of gastrointestinal symptoms, 2 cases of hair loss, 4 cases of weight gain | |
| Assessment of adverse eventsb | PHT (n = 52): 33 participants reported at least one side effect Reported frequencies: gingival hypertrophy (n = 30), ataxia (n = 13), sedation (n = 12), nausea and vomiting (n = 1) Other reported adverse events (no frequencies): nystagmus, confusion | SV (n = 48): 15 participants reported at least one side effect Reported frequencies: hyperactivity (n = 6), impaired school performance (n = 4), severe skin allergy (n = 1) | |
| Treatment withdrawals due to dose‐related and idiosyncratic adverse events | PHT (n = 70): 11 treatment withdrawals due to dose‐related adverse events (nystagmus, ataxia, tremor, diplopia and mental change) 5 treatment withdrawals due to idiosyncratic adverse events (skin eruption, erythroderma and jaundice) | SV (n = 70): 9 treatment withdrawals due to dose‐related adverse events (tremor, irritability, restlessness and alopecia) No treatment withdrawals due to idiosyncratic adverse events | |
| aAdverse event data, as reported narratively in the publications. Adverse event data were not requested in original IPD requests but will be for all future IPD requests. For numbers of treatment withdrawals due to adverse events in studies for which IPD were provided (De Silva 1996; Heller 1995; Ramsay 1992; Turnbull 1985) see Table 5. | |||
| Outcome or subgroup title | No. of studies | No. of participants | Statistical method | Effect size |
| 1 Time to treatment failure (any reason related to the treatment) Show forest plot | 6 | 569 | Hazard Ratio (Fixed, 95% CI) | 0.94 [0.67, 1.32] |
| 2 Time to treatment failure due to adverse events Show forest plot | 4 | 495 | Hazard Ratio (Fixed, 95% CI) | 0.68 [0.40, 1.17] |
| 3 Time to treatment failure due to lack of efficacy Show forest plot | 6 | 569 | Hazard Ratio (Fixed, 95% CI) | 1.23 [0.77, 1.97] |
| 4 Time to treatment failure (any reason related to the treatment) ‐ by epilepsy type Show forest plot | 5 | 528 | Hazard Ratio (Fixed, 95% CI) | 0.88 [0.61, 1.27] |
| 4.1 Focal onset seizures | 4 | 187 | Hazard Ratio (Fixed, 95% CI) | 0.83 [0.50, 1.38] |
| 4.2 Generalised onset seizures (tonic‐clonic only) | 5 | 341 | Hazard Ratio (Fixed, 95% CI) | 0.94 [0.55, 1.61] |
| 5 Time to treatment failure due to adverse events ‐ by epilepsy type Show forest plot | 4 | 418 | Hazard Ratio (Fixed, 95% CI) | 0.77 [0.44, 1.37] |
| 5.1 Focal onset seizures | 3 | 168 | Hazard Ratio (Fixed, 95% CI) | 0.75 [0.35, 1.60] |
| 5.2 Generalised onset seizures (tonic‐clonic only) | 3 | 250 | Hazard Ratio (Fixed, 95% CI) | 0.81 [0.34, 1.90] |
| 6 Time to treatment failure due to lack of efficacy ‐ by epilepsy type Show forest plot | 5 | 451 | Hazard Ratio (Fixed, 95% CI) | 1.16 [0.71, 1.89] |
| 6.1 Focal onset seizures | 4 | 187 | Hazard Ratio (Fixed, 95% CI) | 1.01 [0.55, 1.85] |
| 6.2 Generalised onset seizures (tonic‐clonic only) | 4 | 264 | Hazard Ratio (Fixed, 95% CI) | 1.51 [0.66, 3.45] |
| 7 Time to first seizure Show forest plot | 5 | 639 | Hazard Ratio (Fixed, 95% CI) | 1.04 [0.85, 1.28] |
| 8 Time to first seizure ‐ by epilepsy type Show forest plot | 5 | 639 | Hazard Ratio (Fixed, 95% CI) | 1.08 [0.88, 1.33] |
| 8.1 Focal onset seizures | 4 | 244 | Hazard Ratio (Fixed, 95% CI) | 1.20 [0.90, 1.60] |
| 8.2 Generalised onset seizures (tonic‐clonic only) | 5 | 395 | Hazard Ratio (Fixed, 95% CI) | 0.97 [0.72, 1.30] |
| 9 Time to first seizure ‐ epilepsy type reclassified to focal for generalised and age of onset > 30 years Show forest plot | 5 | 639 | Hazard Ratio (Fixed, 95% CI) | 1.05 [0.86, 1.29] |
| 9.1 Focal onset seizures | 5 | 416 | Hazard Ratio (Fixed, 95% CI) | 1.23 [0.96, 1.57] |
| 9.2 Generalised onset seizures (tonic‐clonic only) | 4 | 223 | Hazard Ratio (Fixed, 95% CI) | 0.72 [0.50, 1.05] |
| 10 Time to first seizure ‐ epilepsy type reclassified to uncertain for generalised and age of onset > 30 years Show forest plot | 5 | 649 | Hazard Ratio (Fixed, 95% CI) | 1.06 [0.86, 1.30] |
| 10.1 Focal onset seizures | 4 | 255 | Hazard Ratio (Fixed, 95% CI) | 1.20 [0.90, 1.60] |
| 10.2 Generalised onset seizures (tonic‐clonic only) | 4 | 223 | Hazard Ratio (Fixed, 95% CI) | 0.72 [0.50, 1.05] |
| 10.3 Uncertain seizure type | 4 | 171 | Hazard Ratio (Fixed, 95% CI) | 1.35 [0.85, 2.14] |
| 11 Time to achieve 12‐month remission Show forest plot | 4 | 514 | Hazard Ratio (Fixed, 95% CI) | 1.03 [0.82, 1.29] |
| 12 Time to achieve 12‐month remission ‐ by epilepsy type Show forest plot | 4 | 514 | Hazard Ratio (Fixed, 95% CI) | 1.02 [0.81, 1.28] |
| 12.1 Focal onset seizures | 4 | 244 | Hazard Ratio (Fixed, 95% CI) | 1.11 [0.78, 1.60] |
| 12.2 Generalised onset seizures (tonic‐clonic only) | 4 | 270 | Hazard Ratio (Fixed, 95% CI) | 0.96 [0.71, 1.29] |
| 13 Time to achieve six‐month remission Show forest plot | 5 | 639 | Hazard Ratio (Fixed, 95% CI) | 1.08 [0.89, 1.30] |
| 14 Time to achieve six‐month remission ‐ by epilepsy type Show forest plot | 5 | 639 | Hazard Ratio (Fixed, 95% CI) | 1.05 [0.86, 1.27] |
| 14.1 Focal onset seizures | 4 | 244 | Hazard Ratio (Fixed, 95% CI) | 1.00 [0.73, 1.35] |
| 14.2 Generalised onset seizures (tonic‐clonic only) | 5 | 395 | Hazard Ratio (Fixed, 95% CI) | 1.08 [0.84, 1.38] |