Monoterapia con valproato de sodio versus fenitoína para la epilepsia: una revisión de datos de participantes individuales
Appendices
Appendix 1. Cochrane Epilepsy Group's Specialized Register search strategy
1. MeSH DESCRIPTOR Phenytoin Explode All AND INREGISTER
2. phenytoin or Epanutin or Phenytek or Dilantin or Eptoin or Diphenin or Dipheninum or Diphenylhydantoin AND INREGISTER
3. #1 OR #2 AND INREGISTER
4. MeSH DESCRIPTOR Valproic Acid Explode All AND INREGISTER
5. Depakene or Depacon or Depakine or Valparin or Stavzor or Epilim or Epiject or Episenta or Epival or Valpro* or Orlept or Orfiril or Selenica or Convulex or Depakote AND INREGISTER
6. #4 OR #5 AND INREGISTER
7. #3 AND #6 AND INREGISTER
8. (adjunct* or "add‐on" or "add on" or adjuvant* or combination* or polytherap*) not (monotherap* or alone or singl*):TI AND INREGISTER
9. #7 NOT #8 AND INREGISTER
10. MeSH DESCRIPTOR Phenytoin Explode All AND CENTRAL:TARGET
11. phenytoin or Epanutin or Phenytek or Dilantin or Eptoin or Diphenin or Dipheninum or Diphenylhydantoin AND CENTRAL:TARGET
12. #10 OR #11 AND CENTRAL:TARGET
13. MeSH DESCRIPTOR Valproic Acid Explode All AND CENTRAL:TARGET
14. Depakene or Depacon or Depakine or Valparin or Stavzor or Epilim or Epiject or Episenta or Epival or Valpro* or Orlept or Orfiril or Selenica or Convulex or Depakote AND CENTRAL:TARGET
15. #13 OR #14 AND CENTRAL:TARGET
16. #12 AND #15 AND CENTRAL:TARGET
17. (adjunct* or "add‐on" or "add on" or adjuvant* or combination* or polytherap*) not (monotherap* or alone or singl*):TI AND CENTRAL:TARGET
18. #16 NOT #17 AND CENTRAL:TARGET
19. #9 OR #18
Appendix 2. CENTRAL search strategy
#1 MeSH descriptor: [Phenytoin] explode all trees
#2 Epanutin or Phenytek or Dilantin or Eptoin or Diphenin or Dipheninum or Diphenylhydantoin:ti,ab,kw (Word variations have been searched)
#3 #1 or #2
#4 MeSH descriptor: [Valproic Acid] explode all trees
#5 Depakene or Depacon or Depakine or Valparin or Stavzor or Epilim or Epiject or Episenta or Epival or Valpro* or Orlept or Orfiril or Selenica or Convulex or Depakote:ti,ab,kw (Word variations have been searched)
#6 #4 or #5
#7 #3 and #6
#8 (adjunct* or "add‐on" or "add on" or adjuvant* or combination* or polytherap*) not (monotherap* or alone or singl*):ti (Word variations have been searched)
#9 #7 not #8
#10 (epilep* or seizure* or convuls*):ti,ab,kw (Word variations have been searched)
#11 MeSH descriptor: [Epilepsy] explode all trees
#12 MeSH descriptor: [Seizures] explode all trees
#13 (#10 or #11 or #12) in Trials
#14 #9 and #13
Appendix 3. MEDLINE search strategy
The following search is based on the Cochrane Highly Sensitive Search Strategy for identifying randomised trials in MEDLINE (Lefebvre 2011).
1. exp phenytoin/ or (Epanutin or Phenytek or Dilantin or Eptoin or Diphenin or Dipheninum or Diphenylhydantoin).mp.
2. exp Valproic Acid/ or (Depakene or Depacon or Depakine or Valparin or Stavzor or Epilim or Epiject or Episenta or Epival or Valpro$ or Orlept or Orfiril or Selenica or Convulex or Depakote).mp.
3. ((adjunct$ or "add‐on" or "add on" or adjuvant$ or combination$ or polytherap$) not (monotherap$ or alone or singl$)).ti.
4. (1 and 2) not 3
5. (randomized controlled trial or controlled clinical trial or pragmatic clinical trial).pt. or (randomi?ed or placebo or randomly).ab.
6. clinical trials as topic.sh.
7. trial.ti.
8. 5 or 6 or 7
9. exp animals/ not humans.sh.
10. 8 not 9
11. exp Epilepsy/
12. exp Seizures/
13. (epilep$ or seizure$ or convuls$).tw.
14. 11 or 12 or 13
15. exp *Pre‐Eclampsia/ or exp *Eclampsia/
16. 14 not 15
17. 4 and 10 and 16
18. remove duplicates from 17
Earlier versions of this review used the following search, based on the previous Cochrane Highly Sensitive Search Strategy for MEDLINE as set out in Appendix 5b of the Cochrane Handbook for Systematic Reviews of Interventions (version 4.2.4, updated March 2005) (Higgins 2011).
1. randomized controlled trial.pt.
2. controlled clinical trial.pt.
3. exp Randomized Controlled Trials/
4. exp Random Allocation/
5. exp Double‐Blind Method/
6. exp Single‐Blind Method/
7. clinical trial.pt.
8. Clinical Trial/
9. (clin$ adj trial$).ab,ti.
10. ((singl$ or doubl$ or trebl$ or tripl$) adj (blind$ or mask$)).ab,ti.
11. exp PLACEBOS/
12. placebo$.ab,ti.
13. random$.ab,ti.
14. exp Research Design/
15. or/1‐14
16. (animals not humans).sh.
17. 15 not 16
18. phenytoin/ or (phenytoin or diphenylhydantoin).tw.
19. valproic acid/ or valpro$.tw.
20. exp epilepsy/ or epilep$.tw.
21. exp seizures/ or seizure$.tw.
22. convulsion$.tw.
23. 18 and 19
24. 20 or 21 or 22
25. 23 and 24
26. 17 and 25
Appendix 4. SCOPUS search strategy
(((TITLE(phenytoin or Epanutin or Phenytek or Dilantin or Eptoin or Diphenin or Dipheninum or Diphenylhydantoin) or ABS(phenytoin or Epanutin or Phenytek or Dilantin or Eptoin or Diphenin or Dipheninum or Diphenylhydantoin)) and (TITLE(Depakene or Depacon or Depakine or Valparin or Stavzor or Epilim or Epiject or Episenta or Epival or Valpro* or Orlept or Orfiril or Selenica or Convulex or Depakote) or ABS(Depakene or Depacon or Depakine or Valparin or Stavzor or Epilim or Epiject or Episenta or Epival or Valpro* or Orlept or Orfiril or Selenica or Convulex or Depakote))) and not (TITLE‐ABS‐KEY((adjunct* OR "add‐on" OR "add on") AND NOT monotherap*))) and (TITLE((randomiz* OR randomis* OR controlled OR placebo OR blind* OR unblind* OR "parallel‐group" OR "parallel group" OR crossover OR cross‐over OR "cross over" OR cluster OR "head to head" OR "head‐to‐head") PRE/2 (trial OR method OR procedure OR study)) OR ABS((randomiz* OR randomis* OR controlled OR placebo OR blind* OR unblind* OR "parallel‐group" OR "parallel group" OR crossover OR cross‐over OR "cross over" OR cluster OR "head to head" OR "head‐to‐head") PRE/2 (trial OR method OR procedure OR study))) and ((TITLE‐ABS‐KEY(epilep* OR "infantile spasm" OR seizure OR convuls* OR (syndrome W/2 (aicardi OR angelman OR doose OR dravet OR janz OR jeavons OR "landau kleffner" OR "lennox gastaut" OR ohtahara OR panayiotopoulos OR rasmussen OR rett OR "sturge weber" OR tassinari OR "unverricht lundborg" OR west)) OR "ring chromosome 20" OR "R20" OR "myoclonic encephalopathy" OR "pyridoxine dependency") AND NOT (TITLE(*eclampsia) OR INDEXTERMS(*eclampsia))) OR (TITLE‐ABS‐KEY(lafora* W/4 (disease OR epilep*)) AND NOT (TITLE(dog OR canine) OR INDEXTERMS(dog OR canine))))

Study flow diagram.
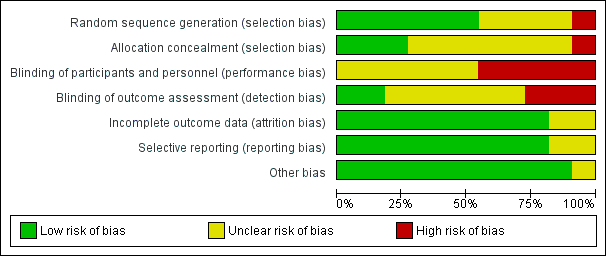
'Risk of bias' graph: review authors' judgements about each risk of bias item presented as percentages across all included studies.

'Risk of bias' summary: review authors' judgements about each risk of bias item for each included study.
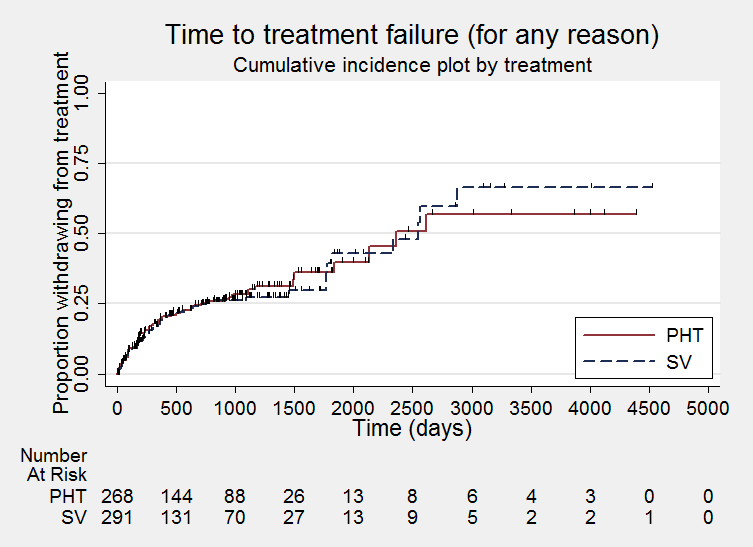
Time to treatment failure ‐ any reason related to the treatment (PHT: phenytoin; SV: sodium valproate)
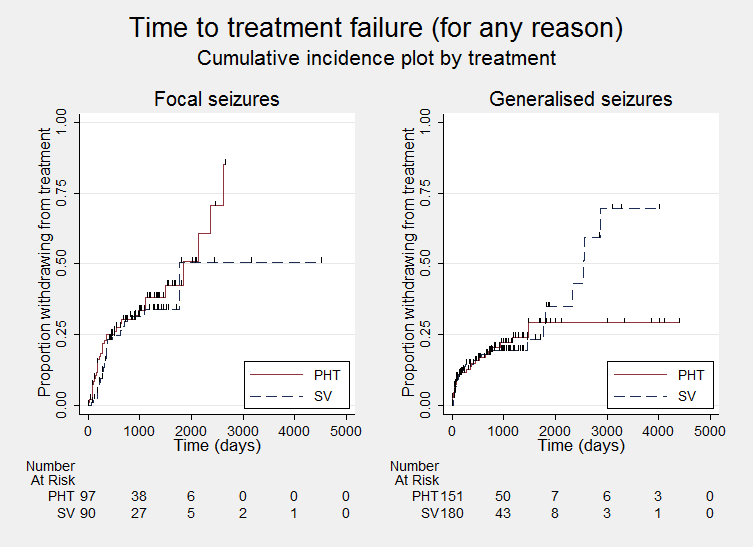
Time to treatment failure ‐ any reason related to the treatment, by epilepsy type (PHT: phenytoin; SV: sodium valproate)
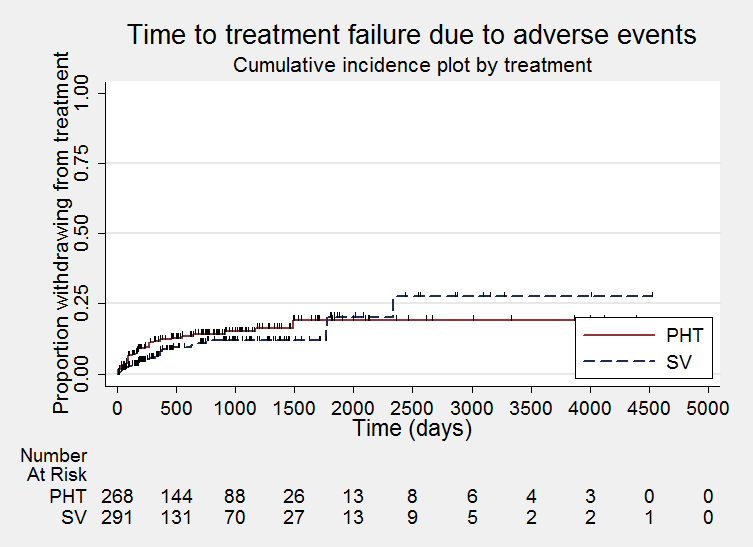
Time to treatment failure due to adverse events (PHT: phenytoin; SV: sodium valproate)

Time to treatment failure due to adverse events, by epilepsy type (PHT: phenytoin; SV: sodium valproate)

Time to treatment failure due to lack of efficacy (PHT: phenytoin; SV: sodium valproate)

Time to treatment failure due to lack of efficacy, by epilepsy type (PHT: phenytoin; SV: sodium valproate)

Time to first seizure (PHT: phenytoin; SV: sodium valproate)

Time to first seizure ‐ by epilepsy type. (PHT: phenytoin; SV: sodium valproate)

Time to achieve 12‐month remission (PHT: phenytoin; SV: sodium valproate)
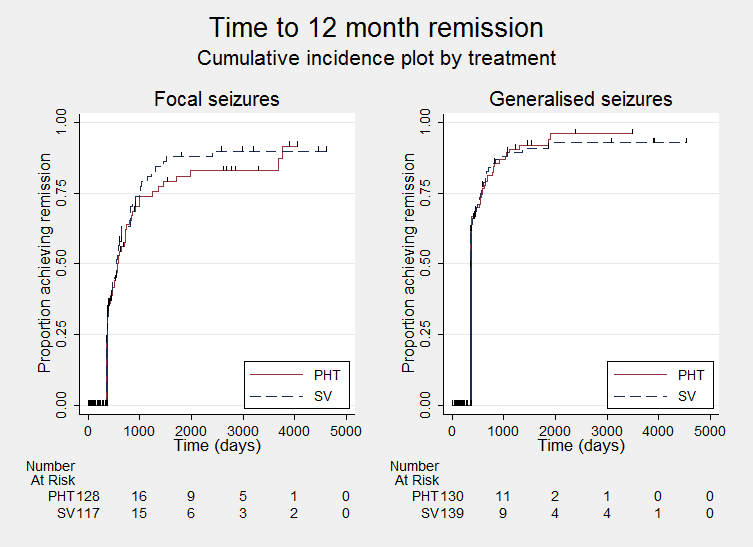
Time to achieve 12‐month remission ‐ by epilepsy type. (PHT: phenytoin; SV: sodium valproate)
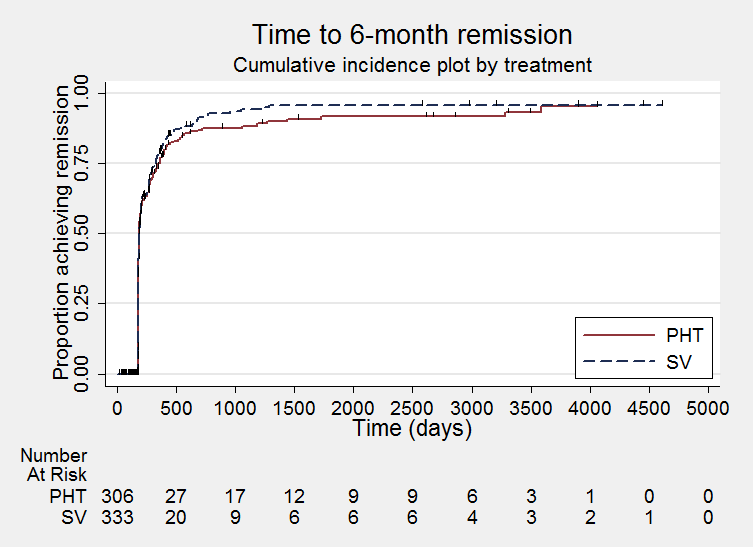
Time to achieve six‐month remission (PHT: phenytoin; SV: sodium valproate)

Time to achieve six‐month remission (PHT: phenytoin; SV: sodium valproate)

Comparison 1 Sodium valproate versus phenytoin, Outcome 1 Time to treatment failure (any reason related to the treatment).
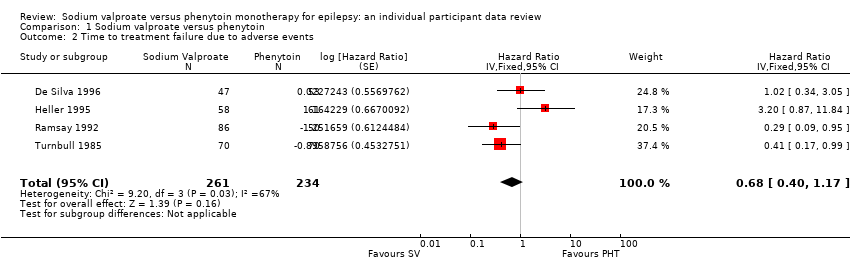
Comparison 1 Sodium valproate versus phenytoin, Outcome 2 Time to treatment failure due to adverse events.

Comparison 1 Sodium valproate versus phenytoin, Outcome 3 Time to treatment failure due to lack of efficacy.

Comparison 1 Sodium valproate versus phenytoin, Outcome 4 Time to treatment failure (any reason related to the treatment) ‐ by epilepsy type.
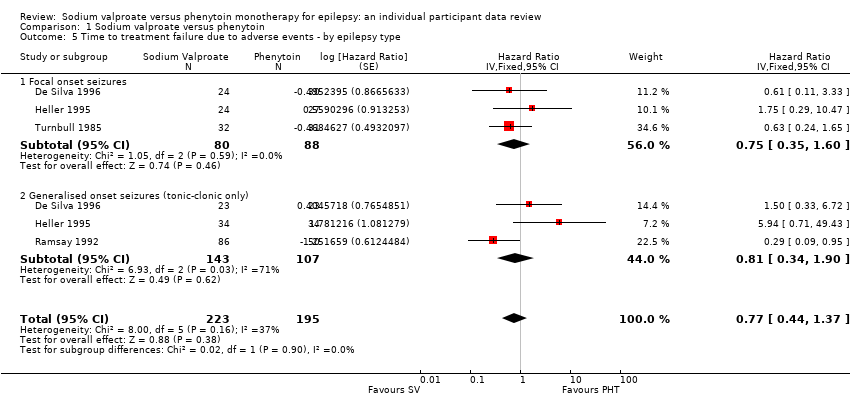
Comparison 1 Sodium valproate versus phenytoin, Outcome 5 Time to treatment failure due to adverse events ‐ by epilepsy type.

Comparison 1 Sodium valproate versus phenytoin, Outcome 6 Time to treatment failure due to lack of efficacy ‐ by epilepsy type.

Comparison 1 Sodium valproate versus phenytoin, Outcome 7 Time to first seizure.

Comparison 1 Sodium valproate versus phenytoin, Outcome 8 Time to first seizure ‐ by epilepsy type.
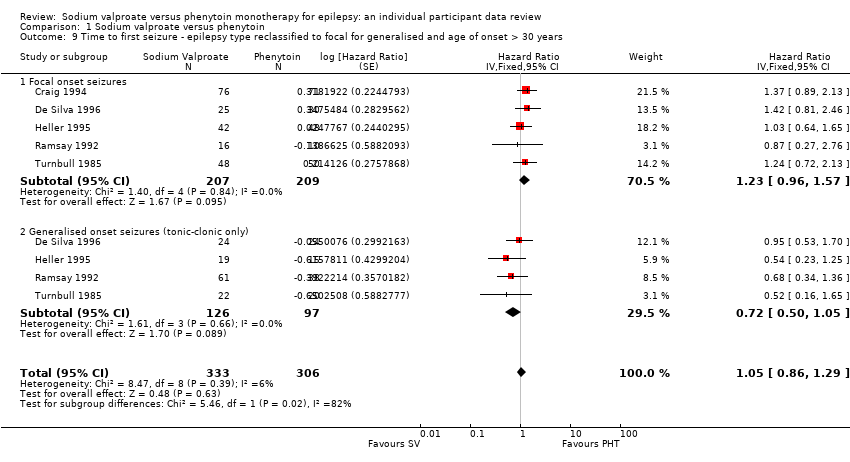
Comparison 1 Sodium valproate versus phenytoin, Outcome 9 Time to first seizure ‐ epilepsy type reclassified to focal for generalised and age of onset > 30 years.
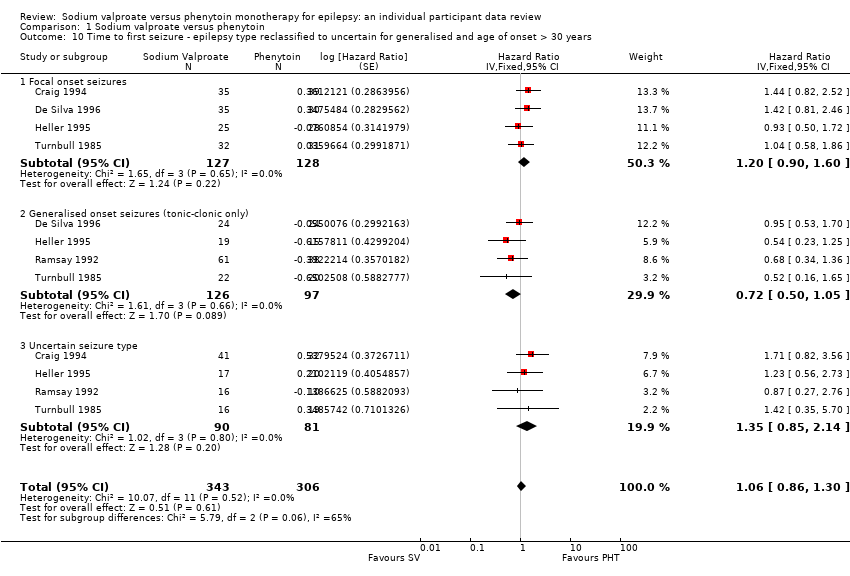
Comparison 1 Sodium valproate versus phenytoin, Outcome 10 Time to first seizure ‐ epilepsy type reclassified to uncertain for generalised and age of onset > 30 years.
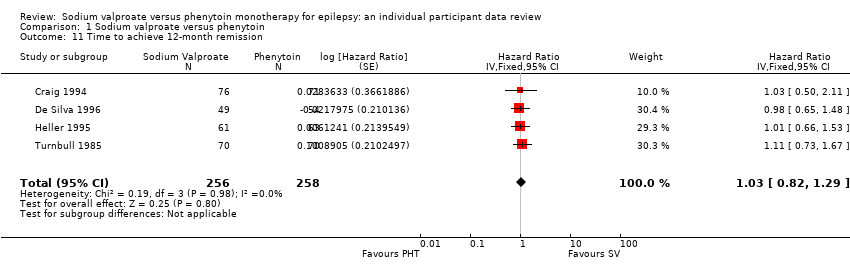
Comparison 1 Sodium valproate versus phenytoin, Outcome 11 Time to achieve 12‐month remission.
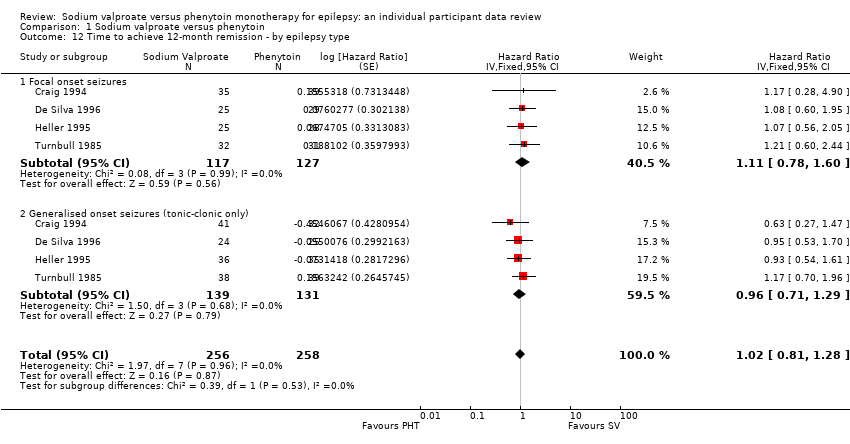
Comparison 1 Sodium valproate versus phenytoin, Outcome 12 Time to achieve 12‐month remission ‐ by epilepsy type.

Comparison 1 Sodium valproate versus phenytoin, Outcome 13 Time to achieve six‐month remission.

Comparison 1 Sodium valproate versus phenytoin, Outcome 14 Time to achieve six‐month remission ‐ by epilepsy type.
| Sodium valproate compared with phenytoin monotherapy for epilepsy | ||||||
| Patient or population: adults and children with newly‐onset focal onset or generalised tonic‐clonic seizures Settings: outpatients Intervention: sodium valproate Comparison: phenytoin | ||||||
| Outcomes | Illustrative comparative risks* (95% CI) | Relative effect | No. of Participants | Quality of the evidence | Comments | |
| Assumed risk | Corresponding risk | |||||
| Phenytoin | Sodium valproate | |||||
| Time to treatment failure (any reason related to treatment) All participants Range of follow‐up: 0 to 4256 days | The median time to treatment failure was 2361 days in the phenytoin group | The median time to treatment failure was 2545 days (184 days longer) in the sodium valproate group | HR 0.88 (0.61 to 1.27)a | 528 | ⊕⊕⊕⊝ | HR < 1 indicates a clinical advantage for valproate There was also no statistically significant difference between drugs in treatment failure due to adverse events: HR 0.77 (95% CI 0.44 to 1.37, P = 0.38) or treatment failure due to lack of efficacy: HR 1.16 (95% CI 0.71 to 1.89, P = 0.55) |
| Time to treatment failure (any reason related to treatment) Subgroup: focal onset seizures Range of follow‐up: 0 to 4256 days | The median time to treatment failure was 1838 days in the phenytoin group | The median time to treatment failure was 1772 days (66 days shorter) in the sodium valproate group | HR 0.83 (0.50 to 1.38) | 187 (4 studies) | ⊕⊕⊕⊝ | HR < 1 indicates a clinical advantage for valproate There was also no statistically significant difference between drugs in treatment failure due to adverse events: HR 0.81 (95% CI 0.34 to 1.90, P = 0.62) or treatment failure due to lack of efficacy: HR 1.01 (95% CI 0.55 to 1.85, P = 0.98) |
| Time to treatment failure (any reason related to treatment) Subgroup: generalised onset seizures (tonic‐clonic only) Range of follow‐up: 0 to 4394 days | The 25th percentile** of time to treatment failure was 1488 days in the phenytoin group | The 25th percentile** of time to treatment failure was 1778 days (290 days longer) in the sodium valproate group | HR 0.94 (0.55 to 1.61) | 341 | ⊕⊕⊕⊝ | HR < 1 indicates a clinical advantage for valproate There was also no statistically significant difference between drugs in treatment failure due to adverse events: HR 0.75 (95% CI 0.35 to 1.60, P = 0.46) or treatment failure due to lack of efficacy: HR 1.51 (95% CI 0.66 to 3.45, P = 0.33) |
| * Illustrative risks in the sodium valproate and phenytoin groups are calculated at the median time to treatment failure (i.e. the time to 50% of participants failing or withdrawing from allocated treatment) within each group across all trials. The relative effect (pooled HR) shows the comparison of 'time to treatment failure' between the treatment groups. ** The 25th percentile of time to treatment failure (i.e. the time to 25% of participants failing or withdrawing from allocated treatment) is presented for the subgroup with generalised seizures as less than 50% of participants failed/withdrew from treatment, therefore the median time could not be calculated. Abbreviations: CI: confidence interval; HR: hazard ratio. | ||||||
| GRADE Working Group grades of evidence | ||||||
| aPooled HR for all participants adjusted for seizure type. | ||||||
| Valproate compared with phenytoin monotherapy for epilepsy | ||||||
| Patient or population: adults and children with newly‐onset focal onset or generalised tonic‐clonic seizures Settings: outpatients Intervention: sodium valproate Comparison: phenytoin | ||||||
| Outcomes | Illustrative comparative risks* (95% CI) | Relative effect | No. of Participants | Quality of the evidence | Comments | |
| Assumed risk | Corresponding risk | |||||
| Phenytoin | Sodium valproate | |||||
| Time to first seizure (post‐randomisation) All participants Range of follow‐up: 0 to 4859 days | The median time to first seizure post‐randomisation was 275 days in the phenytoin group | The median time to first seizure post‐randomisation was 267 days (7 days shorter) in the sodium valproate group | HR 1.08 (0.88 to 1.33)a | 639 (5 studies) | ⊕⊕⊝⊝ | HR < 1 indicates a clinical |
| Time to first seizure (post‐randomisation) Subgroup: focal onset seizures Range of follow‐up: 0 to 4859 days | The median time to first seizure post‐randomisation was 75 days in the phenytoin group | The median time to first seizure post‐randomisation was 41 days (34 days shorter) in the sodium valproate group | HR 1.20 (0.90 to 1.60) | 244 (4 studies) | ⊕⊕⊝⊝ | HR < 1 indicates a clinical |
| Time to first seizure (post‐randomisation) Subgroup: generalised onset seizures (tonic‐clonic only) Range of follow‐up: 1 to 4520 days | The median time to first seizure post‐randomisation was 572 days in the phenytoin group | The median time to first seizure post‐randomisation was 549 days (23 days shorter) in the sodium valproate group | HR 0.97 (0.72 to 1.30) | 395 (5 studies) | ⊕⊕⊝⊝ | HR < 1 indicates a clinical |
| Time to achieve 12‐month remission (seizure‐free period) All participants Range of follow‐up: 5 to 4614 days | The median time to achieve 12‐month remission was 380 days in the phenytoin group | The median time to achieve 12‐month remission was 386 days (6 days longer) in the sodium valproate group | HR 1.02 (0.81 to 1.28) | 514 (4 studies) | ⊕⊕⊕⊝ | HR < 1 indicates a clinical |
| Time to achieve 12‐month remission (seizure‐free period) Subgroup: focal onset seizures Range of follow‐up: 5 to 4614 days | The median time to achieve 12‐month remission was 575 days in the phenytoin group | The median time to achieve 12‐month remission was 549 days (26 days shorter) in the sodium valproate group | HR 1.11 (0.78 to 1.60) | 244 (4 studies) | ⊕⊕⊕⊝ | HR < 1 indicates a clinical |
| Time to achieve 12‐month remission (seizure‐free period) Subgroup: generalised onset seizures (tonic‐clonic only) Range of follow‐up: 7 to 4544 days | The median time to achieve 12‐month remission was 365 days in the phenytoin group | The median time to achieve 12‐month remission was 366 days (1 day longer) in the sodium valproate group | HR 0.96 (0.71 to 1.29) | 270 (4 studies) | ⊕⊕⊕⊝ | HR < 1 indicates a clinical |
| * Illustrative risks in the phenytoin and sodium valproate groups are calculated at the median time to first seizure or time to 12‐month remission (i.e. the time to 50% of participants experiencing a first seizure or 12 months of remission) within each group across all trials. The relative effect (pooled HR) shows the comparison of 'time to first seizure' or 'time to 12‐month remission' between the treatment groups. Abbreviations: CI: confidence interval; HR: hazard ratio. | ||||||
| GRADE Working Group grades of evidence | ||||||
| aPooled HR for all participants adjusted for seizure type. | ||||||
| Focal seizures: n (%) | Male gender: n (%) | Age at entry (years): Mean (SD), range | Aged > 30 years and generalised seizures: n (%) | Epilepsy duration (years): mean (SD), range | Number of seizures in prior 6 months: median (range) | |||||||||||||
| SV | PHT | Missing | SV | PHT | Missing | SV | PHT | Missing | SV | PHT | Missing | SV | PHT | Missing | SV | PHT | Missing | |
| 37 (44%) | 43 (53%) | 0 | 38 (46%) | 33 (41%) | 3 | 77.6 (7.2), 61 to 95 | 78.7 (7.0), 64 to 95 | 3 | 46 | 38 | 0 | NA | NA | 166 | 2 (0 to 60) | 3 (1 to 99) | 3 | |
| 25 (51%) | 30 (56%) | 0 | 18 (37%) | 34 (63%) | 0 | 11.3 (3.3), 2 to 15 | 9.5 (3.4), 3 to 15 | 0 | 0 | 0 | 0 | 1.2 (1.5), 0 to 4.9 | 1.0 (2.1), 0 to 13.7 | 0 | 3 (1 to 900) | 3 (1 to 404) | 0 | |
| 25 (41%) | 28 (44%) | 0 | 28 (46%) | 34 (54%) | 0 | 32.0 (15.6), 14 to 67 | 33.5 (14.3), 14 to 72 | 2 | 17 | 20 | 0 | 2.6 (3.9), 0 to 17.9 | 3.8 (5.4), 0 to 24.3 | 2 | 2 (1 to 181) | 2 (1 to 575) | 2 | |
| 0 (0%) | 0 (0%) | 0 | 48 (56%) | 25 (50%) | 0 | 21.1 (14.4), 3 to 64 | 20.6 (14.0), 4 to 63 | 0 | 16 | 10 | 0 | 0.1 (0.3), 0 to 1.9 | 0.2 (0.5), 0 to 3.0 | 15 | NA | NA | 136 | |
| 32 (46%) | 31 (44%) | 0 | 34 (49%) | 39 (56%) | 0 | 35.1 (16.5), 14 to 69 | 35.3 (15.9), 16 to 70 | 0 | 16 | 19 | 0 | 2.2 (2.9), 0.1 to 11.0 | 2.1 (4.2), 0.1 to 30.0 | 0 | 2 (0 to 60) | 2 (1 to 60) | 0 | |
| SV= sodium valproate; PHT= Phenytoin; n = number of participants; NA = not available; SD = standard deviation. Proportions (%) are calculated based on non‐missing data. | ||||||||||||||||||
| EEG normal: n (%) | CT scan normal: n (%) | Neurological exam normal: n (%) | |||||||
| SV | PHT | Missing | SV | PHT | Missing | SV | PHT | Missing | |
| 20 (30%) | 8 (16%) | 64 | NA | NA | 166 | NA | NA | 166 | |
| NA | NA | 103 | NA | NA | 103 | 43 (88%) | 48 (89%) | 0 | |
| NA | NA | 124 | NA | NA | 124 | 56 (95%) | 54 (86%) | 2 | |
| NA | NA | 136 | NA | NA | 136 | NA | NA | 136 | |
| 30 (46%) | 38 (54%) | 0 | 6 (50%) | 11 (73%) | 43 | NA | NA | 70 | |
| EEG = electroencephalographic; SV= sodium valproate; PHT= Phenytoin; n = number of participants; NA = not available. Proportions (%) are calculated based on non‐missing data. | |||||||||
| Trial | Outcomes reported | Summary of results |
|
|
| |
|
| ||
|
|
No significant differences between treatment groups for any other cognitive tests
| |
|
|
| |
|
|
| |
|
|
| |
| n = number of participants; PHT: phenytoin; SV: sodium valproate. | ||
| Trial | Number randomised | Time to treatment failure (for any reason related to treatment) | Time to achieve 12‐month remission | Time to achieve 6‐month remission | Time to first seizure | ||||||||||
| PHT | SV | Total | PHT | SV | Total | PHT | SV | Total | PHT | SV | Total | PHT | SV | Total | |
| 81 | 85 | 166 | 0 | 0 | 0 | 71 | 76 | 147 | 71 | 76 | 147 | 71 | 76 | 147 | |
| 54 | 49 | 103 | 53 | 47 | 100 | 54 | 49 | 103 | 54 | 49 | 103 | 54 | 49 | 103 | |
| 20 | 21 | 41 | 20 | 21 | 41 | 0 | 0 | 0 | 0 | 0 | 0 | 0 | 0 | 0 | |
| 63 | 61 | 124 | 61 | 58 | 119 | 63 | 61 | 124 | 63 | 61 | 124 | 63 | 61 | 124 | |
| 50 | 86 | 136 | 50 | 86 | 136 | 0 | 0 | 0 | 48 | 77 | 125 | 48 | 77 | 125 | |
| 70 | 70 | 140 | 70 | 70 | 140 | 70 | 70 | 140 | 70 | 70 | 140 | 70 | 70 | 140 | |
| 15 | 18 | 33 | 15 | 18 | 33 | 0 | 0 | 0 | 0 | 0 | 0 | 0 | 0 | 0 | |
| Total | 353 | 390 | 743 | 269 | 300 | 569 | 258 | 256 | 514 | 306 | 333 | 639 | 306 | 333 | 639 |
| aTreatment failure information not provided for Craig 1994, so cannot contribute to 'time to treatment failure'. PHT: phenytoin; SV: sodium valproate. | |||||||||||||||
| Reason for early termination (and classification in time‐to‐event analysis) | Heller 1995b, c | Totala | |||||||||||||
| SV | PHT | SV | PHT | SV | PHT | SV | PHT | SV | PHT | SV | PHT | SV | PHT | All | |
| Adverse events (event) | 2 | 2 | 4 | 1 | 4 | 8 | 6 | 14 | 0 | 1 | 0 | 0 | 16 | 26 | 42 |
| Lack of efficacy (event) | 11 | 10 | 9 | 8 | 1 | 1 | 2 | 0 | 2 | 1 | 3 | 6 | 28 | 26 | 54 |
| Both adverse events and lack of efficacy (event) | 4 | 5 | 6 | 2 | 0 | 0 | 1 | 2 | 0 | 0 | 0 | 0 | 11 | 9 | 20 |
| Non‐compliance/protocol violation (event) | 0 | 0 | 0 | 0 | 7 | 2 | 2 | 2 | 5 | 4 | 0 | 0 | 14 | 8 | 22 |
| Illness or death (not treatment‐related, censored)e | 0 | 0 | 0 | 0 | 1 | 1 | 3 | 3 | 0 | 0 | 0 | 0 | 4 | 4 | 8 |
| Participant went into remission (censored) | 16 | 24 | 13 | 14 | 0 | 0 | 0 | 0 | 0 | 0 | 0 | 0 | 29 | 38 | 67 |
| Lost to follow‐up (censored) | 0 | 0 | 0 | 0 | 10 | 3 | 7 | 7 | 0 | 0 | 0 | 0 | 17 | 10 | 27 |
| Other (censored)f | 0 | 0 | 0 | 0 | 3 | 0 | 0 | 0 | 0 | 0 | 0 | 0 | 3 | 0 | 3 |
| Completed the study (censored) | 14 | 12 | 26 | 38 | 60 | 35 | 49 | 42 | 14 | 14 | 15 | 9 | 178 | 150 | 328 |
| Total | 47 | 53 | 58 | 63 | 86 | 50 | 70 | 70 | 21 | 20 | 18 | 15 | 300 | 271 | 571 |
| PHT: phenytoin; SV: sodium valproate | |||||||||||||||
| Outcome | Original analysis | Generalised onset and age at onset > 30 years classified as focal onset | Generalised onset and age at onset > 30 years classified as uncertain seizure type | |||
| Pooled HR (95% CI) fixed‐effects | Test of subgroup differences | Pooled HR (95% CI) fixed‐effects | Test of subgroup differences | Pooled HR (95% CI) fixed‐effects | Test of subgroup differences | |
| Time to treatment failure (for any reason related to treatment)a | F: 0.83 (0.50 to 1.38) G: 0.94 (0.55 to 1.61) O: 0.88 (0.61 to 1.27) | Chi² = 0.10, df = 1 (P = 0.75), I² = 0% | F: 0.95 (0.59 to 1.52) G: 0.77 (0.42 to 1.41) O: 0.88 (0.60 to 1.27) | Chi² = 0.29, df = 1 (P = 0.59), I² = 0% | F: 0.83 (0.50 to 1.38) G: 0.77 (0.42 to 1.41) U: 6.83 (0.82 to 57.16) O: 0.86 (0.59 to 1.27) | Chi² = 3.80, df = 2 (P = 0.15), I² = 47.3% |
| Time to treatment failure due to adverse eventsb | F: 0.75 (0.35 to 1.60) G: 0.81 (0.34 to 1.90) O: 0.77 (0.44 to 1.37) | Chi² = 0.02, df = 1 (P = 0.90), I² = 0% | F: 0.87 (0.42 to 1.80) G: 0.64 (0.26 to 1.59) O: 0.77 (0.44 to 1.36) | Chi² = 0.26, df = 1 (P = 0.61), I² = 0% | Not calculatedb | Not calculatedb |
| Time to treatment failure due to lack of efficacyb | F: 1.01 (0.55 to 1.85) G: 1.51 (0.66 to 3.45) O: 1.16 (0.71 to 1.89) | Chi² = 0.60, df = 1 (P = 0.44), I² = 0% | F: 1.00 (0.51 to 1.96) G: 1.73 (0.56 to 5.35) O: 1.16 (0.65 to 2.06) | Chi² = 0.66, df = 1 (P = 0.42), I² = 0% | Not calculatedb | Not calculatedb |
| Time to first seizurec | F: 1.20 (0.90 to 1.60) G: 0.97 (0.72 to 1.30) O: 1.08 (0.88 to 1.33) | Chi² = 1.06, df = 1 (P = 0.30), I² = 5.6% | F: 1.23 (0.96 to 1.57) G: 0.72 (0.50 to 1.05) O: 1.05 (0.86 to 1.29) | Chi² = 5.46, df = 1 (P = 0.02), I² = 81.7% | F: 1.20 (0.90 to 1.60) G: 0.72 (0.50 to 1.05) U: 1.35 (0.85 to 2.14) O: 1.06 (0.86 to 1.30) | Chi² = 5.79, df = 2 (P = 0.06), I² = 65.5% |
| Time to 12‐month remissiond | F: 1.11 (0.78 to 1.60) G: 0.96 (0.71 to 1.29) O: 1.02 (0.81 to 1.28) | Chi² = 0.39, df = 1 (P = 0.53), I² = 0% | F: 0.99 (0.75 to 1.32) G: 1.07 (0.72 to 1.59) O: 1.02 (0.81 to 1.28) | Chi² = 0.10, df = 1 (P = 0.75), I² = 0% | F: 1.11 (0.78 to 1.60) G: 1.07 (0.72 to 1.59) U: 0.74 (0.46 to 1.18) O: 0.99 (0.79 to 1.25) | Chi² = 2.07, df = 2 (P = 0.36), I² = 3.3% |
| Time to 6‐month remissione | F: 1.00 (0.73 to 1.35) G: 1.08 (0.84 to 1.38) O: 1.05 (0.86 to 1.27) | Chi² = 0.16, df = 1 (P = 0.69), I² = 0% | F: 1.00 (0.79 to 1.26) G: 1.14 (0.80 to 1.61) O: 1.04 (0.85 to 1.26) | Chi² = 0.38, df = 1 (P = 0.54), I² = 0% | F: 1.00 (0.73 to 1.35) G: 1.14 (0.80 to 1.61) U: 0.90 (0.62 to 1.31) O: 1.01 (0.83 to 1.23) | Chi² = 0.80, df = 2 (P = 0.67), I² = 0% |
| Chi²: Chi² statistic; df: degrees of freedom of Chi² distribution; F: focal epilepsy; G: generalised epilepsy; O: overall (all participants); U: uncertain epilepsy; P: P value (< 0.05 are classified as statistically significant). a100 participants reclassified to focal epilepsy or uncertain epilepsy type for outcome 'time to treatment failure (for any reason related to treatment)'; see Analysis 1.4 for original analysis. | ||||||
| Trial | Adverse event dataa | Summary of reported results | |
| Phenytoin (PHT) | SV (sodium valproate) | ||
| All adverse events developed (by drug) and adverse events leading to discontinuation of treatment | PHT (n = 58): gum hypertrophy (n = 2), rash (n = 2), ataxia (n = 2)
| SV (n = 64): weight gain (n = 4: all discontinued treatment), drowsiness (n = 2), aggressive behaviour (n = 1: discontinued treatment) | |
| Adverse event frequency (spontaneous reports)b Discontinuations due to adverse eventsc | PHT (n = 25): unsteadiness (n = 9), sleepiness (n = 7), drowsiness (n = 2), impaired concentration (n = 2), confusion (n = 1), constipation (n = 1), diarrhoea (n = 1), dysarthria (n = 1), lethargy (n = 1), nystagmus (n = 1), rash (n = 1), tired legs (n = 1) PHT discontinuations (n = 6): rash (n =1), diarrhoea (n = 1), confusion (n = 1), unsteadiness (n = 1), constipation (n = 1), sleepiness (n = 1) | SV (n = 17): unsteadiness (n = 2), sleepiness (n = 3), tremor (n = 5), oedema (n = 3), alopecia (n = 2), depression (n = 2), weight gain (n = 2) SV discontinuations (n = 2): weight gain and depression (n = 1), unsteadiness (n =1) | |
| "Exclusions" due to adverse events or no efficacyd | Proportion "excluded": PHT: 33.3% | Proportion "excluded": SV: 23.3% | |
| "Unacceptable" adverse events leading to drug withdrawale | PHT (n = 54): drowsiness (n = 2), skin rash (n = 1) blood dyscrasia (n = 1), hirsutism (n = 1) | SV (n = 49): behavioural (n = 1), tremor (n = 1) | |
| No adverse event data reported (treatment withdrawal data only reported) | 1 participant (PHT) withdrew from the study due to depression and anorexia | No adverse event data (or treatment withdrawals due to adverse events) reported | |
| “Unacceptable” adverse events leading to drug withdrawale | PHT (n = 63): myalgia (n = 1), irritability (n = 1)
| SV (n = 61): dizziness (n = 2) abnormal liver function test (n = 1) | |
| Most common adverse events (by treatment group)f | PHT (n = 50): dyspepsia (n = 1), nausea (n = 2), dizziness (n = 2), somnolence (n = 5), tremor (n = 2), rash (n = 4)
| SV (n = 86): dyspepsia (n = 7), nausea (n = 10), dizziness (n = 5), somnolence (n = 8), tremor (n = 5), rash (n = 3) | |
| Commonest adverse events (reported as percentages by treatment group)f | PHT (n = 45): gum hyperplasia (17.7%), nystagmus (13.33%), ataxia (2.2%), gastrointestinal disturbances (4.44%), drowsiness (4.44%) | SV (n = 49): gastrointestinal disturbances (12%), drowsiness (6.12%), weight gain (2.04%) | |
| Adverse events (narrative description)b | PHT (n = 15): 1 case of ataxia, 5 cases of acne | SV (n = 18): 2 cases of gastrointestinal symptoms, 2 cases of hair loss, 4 cases of weight gain | |
| Assessment of adverse eventsb | PHT (n = 52): 33 participants reported at least one side effect Reported frequencies: gingival hypertrophy (n = 30), ataxia (n = 13), sedation (n = 12), nausea and vomiting (n = 1) Other reported adverse events (no frequencies): nystagmus, confusion | SV (n = 48): 15 participants reported at least one side effect Reported frequencies: hyperactivity (n = 6), impaired school performance (n = 4), severe skin allergy (n = 1) | |
| Treatment withdrawals due to dose‐related and idiosyncratic adverse events | PHT (n = 70): 11 treatment withdrawals due to dose‐related adverse events (nystagmus, ataxia, tremor, diplopia and mental change) 5 treatment withdrawals due to idiosyncratic adverse events (skin eruption, erythroderma and jaundice) | SV (n = 70): 9 treatment withdrawals due to dose‐related adverse events (tremor, irritability, restlessness and alopecia) No treatment withdrawals due to idiosyncratic adverse events | |
| aAdverse event data, as reported narratively in the publications. Adverse event data were not requested in original IPD requests but will be for all future IPD requests. For numbers of treatment withdrawals due to adverse events in studies for which IPD were provided (De Silva 1996; Heller 1995; Ramsay 1992; Turnbull 1985) see Table 5. | |||
| Outcome or subgroup title | No. of studies | No. of participants | Statistical method | Effect size |
| 1 Time to treatment failure (any reason related to the treatment) Show forest plot | 6 | 569 | Hazard Ratio (Fixed, 95% CI) | 0.94 [0.67, 1.32] |
| 2 Time to treatment failure due to adverse events Show forest plot | 4 | 495 | Hazard Ratio (Fixed, 95% CI) | 0.68 [0.40, 1.17] |
| 3 Time to treatment failure due to lack of efficacy Show forest plot | 6 | 569 | Hazard Ratio (Fixed, 95% CI) | 1.23 [0.77, 1.97] |
| 4 Time to treatment failure (any reason related to the treatment) ‐ by epilepsy type Show forest plot | 5 | 528 | Hazard Ratio (Fixed, 95% CI) | 0.88 [0.61, 1.27] |
| 4.1 Focal onset seizures | 4 | 187 | Hazard Ratio (Fixed, 95% CI) | 0.83 [0.50, 1.38] |
| 4.2 Generalised onset seizures (tonic‐clonic only) | 5 | 341 | Hazard Ratio (Fixed, 95% CI) | 0.94 [0.55, 1.61] |
| 5 Time to treatment failure due to adverse events ‐ by epilepsy type Show forest plot | 4 | 418 | Hazard Ratio (Fixed, 95% CI) | 0.77 [0.44, 1.37] |
| 5.1 Focal onset seizures | 3 | 168 | Hazard Ratio (Fixed, 95% CI) | 0.75 [0.35, 1.60] |
| 5.2 Generalised onset seizures (tonic‐clonic only) | 3 | 250 | Hazard Ratio (Fixed, 95% CI) | 0.81 [0.34, 1.90] |
| 6 Time to treatment failure due to lack of efficacy ‐ by epilepsy type Show forest plot | 5 | 451 | Hazard Ratio (Fixed, 95% CI) | 1.16 [0.71, 1.89] |
| 6.1 Focal onset seizures | 4 | 187 | Hazard Ratio (Fixed, 95% CI) | 1.01 [0.55, 1.85] |
| 6.2 Generalised onset seizures (tonic‐clonic only) | 4 | 264 | Hazard Ratio (Fixed, 95% CI) | 1.51 [0.66, 3.45] |
| 7 Time to first seizure Show forest plot | 5 | 639 | Hazard Ratio (Fixed, 95% CI) | 1.04 [0.85, 1.28] |
| 8 Time to first seizure ‐ by epilepsy type Show forest plot | 5 | 639 | Hazard Ratio (Fixed, 95% CI) | 1.08 [0.88, 1.33] |
| 8.1 Focal onset seizures | 4 | 244 | Hazard Ratio (Fixed, 95% CI) | 1.20 [0.90, 1.60] |
| 8.2 Generalised onset seizures (tonic‐clonic only) | 5 | 395 | Hazard Ratio (Fixed, 95% CI) | 0.97 [0.72, 1.30] |
| 9 Time to first seizure ‐ epilepsy type reclassified to focal for generalised and age of onset > 30 years Show forest plot | 5 | 639 | Hazard Ratio (Fixed, 95% CI) | 1.05 [0.86, 1.29] |
| 9.1 Focal onset seizures | 5 | 416 | Hazard Ratio (Fixed, 95% CI) | 1.23 [0.96, 1.57] |
| 9.2 Generalised onset seizures (tonic‐clonic only) | 4 | 223 | Hazard Ratio (Fixed, 95% CI) | 0.72 [0.50, 1.05] |
| 10 Time to first seizure ‐ epilepsy type reclassified to uncertain for generalised and age of onset > 30 years Show forest plot | 5 | 649 | Hazard Ratio (Fixed, 95% CI) | 1.06 [0.86, 1.30] |
| 10.1 Focal onset seizures | 4 | 255 | Hazard Ratio (Fixed, 95% CI) | 1.20 [0.90, 1.60] |
| 10.2 Generalised onset seizures (tonic‐clonic only) | 4 | 223 | Hazard Ratio (Fixed, 95% CI) | 0.72 [0.50, 1.05] |
| 10.3 Uncertain seizure type | 4 | 171 | Hazard Ratio (Fixed, 95% CI) | 1.35 [0.85, 2.14] |
| 11 Time to achieve 12‐month remission Show forest plot | 4 | 514 | Hazard Ratio (Fixed, 95% CI) | 1.03 [0.82, 1.29] |
| 12 Time to achieve 12‐month remission ‐ by epilepsy type Show forest plot | 4 | 514 | Hazard Ratio (Fixed, 95% CI) | 1.02 [0.81, 1.28] |
| 12.1 Focal onset seizures | 4 | 244 | Hazard Ratio (Fixed, 95% CI) | 1.11 [0.78, 1.60] |
| 12.2 Generalised onset seizures (tonic‐clonic only) | 4 | 270 | Hazard Ratio (Fixed, 95% CI) | 0.96 [0.71, 1.29] |
| 13 Time to achieve six‐month remission Show forest plot | 5 | 639 | Hazard Ratio (Fixed, 95% CI) | 1.08 [0.89, 1.30] |
| 14 Time to achieve six‐month remission ‐ by epilepsy type Show forest plot | 5 | 639 | Hazard Ratio (Fixed, 95% CI) | 1.05 [0.86, 1.27] |
| 14.1 Focal onset seizures | 4 | 244 | Hazard Ratio (Fixed, 95% CI) | 1.00 [0.73, 1.35] |
| 14.2 Generalised onset seizures (tonic‐clonic only) | 5 | 395 | Hazard Ratio (Fixed, 95% CI) | 1.08 [0.84, 1.38] |