Monoterapia con valproato de sodio versus fenitoína para la epilepsia: una revisión de datos de participantes individuales
Referencias
References to studies included in this review
References to studies excluded from this review
Additional references
References to other published versions of this review
Characteristics of studies
Characteristics of included studies [ordered by study ID]
Ir a:
| Methods | Parallel study design, outpatient setting Study conducted in Eire (Republic of Ireland) Randomisation based on two Latin squares and the preference of drug for the participant An independent person selected “drug of first preference” from randomisation list | |
| Participants | Adults and children with a minimum of 2 untreated generalised or focal seizures in the 6 months preceding the trial Number randomised: PHT = 58; SV = 64 48 participants (39%) with focal epilepsy. 67 (55%) men Age range: 5‐71. Duration of treatment (range in months):3‐48 | |
| Interventions | Monotherapy with PHT or SV Mean daily dose achieved: PHT: 5.4 mg/kg; SV: 15.6 mg/kg | |
| Outcomes | Seizure control: | |
| Notes | Outcomes chosen for this review were not reported. IPD not available | |
| Risk of bias | ||
| Bias | Authors' judgement | Support for judgement |
| Random sequence generation (selection bias) | Unclear risk | Randomisation based on 2 Latin Squares without stratification. The first, second and third preference of drug for the participant appears to have been taken into account in the process. Unclear if assignment was completely random |
| Allocation concealment (selection bias) | High risk | An independent person (department secretary) selected the “drug of first preference” from randomisation list on a sequential basis. Allocation not adequately concealed |
| Blinding of participants and personnel (performance bias) | Unclear risk | No information provided |
| Blinding of outcome assessment (detection bias) | Unclear risk | No information provided |
| Incomplete outcome data (attrition bias) | Low risk | Attirition rates reported. ITT approach taken, all randomised participants analysed |
| Selective reporting (reporting bias) | Low risk | Primary outcomes (seizure control) and secondary outcomes (side effects) reported sufficiently. No protocol available, outcomes for this review not reported |
| Other bias | Low risk | No other bias detected |
| Methods | Parallel study design Study conducted in the UK Participants randomised using computerised stratified minimisation programme by age group, sex and seizure type Allocation was pharmacy‐controlled The main investigator performing cognitive testing was blinded to allocation. Participants and personnel unblinded | |
| Participants | Participants over 60 years of age with newly onset seizures (1 or more generalised tonic‐clonic seizures or 2 or more focal seizures) Number randomised: PHT = 81; SV = 85 80 participants (48%) with focal epilepsy, 71 (44%) men Mean age (range): 78 (61‐95 years). Range of follow‐up: 1‐20 months | |
| Interventions | Monotherapy with PHT or SV Starting doses: PHT: 200 mg/day, SV: 400 mg/day Median daily dose achieved: PHT 247 mg (range 175‐275); SV: 688 mg (range 400‐1000) | |
| Outcomes | Psychological tests (cognitive function, anxiety and depression) Adverse event frequency Seizure control | |
| Notes | Trial paper reports on a subset of 38 participants. Full IPD set provided and used for this review includes all 166 participants randomised in the trial. IPD provided for 3/4 outcomes of this review ('time to treatment failure' not available) | |
| Risk of bias | ||
| Bias | Authors' judgement | Support for judgement |
| Random sequence generation (selection bias) | Low risk | Computerised stratified minimisation programme, stratified for age group, gender and seizure type |
| Allocation concealment (selection bias) | Low risk | Pharmacy‐controlled allocation, prescription disclosed to general practitioner and consultant |
| Blinding of participants and personnel (performance bias) | High risk | Participants and personnel unblinded |
| Blinding of outcome assessment (detection bias) | Low risk | The main investigator performing cognitive testing was blinded to allocation |
| Incomplete outcome data (attrition bias) | Low risk | Attrition rates reported. ITT analysis undertaken with all randomised participants from IPD (see footnote 2) |
| Selective reporting (reporting bias) | Low risk | All outcome measures reported in published report or provided in IPD (see footnote 2) |
| Other bias | Low risk | No other bias detected |
| Methods | 36‐month randomised comparative trial Parallel study design Study conducted in Poland Method of generation of random list and allocation concealment not stated | |
| Participants | Adults with newly diagnosed epilepsy Number randomised: PHT = 30; SV = 30 100% focal epilepsy, age range: 18 to 40 years Percentage men and range of follow‐up not mentioned | |
| Interventions | Monotherapy with PHT or SV Starting doses: PHT: 200 mg/day, SV: 600 mg/day. Dose achieved not stated | |
| Outcomes | Proportion achieving 24‐month remission at 3 years | |
| Notes | Abstract only. Outcomes chosen for this review were not reported. IPD pledged but not received | |
| Risk of bias | ||
| Bias | Authors' judgement | Support for judgement |
| Random sequence generation (selection bias) | Unclear risk | Trial "randomised" but no further information provided |
| Allocation concealment (selection bias) | Unclear risk | No information provided |
| Blinding of participants and personnel (performance bias) | Unclear risk | No information provided |
| Blinding of outcome assessment (detection bias) | Unclear risk | No information provided |
| Incomplete outcome data (attrition bias) | Unclear risk | "Exclusion rates" (interpreted as treatment withdrawal rates) reported for all treatment groups, no further information provided |
| Selective reporting (reporting bias) | Unclear risk | No protocol available and trial reported only in abstract form; outcomes for this review not available |
| Other bias | Unclear risk | Insufficient detail provided in abstract to allow judgement |
| Methods | Parallel study design, outpatient setting Study conducted at two centres in the UK Random list generated using random permuted blocks Allocation concealed using sealed opaque envelopes Unblinded | |
| Participants | Children with newly diagnosed epilepsy (2 or more untreated focal or generalised tonic‐clonic seizures in the 12 months preceding the trial) Number randomised: PHT = 54; SV = 49 55 children (53%) with focal epilepsy. 52 (50%) boys Mean age (range): 10 (3‐16) years. Range of follow‐up (months): 3‐88 | |
| Interventions | Monotherapy with PHT or SV Median daily dose achieved: PHT: 175 mg/day, SV: 600 mg/day | |
| Outcomes | Time to first seizure recurrence after start of therapy | |
| Notes | IPD provided for all outcomes of this review | |
| Risk of bias | ||
| Bias | Authors' judgement | Support for judgement |
| Random sequence generation (selection bias) | Low risk | Randomisation list generated using permuted blocks of size 8 or 16 with stratification for centre, seizure type and presence of neurological signs |
| Allocation concealment (selection bias) | Low risk | Allocation concealed via 4 batches of sealed opaque envelopes |
| Blinding of participants and personnel (performance bias) | High risk | Unblinded, authors state masking of treatment would not be “practicable or ethical” and would “undermine compliance” |
| Blinding of outcome assessment (detection bias) | High risk | Unblinded, authors state masking of treatment would not be “practicable or ethical” and would “undermine compliance” |
| Incomplete outcome data (attrition bias) | Low risk | Attrition rates reported, all randomised participants analysed from IPD provided (see footnote 2) |
| Selective reporting (reporting bias) | Low risk | All outcomes reported or calculated with IPD provided (see footnote 2) |
| Other bias | Low risk | No other bias detected |
| Methods | Parallel study design, outpatient setting Study conducted in the UK Patients randomly allocated using quota allocation allowing for gender, age, seizure type and current treatment Outcome assessors were single‐blinded for cognitive testing | |
| Participants | Children with at least 3 newly diagnosed generalised or focal seizures within a period of 6 months Number randomised: PHT = 20; SV = 21 No information on epilepsy type, gender or range of follow‐up Age range: 5‐14 years. Trial duration: 12 months | |
| Interventions | Monotherapy with PHT or SV Mean dose achieved: PHT: 6.1 mg/day, SV: 25.3 mg/day | |
| Outcomes | Cognitive assessments | |
| Notes | Outcomes chosen for this review were not reported. IPD not available, but could be constructed from the publication for the outcome 'time on allocated drug' (without stratification by seizure type) | |
| Risk of bias | ||
| Bias | Authors' judgement | Support for judgement |
| Random sequence generation (selection bias) | High risk | Quota allocation by gender, age, seizure type and current treatment is an inadequate randomisation method |
| Allocation concealment (selection bias) | Unclear risk | No information provided |
| Blinding of participants and personnel (performance bias) | High risk | Personnel and participants (and parents) unblinded |
| Blinding of outcome assessment (detection bias) | Low risk | Outcome assessors single‐blinded for cognitive testing |
| Incomplete outcome data (attrition bias) | Low risk | Attrition rates reported, results reported and analysed for all participants randomised and all who completed various stages of follow‐up |
| Selective reporting (reporting bias) | Unclear risk | Cognitive outcomes described in methods section well reported in results section. Adverse events reported, no seizure outcomes reported and outcomes chosen for this review not reported. No protocol available so unclear if seizure outcomes were planned a priori |
| Other bias | Low risk | No other bias detected |
| Methods | Parallel study design, outpatient setting Study conducted at two centres in the UK Random list generated using random permuted blocks Allocation concealed using sealed opaque envelopes Unblinded | |
| Participants | Adults with newly diagnosed epilepsy (2 or more untreated focal or generalised tonic‐clonic seizures in the 12 months preceding the trial) Number randomised: PHT = 63; SV = 61 53 participants (43%) with focal epilepsy. 62 (48%) men Mean age (range): 33 (14‐72) years Range of follow‐up (months): 1‐91 | |
| Interventions | Monotherapy with PHT or SV Median daily dose achieved: PHT: 300 mg/day, SV: 800 mg/day | |
| Outcomes | Time to first seizure recurrence after start of therapy | |
| Notes | IPD provided for all outcomes of this review | |
| Risk of bias | ||
| Bias | Authors' judgement | Support for judgement |
| Random sequence generation (selection bias) | Low risk | Randomisation list generated using permuted blocks of size 8 or 16 with stratification for centre, seizure type and presence of neurological signs |
| Allocation concealment (selection bias) | Low risk | Allocation concealed via 4 batches of concealed opaque envelopes |
| Blinding of participants and personnel (performance bias) | High risk | Unblinded, authors state masking of treatment would not be “practical” and would have “introduced bias due to a very large drop‐out rate” |
| Blinding of outcome assessment (detection bias) | High risk | Unblinded, authors state masking of treatment would not be “practical” and would have “introduced bias due to a very large drop‐out rate” |
| Incomplete outcome data (attrition bias) | Low risk | Attrition rates reported, all randomised participants analyses from IPD provided (see footnote 2) |
| Selective reporting (reporting bias) | Low risk | All outcomes reported or calculated with IPD provided (see footnote 2) |
| Other bias | Low risk | No other bias detected |
| Methods | Parallel trial Study conducted at 16 centres in the USA Participants assigned via randomisation tables within each centre in a 2:1 ratio (SV:PHT) Method of allocation concealment not stated Unblinded | |
| Participants | Participants with at least 2 newly diagnosed and previously untreated primary generalised tonic‐clonic seizures within 14 days of starting the trial Number randomised: PHT = 50; SV = 86 0% participants with focal epilepsy, 73 (54%) men Mean age (range): 21 (3‐64 years). Participants followed up for up to 6 months | |
| Interventions | Monotherapy with PHT or SV Starting doses PHT: 3‐5 mg/kg/day, SV: 10‐15 mg/kg/day, doses gradually increased Doses achieved not stated | |
| Outcomes | Time to first generalised tonic‐clonic seizure 6‐month seizure recurrence rates Adverse events | |
| Notes | IPD provided for 3/4 outcomes of this review (maximum follow‐up 6 months, therefore trial cannot contribute to outcome 'time to achieve 12‐month remission') | |
| Risk of bias | ||
| Bias | Authors' judgement | Support for judgement |
| Random sequence generation (selection bias) | Low risk | Participants randomised on a 2:1 ratio SV:PHT using randomisation tables in each centre (information provided by trial author) |
| Allocation concealment (selection bias) | Unclear risk | No information provided |
| Blinding of participants and personnel (performance bias) | High risk | Open‐label trial; authors state that differences in adverse events of PHT and SV would "quickly unblind" the trial anyway |
| Blinding of outcome assessment (detection bias) | High risk | Open‐label trial; authors state that differences in adverse events of PHT and SV would "quickly unblind" the trial anyway |
| Incomplete outcome data (attrition bias) | Low risk | Attrition rates reported, all randomised participants analysed from IPD provided (see footnote 2) |
| Selective reporting (reporting bias) | Low risk | All outcomes reported or calculated with IPD provided (see footnote 2) |
| Other bias | Low risk | No other bias detected |
| Methods | Parallel study design, outpatient setting Study conducted in Meerut, India No information provided on method of generation of random list, allocation concealment or blinding | |
| Participants | Participants with at least 2 focal or generalised tonic‐clonic seizures per month Unclear if participants were newly diagnosed Number randomised: PHT = 45; SV = 49 27 participants (29%) focal epilepsy, 70 (74%) men Age range: PHT: 12‐42 years; SV: 8‐52 years Participants were evaluated after 4, 12 and 24 weeks of treatment No information on range of follow‐up | |
| Interventions | Monotherapy with PHT or SV Average daily dose achieved: PHT: 5.6 mg/kg/day, SV: 18.8 mg/kg/day | |
| Outcomes | Reduction in frequency of seizures: Seizure control | |
| Notes | Outcomes chosen for this review were not reported. IPD not available | |
| Risk of bias | ||
| Bias | Authors' judgement | Support for judgement |
| Random sequence generation (selection bias) | Unclear risk | Participants "randomly allocated irrespective of seizure type," no further information provided |
| Allocation concealment (selection bias) | Unclear risk | No information provided |
| Blinding of participants and personnel (performance bias) | Unclear risk | No information provided |
| Blinding of outcome assessment (detection bias) | Unclear risk | No information provided |
| Incomplete outcome data (attrition bias) | Unclear risk | Frequency of seizures reported for all randomised participants, no information provided on treatment withdrawal rates/attrition rates etc. |
| Selective reporting (reporting bias) | Low risk | Frequency of seizures during treatment well reported, most common adverse events reported No protocol available to compare with a priori analysis plan, outcomes for this review not reported |
| Other bias | Low risk | No other bias detected |
| Methods | Parallel study design, outpatient setting Study conducted in two centres (Glasgow, Scotland and Wellington, New Zealand) Participants allocated using telephone randomisation within the two centres (information provided by trial author) No information provided on method of allocation concealment or blinding | |
| Participants | 21 (64%) participants previously untreated, 12 (36%) participants continued to have seizures on previous drug therapies Original treatments gradually withdrawn before PHT or SV treatment introduced Number randomised: PHT = 15; SV = 18 19 participants (58%) with focal epilepsy, 12 (36%) men Mean age (range): 23 (7‐55 years). Mean follow‐up (range): 30 (9‐48 months) | |
| Interventions | Monotherapy with PHT or SV Starting doses: PHT: < 12 years 150 mg/day, older participants: 300 mg/day SV: < 12 years 300‐400 mg/day, older participants: 800‐1200 mg/day. Doses achieved not stated | |
| Outcomes | Seizures during treatment | |
| Notes | Outcomes chosen for this review were not reported IPD not available but could be constructed from the publication for the outcome 'time to treatment failure' | |
| Risk of bias | ||
| Bias | Authors' judgement | Support for judgement |
| Random sequence generation (selection bias) | Low risk | Participants "randomly divided", using telephone randomisation (information provided by trial author) |
| Allocation concealment (selection bias) | Unclear risk | No information provided |
| Blinding of participants and personnel (performance bias) | Unclear risk | No information provided |
| Blinding of outcome assessment (detection bias) | Unclear risk | No information provided |
| Incomplete outcome data (attrition bias) | Low risk | Results reported for all randomised participants, time on treatment reported for all randomised participants. No losses to follow‐up reported |
| Selective reporting (reporting bias) | Low risk | No protocol available, outcomes chosen for this review not reported. Seizure outcomes and adverse events well reported |
| Other bias | Low risk | No other bias detected |
| Methods | Parallel study design, outpatient setting Study conducted in Madras (Chennai), India Random list generated using computer‐generated random numbers Method of concealment not mentioned Double‐blind achieved by providing additional placebo tablets | |
| Participants | Children with more than 1 previously untreated generalised tonic‐clonic (afebrile) seizure Number randomised: PHT = 52; SV = 48 0% focal epilepsy. 52 (52%) men. Age range: 4‐12 years Range of follow‐up (months): 22‐36 | |
| Interventions | Monotherapy with PHT or SV Starting doses: PHT: 5‐8 mg/kg/day, SV: 15‐50 mg/kg/day Dose achieved not stated | |
| Outcomes | Proportion with recurrence of seizures | |
| Notes | Outcomes chosen for this review were not reported. IPD not available | |
| Risk of bias | ||
| Bias | Authors' judgement | Support for judgement |
| Random sequence generation (selection bias) | Low risk | Participants randomised via a computer‐generated list of random numbers |
| Allocation concealment (selection bias) | Unclear risk | No information provided |
| Blinding of participants and personnel (performance bias) | Unclear risk | Double–blinded using additional placebo tablets; unclear who was blinded |
| Blinding of outcome assessment (detection bias) | Unclear risk | Double–blinded using additional placebo tablets; unclear who was blinded |
| Incomplete outcome data (attrition bias) | Low risk | Attrition rates reported; all randomised participants analysed |
| Selective reporting (reporting bias) | Low risk | No protocol available; outcomes chosen for this review not reported |
| Other bias | Low risk | No other bias detected |
| Methods | Parallel study design, outpatient setting Study conducted in the UK Participants allocated to treatment stratified by age group, gender and seizure type No information provided on method of generation of random list, allocation concealment or blinding | |
| Participants | Participants with 2 or more focal or generalised tonic‐clonic seizure in the past 3 years Participants were previously untreated but started on antiepileptic drug treatment within 3 months of their most recent seizure Number randomised: PHT = 70; SV = 70 63 participants (45%) with focal onset seizures, 73 (52%) men Mean age (range): 35 (14‐70 years). Range of follow‐up: 24‐48 months | |
| Interventions | Monotherapy with PHT or SV Starting doses: PHT 300 mg/day, SV 600 mg/day. Dose achieved not stated | |
| Outcomes | Time to 2‐year remission Time to first seizure Adverse events | |
| Notes | IPD provided for all outcomes included in this review | |
| Risk of bias | ||
| Bias | Authors' judgement | Support for judgement |
| Random sequence generation (selection bias) | Unclear risk | Participants randomised with stratification for age group, gender and seizure type. Method of randomisation not stated |
| Allocation concealment (selection bias) | Unclear risk | No information provided |
| Blinding of participants and personnel (performance bias) | Unclear risk | No information provided |
| Blinding of outcome assessment (detection bias) | Unclear risk | No information provided |
| Incomplete outcome data (attrition bias) | Low risk | Attrition rates reported, ITT approach, all randomised participants analysed from IPD provided (see footnote 2) |
| Selective reporting (reporting bias) | Low risk | All outcomes reported or calculated with IPD provided (see footnote 2) |
| Other bias | Low risk | No other bias detected |
1 Abbreviations:
IPD: individual participant data; ITT: intention‐to‐treat; PHT: phenytoin; SV: sodium valproate.
2 For studies which provided IPD, attrition and reporting bias are reduced as attrition rates and unpublished outcome data are requested (Craig 1994; De Silva 1996; Heller 1995; Ramsay 1992; Turnbull 1985).
3 See Figure 2 and Figure 3 for 'Risk of bias' summary and graph.
Characteristics of excluded studies [ordered by study ID]
Ir a:
| Study | Reason for exclusion |
| Reports the same trial as Forsythe 1991, but more relevant information given in the Forsythe publication | |
| Abstract only. Preliminary results of the trial reported in Callaghan 1985 | |
| Abstract only. Preliminary results of the trial reported in Callaghan 1985 | |
| Preliminary results of the trial reported in Callaghan 1985 | |
| Abstract only. Preliminary results of the trial reported in Craig 1994 | |
| Reports the same abstract as Czapinski 1997a | |
| Reports the same abstract as Czapinski 1997a | |
| Abstract only. Preliminary results of the trial reported in Callaghan 1985 | |
| Reports the same trial as Callaghan 1985, but more relevant information given in the Callaghan publication | |
| No randomised comparison of valproate and phenytoin (participants randomised to a dose adjustment method rather than to a treatment) | |
| No randomised comparison of valproate and phenytoin (study of lamotrigine versus 'standard' antiepileptic drug treatment) | |
| Not fully randomised: "The treatment was chosen at random unless the individual diagnoses required a specific drug" | |
| No randomised comparison of valproate and phenytoin (post hoc analysis of 5 studies of oxcarbazepine versus another antiepileptic drug) | |
| Reports the same trial as Shakir 1981. There are some differences between the results in the 2 publications. The reason for this could not be established | |
| Abstract only. Reports the same trial as Craig 1994 | |
| Abstract only. Reports the same trial as Craig 1994 | |
| Preliminary results of the trial reported in Turnbull 1985 | |
| Preliminary results of the trial reported in Turnbull 1985 | |
| Not randomised |
Data and analyses
| Outcome or subgroup title | No. of studies | No. of participants | Statistical method | Effect size |
| 1 Time to treatment failure (any reason related to the treatment) Show forest plot | 6 | 569 | Hazard Ratio (Fixed, 95% CI) | 0.94 [0.67, 1.32] |
| Analysis 1.1  Comparison 1 Sodium valproate versus phenytoin, Outcome 1 Time to treatment failure (any reason related to the treatment). | ||||
| 2 Time to treatment failure due to adverse events Show forest plot | 4 | 495 | Hazard Ratio (Fixed, 95% CI) | 0.68 [0.40, 1.17] |
| Analysis 1.2  Comparison 1 Sodium valproate versus phenytoin, Outcome 2 Time to treatment failure due to adverse events. | ||||
| 3 Time to treatment failure due to lack of efficacy Show forest plot | 6 | 569 | Hazard Ratio (Fixed, 95% CI) | 1.23 [0.77, 1.97] |
| Analysis 1.3  Comparison 1 Sodium valproate versus phenytoin, Outcome 3 Time to treatment failure due to lack of efficacy. | ||||
| 4 Time to treatment failure (any reason related to the treatment) ‐ by epilepsy type Show forest plot | 5 | 528 | Hazard Ratio (Fixed, 95% CI) | 0.88 [0.61, 1.27] |
| Analysis 1.4  Comparison 1 Sodium valproate versus phenytoin, Outcome 4 Time to treatment failure (any reason related to the treatment) ‐ by epilepsy type. | ||||
| 4.1 Focal onset seizures | 4 | 187 | Hazard Ratio (Fixed, 95% CI) | 0.83 [0.50, 1.38] |
| 4.2 Generalised onset seizures (tonic‐clonic only) | 5 | 341 | Hazard Ratio (Fixed, 95% CI) | 0.94 [0.55, 1.61] |
| 5 Time to treatment failure due to adverse events ‐ by epilepsy type Show forest plot | 4 | 418 | Hazard Ratio (Fixed, 95% CI) | 0.77 [0.44, 1.37] |
| Analysis 1.5  Comparison 1 Sodium valproate versus phenytoin, Outcome 5 Time to treatment failure due to adverse events ‐ by epilepsy type. | ||||
| 5.1 Focal onset seizures | 3 | 168 | Hazard Ratio (Fixed, 95% CI) | 0.75 [0.35, 1.60] |
| 5.2 Generalised onset seizures (tonic‐clonic only) | 3 | 250 | Hazard Ratio (Fixed, 95% CI) | 0.81 [0.34, 1.90] |
| 6 Time to treatment failure due to lack of efficacy ‐ by epilepsy type Show forest plot | 5 | 451 | Hazard Ratio (Fixed, 95% CI) | 1.16 [0.71, 1.89] |
| Analysis 1.6  Comparison 1 Sodium valproate versus phenytoin, Outcome 6 Time to treatment failure due to lack of efficacy ‐ by epilepsy type. | ||||
| 6.1 Focal onset seizures | 4 | 187 | Hazard Ratio (Fixed, 95% CI) | 1.01 [0.55, 1.85] |
| 6.2 Generalised onset seizures (tonic‐clonic only) | 4 | 264 | Hazard Ratio (Fixed, 95% CI) | 1.51 [0.66, 3.45] |
| 7 Time to first seizure Show forest plot | 5 | 639 | Hazard Ratio (Fixed, 95% CI) | 1.04 [0.85, 1.28] |
| Analysis 1.7  Comparison 1 Sodium valproate versus phenytoin, Outcome 7 Time to first seizure. | ||||
| 8 Time to first seizure ‐ by epilepsy type Show forest plot | 5 | 639 | Hazard Ratio (Fixed, 95% CI) | 1.08 [0.88, 1.33] |
| Analysis 1.8  Comparison 1 Sodium valproate versus phenytoin, Outcome 8 Time to first seizure ‐ by epilepsy type. | ||||
| 8.1 Focal onset seizures | 4 | 244 | Hazard Ratio (Fixed, 95% CI) | 1.20 [0.90, 1.60] |
| 8.2 Generalised onset seizures (tonic‐clonic only) | 5 | 395 | Hazard Ratio (Fixed, 95% CI) | 0.97 [0.72, 1.30] |
| 9 Time to first seizure ‐ epilepsy type reclassified to focal for generalised and age of onset > 30 years Show forest plot | 5 | 639 | Hazard Ratio (Fixed, 95% CI) | 1.05 [0.86, 1.29] |
| Analysis 1.9  Comparison 1 Sodium valproate versus phenytoin, Outcome 9 Time to first seizure ‐ epilepsy type reclassified to focal for generalised and age of onset > 30 years. | ||||
| 9.1 Focal onset seizures | 5 | 416 | Hazard Ratio (Fixed, 95% CI) | 1.23 [0.96, 1.57] |
| 9.2 Generalised onset seizures (tonic‐clonic only) | 4 | 223 | Hazard Ratio (Fixed, 95% CI) | 0.72 [0.50, 1.05] |
| 10 Time to first seizure ‐ epilepsy type reclassified to uncertain for generalised and age of onset > 30 years Show forest plot | 5 | 649 | Hazard Ratio (Fixed, 95% CI) | 1.06 [0.86, 1.30] |
| Analysis 1.10  Comparison 1 Sodium valproate versus phenytoin, Outcome 10 Time to first seizure ‐ epilepsy type reclassified to uncertain for generalised and age of onset > 30 years. | ||||
| 10.1 Focal onset seizures | 4 | 255 | Hazard Ratio (Fixed, 95% CI) | 1.20 [0.90, 1.60] |
| 10.2 Generalised onset seizures (tonic‐clonic only) | 4 | 223 | Hazard Ratio (Fixed, 95% CI) | 0.72 [0.50, 1.05] |
| 10.3 Uncertain seizure type | 4 | 171 | Hazard Ratio (Fixed, 95% CI) | 1.35 [0.85, 2.14] |
| 11 Time to achieve 12‐month remission Show forest plot | 4 | 514 | Hazard Ratio (Fixed, 95% CI) | 1.03 [0.82, 1.29] |
| Analysis 1.11  Comparison 1 Sodium valproate versus phenytoin, Outcome 11 Time to achieve 12‐month remission. | ||||
| 12 Time to achieve 12‐month remission ‐ by epilepsy type Show forest plot | 4 | 514 | Hazard Ratio (Fixed, 95% CI) | 1.02 [0.81, 1.28] |
| Analysis 1.12  Comparison 1 Sodium valproate versus phenytoin, Outcome 12 Time to achieve 12‐month remission ‐ by epilepsy type. | ||||
| 12.1 Focal onset seizures | 4 | 244 | Hazard Ratio (Fixed, 95% CI) | 1.11 [0.78, 1.60] |
| 12.2 Generalised onset seizures (tonic‐clonic only) | 4 | 270 | Hazard Ratio (Fixed, 95% CI) | 0.96 [0.71, 1.29] |
| 13 Time to achieve six‐month remission Show forest plot | 5 | 639 | Hazard Ratio (Fixed, 95% CI) | 1.08 [0.89, 1.30] |
| Analysis 1.13  Comparison 1 Sodium valproate versus phenytoin, Outcome 13 Time to achieve six‐month remission. | ||||
| 14 Time to achieve six‐month remission ‐ by epilepsy type Show forest plot | 5 | 639 | Hazard Ratio (Fixed, 95% CI) | 1.05 [0.86, 1.27] |
| Analysis 1.14  Comparison 1 Sodium valproate versus phenytoin, Outcome 14 Time to achieve six‐month remission ‐ by epilepsy type. | ||||
| 14.1 Focal onset seizures | 4 | 244 | Hazard Ratio (Fixed, 95% CI) | 1.00 [0.73, 1.35] |
| 14.2 Generalised onset seizures (tonic‐clonic only) | 5 | 395 | Hazard Ratio (Fixed, 95% CI) | 1.08 [0.84, 1.38] |

Study flow diagram.
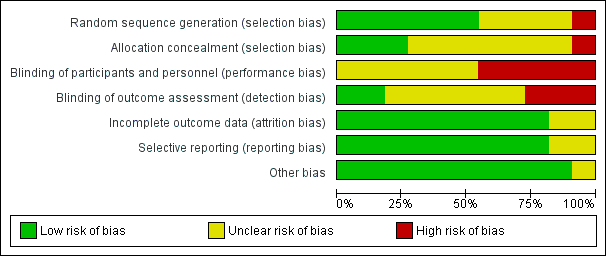
'Risk of bias' graph: review authors' judgements about each risk of bias item presented as percentages across all included studies.

'Risk of bias' summary: review authors' judgements about each risk of bias item for each included study.
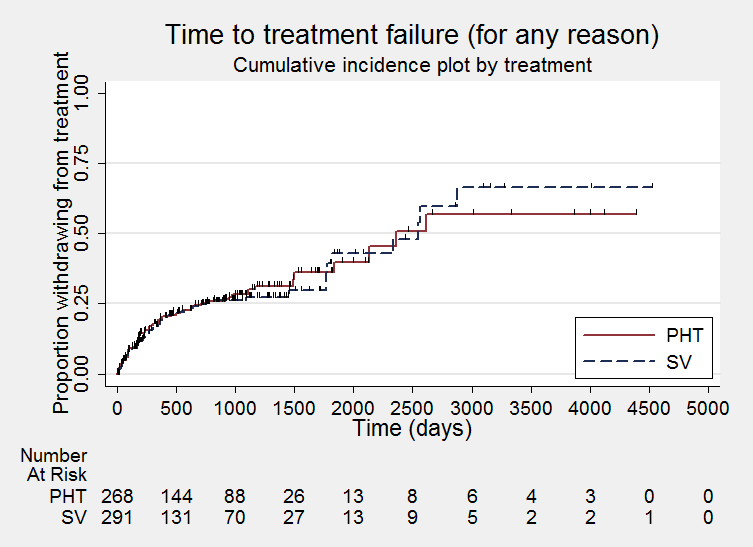
Time to treatment failure ‐ any reason related to the treatment (PHT: phenytoin; SV: sodium valproate)
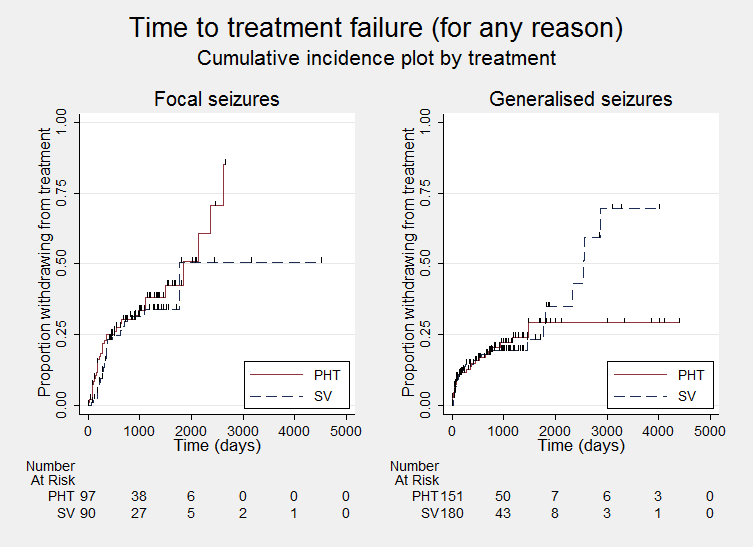
Time to treatment failure ‐ any reason related to the treatment, by epilepsy type (PHT: phenytoin; SV: sodium valproate)
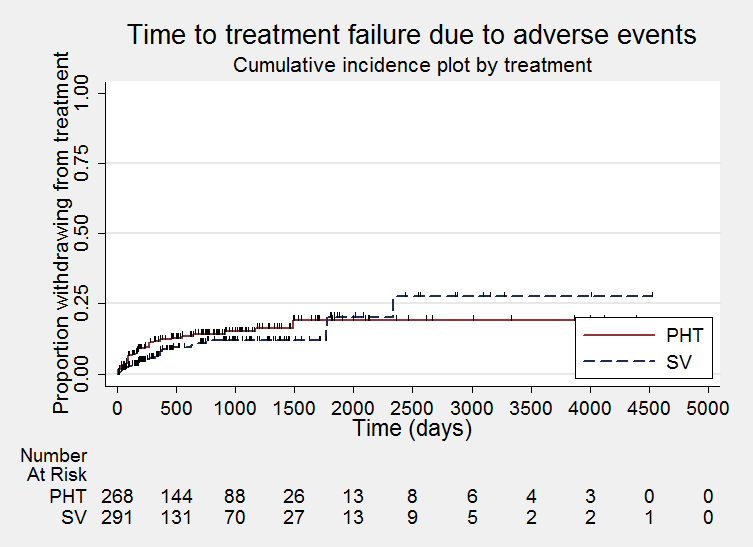
Time to treatment failure due to adverse events (PHT: phenytoin; SV: sodium valproate)

Time to treatment failure due to adverse events, by epilepsy type (PHT: phenytoin; SV: sodium valproate)

Time to treatment failure due to lack of efficacy (PHT: phenytoin; SV: sodium valproate)

Time to treatment failure due to lack of efficacy, by epilepsy type (PHT: phenytoin; SV: sodium valproate)

Time to first seizure (PHT: phenytoin; SV: sodium valproate)

Time to first seizure ‐ by epilepsy type. (PHT: phenytoin; SV: sodium valproate)

Time to achieve 12‐month remission (PHT: phenytoin; SV: sodium valproate)
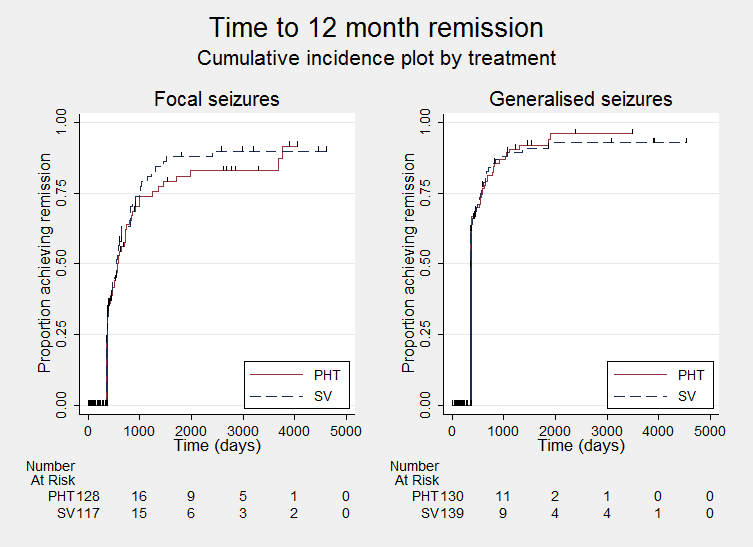
Time to achieve 12‐month remission ‐ by epilepsy type. (PHT: phenytoin; SV: sodium valproate)
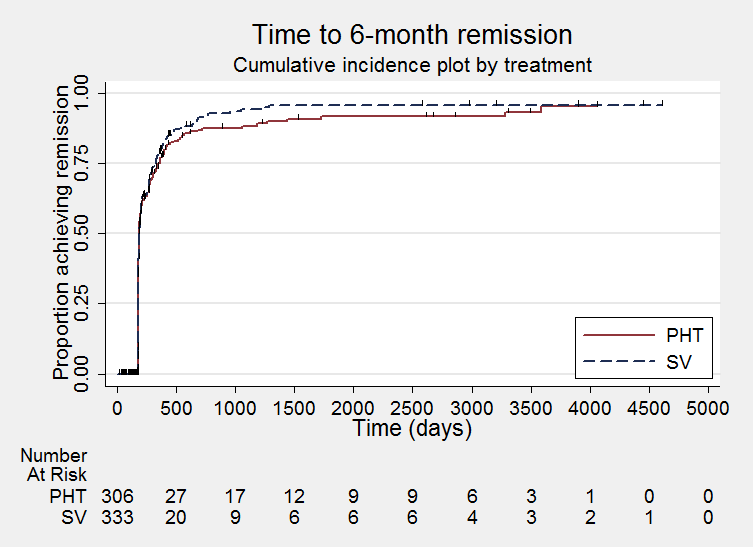
Time to achieve six‐month remission (PHT: phenytoin; SV: sodium valproate)

Time to achieve six‐month remission (PHT: phenytoin; SV: sodium valproate)

Comparison 1 Sodium valproate versus phenytoin, Outcome 1 Time to treatment failure (any reason related to the treatment).
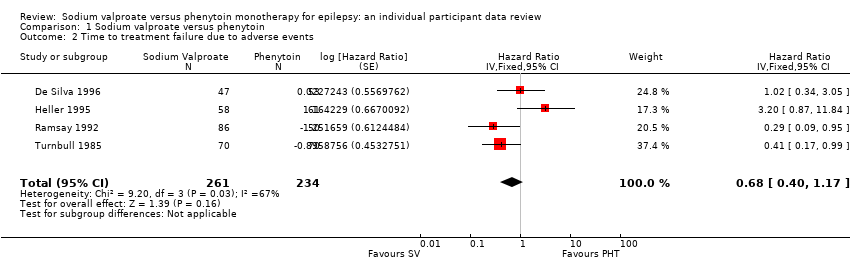
Comparison 1 Sodium valproate versus phenytoin, Outcome 2 Time to treatment failure due to adverse events.

Comparison 1 Sodium valproate versus phenytoin, Outcome 3 Time to treatment failure due to lack of efficacy.

Comparison 1 Sodium valproate versus phenytoin, Outcome 4 Time to treatment failure (any reason related to the treatment) ‐ by epilepsy type.
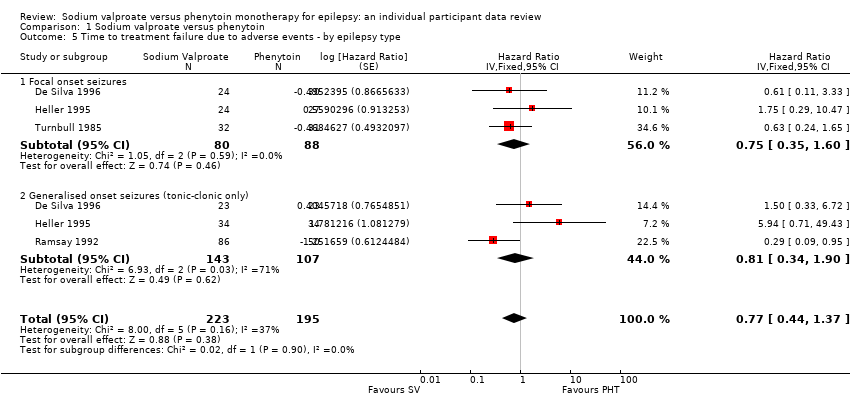
Comparison 1 Sodium valproate versus phenytoin, Outcome 5 Time to treatment failure due to adverse events ‐ by epilepsy type.

Comparison 1 Sodium valproate versus phenytoin, Outcome 6 Time to treatment failure due to lack of efficacy ‐ by epilepsy type.

Comparison 1 Sodium valproate versus phenytoin, Outcome 7 Time to first seizure.

Comparison 1 Sodium valproate versus phenytoin, Outcome 8 Time to first seizure ‐ by epilepsy type.
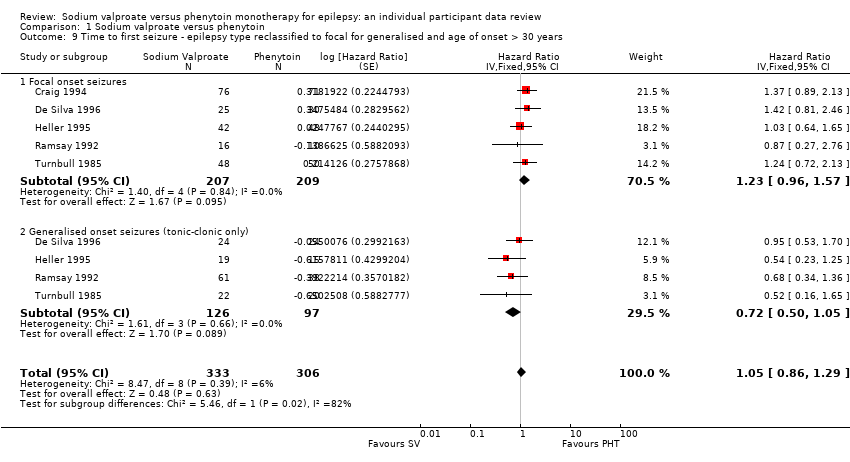
Comparison 1 Sodium valproate versus phenytoin, Outcome 9 Time to first seizure ‐ epilepsy type reclassified to focal for generalised and age of onset > 30 years.
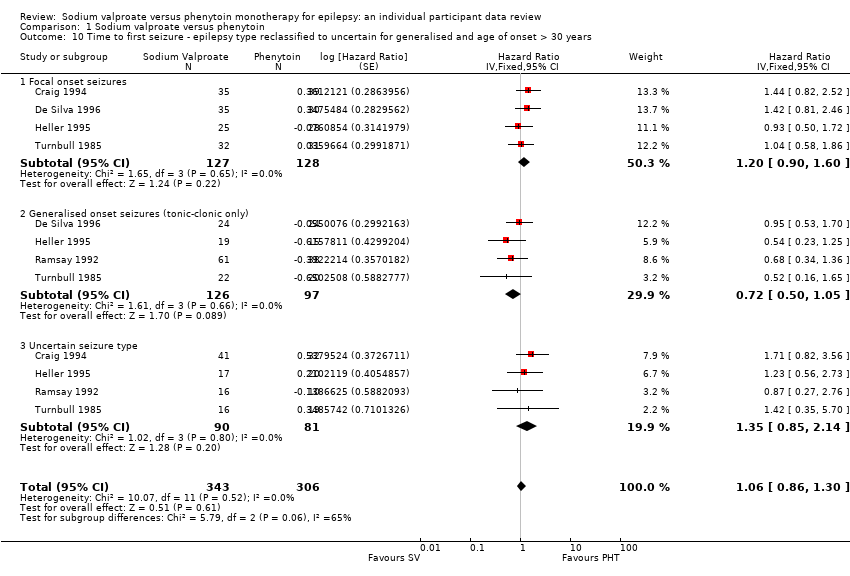
Comparison 1 Sodium valproate versus phenytoin, Outcome 10 Time to first seizure ‐ epilepsy type reclassified to uncertain for generalised and age of onset > 30 years.
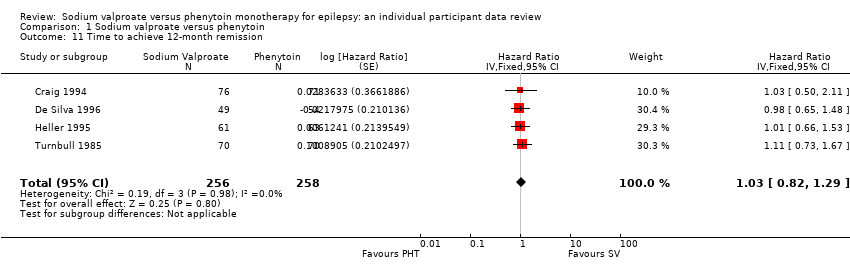
Comparison 1 Sodium valproate versus phenytoin, Outcome 11 Time to achieve 12‐month remission.
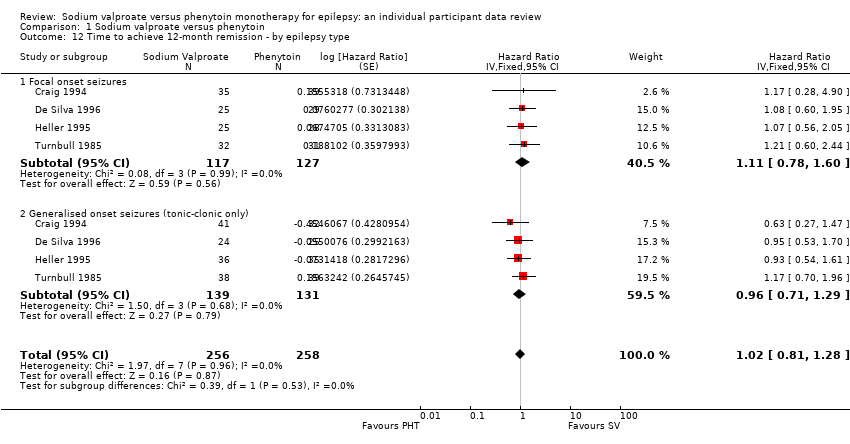
Comparison 1 Sodium valproate versus phenytoin, Outcome 12 Time to achieve 12‐month remission ‐ by epilepsy type.

Comparison 1 Sodium valproate versus phenytoin, Outcome 13 Time to achieve six‐month remission.

Comparison 1 Sodium valproate versus phenytoin, Outcome 14 Time to achieve six‐month remission ‐ by epilepsy type.
| Sodium valproate compared with phenytoin monotherapy for epilepsy | ||||||
| Patient or population: adults and children with newly‐onset focal onset or generalised tonic‐clonic seizures Settings: outpatients Intervention: sodium valproate Comparison: phenytoin | ||||||
| Outcomes | Illustrative comparative risks* (95% CI) | Relative effect | No. of Participants | Quality of the evidence | Comments | |
| Assumed risk | Corresponding risk | |||||
| Phenytoin | Sodium valproate | |||||
| Time to treatment failure (any reason related to treatment) All participants Range of follow‐up: 0 to 4256 days | The median time to treatment failure was 2361 days in the phenytoin group | The median time to treatment failure was 2545 days (184 days longer) in the sodium valproate group | HR 0.88 (0.61 to 1.27)a | 528 | ⊕⊕⊕⊝ | HR < 1 indicates a clinical advantage for valproate There was also no statistically significant difference between drugs in treatment failure due to adverse events: HR 0.77 (95% CI 0.44 to 1.37, P = 0.38) or treatment failure due to lack of efficacy: HR 1.16 (95% CI 0.71 to 1.89, P = 0.55) |
| Time to treatment failure (any reason related to treatment) Subgroup: focal onset seizures Range of follow‐up: 0 to 4256 days | The median time to treatment failure was 1838 days in the phenytoin group | The median time to treatment failure was 1772 days (66 days shorter) in the sodium valproate group | HR 0.83 (0.50 to 1.38) | 187 (4 studies) | ⊕⊕⊕⊝ | HR < 1 indicates a clinical advantage for valproate There was also no statistically significant difference between drugs in treatment failure due to adverse events: HR 0.81 (95% CI 0.34 to 1.90, P = 0.62) or treatment failure due to lack of efficacy: HR 1.01 (95% CI 0.55 to 1.85, P = 0.98) |
| Time to treatment failure (any reason related to treatment) Subgroup: generalised onset seizures (tonic‐clonic only) Range of follow‐up: 0 to 4394 days | The 25th percentile** of time to treatment failure was 1488 days in the phenytoin group | The 25th percentile** of time to treatment failure was 1778 days (290 days longer) in the sodium valproate group | HR 0.94 (0.55 to 1.61) | 341 | ⊕⊕⊕⊝ | HR < 1 indicates a clinical advantage for valproate There was also no statistically significant difference between drugs in treatment failure due to adverse events: HR 0.75 (95% CI 0.35 to 1.60, P = 0.46) or treatment failure due to lack of efficacy: HR 1.51 (95% CI 0.66 to 3.45, P = 0.33) |
| * Illustrative risks in the sodium valproate and phenytoin groups are calculated at the median time to treatment failure (i.e. the time to 50% of participants failing or withdrawing from allocated treatment) within each group across all trials. The relative effect (pooled HR) shows the comparison of 'time to treatment failure' between the treatment groups. ** The 25th percentile of time to treatment failure (i.e. the time to 25% of participants failing or withdrawing from allocated treatment) is presented for the subgroup with generalised seizures as less than 50% of participants failed/withdrew from treatment, therefore the median time could not be calculated. Abbreviations: CI: confidence interval; HR: hazard ratio. | ||||||
| GRADE Working Group grades of evidence | ||||||
| aPooled HR for all participants adjusted for seizure type. | ||||||
| Valproate compared with phenytoin monotherapy for epilepsy | ||||||
| Patient or population: adults and children with newly‐onset focal onset or generalised tonic‐clonic seizures Settings: outpatients Intervention: sodium valproate Comparison: phenytoin | ||||||
| Outcomes | Illustrative comparative risks* (95% CI) | Relative effect | No. of Participants | Quality of the evidence | Comments | |
| Assumed risk | Corresponding risk | |||||
| Phenytoin | Sodium valproate | |||||
| Time to first seizure (post‐randomisation) All participants Range of follow‐up: 0 to 4859 days | The median time to first seizure post‐randomisation was 275 days in the phenytoin group | The median time to first seizure post‐randomisation was 267 days (7 days shorter) in the sodium valproate group | HR 1.08 (0.88 to 1.33)a | 639 (5 studies) | ⊕⊕⊝⊝ | HR < 1 indicates a clinical |
| Time to first seizure (post‐randomisation) Subgroup: focal onset seizures Range of follow‐up: 0 to 4859 days | The median time to first seizure post‐randomisation was 75 days in the phenytoin group | The median time to first seizure post‐randomisation was 41 days (34 days shorter) in the sodium valproate group | HR 1.20 (0.90 to 1.60) | 244 (4 studies) | ⊕⊕⊝⊝ | HR < 1 indicates a clinical |
| Time to first seizure (post‐randomisation) Subgroup: generalised onset seizures (tonic‐clonic only) Range of follow‐up: 1 to 4520 days | The median time to first seizure post‐randomisation was 572 days in the phenytoin group | The median time to first seizure post‐randomisation was 549 days (23 days shorter) in the sodium valproate group | HR 0.97 (0.72 to 1.30) | 395 (5 studies) | ⊕⊕⊝⊝ | HR < 1 indicates a clinical |
| Time to achieve 12‐month remission (seizure‐free period) All participants Range of follow‐up: 5 to 4614 days | The median time to achieve 12‐month remission was 380 days in the phenytoin group | The median time to achieve 12‐month remission was 386 days (6 days longer) in the sodium valproate group | HR 1.02 (0.81 to 1.28) | 514 (4 studies) | ⊕⊕⊕⊝ | HR < 1 indicates a clinical |
| Time to achieve 12‐month remission (seizure‐free period) Subgroup: focal onset seizures Range of follow‐up: 5 to 4614 days | The median time to achieve 12‐month remission was 575 days in the phenytoin group | The median time to achieve 12‐month remission was 549 days (26 days shorter) in the sodium valproate group | HR 1.11 (0.78 to 1.60) | 244 (4 studies) | ⊕⊕⊕⊝ | HR < 1 indicates a clinical |
| Time to achieve 12‐month remission (seizure‐free period) Subgroup: generalised onset seizures (tonic‐clonic only) Range of follow‐up: 7 to 4544 days | The median time to achieve 12‐month remission was 365 days in the phenytoin group | The median time to achieve 12‐month remission was 366 days (1 day longer) in the sodium valproate group | HR 0.96 (0.71 to 1.29) | 270 (4 studies) | ⊕⊕⊕⊝ | HR < 1 indicates a clinical |
| * Illustrative risks in the phenytoin and sodium valproate groups are calculated at the median time to first seizure or time to 12‐month remission (i.e. the time to 50% of participants experiencing a first seizure or 12 months of remission) within each group across all trials. The relative effect (pooled HR) shows the comparison of 'time to first seizure' or 'time to 12‐month remission' between the treatment groups. Abbreviations: CI: confidence interval; HR: hazard ratio. | ||||||
| GRADE Working Group grades of evidence | ||||||
| aPooled HR for all participants adjusted for seizure type. | ||||||
| Focal seizures: n (%) | Male gender: n (%) | Age at entry (years): Mean (SD), range | Aged > 30 years and generalised seizures: n (%) | Epilepsy duration (years): mean (SD), range | Number of seizures in prior 6 months: median (range) | |||||||||||||
| SV | PHT | Missing | SV | PHT | Missing | SV | PHT | Missing | SV | PHT | Missing | SV | PHT | Missing | SV | PHT | Missing | |
| 37 (44%) | 43 (53%) | 0 | 38 (46%) | 33 (41%) | 3 | 77.6 (7.2), 61 to 95 | 78.7 (7.0), 64 to 95 | 3 | 46 | 38 | 0 | NA | NA | 166 | 2 (0 to 60) | 3 (1 to 99) | 3 | |
| 25 (51%) | 30 (56%) | 0 | 18 (37%) | 34 (63%) | 0 | 11.3 (3.3), 2 to 15 | 9.5 (3.4), 3 to 15 | 0 | 0 | 0 | 0 | 1.2 (1.5), 0 to 4.9 | 1.0 (2.1), 0 to 13.7 | 0 | 3 (1 to 900) | 3 (1 to 404) | 0 | |
| 25 (41%) | 28 (44%) | 0 | 28 (46%) | 34 (54%) | 0 | 32.0 (15.6), 14 to 67 | 33.5 (14.3), 14 to 72 | 2 | 17 | 20 | 0 | 2.6 (3.9), 0 to 17.9 | 3.8 (5.4), 0 to 24.3 | 2 | 2 (1 to 181) | 2 (1 to 575) | 2 | |
| 0 (0%) | 0 (0%) | 0 | 48 (56%) | 25 (50%) | 0 | 21.1 (14.4), 3 to 64 | 20.6 (14.0), 4 to 63 | 0 | 16 | 10 | 0 | 0.1 (0.3), 0 to 1.9 | 0.2 (0.5), 0 to 3.0 | 15 | NA | NA | 136 | |
| 32 (46%) | 31 (44%) | 0 | 34 (49%) | 39 (56%) | 0 | 35.1 (16.5), 14 to 69 | 35.3 (15.9), 16 to 70 | 0 | 16 | 19 | 0 | 2.2 (2.9), 0.1 to 11.0 | 2.1 (4.2), 0.1 to 30.0 | 0 | 2 (0 to 60) | 2 (1 to 60) | 0 | |
| SV= sodium valproate; PHT= Phenytoin; n = number of participants; NA = not available; SD = standard deviation. Proportions (%) are calculated based on non‐missing data. | ||||||||||||||||||
| EEG normal: n (%) | CT scan normal: n (%) | Neurological exam normal: n (%) | |||||||
| SV | PHT | Missing | SV | PHT | Missing | SV | PHT | Missing | |
| 20 (30%) | 8 (16%) | 64 | NA | NA | 166 | NA | NA | 166 | |
| NA | NA | 103 | NA | NA | 103 | 43 (88%) | 48 (89%) | 0 | |
| NA | NA | 124 | NA | NA | 124 | 56 (95%) | 54 (86%) | 2 | |
| NA | NA | 136 | NA | NA | 136 | NA | NA | 136 | |
| 30 (46%) | 38 (54%) | 0 | 6 (50%) | 11 (73%) | 43 | NA | NA | 70 | |
| EEG = electroencephalographic; SV= sodium valproate; PHT= Phenytoin; n = number of participants; NA = not available. Proportions (%) are calculated based on non‐missing data. | |||||||||
| Trial | Outcomes reported | Summary of results |
|
|
| |
|
| ||
|
|
No significant differences between treatment groups for any other cognitive tests
| |
|
|
| |
|
|
| |
|
|
| |
| n = number of participants; PHT: phenytoin; SV: sodium valproate. | ||
| Trial | Number randomised | Time to treatment failure (for any reason related to treatment) | Time to achieve 12‐month remission | Time to achieve 6‐month remission | Time to first seizure | ||||||||||
| PHT | SV | Total | PHT | SV | Total | PHT | SV | Total | PHT | SV | Total | PHT | SV | Total | |
| 81 | 85 | 166 | 0 | 0 | 0 | 71 | 76 | 147 | 71 | 76 | 147 | 71 | 76 | 147 | |
| 54 | 49 | 103 | 53 | 47 | 100 | 54 | 49 | 103 | 54 | 49 | 103 | 54 | 49 | 103 | |
| 20 | 21 | 41 | 20 | 21 | 41 | 0 | 0 | 0 | 0 | 0 | 0 | 0 | 0 | 0 | |
| 63 | 61 | 124 | 61 | 58 | 119 | 63 | 61 | 124 | 63 | 61 | 124 | 63 | 61 | 124 | |
| 50 | 86 | 136 | 50 | 86 | 136 | 0 | 0 | 0 | 48 | 77 | 125 | 48 | 77 | 125 | |
| 70 | 70 | 140 | 70 | 70 | 140 | 70 | 70 | 140 | 70 | 70 | 140 | 70 | 70 | 140 | |
| 15 | 18 | 33 | 15 | 18 | 33 | 0 | 0 | 0 | 0 | 0 | 0 | 0 | 0 | 0 | |
| Total | 353 | 390 | 743 | 269 | 300 | 569 | 258 | 256 | 514 | 306 | 333 | 639 | 306 | 333 | 639 |
| aTreatment failure information not provided for Craig 1994, so cannot contribute to 'time to treatment failure'. PHT: phenytoin; SV: sodium valproate. | |||||||||||||||
| Reason for early termination (and classification in time‐to‐event analysis) | Heller 1995b, c | Totala | |||||||||||||
| SV | PHT | SV | PHT | SV | PHT | SV | PHT | SV | PHT | SV | PHT | SV | PHT | All | |
| Adverse events (event) | 2 | 2 | 4 | 1 | 4 | 8 | 6 | 14 | 0 | 1 | 0 | 0 | 16 | 26 | 42 |
| Lack of efficacy (event) | 11 | 10 | 9 | 8 | 1 | 1 | 2 | 0 | 2 | 1 | 3 | 6 | 28 | 26 | 54 |
| Both adverse events and lack of efficacy (event) | 4 | 5 | 6 | 2 | 0 | 0 | 1 | 2 | 0 | 0 | 0 | 0 | 11 | 9 | 20 |
| Non‐compliance/protocol violation (event) | 0 | 0 | 0 | 0 | 7 | 2 | 2 | 2 | 5 | 4 | 0 | 0 | 14 | 8 | 22 |
| Illness or death (not treatment‐related, censored)e | 0 | 0 | 0 | 0 | 1 | 1 | 3 | 3 | 0 | 0 | 0 | 0 | 4 | 4 | 8 |
| Participant went into remission (censored) | 16 | 24 | 13 | 14 | 0 | 0 | 0 | 0 | 0 | 0 | 0 | 0 | 29 | 38 | 67 |
| Lost to follow‐up (censored) | 0 | 0 | 0 | 0 | 10 | 3 | 7 | 7 | 0 | 0 | 0 | 0 | 17 | 10 | 27 |
| Other (censored)f | 0 | 0 | 0 | 0 | 3 | 0 | 0 | 0 | 0 | 0 | 0 | 0 | 3 | 0 | 3 |
| Completed the study (censored) | 14 | 12 | 26 | 38 | 60 | 35 | 49 | 42 | 14 | 14 | 15 | 9 | 178 | 150 | 328 |
| Total | 47 | 53 | 58 | 63 | 86 | 50 | 70 | 70 | 21 | 20 | 18 | 15 | 300 | 271 | 571 |
| PHT: phenytoin; SV: sodium valproate | |||||||||||||||
| Outcome | Original analysis | Generalised onset and age at onset > 30 years classified as focal onset | Generalised onset and age at onset > 30 years classified as uncertain seizure type | |||
| Pooled HR (95% CI) fixed‐effects | Test of subgroup differences | Pooled HR (95% CI) fixed‐effects | Test of subgroup differences | Pooled HR (95% CI) fixed‐effects | Test of subgroup differences | |
| Time to treatment failure (for any reason related to treatment)a | F: 0.83 (0.50 to 1.38) G: 0.94 (0.55 to 1.61) O: 0.88 (0.61 to 1.27) | Chi² = 0.10, df = 1 (P = 0.75), I² = 0% | F: 0.95 (0.59 to 1.52) G: 0.77 (0.42 to 1.41) O: 0.88 (0.60 to 1.27) | Chi² = 0.29, df = 1 (P = 0.59), I² = 0% | F: 0.83 (0.50 to 1.38) G: 0.77 (0.42 to 1.41) U: 6.83 (0.82 to 57.16) O: 0.86 (0.59 to 1.27) | Chi² = 3.80, df = 2 (P = 0.15), I² = 47.3% |
| Time to treatment failure due to adverse eventsb | F: 0.75 (0.35 to 1.60) G: 0.81 (0.34 to 1.90) O: 0.77 (0.44 to 1.37) | Chi² = 0.02, df = 1 (P = 0.90), I² = 0% | F: 0.87 (0.42 to 1.80) G: 0.64 (0.26 to 1.59) O: 0.77 (0.44 to 1.36) | Chi² = 0.26, df = 1 (P = 0.61), I² = 0% | Not calculatedb | Not calculatedb |
| Time to treatment failure due to lack of efficacyb | F: 1.01 (0.55 to 1.85) G: 1.51 (0.66 to 3.45) O: 1.16 (0.71 to 1.89) | Chi² = 0.60, df = 1 (P = 0.44), I² = 0% | F: 1.00 (0.51 to 1.96) G: 1.73 (0.56 to 5.35) O: 1.16 (0.65 to 2.06) | Chi² = 0.66, df = 1 (P = 0.42), I² = 0% | Not calculatedb | Not calculatedb |
| Time to first seizurec | F: 1.20 (0.90 to 1.60) G: 0.97 (0.72 to 1.30) O: 1.08 (0.88 to 1.33) | Chi² = 1.06, df = 1 (P = 0.30), I² = 5.6% | F: 1.23 (0.96 to 1.57) G: 0.72 (0.50 to 1.05) O: 1.05 (0.86 to 1.29) | Chi² = 5.46, df = 1 (P = 0.02), I² = 81.7% | F: 1.20 (0.90 to 1.60) G: 0.72 (0.50 to 1.05) U: 1.35 (0.85 to 2.14) O: 1.06 (0.86 to 1.30) | Chi² = 5.79, df = 2 (P = 0.06), I² = 65.5% |
| Time to 12‐month remissiond | F: 1.11 (0.78 to 1.60) G: 0.96 (0.71 to 1.29) O: 1.02 (0.81 to 1.28) | Chi² = 0.39, df = 1 (P = 0.53), I² = 0% | F: 0.99 (0.75 to 1.32) G: 1.07 (0.72 to 1.59) O: 1.02 (0.81 to 1.28) | Chi² = 0.10, df = 1 (P = 0.75), I² = 0% | F: 1.11 (0.78 to 1.60) G: 1.07 (0.72 to 1.59) U: 0.74 (0.46 to 1.18) O: 0.99 (0.79 to 1.25) | Chi² = 2.07, df = 2 (P = 0.36), I² = 3.3% |
| Time to 6‐month remissione | F: 1.00 (0.73 to 1.35) G: 1.08 (0.84 to 1.38) O: 1.05 (0.86 to 1.27) | Chi² = 0.16, df = 1 (P = 0.69), I² = 0% | F: 1.00 (0.79 to 1.26) G: 1.14 (0.80 to 1.61) O: 1.04 (0.85 to 1.26) | Chi² = 0.38, df = 1 (P = 0.54), I² = 0% | F: 1.00 (0.73 to 1.35) G: 1.14 (0.80 to 1.61) U: 0.90 (0.62 to 1.31) O: 1.01 (0.83 to 1.23) | Chi² = 0.80, df = 2 (P = 0.67), I² = 0% |
| Chi²: Chi² statistic; df: degrees of freedom of Chi² distribution; F: focal epilepsy; G: generalised epilepsy; O: overall (all participants); U: uncertain epilepsy; P: P value (< 0.05 are classified as statistically significant). a100 participants reclassified to focal epilepsy or uncertain epilepsy type for outcome 'time to treatment failure (for any reason related to treatment)'; see Analysis 1.4 for original analysis. | ||||||
| Trial | Adverse event dataa | Summary of reported results | |
| Phenytoin (PHT) | SV (sodium valproate) | ||
| All adverse events developed (by drug) and adverse events leading to discontinuation of treatment | PHT (n = 58): gum hypertrophy (n = 2), rash (n = 2), ataxia (n = 2)
| SV (n = 64): weight gain (n = 4: all discontinued treatment), drowsiness (n = 2), aggressive behaviour (n = 1: discontinued treatment) | |
| Adverse event frequency (spontaneous reports)b Discontinuations due to adverse eventsc | PHT (n = 25): unsteadiness (n = 9), sleepiness (n = 7), drowsiness (n = 2), impaired concentration (n = 2), confusion (n = 1), constipation (n = 1), diarrhoea (n = 1), dysarthria (n = 1), lethargy (n = 1), nystagmus (n = 1), rash (n = 1), tired legs (n = 1) PHT discontinuations (n = 6): rash (n =1), diarrhoea (n = 1), confusion (n = 1), unsteadiness (n = 1), constipation (n = 1), sleepiness (n = 1) | SV (n = 17): unsteadiness (n = 2), sleepiness (n = 3), tremor (n = 5), oedema (n = 3), alopecia (n = 2), depression (n = 2), weight gain (n = 2) SV discontinuations (n = 2): weight gain and depression (n = 1), unsteadiness (n =1) | |
| "Exclusions" due to adverse events or no efficacyd | Proportion "excluded": PHT: 33.3% | Proportion "excluded": SV: 23.3% | |
| "Unacceptable" adverse events leading to drug withdrawale | PHT (n = 54): drowsiness (n = 2), skin rash (n = 1) blood dyscrasia (n = 1), hirsutism (n = 1) | SV (n = 49): behavioural (n = 1), tremor (n = 1) | |
| No adverse event data reported (treatment withdrawal data only reported) | 1 participant (PHT) withdrew from the study due to depression and anorexia | No adverse event data (or treatment withdrawals due to adverse events) reported | |
| “Unacceptable” adverse events leading to drug withdrawale | PHT (n = 63): myalgia (n = 1), irritability (n = 1)
| SV (n = 61): dizziness (n = 2) abnormal liver function test (n = 1) | |
| Most common adverse events (by treatment group)f | PHT (n = 50): dyspepsia (n = 1), nausea (n = 2), dizziness (n = 2), somnolence (n = 5), tremor (n = 2), rash (n = 4)
| SV (n = 86): dyspepsia (n = 7), nausea (n = 10), dizziness (n = 5), somnolence (n = 8), tremor (n = 5), rash (n = 3) | |
| Commonest adverse events (reported as percentages by treatment group)f | PHT (n = 45): gum hyperplasia (17.7%), nystagmus (13.33%), ataxia (2.2%), gastrointestinal disturbances (4.44%), drowsiness (4.44%) | SV (n = 49): gastrointestinal disturbances (12%), drowsiness (6.12%), weight gain (2.04%) | |
| Adverse events (narrative description)b | PHT (n = 15): 1 case of ataxia, 5 cases of acne | SV (n = 18): 2 cases of gastrointestinal symptoms, 2 cases of hair loss, 4 cases of weight gain | |
| Assessment of adverse eventsb | PHT (n = 52): 33 participants reported at least one side effect Reported frequencies: gingival hypertrophy (n = 30), ataxia (n = 13), sedation (n = 12), nausea and vomiting (n = 1) Other reported adverse events (no frequencies): nystagmus, confusion | SV (n = 48): 15 participants reported at least one side effect Reported frequencies: hyperactivity (n = 6), impaired school performance (n = 4), severe skin allergy (n = 1) | |
| Treatment withdrawals due to dose‐related and idiosyncratic adverse events | PHT (n = 70): 11 treatment withdrawals due to dose‐related adverse events (nystagmus, ataxia, tremor, diplopia and mental change) 5 treatment withdrawals due to idiosyncratic adverse events (skin eruption, erythroderma and jaundice) | SV (n = 70): 9 treatment withdrawals due to dose‐related adverse events (tremor, irritability, restlessness and alopecia) No treatment withdrawals due to idiosyncratic adverse events | |
| aAdverse event data, as reported narratively in the publications. Adverse event data were not requested in original IPD requests but will be for all future IPD requests. For numbers of treatment withdrawals due to adverse events in studies for which IPD were provided (De Silva 1996; Heller 1995; Ramsay 1992; Turnbull 1985) see Table 5. | |||
| Outcome or subgroup title | No. of studies | No. of participants | Statistical method | Effect size |
| 1 Time to treatment failure (any reason related to the treatment) Show forest plot | 6 | 569 | Hazard Ratio (Fixed, 95% CI) | 0.94 [0.67, 1.32] |
| 2 Time to treatment failure due to adverse events Show forest plot | 4 | 495 | Hazard Ratio (Fixed, 95% CI) | 0.68 [0.40, 1.17] |
| 3 Time to treatment failure due to lack of efficacy Show forest plot | 6 | 569 | Hazard Ratio (Fixed, 95% CI) | 1.23 [0.77, 1.97] |
| 4 Time to treatment failure (any reason related to the treatment) ‐ by epilepsy type Show forest plot | 5 | 528 | Hazard Ratio (Fixed, 95% CI) | 0.88 [0.61, 1.27] |
| 4.1 Focal onset seizures | 4 | 187 | Hazard Ratio (Fixed, 95% CI) | 0.83 [0.50, 1.38] |
| 4.2 Generalised onset seizures (tonic‐clonic only) | 5 | 341 | Hazard Ratio (Fixed, 95% CI) | 0.94 [0.55, 1.61] |
| 5 Time to treatment failure due to adverse events ‐ by epilepsy type Show forest plot | 4 | 418 | Hazard Ratio (Fixed, 95% CI) | 0.77 [0.44, 1.37] |
| 5.1 Focal onset seizures | 3 | 168 | Hazard Ratio (Fixed, 95% CI) | 0.75 [0.35, 1.60] |
| 5.2 Generalised onset seizures (tonic‐clonic only) | 3 | 250 | Hazard Ratio (Fixed, 95% CI) | 0.81 [0.34, 1.90] |
| 6 Time to treatment failure due to lack of efficacy ‐ by epilepsy type Show forest plot | 5 | 451 | Hazard Ratio (Fixed, 95% CI) | 1.16 [0.71, 1.89] |
| 6.1 Focal onset seizures | 4 | 187 | Hazard Ratio (Fixed, 95% CI) | 1.01 [0.55, 1.85] |
| 6.2 Generalised onset seizures (tonic‐clonic only) | 4 | 264 | Hazard Ratio (Fixed, 95% CI) | 1.51 [0.66, 3.45] |
| 7 Time to first seizure Show forest plot | 5 | 639 | Hazard Ratio (Fixed, 95% CI) | 1.04 [0.85, 1.28] |
| 8 Time to first seizure ‐ by epilepsy type Show forest plot | 5 | 639 | Hazard Ratio (Fixed, 95% CI) | 1.08 [0.88, 1.33] |
| 8.1 Focal onset seizures | 4 | 244 | Hazard Ratio (Fixed, 95% CI) | 1.20 [0.90, 1.60] |
| 8.2 Generalised onset seizures (tonic‐clonic only) | 5 | 395 | Hazard Ratio (Fixed, 95% CI) | 0.97 [0.72, 1.30] |
| 9 Time to first seizure ‐ epilepsy type reclassified to focal for generalised and age of onset > 30 years Show forest plot | 5 | 639 | Hazard Ratio (Fixed, 95% CI) | 1.05 [0.86, 1.29] |
| 9.1 Focal onset seizures | 5 | 416 | Hazard Ratio (Fixed, 95% CI) | 1.23 [0.96, 1.57] |
| 9.2 Generalised onset seizures (tonic‐clonic only) | 4 | 223 | Hazard Ratio (Fixed, 95% CI) | 0.72 [0.50, 1.05] |
| 10 Time to first seizure ‐ epilepsy type reclassified to uncertain for generalised and age of onset > 30 years Show forest plot | 5 | 649 | Hazard Ratio (Fixed, 95% CI) | 1.06 [0.86, 1.30] |
| 10.1 Focal onset seizures | 4 | 255 | Hazard Ratio (Fixed, 95% CI) | 1.20 [0.90, 1.60] |
| 10.2 Generalised onset seizures (tonic‐clonic only) | 4 | 223 | Hazard Ratio (Fixed, 95% CI) | 0.72 [0.50, 1.05] |
| 10.3 Uncertain seizure type | 4 | 171 | Hazard Ratio (Fixed, 95% CI) | 1.35 [0.85, 2.14] |
| 11 Time to achieve 12‐month remission Show forest plot | 4 | 514 | Hazard Ratio (Fixed, 95% CI) | 1.03 [0.82, 1.29] |
| 12 Time to achieve 12‐month remission ‐ by epilepsy type Show forest plot | 4 | 514 | Hazard Ratio (Fixed, 95% CI) | 1.02 [0.81, 1.28] |
| 12.1 Focal onset seizures | 4 | 244 | Hazard Ratio (Fixed, 95% CI) | 1.11 [0.78, 1.60] |
| 12.2 Generalised onset seizures (tonic‐clonic only) | 4 | 270 | Hazard Ratio (Fixed, 95% CI) | 0.96 [0.71, 1.29] |
| 13 Time to achieve six‐month remission Show forest plot | 5 | 639 | Hazard Ratio (Fixed, 95% CI) | 1.08 [0.89, 1.30] |
| 14 Time to achieve six‐month remission ‐ by epilepsy type Show forest plot | 5 | 639 | Hazard Ratio (Fixed, 95% CI) | 1.05 [0.86, 1.27] |
| 14.1 Focal onset seizures | 4 | 244 | Hazard Ratio (Fixed, 95% CI) | 1.00 [0.73, 1.35] |
| 14.2 Generalised onset seizures (tonic‐clonic only) | 5 | 395 | Hazard Ratio (Fixed, 95% CI) | 1.08 [0.84, 1.38] |