Phenytoin versus valproate monotherapy for partial onset seizures and generalised onset tonic‐clonic seizures: an individual participant data review
Información
- DOI:
- https://doi.org/10.1002/14651858.CD001769.pub3Copiar DOI

- Base de datos:
-
- Cochrane Database of Systematic Reviews
- Versión publicada:
-
- 28 abril 2016see what's new
- Tipo:
-
- Intervention
- Etapa:
-
- Review
- Grupo Editorial Cochrane:
-
Grupo Cochrane de Epilepsia
- Copyright:
-
- Copyright © 2017 The Cochrane Collaboration. Published by John Wiley & Sons, Ltd.
Cifras del artículo
Altmetric:
Citado por:
Autores
Contributions of authors
SJ Nolan assessed studies for inclusion in the review update, assessed risk of bias in all included studies, performed analyses in SAS version 9.2, Stata version 11.2 and Metaview, added survival plots and a 'Summary of findings' table and updated the text of the review under the supervision of C Tudur Smith and AG Marson.
C Tudur Smith was the lead investigator on the original review, assessed eligibility and methodological quality of original individual studies, organised and cleaned the individual participant data sets, performed data validation checks and statistical analyses and co‐wrote the original review.
AG Marson obtained individual participant data from trial investigators, provided guidance with the clinical interpretation of results, assessed eligibility and methodological quality of individual studies and co‐wrote the original review.
J Weston independently assessed risk of bias in all included studies.
Sources of support
Internal sources
-
University of Liverpool, UK.
-
Walton Centre for Neurology and Neurosurgery, UK.
External sources
-
Medical Research Council, UK.
-
National Institute for Health Research (NIHR), UK.
This review was supported by the National Institute for Health Research, via Cochrane Infrastructure funding to the Epilepsy Group. The views and opinions expressed therein are those of the authors and do not necessarily reflect those of the Systematic Reviews Programme, NIHR, National Health Service (NHS) or the Department of Health.
Declarations of interest
SJ Nolan has no declarations of interest.
C Tudur Smith has no declarations of interest.
J Weston has no declarations of interest.
AG Marson: A consortium of pharmaceutical companies (GSK, EISAI, UCB Pharma) funded the National Audit of Seizure Management in Hospitals (NASH) through grants paid to University of Liverpool. Professor Tony Marson is Theme Leader for Managing Complex Needs at NIHR CLAHRC NWC.
Acknowledgements
We are greatly indebted to all of the trialists who have provided individual participant data (IPD) and input and review. They have shown great patience in the way our data queries were handled.
Kenneth Sommerville and Roger Deaton at Abbott Laboratories.
We acknowledge Paula Williamson for contributions to the original review.
Version history
| Published | Title | Stage | Authors | Version |
| 2018 Aug 09 | Sodium valproate versus phenytoin monotherapy for epilepsy: an individual participant data review | Review | Sarah J Nevitt, Anthony G Marson, Jennifer Weston, Catrin Tudur Smith | |
| 2016 Apr 28 | Phenytoin versus valproate monotherapy for partial onset seizures and generalised onset tonic‐clonic seizures: an individual participant data review | Review | Sarah J Nevitt, Anthony G Marson, Jennifer Weston, Catrin Tudur Smith | |
| 2013 Aug 23 | Phenytoin versus valproate monotherapy for partial onset seizures and generalised onset tonic‐clonic seizures | Review | Sarah J Nolan, Anthony G Marson, Jennifer Pulman, Catrin Tudur Smith | |
| 2001 Oct 23 | Phenytoin versus valproate monotherapy for partial onset seizures and generalized onset tonic‐clonic seizures | Review | Catrin Tudur Smith, Anthony G Marson, Paula R Williamson | |
Differences between protocol and review
December 2014: title was changed to specify that the review uses individual participant data.
Sensitivity analyses added following identification of potential misclassification of seizure type. The existence of misclassification in the individual studies could not have been known at the time of writing the original protocol.
Addition of the outcome 'time to six‐month remission' for consistency with the other reviews in the series of Cochrane IPD reviews investigating pair‐wise monotherapy comparisons and removal of the outcome 'Quality of Life' which was found to not be readily available in an analysable format from early IPD requests
Notes
The protocol for this review was published with Catrin Tudur as the contact review author. Catrin is now known as Catrin Tudur Smith.
Keywords
MeSH
Medical Subject Headings (MeSH) Keywords
Medical Subject Headings Check Words
Humans;
PICO
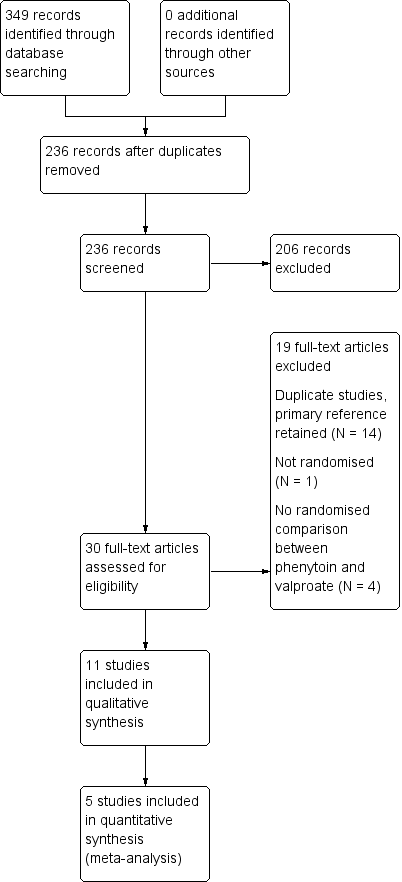
Study flow diagram.
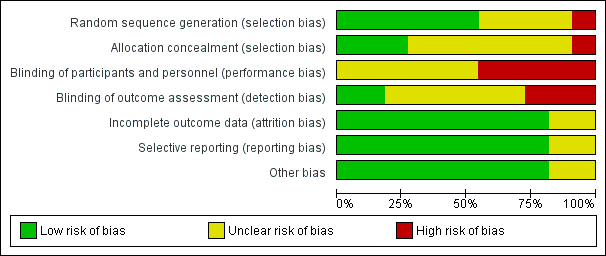
'Risk of bias' graph: review authors' judgements about each risk of bias item presented as percentages across all included studies.
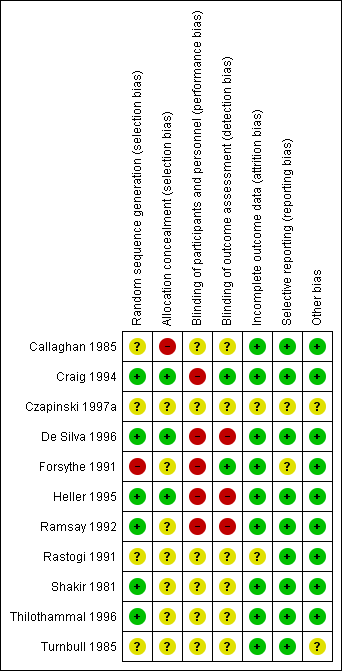
'Risk of bias' summary: review authors' judgements about each risk of bias item for each included study.

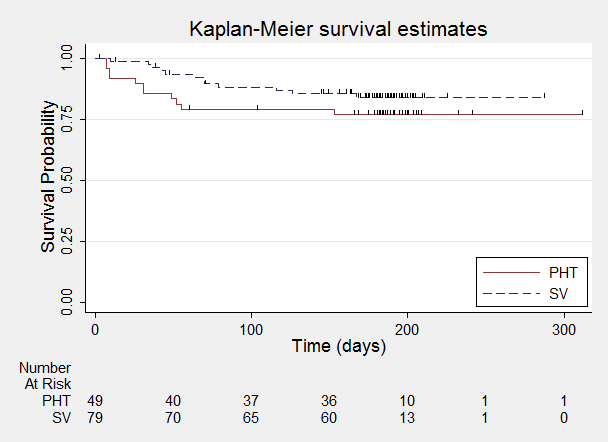
Time to withdrawal of allocated treatment.
One participant randomised to phenytoin (PHT) and nine participants randomised to valproate (SV) had time to withdrawal of zero days, and are therefore not included in "Number at Risk".

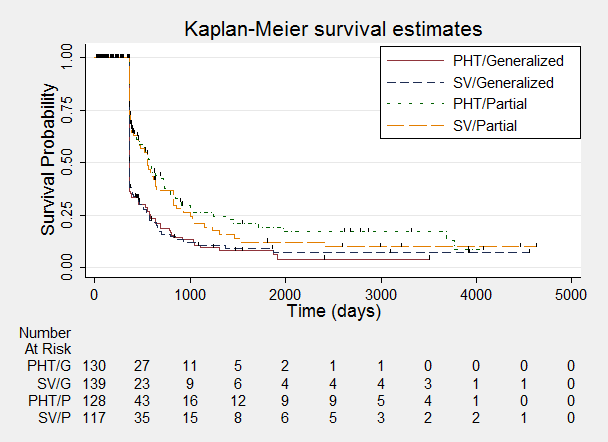
Time to withdrawal of allocated treatment ‐ stratified by epilepsy type.
One participant with generalised epilepsy randomised to phenytoin (PHT) and nine participants with generalised epilepsy randomised to valproate (SV) had time to withdrawal of zero days, and are therefore not included in "Number at Risk".

Time to achieve 12‐month remission.
Time to achieve 12‐month remission ‐ stratified by epilepsy type.

Time to achieve six‐month remission.

Time to achieve six‐month remission ‐ stratified by epilepsy type.

Time to first seizure.

Time to first seizure ‐ stratified by epilepsy type.

Comparison 1 Phenytoin versus sodium valproate, Outcome 1 Time to withdrawal of allocated treatment.

Comparison 1 Phenytoin versus sodium valproate, Outcome 2 Time to withdrawal of allocated treatment ‐ stratified by epilepsy type.

Comparison 1 Phenytoin versus sodium valproate, Outcome 3 Time to achieve 12‐month remission.

Comparison 1 Phenytoin versus sodium valproate, Outcome 4 Time to achieve 12‐month remission ‐ stratified by epilepsy type.

Comparison 1 Phenytoin versus sodium valproate, Outcome 5 Time to achieve six‐month remission.

Comparison 1 Phenytoin versus sodium valproate, Outcome 6 Time to achieve six‐month remission ‐ stratified by epilepsy type.
Comparison 1 Phenytoin versus sodium valproate, Outcome 7 Time to first seizure.

Comparison 1 Phenytoin versus sodium valproate, Outcome 8 Time to first seizure ‐ stratified by epilepsy type.

Comparison 1 Phenytoin versus sodium valproate, Outcome 9 Time to first seizure ‐ epilepsy type reclassified to uncertain for generalised and age of onset > 30 years.

Comparison 1 Phenytoin versus sodium valproate, Outcome 10 Time to first seizure ‐ epilepsy type reclassified to partial for generalised and age of onset > 30 years.
| Phenytoin compared with valproate for partial onset seizures and generalised onset tonic‐clonic seizures | ||||||
| Patient or population: Adults and children with newly‐onset partial or generalised tonic‐clonic seizures Settings: Outpatients Intervention: Valproate Comparison: Phenytoin | ||||||
| Outcomes | Illustrative comparative risks* (95% CI) | Relative effect | No of Participants | Quality of the evidence | Comments | |
| Assumed risk | Corresponding risk | |||||
| Phenytoin | Valproate | |||||
| Time to withdrawal of allocated treatment (retention time) ‐ stratified by epilepsy type Range of follow‐up (all participants): 1‐91 months | 27 per 100 | 25 per 100 (18 to 33) | HR 1.09 (0.76 to 1.55)1 | 528 | ⊕⊕⊕⊝ | HR > 1 indicates a clinical |
| Time to withdrawal of allocated treatment (retention time) ‐ stratified by epilepsy type: generalised onset seizures (tonic‐clonic only) Range of follow‐up (all participants): 1‐91 months | 18 per 100 | 19 per 100 (12 to 29) | HR 0.98 (0.59 to 1.64) | 341 | ⊕⊕⊕⊝ | HR > 1 indicates a clinical |
| Time to withdrawal of allocated treatment (retention time) ‐ stratified by epilepsy type: partial onset seizures Range of follow‐up (all participants): 1‐91 months | 39 per 100 | 34 per 100 (23 to 49) | HR 1.20 (0.74 to 1.95) | 187 (4 studies) | ⊕⊕⊕⊝ | HR > 1 indicates a clinical |
| Time to achieve 12‐month remission (seizure‐free period) ‐ stratified by epilepsy type Range of follow‐up (all participants): 1‐91 months | 67 per 100 | 67 per 100 (58 to 75) | HR 0.98 (0.78 to 1.23)1 | 514 (4 studies) | ⊕⊕⊕⊝ | HR > 1 indicates a clinical |
| Time to achieve 12‐month remission (seizure‐free period) ‐ stratified by epilepsy type: generalised onset seizures (tonic‐clonic only) Range of follow‐up (all participants): 1 ‐ 91 months | 67 per 100 | 69 per 100 (58 to 79) | HR 1.04 (0.77 to 1.40) | 270 (4 studies) | ⊕⊕⊝⊝ | HR > 1 indicates a clinical |
| Time to achieve 12‐month remission (seizure‐free period) ‐ stratified by epilepsy type: partial onset seizures Range of follow up (all participants): 1‐91 months | 67 per 100 | 63 per 100 (50 to 76) | HR 0.90 (0.63 to 1.29) | 244 (4 studies) | ⊕⊕⊕⊝ | HR > 1 indicates a clinical |
| Time to achieve 6‐month remission (seizure‐free period) ‐ stratified by epilepsy type Range of follow‐up (all participants): 1 ‐ 91 months | 60 per 100 | 58 per 100 (51 to 65) | HR 0.95 (0.78 to 1.15)1 | 639 (5 studies) | ⊕⊕⊕⊝ | HR > 1 indicates a clinical |
| Time to achieve 6‐month remission (seizure‐free period) ‐ stratified by epilepsy type: generalised onset seizures (tonic‐clonic only) Range of follow‐up (all participants): 1 ‐ 91 months | 69 per 100 | 66 per 100 (57 to 75) | HR 0.92 (0.72 to 1.18) | 395 (5 studies) | ⊕⊕⊝⊝ | HR > 1 indicates a clinical |
| Time to achieve 6‐month remission (seizure‐free period) ‐ stratified by epilepsy type: partial onset seizures Range of follow‐up (all participants): 1‐91 months | 51 per 100 | 50 per 100 (40 to 62) | HR 0.99 (0.73 to 1.35) | 244 (4 studies) | ⊕⊕⊕⊝ | HR > 1 indicates a clinical |
| Time to first seizure (post‐randomisation) ‐ stratified by epilepsy type Range of follow‐up (all participants): 1‐91 months | 59 per 100 | 62 per 100 (55 to 70) | HR 0.93 (0.75 to 1.14)1 | 639 (5 studies) | ⊕⊕⊝⊝ | HR > 1 indicates a clinical |
| Time to first seizure (post‐randomisation) ‐ stratified by epilepsy type: generalised onset seizures (tonic‐clonic only) Range of follow‐up (all participants): 1‐91 months | 48 per 100 | 47 per 100 (38 to 58) | HR 1.03 (0.77 to 1.39) | 395 (5 studies) | ⊕⊝⊝⊝ | HR > 1 indicates a clinical |
| Time to first seizure (post‐randomisation) ‐ stratified by epilepsy type: partial onset seizures Range of follow‐up (all participants): 1‐91 months | 75 per 100 | 81 per 100 (71 to 89) | HR 0.83 (0.62 to 1.11) | 244 (4 studies) | ⊕⊕⊝⊝ | HR > 1 indicates a clinical |
| *The basis for the assumed risk (e.g. the median control group risk across studies) is provided in footnotes. The assumed risk is calculated as the event rate in the phenytoin treatment group. The corresponding risk (and its 95% confidence interval) is based on the assumed risk in the comparison group and the relative effect of the intervention (and its 95% CI). | ||||||
| GRADE Working Group grades of evidence | ||||||
| 1Pooled HR for all participants adjusted for seizure type. | ||||||
| Trial | Outcomes reported | Summary of results |
| 1. Seizure control: (a) excellent (seizure‐free) (b) good (> 50% reduction) (c) poor (< 50% reduction) 2. Adverse events | 1. PHT (n = 58); SV (n = 64) (a) 39 (67%) 34 (53%) (b) 7 (12%) 16 (25%) (c) 12 (21%) 14 (22%) 2. 6 (10%) 7 (11%) | |
| 1. Proportion achieving 24‐month remission at 3 years 2. Proportion excluded after randomisation due to adverse events or no efficacy | 1. PHT: 59%; SV: 64% 2. PHT: 23%; SV: 23% | |
| 1. Cognitive assessments 2. Withdrawals from randomised drug | 1. Significant difference favouring SV test of speed of information processing (P < 0.01) No significant differences between treatment groups for any other cognitive tests 2. PHT: 6/20 (30%); SV: 7/21 (33%) | |
| 1. Reduction in frequency of seizures at 24 weeks: (a) excellent (100% reduction) (b) good (75%‐99% reduction) (c) fair (50%‐74% reduction) (d) poor (< 50% reduction) 2. Adverse events | 1. PHT (n = 45); SV (n = 49) (a) 23 (51%) 24 (49%) (b) 13 (24%) 17 (35%) (c) 8 (18%) 5(10%) (d) 1 (2%) 3 (6%) 2. All reported adverse events were minor PHT: gum hyperplasia (18%), nystagmus (13%), gastrointestinal symptoms (4%), drowsiness (4%), ataxia (2%) SV: gastrointestinal symptoms (12%), drowsiness (6%), weight gain (2%) | |
| 1.Seizures during treatment 2. Adverse events | 1. PHT: 5 (33%); SV: 7 (39%) 2. PHT: 1 case of ataxia, 5 cases of acne. SV: 2 cases of gastrointestinal symptoms, 2 cases of hair loss, 4 cases of weight gain | |
| 1. Recurrence of seizures 2. Adverse events | 1. PHT: 14/52 (27%) SV: 10/48 (21%) 2. PHT: 33/52 (63%) SV: 15/48 (31%) | |
| PHT: phenytoin; SV: sodium valproate | ||
| Trial | Number randomised | Time to withdrawal of allocated treatment | Time to achieve 12‐month remission | Time to achieve 6‐month remission | Time to first seizure | ||||||||||
| PHT | SV | Total | PHT | SV | Total | PHT | SV | Total | PHT | SV | Total | PHT | SV | Total | |
| 81 | 85 | 166 | 0 | 0 | 0 | 71 | 76 | 147 | 71 | 76 | 147 | 71 | 76 | 147 | |
| 54 | 49 | 103 | 53 | 47 | 100 | 54 | 49 | 103 | 54 | 49 | 103 | 54 | 49 | 103 | |
| 20 | 21 | 41 | 20 | 21 | 41 | 0 | 0 | 0 | 0 | 0 | 0 | 0 | 0 | 0 | |
| 63 | 61 | 124 | 61 | 58 | 119 | 63 | 61 | 124 | 63 | 61 | 124 | 63 | 61 | 124 | |
| 50 | 86 | 136 | 50 | 86 | 136 | 0 | 0 | 0 | 48 | 77 | 125 | 48 | 77 | 125 | |
| 70 | 70 | 140 | 70 | 70 | 140 | 70 | 70 | 140 | 70 | 70 | 140 | 70 | 70 | 140 | |
| 15 | 18 | 33 | 15 | 18 | 33 | 0 | 0 | 0 | 0 | 0 | 0 | 0 | 0 | 0 | |
| Total | 353 | 390 | 743 | 269 | 300 | 569 | 258 | 256 | 514 | 306 | 333 | 639 | 306 | 333 | 639 |
| 1Withdrawal information not provided for Craig 1994, so cannot contribute to 'Time to withdrawal of allocated treatment'. PHT: phenytoin; SV: sodium valproate | |||||||||||||||
| Statistic | Time to withdrawal of allocated treatment | Time to achieve 12‐month remission | Time to achieve six‐month remission | Time to first seizure | |
| Test for heterogeneity | Chi² | (df = 5) 5.95 | (df = 3) 0.19 | (df = 4) 1.66 | (df = 4) 4.23 |
| P value | 0.31 | 0.98 | 0.80 | 0.38 | |
| I² | 16% | 0% | 0% | 5% | |
| Overall effect | HR (95% CI) | 1.02 (0.73 to 1.49) | 0.97 (0.77 to 1.22) | 0.92 (0.76 to 1.12) | 0.96 (0.78 to 1.18) |
| P value | 0.92 | 0.81 | 0.42 | 0.70 | |
| Test for interaction between treatment and epilepsy type | Chi² | (df = 1) 0.31 | (df = 1) 0.39 | (df = 1) 0.13 | (df = 1) 1.06 |
| P value | 0.58 | 0.53 | 0.72 | 0.3 | |
| I² | 0% | 0% | 0% | 5.6% | |
| Overall effect adjusted for epilepsy type | HR (95% CI) | 1.09 (0.76 to 1.55) | 0.98 (0.78 to 1.23) | 0.95 (0.78 to 1.15) | 0.93 (0.75 to 1.14) |
| P value | 0.19 | 0.87 | 0.60 | 0.47 | |
| CI: confidence interval; df: degrees of freedom of Chi² distribution; HR: Hazard ratio; P < 0.05 is classified as statistically significant | |||||
| Reason for early termination | Classification | De Silva 19962 | Heller 19952,3 | Ramsey 1992 | Turnbull 1985 | Total1 | |||||
| PHT n = 53 | SV n = 47 | PHT n = 63 | SV n = 58 | PHT n = 50 | SV n = 86 | PHT n = 70 | SV n = 70 | PHT n = 236 | SV n = 261 | ||
| Adverse events/intoxication | Event | 2 | 2 | 1 | 4 | 5 | 7 | 14 | 7 | 22 | 20 |
| Poor seizure control/lack of efficacy | Event | 10 | 11 | 8 | 9 | 2 | 1 | 0 | 2 | 20 | 23 |
| Both adverse events and lack of efficacy | Event | 5 | 4 | 2 | 6 | 0 | 0 | 2 | 1 | 9 | 11 |
| Non‐compliance | Event | 0 | 0 | 0 | 0 | 1 | 7 | 2 | 2 | 3 | 9 |
| Participant went into remission | Censored | 24 | 16 | 14 | 13 | 0 | 0 | 0 | 0 | 38 | 29 |
| Lost to follow‐up | Censored | 0 | 0 | 0 | 0 | 4 | 10 | 7 | 7 | 11 | 17 |
| Death4 | Censored | 0 | 0 | 0 | 0 | 0 | 0 | 3 | 3 | 3 | 3 |
| Other5 | Censored | 0 | 0 | 0 | 0 | 2 | 1 | 0 | 0 | 2 | 1 |
| Completed the study/did not withdraw | Censored | 12 | 14 | 38 | 26 | 36 | 60 | 42 | 48 | 128 | 148 |
| n = number of individuals contributing to the outcome 'Time to withdrawal of allocated treatment'; PHT: phenytoin; SV: sodium valproate | |||||||||||
| Trial | Adverse event data1 | Summary of reported results | |
| Phenytoin (PHT) | SV (Sodium Valproate) | ||
| All adverse events developed (by drug) and adverse events leading to discontinuation of treatment | PHT (n = 58): gum hypertrophy (n = 2), rash (n = 2), ataxia (n = 2)
| SV (n = 64): weight gain (n = 4 – all discontinued treatment), drowsiness (n = 2), aggressive behaviour (n = 1 – discontinued treatment) | |
| Adverse event frequency (spontaneous reports)2 Discontinuations due to adverse events3 | PHT (n = 25): unsteadiness (n = 9), sleepiness (n = 7), drowsiness (n = 2), impaired concentration (n = 2), confusion (n = 1), constipation (n = 1), diarrhoea (n = 1), dysarthria (n = 1), lethargy (n = 1), nystagmus (n = 1), rash (n = 1), tired legs (n = 1) PHT discontinuations (n = 6): rash (n =1), diarrhoea (n = 1), confusion (n = 1), unsteadiness (n = 1), constipation (n = 1), sleepiness (n = 1) | SV (n = 17): unsteadiness (n = 2), sleepiness (n = 3), tremor (n = 5), oedema (n = 3), alopecia (n = 2), depression (n = 2), weight gain (n = 2) SV discontinuations (n = 2): weight gain and depression (n = 1), unsteadiness (n =1) | |
| “Exclusions” due to adverse events or no efficacy4 | Proportion “excluded”: PHT: 33.3% | Proportion “excluded”: SV: 23.3% | |
| “Unacceptable” adverse events leading to drug withdrawal5 | PHT (n = 54): drowsiness (n = 2), skin rash (n = 1) blood dyscrasia (n = 1), hirsutism (n = 1) | SV (n = 49): behavioural (n = 1), tremor (n = 1) | |
| No adverse event data reported (Withdrawal data only reported) | 1 participant (PHT) withdrew from the study due to depression and anorexia | No adverse event data (or withdrawals due to adverse events) reported | |
| “Unacceptable” adverse events leading to drug withdrawal5 | PHT (n = 63): myalgia (n = 1), irritability (n = 1)
| SV (n = 61): dizziness (n = 2) abnormal liver function test (n = 1) | |
| Most common adverse events (by treatment group)6 | PHT (n = 50): dyspepsia (n = 1), nausea (n = 2), dizziness (n = 2), somnolence (n = 5), tremor (n = 2), rash (n = 4)
| SV (n = 86): dyspepsia (n = 7), nausea (n = 10), dizziness (n = 5), somnolence (n = 8), tremor (n = 5), rash (n = 3) | |
| Commonest adverse events (reported as percentages by treatment group)6 | PHT (n = 45): gum hyperplasia (17.7%), nystagmus (13.33%), ataxia (2.2%), gastrointestinal disturbances (4.44%), drowsiness (4.44%) | SV (n = 49): gastrointestinal disturbances (12%), drowsiness (6.12%), weight gain (2.04%) | |
| Adverse events (narrative description)2 | PHT (n = 15): 1 case of ataxia, 5 cases of acne | SV (n = 18): 2 cases of gastrointestinal symptoms, 2 cases of hair loss, 4 cases of weight gain | |
| Assessment of adverse events2 | PHT (n = 52): 33 participants reported at least one side effect Reported frequencies: gingival hypertrophy (n = 30), ataxia (n = 13), sedation (n = 12), nausea and vomiting (n = 1) Other reported adverse events (no frequencies): nystagmus, confusion | SV (n = 48): 15 participants reported at least one side effect Reported frequencies: hyperactivity (n = 6), impaired school performance (n = 4), severe skin allergy (n = 1) | |
| Withdrawals due to dose‐related and idiosyncratic adverse events | PHT (n = 70): 11 withdrawals due to dose‐related adverse events (nystagmus, ataxia, tremor, diplopia and mental change) 5 withdrawals due to idiosyncratic adverse events (skin eruption, erythroderma and jaundice) | SV (n = 70): 9 withdrawals due to dose‐related adverse events (tremor, irritability, restlessness and alopecia) No withdrawals due to idiosyncratic adverse events | |
| 1Adverse event data, as reported narratively in the publications. Adverse event data were not requested in original IPD requests but will be for all future IPD requests. For numbers of withdrawals due to adverse events in studies for which IPD were provided (De Silva 1996; Heller 1995; Ramsay 1992; Turnbull 1985) see Table 4. | |||
| Time to withdrawal of allocated treatment | Time to achieve 12‐month remission | Time to achieve 6‐month remission | Time to first seizure | |
| (i) Original analysis | P: 1.20 (0.76 to 1.95) G: 0.98 (0.59 to 1.64) O: 1.09 (0.76 to 1.55) | P: 0.90 (0.63 to 1.29) G: 1.04 (0.77 to 1.40) O: 0.98 (0.78 to 1.23) | P: 0.99 (0.73 to 1.35) G: 0.92 (0.72 to 1.18) O: 0.95 (0.78 to 1.15) | P: 0.83 (0.62 to 1.11) G: 1.03 (0.77 to 1.39) O: 0.93 (0.75 to 1.14) |
| (i) Test for interaction | Chi² = 0.31, df = 1, P = 0.58, I² = 0% | Chi² = 0.39, df = 1, P = 0.53, I² = 0% | Chi² = 0.13, df = 1, P = 0.72, I² = 0% | Chi² = 1.06, df = 1, P = 0.30, I² = 5.6% |
|
| ||||
| (ii) Generalised onset and age at onset > 30 classified as uncertain seizure type | P: 1.20 (0.76 to 1.95) G: 1.33 (0.74 to 2.38) U: 0.47 (0.12 to 1.85) O: 1.17 (0.82 to 1.67) | P: 0.90 (0.63 to 1.29) G: 0.93 (0.63 to 1.39) U: 1.36 (0.85 to 2.17) O: 1.01 (0.80 to 1.27) | P: 0.99 (0.73 to 1.35) G: 0.88 (0.62 to 1.25) U: 1.11 (0.76 to 1.61) O: 0.99 (0.81 to 1.20) | P: 0.83 (0.62 to 1.11) G: 1.34 (0.91 to 1.97) U: 0.74 (0.47 to 1.17) O: 0.93 (0.76 to 1.15) |
| (ii) Test for interaction | Chi² = 1.88, df = 2, P = 0.39, I² = 0% | Chi² = 2.07, df = 2, P = 0.36, I² = 3.3% | Chi² = 0.78, df = 2, P = 0.68, I² = 0% | Chi² = 4.87, df = 2, P = 0.09, I²= 58.9% |
|
| ||||
| (iii) Generalised onset and age at onset > 30 reclassified as partial onset | P: 0.98 (0.63 to 1.53) G: 1.33 (0.74 to 2.38) O: 1.10 (0.77 to 1.56) | P: 1.01 (0.76 to 1.34) G: 0.93 (0.63 to 1.39) O: 0.98 (0.78 to 1.24) | P: 1.00 (0.79 to 1.27) G: 0.88 (0.62 to 1.25) O: 0.97 (0.80 to 1.18) | P: 0.81 (0.64 to 1.04) G: 1.34 (0.91 to 1.97) O 0.94 (0.76 to 1.15) |
| (iii) Test for interaction | Chi² = 0.67, df = 1, P = 0.41, I² = 0% | Chi² = 0.10, df = 1, P = 0.75, I² = 0% | Chi² = 0.36, df = 1 P = 0.55, I² = 0% | Chi² = 4.55, df = 1 P = 0.03, I² = 78% |
| P: partial epilepsy; G: generalised epilepsy; O: overall (all participants); U: uncertain epilepsy. Results are presented as pooled HR (95% CI) with fixed‐effect See Analysis 1.2, Analysis 1.4, Analysis 1.6, and Analysis 1.8 for original analyses of 'Time to withdrawal of allocated treatment', 'Time to achieve 12‐month remission', 'Time to achieve 6‐month remission', and 'Time to first seizure' respectively. See Analysis 1.9 and Analysis 1.10 for forest plots of 'Time to first seizure' sensitivity analyses for generalised and age at onset > 30 reclassified as uncertain epilepsy type and partial epilepsy, respectively. Forest plots are not presented for 'Time to withdrawal of allocated treatment', 'Time to achieve 6‐month remission', 'Time to achieve 12‐month remission' sensitivity analyses, as results were similar for partial onset and generalised onset subgroups, and conclusions are unchanged. | ||||
| Outcome or subgroup title | No. of studies | No. of participants | Statistical method | Effect size |
| 1 Time to withdrawal of allocated treatment Show forest plot | 6 | 569 | Hazard Ratio (Fixed, 95% CI) | 1.02 [0.73, 1.42] |
| 2 Time to withdrawal of allocated treatment ‐ stratified by epilepsy type Show forest plot | 5 | 528 | Hazard Ratio (Fixed, 95% CI) | 1.09 [0.76, 1.55] |
| 2.1 Generalised onset seizures (tonic‐clonic only) | 5 | 341 | Hazard Ratio (Fixed, 95% CI) | 0.98 [0.59, 1.64] |
| 2.2 Partial onset seizures | 4 | 187 | Hazard Ratio (Fixed, 95% CI) | 1.20 [0.74, 1.95] |
| 3 Time to achieve 12‐month remission Show forest plot | 4 | 514 | Hazard Ratio (Fixed, 95% CI) | 0.97 [0.77, 1.22] |
| 4 Time to achieve 12‐month remission ‐ stratified by epilepsy type Show forest plot | 4 | 514 | Hazard Ratio (Fixed, 95% CI) | 0.98 [0.78, 1.23] |
| 4.1 Generalised onset seizures (tonic‐clonic only) | 4 | 270 | Hazard Ratio (Fixed, 95% CI) | 1.04 [0.77, 1.40] |
| 4.2 Partial onset seizures | 4 | 244 | Hazard Ratio (Fixed, 95% CI) | 0.90 [0.63, 1.29] |
| 5 Time to achieve six‐month remission Show forest plot | 5 | 639 | Hazard Ratio (Fixed, 95% CI) | 0.92 [0.76, 1.12] |
| 6 Time to achieve six‐month remission ‐ stratified by epilepsy type Show forest plot | 5 | 639 | Hazard Ratio (Fixed, 95% CI) | 0.95 [0.78, 1.15] |
| 6.1 Generalised onset seizures (tonic‐clonic only) | 5 | 395 | Hazard Ratio (Fixed, 95% CI) | 0.92 [0.72, 1.18] |
| 6.2 Partial onset seizures | 4 | 244 | Hazard Ratio (Fixed, 95% CI) | 0.99 [0.73, 1.35] |
| 7 Time to first seizure Show forest plot | 5 | 639 | Hazard Ratio (Fixed, 95% CI) | 0.96 [0.78, 1.18] |
| 8 Time to first seizure ‐ stratified by epilepsy type Show forest plot | 5 | 639 | Hazard Ratio (Fixed, 95% CI) | 0.93 [0.75, 1.14] |
| 8.1 Generalised onset seizures (tonic‐clonic only) | 5 | 395 | Hazard Ratio (Fixed, 95% CI) | 1.03 [0.77, 1.39] |
| 8.2 Partial onset seizures | 4 | 244 | Hazard Ratio (Fixed, 95% CI) | 0.83 [0.62, 1.11] |
| 9 Time to first seizure ‐ epilepsy type reclassified to uncertain for generalised and age of onset > 30 years Show forest plot | 5 | 649 | Hazard Ratio (Fixed, 95% CI) | 0.93 [0.76, 1.15] |
| 9.1 Generalised onset seizures (tonic‐clonic only) | 4 | 223 | Hazard Ratio (Fixed, 95% CI) | 1.34 [0.91, 1.97] |
| 9.2 Partial onset seizures | 4 | 255 | Hazard Ratio (Fixed, 95% CI) | 0.83 [0.62, 1.11] |
| 9.3 Uncertain seizure type | 4 | 171 | Hazard Ratio (Fixed, 95% CI) | 0.74 [0.47, 1.17] |
| 10 Time to first seizure ‐ epilepsy type reclassified to partial for generalised and age of onset > 30 years Show forest plot | 5 | 639 | Hazard Ratio (Fixed, 95% CI) | 0.94 [0.76, 1.15] |
| 10.1 Generalised onset seizures (tonic‐clonic only) | 4 | 223 | Hazard Ratio (Fixed, 95% CI) | 1.34 [0.91, 1.97] |
| 10.2 Partial onset seizures | 5 | 416 | Hazard Ratio (Fixed, 95% CI) | 0.81 [0.64, 1.04] |