Phenytoin versus valproate monotherapy for partial onset seizures and generalised onset tonic‐clonic seizures: an individual participant data review
Abstract
Background
Worldwide, phenytoin and valproate are commonly used antiepileptic drugs. It is generally believed that phenytoin is more effective for partial onset seizures, and that valproate is more effective for generalised onset tonic‐clonic seizures (with or without other generalised seizure types). This review is one in a series of Cochrane reviews investigating pair‐wise monotherapy comparisons. This is the latest updated version of the review first published in 2001 and updated in 2013.
Objectives
To review the time to withdrawal, remission and first seizure of phenytoin compared to valproate when used as monotherapy in people with partial onset seizures or generalised tonic‐clonic seizures (with or without other generalised seizure types).
Search methods
We searched the Cochrane Epilepsy Group's Specialised Register (19 May 2015), the Cochrane Central Register of Controlled Trials (CENTRAL; the Cochrane Library; 2015, Issue 4), MEDLINE (1946 to 19 May 2015), SCOPUS (19 February 2013), ClinicalTrials.gov (19 May 2015), and WHO International Clinical Trials Registry Platform ICTRP (19 May 2015). We handsearched relevant journals, contacted pharmaceutical companies, original trial investigators and experts in the field.
Selection criteria
Randomised controlled trials (RCTs) in children or adults with partial onset seizures or generalised onset tonic‐clonic seizures with a comparison of valproate monotherapy versus phenytoin monotherapy.
Data collection and analysis
This was an individual participant data (IPD) review. Outcomes were time to: (a) withdrawal of allocated treatment (retention time); (b) achieve 12‐month remission (seizure‐free period); (c) achieve six‐month remission (seizure‐free period); and (d) first seizure (post‐randomisation). We used Cox proportional hazards regression models to obtain study‐specific estimates of hazard ratios (HRs) with 95% confidence intervals (CIs), and the generic inverse variance method to obtain the overall pooled HR and 95% CI.
Main results
IPD were available for 669 individuals out of 1119 eligible individuals from five out of 11 trials, 60% of the potential data. Results apply to partial onset seizures (simple, complex and secondary generalised tonic‐clonic seizures), and generalised tonic‐clonic seizures, but not other generalised seizure types (absence or myoclonus seizure types). For remission outcomes: HR > 1 indicates an advantage for phenytoin; and for first seizure and withdrawal outcomes: HR > 1 indicates an advantage for valproate.
The main overall results (pooled HR adjusted for seizure type) were time to: (a) withdrawal of allocated treatment 1.09 (95% CI 0.76 to 1.55); (b) achieve 12‐month remission 0.98 (95% CI 0.78 to 1.23); (c) achieve six‐month remission 0.95 (95% CI 0.78 to 1.15); and (d) first seizure 0.93 (95% CI 0.75 to 1.14). The results suggest no overall difference between the drugs for these outcomes. We did not find any statistical interaction between treatment and seizure type (partial versus generalised).
Authors' conclusions
We have not found evidence that a significant difference exists between phenytoin and valproate for the outcomes examined in this review. However misclassification of seizure type may have confounded the results of this review. Results do not apply to absence or myoclonus seizure types. No outright evidence was found to support or refute current treatment policies.
PICOs
Plain language summary
Phenytoin versus valproate monotherapy(single drug treatment) for partial onset seizures and generalised onset tonic‐clonic seizures
Background
Epilepsy is a disorder in which recurrent seizures are caused by abnormal electrical discharges from the brain. We studied two seizure types in this review: generalised onset seizures in which electrical discharges begin in one part of the brain and move throughout the brain; and partial onset seizures in which the seizure is generated in and affects one part of the brain (the whole hemisphere of the brain or part of a lobe of the brain). Most seizures can be controlled by a single antiepileptic drug. Worldwide, phenytoin and valproate are commonly used antiepileptic drugs.
Objective
Phenytoin and valproate are commonly used treatments for individuals with epilepsy. The aim of this review was to compare how effective these drugs are at controlling seizures and whether individuals choose to withdraw from these treatments, to inform a choice between these drugs.
Methods
The last search for trials for this review was 19th May 2015. We assessed the evidence from 11 randomised controlled clinical trials comparing phenytoin to valproate and we were able to combine data for 699 people from 5 of the 11 trials; for the remaining 450 people from 6 trials, data were not available to use in this review.
Key Results
This review of trials found no difference between these two drugs for the seizure types studied for the outcomes of withdrawal from treatment and controlling seizures. The review also found no evidence to support or refute the policy of using valproate for generalised onset tonic‐clonic seizures and phenytoin for partial onset seizures. However, up to 49% of people within the trials classified as having generalised seizures may have had their seizure type wrongly diagnosed, and this misclassification may have influenced the results of this review. We were unable to address the issue of preferring valproate for generalised onset seizure types other than tonic‐clonic.
Quality of the evidence
We judged the quality of the evidence as moderate for the evidence of withdrawal from treatment and low to very low for seizure outcomes as it is likely that misclassification of seizure type influenced the results of the review.
Conclusions
Phenytoin and valproate are commonly used treatments for individuals with epilepsy, but we found no difference between these treatments for the outcomes of this review or between seizure types. More information is needed as it is likely that misclassification of seizure type influenced the results of the review.
Authors' conclusions
Summary of findings
| Phenytoin compared with valproate for partial onset seizures and generalised onset tonic‐clonic seizures | ||||||
| Patient or population: Adults and children with newly‐onset partial or generalised tonic‐clonic seizures Settings: Outpatients Intervention: Valproate Comparison: Phenytoin | ||||||
| Outcomes | Illustrative comparative risks* (95% CI) | Relative effect | No of Participants | Quality of the evidence | Comments | |
| Assumed risk | Corresponding risk | |||||
| Phenytoin | Valproate | |||||
| Time to withdrawal of allocated treatment (retention time) ‐ stratified by epilepsy type Range of follow‐up (all participants): 1‐91 months | 27 per 100 | 25 per 100 (18 to 33) | HR 1.09 (0.76 to 1.55)1 | 528 | ⊕⊕⊕⊝ | HR > 1 indicates a clinical |
| Time to withdrawal of allocated treatment (retention time) ‐ stratified by epilepsy type: generalised onset seizures (tonic‐clonic only) Range of follow‐up (all participants): 1‐91 months | 18 per 100 | 19 per 100 (12 to 29) | HR 0.98 (0.59 to 1.64) | 341 | ⊕⊕⊕⊝ | HR > 1 indicates a clinical |
| Time to withdrawal of allocated treatment (retention time) ‐ stratified by epilepsy type: partial onset seizures Range of follow‐up (all participants): 1‐91 months | 39 per 100 | 34 per 100 (23 to 49) | HR 1.20 (0.74 to 1.95) | 187 (4 studies) | ⊕⊕⊕⊝ | HR > 1 indicates a clinical |
| Time to achieve 12‐month remission (seizure‐free period) ‐ stratified by epilepsy type Range of follow‐up (all participants): 1‐91 months | 67 per 100 | 67 per 100 (58 to 75) | HR 0.98 (0.78 to 1.23)1 | 514 (4 studies) | ⊕⊕⊕⊝ | HR > 1 indicates a clinical |
| Time to achieve 12‐month remission (seizure‐free period) ‐ stratified by epilepsy type: generalised onset seizures (tonic‐clonic only) Range of follow‐up (all participants): 1 ‐ 91 months | 67 per 100 | 69 per 100 (58 to 79) | HR 1.04 (0.77 to 1.40) | 270 (4 studies) | ⊕⊕⊝⊝ | HR > 1 indicates a clinical |
| Time to achieve 12‐month remission (seizure‐free period) ‐ stratified by epilepsy type: partial onset seizures Range of follow up (all participants): 1‐91 months | 67 per 100 | 63 per 100 (50 to 76) | HR 0.90 (0.63 to 1.29) | 244 (4 studies) | ⊕⊕⊕⊝ | HR > 1 indicates a clinical |
| Time to achieve 6‐month remission (seizure‐free period) ‐ stratified by epilepsy type Range of follow‐up (all participants): 1 ‐ 91 months | 60 per 100 | 58 per 100 (51 to 65) | HR 0.95 (0.78 to 1.15)1 | 639 (5 studies) | ⊕⊕⊕⊝ | HR > 1 indicates a clinical |
| Time to achieve 6‐month remission (seizure‐free period) ‐ stratified by epilepsy type: generalised onset seizures (tonic‐clonic only) Range of follow‐up (all participants): 1 ‐ 91 months | 69 per 100 | 66 per 100 (57 to 75) | HR 0.92 (0.72 to 1.18) | 395 (5 studies) | ⊕⊕⊝⊝ | HR > 1 indicates a clinical |
| Time to achieve 6‐month remission (seizure‐free period) ‐ stratified by epilepsy type: partial onset seizures Range of follow‐up (all participants): 1‐91 months | 51 per 100 | 50 per 100 (40 to 62) | HR 0.99 (0.73 to 1.35) | 244 (4 studies) | ⊕⊕⊕⊝ | HR > 1 indicates a clinical |
| Time to first seizure (post‐randomisation) ‐ stratified by epilepsy type Range of follow‐up (all participants): 1‐91 months | 59 per 100 | 62 per 100 (55 to 70) | HR 0.93 (0.75 to 1.14)1 | 639 (5 studies) | ⊕⊕⊝⊝ | HR > 1 indicates a clinical |
| Time to first seizure (post‐randomisation) ‐ stratified by epilepsy type: generalised onset seizures (tonic‐clonic only) Range of follow‐up (all participants): 1‐91 months | 48 per 100 | 47 per 100 (38 to 58) | HR 1.03 (0.77 to 1.39) | 395 (5 studies) | ⊕⊝⊝⊝ | HR > 1 indicates a clinical |
| Time to first seizure (post‐randomisation) ‐ stratified by epilepsy type: partial onset seizures Range of follow‐up (all participants): 1‐91 months | 75 per 100 | 81 per 100 (71 to 89) | HR 0.83 (0.62 to 1.11) | 244 (4 studies) | ⊕⊕⊝⊝ | HR > 1 indicates a clinical |
| *The basis for the assumed risk (e.g. the median control group risk across studies) is provided in footnotes. The assumed risk is calculated as the event rate in the phenytoin treatment group. The corresponding risk (and its 95% confidence interval) is based on the assumed risk in the comparison group and the relative effect of the intervention (and its 95% CI). | ||||||
| GRADE Working Group grades of evidence | ||||||
| 1Pooled HR for all participants adjusted for seizure type. | ||||||
Background
This is an updated version of the original Cochrane review published in 2001 (Tudur Smith 2001)
Description of the condition
Epilepsy is a common neurological condition in which abnormal electrical discharges from the brain cause recurrent unprovoked seizures. Epilepsy is a disorder of many heterogenous seizure types, with an estimated incidence of 33 to 57 per 100,000 person‐years worldwide (Annegers 1999; Hirtz 2007; MacDonald 2000; Olafsson 2005; Sander 1996), accounting for approximately 1% of the global burden of disease (Murray 1994). The lifetime risk of epilepsy onset is estimated to be 1300 to 4000 per 100,000 person years (Hauser 1993; Juul Jenson 1983), and the lifetime prevalence could be as large as 70 million people worldwide (Ngugi 2010). It is believed that with effective drug treatment, up to 70% of individuals with active epilepsy have the potential to go into long‐term remission shortly after starting drug therapy (Cockerell 1995; Hauser 1993; Sander 2004) and around 70% of individuals can achieve seizure freedom using a single antiepileptic drug (AED) in monotherapy (Cockerell 1995). Current National Institute for Health and Care Excellence (NICE) guidelines recommend that both adults and children with epilepsy should be treated with monotherapy wherever possible (NICE 2012). The remaining 30% of individuals experience refractory or drug‐resistant seizures, which often require treatment with combinations of antiepileptic drugs (AEDs) or alternative treatments, such as epilepsy surgery (Kwan 2000).
We studied two seizure types in this review: generalised onset seizures in which electrical discharges begin in one part of the brain and move throughout the brain, and partial onset seizures in which the seizure is generated in and affects one part of
the brain (the whole hemisphere of the brain or part of a lobe of the brain).
Description of the intervention
The majority of people with epilepsy have their seizures controlled by a single drug (monotherapy) (Cockerell 1995). Worldwide, phenytoin and valproate are commonly used antiepileptic drugs licensed for monotherapy. Phenytoin is used as a first‐line drug in low‐ and middle‐income countries as it is a low cost drug and can be given as a single daily dose, but is no longer considered a first‐line agent in the USA and much of Europe due to worries over adverse events (Wallace 1997; Wilder 1995). Phenytoin is associated with long‐term cosmetic changes including gum hyperplasia, acne and coarsening of the facial features (Mattson 1985; Scheinfeld 2003), as well as low folic acid levels, predisposing participants to megaloblastic anaemia (Carl 1992), and is associated with congenital abnormalities (Gladstone 1992; Morrow 2006; Meador 2008; Nulman 1997), particularly foetal hydantoin syndrome (Scheinfeld 2003). Furthermore, due to the pharmacokinetic profile of phenytoin, the plasma concentrations are difficult to predict and dosing will usually need to be informed by measuring plasma concentration. Valproate has also been shown to have teratogenic properties (Canger 1999; Morrow 2006; Tomson 2011), and is particularly associated with spina bifida and cardiac, craniofacial, skeletal and limb defects known as 'valproate syndrome' (Ornoy 2009). A systematic review found valproate to have the highest incidence of congenital malformations of standard antiepileptic drugs (Meador 2008), and a recent study has shown an increased prevalence of neurodevelopmental disorders following prenatal valproate exposure (Bromley 2013). Valproate is also associated with weight gain in adults (Dinesen 1984; Easter 1997) and children (Egger 1981; Novak 1999).
How the intervention might work
It is generally believed that valproate monotherapy is more effective than phenytoin monotherapy in generalised onset seizures (generalised tonic‐clonic seizures, absence, and myoclonus), while phenytoin monotherapy is more effective than valproate monotherapy in partial onset seizures (simple partial, complex partial, and secondary generalised tonic‐clonic seizures) (Chadwick 1994), although there is no conclusive evidence from individual randomised controlled trials (RCTs) to support this belief. Evidence in favour of valproate for generalised seizures is predominantly anecdotal from observational studies, suggesting a dramatic benefit with valproate in juvenile myoclonic epilepsy (Delgado‐Escueta 1984; Penry 1989), and reports of efficacy of valproate against absence seizures (Bourgeois 1987; Jeavons 1977). The results of two RCTs, recruiting children indicate that valproate may be better tolerated in children than phenytoin (De Silva 1996; Thilothammal 1996); twice as many children experienced at least one side effect on phenytoin than valproate in Thilothammal 1996, and phenytoin was more likely to be withdrawn due to unacceptable side effects than valproate in De Silva 1996.
Some animal models have suggested that phenytoin has either no effect in absence seizures or may in fact worsen seizures (Liporace 1994). There is also anecdotal evidence that phenytoin may cause paradoxical intoxication (increased seizure frequency with increased anticonvulsant dose) and encephalopathy (Troupin 1975; Vallarta 1974).
Why it is important to do this review
Accepting that phenytoin should not be a drug of first choice for individuals experiencing absence, myoclonic and atonic seizures, we still have insufficient evidence from RCTs to guide a choice between phenytoin and valproate for individuals with generalised onset tonic‐clonic seizures or partial onset seizures. The aim of this review, therefore, is to summarise efficacy and tolerability data from existing trials comparing phenytoin and valproate when used as monotherapy treatments.
There are difficulties in undertaking a systematic review of epilepsy monotherapy trials, as the important efficacy outcomes require analysis of time‐to‐event data (for example, time to first seizure after randomisation). Although methods have been developed to synthesise time‐to‐event data using summary information (Parmar 1998; Williamson 2002), the appropriate statistics are not commonly reported in published epilepsy trials.
Furthermore, although seizure data have been collected in most epilepsy monotherapy trials, there has been no uniformity in the definition and reporting of outcomes. For example, trials may report time to 12‐month remission but not time to first seizure or vice versa, or some trials may define time to first seizure from the date of randomisation, while others use date of achieving maintenance dose. Trial investigators have also adopted differing approaches to the analysis, particularly with respect to the censoring of time‐to‐event data. For these reasons, we performed this review using individual participant data (IPD) which helps to overcome these problems. This review is one in a series of Cochrane IPD reviews investigating pair‐wise monotherapy comparisons. These data have also been included in a network meta‐analysis (Tudur Smith 2007), undertaken following a previous version of this review.
Objectives
To review the time to withdrawal, remission and first seizure of phenytoin compared to valproate when used as monotherapy in people with partial onset seizures or generalised tonic‐clonic seizures (with or without other generalised seizure types).
Methods
Criteria for considering studies for this review
Types of studies
-
Randomised controlled trials (RCTs) using either:
-
an adequate method of allocation concealment (e.g. sealed opaque envelopes); or
-
a 'quasi' method of randomisation (e.g. allocation by date of birth).
-
-
Studies may be double‐blind, single‐blind or unblinded.
-
Studies must include a comparison of phenytoin monotherapy with valproate monotherapy in individuals with epilepsy.
Types of participants
-
Children or adults with partial onset seizures (simple partial, complex partial, or secondarily generalised tonic‐clonic seizures) or generalised onset tonic‐clonic seizures (with or without other generalised seizure types).
-
Individuals with a new diagnosis of epilepsy, or who have had a relapse following antiepileptic monotherapy withdrawal.
Types of interventions
Phenytoin or valproate as monotherapy.
Types of outcome measures
Below is a list of outcomes investigated in this review. Reporting of these outcomes in the original trial report was not an eligibility requirement for inclusion in this review.
Primary outcomes
-
Time to withdrawal of allocated treatment (retention time).
This is a combined outcome reflecting both efficacy and tolerability, as treatment may be withdrawn due to continued seizures, adverse events or a combination of both. This is an outcome to which the participant makes a contribution, and is the primary outcome measure recommended by the Commission on Antiepileptic Drugs of the International League Against Epilepsy (Commission 1998; ILAE 2006).
Secondary outcomes
-
Time to achieve 12‐month remission (seizure‐free period).
-
Time to achieve six‐month remission (seizure‐free period).
-
Time to first seizure (post‐randomisation).
Search methods for identification of studies
Electronic searches
We searched the following databases. We did not impose any language restrictions.
-
The Cochrane Epilepsy Group's Specialised Register (19 May 2015) using the search strategy outlined in Appendix 1.
-
The Cochrane Central Register of Controlled Trials (CENTRAL; the Cochrane Library; 2015, Issue 4) using the search strategy outlined in Appendix 2.
-
MEDLINE (Ovid, 1946 to 19 May 2015) using the search strategy outlined in Appendix 3.
-
SCOPUS (19 February 2013) using the search strategy outlined in Appendix 4. SCOPUS was searched as an alternative to EMBASE, but this is no longer necessary, because randomised and quasi‐RCTs in EMBASE are now included in CENTRAL, so the SCOPUS search is not being updated.
-
ClinicalTrials.gov (19 May 2015) using the search terms 'phenytoin and valproate and epilepsy'.
-
WHO International Clinical Trials Registry Platform ICTRP (19 May 2015) using the search terms 'phenytoin and valproate and epilepsy'.
Searching other resources
In addition, we handsearched relevant journals, reviewed the reference lists of retrieved studies to search for additional reports of relevant studies, contacted Sanofi (manufacturers of valproate in Europe), Abbott (manufacturers of valproate in the USA), Parke‐Davis (manufacturers of phenytoin), and experts in the field for information about any ongoing studies.
Data collection and analysis
Selection of studies
Two review authors (SJN and AGM) independently assessed trials for inclusion, resolving any disagreements by mutual discussion.
Data extraction and management
We requested the following individual participant data (IPD) for all trials meeting our inclusion criteria.
(1) Trial methods:
-
method of generation of random list;
-
method of concealment of randomisation;
-
stratification factors;
-
blinding methods.
(2) Participant covariates:
-
gender;
-
age;
-
seizure types;
-
time between first seizure and randomisation;
-
number of seizures prior to randomisation (with dates);
-
presence of neurological signs;
-
Electroencephalographic (EEG) results;
-
Computerised tomography/magnetic resonance imaging (CT/MRI) results.
(3) Follow‐up data:
-
treatment allocation;
-
date of randomisation;
-
dates of follow‐up;
-
dates of seizures post‐randomisation or seizure frequency data between follow‐up visits;
-
dates of treatment withdrawal and reasons for treatment withdrawal;
-
dose;
-
dates of dose changes.
For each trial for which IPD were not obtained, we carried out an assessment to see whether any relevant aggregate level data had been reported. If possible, SJN extracted any aggregate level data from publications and extracted data were verified by JW.
-
For three trials, seizure data were provided in terms of the number of seizures recorded between clinic visits rather than specific dates of seizures (Craig 1994; Ramsay 1992; Turnbull 1985). To enable time‐to‐event outcomes to be calculated, we applied linear interpolation to approximate the dates on which seizures occurred. For example, if four seizures were recorded between two visits which occurred on 1st March and 1st May (an interval of 61 days), then date of first seizure would be approximately 13th March. This allowed an estimate of the time to achieve six‐month and 12‐month remission and the time to first seizure to be computed.
-
We calculated time to achieve six‐month and 12‐month remission from the date of randomisation to the date (or estimated date) the individual had first been free of seizures for six or 12 months, respectively. If the person had one or more seizure(s) in the titration period, a six‐month or 12‐month seizure‐free period could also occur between the estimated date of the last seizure in the titration period and the estimated date of the first seizure in the maintenance period.
-
We calculated time to first seizure from the date of randomisation to the date that their first seizure was estimated to have occurred. If seizure data were missing for a particular visit, these outcomes were censored at the previous visit. These outcomes were also censored if the individual died or if follow‐up ceased prior to the occurrence of the event of interest. These methods had been used in the remaining two trials for which outcome data were provided directly (De Silva 1996; Heller 1995).
-
Withdrawal data were not available for one trial (Craig 1994). For two trials, we extracted dates and reason for treatment withdrawal from trial case report forms for the original review (De Silva 1996; Heller 1995). Two review authors (SJN and AGM) independently extracted data from all case report forms, resolving disagreements by reconsidering the case report forms at conference. For the remaining trials, data on length of time spent in trial and reason for withdrawal of allocated treatment were provided directly. For the analysis of time‐to‐event, an 'event' was defined as either the withdrawal of the allocated treatment due to poor seizure control or adverse events or both. Non‐compliance with the treatment regimen or the addition of another antiepileptic drug were also classed as 'events'. The outcome was censored if treatment was withdrawn because the individual achieved a period of remission or if the individual was still on allocated treatment at the end of follow‐up.
Assessment of risk of bias in included studies
Two review authors (SJN and JW) independently assessed all included studies for risk of bias using the Cochrane Risk of Bias tool for RCTs (Higgins 2011); resolving any disagreements by discussion.
Measures of treatment effect
We measured all outcomes in this review as time‐to‐event outcomes using the hazard ratio (HR) as the measure of treatment effect. We calculated outcomes from IPD provided where possible, or extracted them from published studies.
Unit of analysis issues
We did not have any unit of analysis issues. The unit of allocation and analysis was individual for all included studies and no studies were of a repeated measure (longitudinal) nature or of a cross‐over design.
Dealing with missing data
For each trial where IPD were supplied, we reproduced results from trial results where possible, and performed consistency checks.
-
We cross‐checked trial details against any published report of the trial and contacted original trial authors if we found missing data, errors or inconsistencies.
-
We reviewed the chronological randomisation sequence, and checked the balance of prognostic factors, taking account of factors stratified for in the randomisation procedure.
Assessment of heterogeneity
We assessed heterogeneity statistically using the Q test (P < 0.10 for significance) and the I² statistic (greater than 50% indicating considerable heterogeneity; Higgins 2003) and visually by inspecting forest plots.
Assessment of reporting biases
Two review authors (SJN and JW) undertook all full quality and risk of bias assessments. In theory, a review using IPD should overcome issues of reporting biases, as unpublished data can be provided and unpublished outcomes calculated. Any selective reporting bias detected could be assessed with the ORBIT classification system (Kirkham 2010).
Data synthesis
We carried out our analysis on an intention‐to‐treat basis (that is, participants were analysed in the group to which they were randomised, irrespective of which treatment they actually received). Therefore for the time‐to‐event outcomes: 'Time to achieve six‐month remission', 'Time to achieve 12‐month remission' and 'Time to first seizure (post‐randomisation)', participants were not censored if treatment was withdrawn.
For all outcomes, we investigated the relationship between the time‐to‐event and treatment effect of the anti‐epileptic drugs. We used Cox proportional hazards regression models to obtain study‐specific estimates of log(HR) or treatment effect and associated standard errors in statistical software SAS version 9.2. (Copyright, SAS Institute Inc. SAS and all other SAS Institute Inc. product or service names are registered trademarks or trademarks of SAS Institute Inc., Cary, NC, USA.). The model assumes that the ratio of hazards (risks) between the two treatment groups is constant over time (i.e. hazards are proportional). This proportional hazards assumption of the Cox regression model was tested for each outcome of each study by testing the statistical significance of a time‐varying covariate in the model. We evaluated overall estimates of HRs (with 95% confidence intervals (CIs)) using the generic inverse variance method.
Results are expressed as a HR and a 95% CI. By convention, a HR greater than 1 indicates that an event is more likely to occur earlier on phenytoin than on valproate. Hence, for time to withdrawal of allocated treatment or time to first seizure, a HR greater than 1 indicates a clinical advantage for valproate (e.g. HR = 1.2 would suggest a 20% increase in risk of withdrawal from phenytoin compared to valproate), and for time to achieve six‐month and 12‐month remission, a HR greater than 1 indicates a clinical advantage for phenytoin.
Subgroup analysis and investigation of heterogeneity
Due to the strong clinical belief that valproate is more effective in generalised onset seizures, while phenytoin is more effective in partial onset seizures, we have stratified all analyses by seizure type (partial onset versus generalised onset), according to the classification of main seizure type at baseline. We classified partial seizures (simple or complex) and partial secondarily generalised seizures as partial epilepsy. We classified primarily generalised seizures as generalised epilepsy. We conducted a Chi² test of interaction between treatment and epilepsy type.
If we found significant statistical heterogeneity to be present, we performed meta‐analysis with a random‐effects model in addition to a fixed‐effect model, presenting the result of both models and performing sensitivity analyses to investigate differences in study characteristics.
Sensitivity analysis
As misclassification of seizure type is a recognised problem in epilepsy (whereby some individuals with generalised seizures have been mistakenly classed as having partial onset seizures and vice versa), we investigated its potential impact on results in a sensitivity analysis. Given clinical evidence that individuals with generalised onset seizures are unlikely to have an 'age of onset' greater than 25 to 30 years (Malafosse 1994), we examined the distribution of age at onset for individuals with generalised seizures. We undertook two sensitivity analyses to investigate misclassification.
-
We reclassified all individuals with generalised seizure types and age at onset greater than 30 into an 'uncertain seizure type' group.
-
We reclassified individuals with generalised seizures and age of onset greater than 30 as having partial onset seizures.
Summary of Findings and Quality of the Evidence (GRADE)
For the 2013 update, we added summary of findings Table for the main comparison to the review (outcomes in the tables decided before the update started based on clinical relevance).
Quality of the evidence was determined using the GRADE approach; where evidence was downgraded in the presence of high risk of bias in at least one trial, indirectness of the evidence, unexplained heterogeneity or inconsistency, imprecision of results, high probability of publication bias. Evidence was downgraded by one level if the limitation was considered serious and two levels if considered very serious; as judged by the review authors. Under the GRADE approach, evidence may also be upgraded if a large treatment effect is demonstrated with no obvious biases or if a dose‐response effect exists.
Results
Description of studies
Results of the search
We identified 334 records from the databases and search strategies outlined in Electronic searches. We found no further records by searching other resources. We removed 126 duplicate records and screened 208 records (title and abstract) for inclusion in the review. We excluded 178 records based on title and abstract and assessed 30 full‐text articles for inclusion in the review. We excluded 19 studies from the review (see Excluded studies below) and included 11 trials in the review (see Included studies below). We updated the searches in May 2015, resulting in 35 hits. We removed 7 duplicate records and screened 28 records (title and abstract); we excluded all 28 records.
See Figure 1 for PRISMA study flow diagram of previous searches and the most recent search in May 2015

Study flow diagram.
Included studies
We included 11 trials in the review (Callaghan 1985; Czapinski 1997a; Craig 1994; De Silva 1996; Forsythe 1991; Heller 1995; Ramsay 1992; Rastogi 1991; Shakir 1981; Thilothammal 1996; Turnbull 1985). One trial was available in abstract form only (Czapinski 1997a).
Four trials recruited individuals of all ages (Callaghan 1985; Ramsay 1992; Rastogi 1991; Shakir 1981), three trials recruited adults only (Czapinski 1997a; Heller 1995; Turnbull 1985), three trials recruited children only (De Silva 1996; Forsythe 1991; Thilothammal 1996), and one trial recruited elderly individuals only (Craig 1994). One trial recruited individuals with partial onset seizures only (Czapinski 1997a), two trials recruited individuals with generalised onset seizures only (Ramsay 1992; Thilothammal 1996), seven trials recruited individuals with partial onset seizures and generalised onset seizures (Callaghan 1985; Craig 1994; De Silva 1996; Heller 1995; Rastogi 1991; Shakir 1981; Turnbull 1985), and one trial did not provide information on the seizure types of individuals recruited (Forsythe 1991). Nine trials recruited individuals with new onset seizures only (Callaghan 1985; Craig 1994; Czapinski 1997a; De Silva 1996; Forsythe 1991; Heller 1995; Ramsay 1992; Thilothammal 1996; Turnbull 1985), 64% of individuals in one trial had new onset seizures, while the remaining individuals had uncontrolled seizures on current therapy (Shakir 1981), and one trial did not specify whether individuals were newly diagnosed (Rastogi 1991). Seven trials were conducted in Europe (Callaghan 1985; Craig 1994; Czapinski 1997a; De Silva 1996; Forsythe 1991; Heller 1995; Turnbull 1985), one trial in the USA (Ramsay 1992), two trials in India (Rastogi 1991; Thilothammal 1996), and one trial in two centres in Europe and New Zealand (Shakir 1981).
Individual participant data (IPD) were not provided for six of these trials (Callaghan 1985; Czapinski 1997a; Forsythe 1991; Rastogi 1991; Shakir 1981; Thilothammal 1996), in which a total of 450 individuals had been randomised to either phenytoin or valproate. None of these six trials reported the specific time‐to‐event outcomes chosen for this systematic review.
Two trials presented times at which the allocated drug was withdrawn and the reason for withdrawal in the trial publication for each individual (Forsythe 1991; Shakir 1981). Hence, these two trials could be incorporated into the analysis of 'Time to withdrawal of allocated treatment'; one of the trials also presented information by seizure type (partial onset or generalised onset seizures) and therefore could also be included in the stratified analysis for 'Time to withdrawal of allocated treatment' (Shakir 1981). Shakir 1981 presents 'Time on trial drug' in months for each participant; therefore to calculate 'Time to withdrawal of allocated treatment', we assumed that if 'Time spent on trial drug' was five months, the individual spent five full months (152 full days) on the trial drug before withdrawal. Forsythe 1991 presents 'Withdrawal and time of occurrence by month' for each participant; therefore to calculate 'Time to withdrawal of allocated treatment', we assumed that if withdrawal occurred during the fifth month, that withdrawal occurred halfway between the fifth and sixth month (i.e. participants spent 167 full days on treatment before withdrawal).
We could not extract sufficient aggregate data from the trial publication in any other trial, and we therefore could not include them in data synthesis. Full details of outcomes considered and a summary of results of each trial for which IPD were not available to us can be found in Table 1.
| Trial | Outcomes reported | Summary of results |
| 1. Seizure control: (a) excellent (seizure‐free) (b) good (> 50% reduction) (c) poor (< 50% reduction) 2. Adverse events | 1. PHT (n = 58); SV (n = 64) (a) 39 (67%) 34 (53%) (b) 7 (12%) 16 (25%) (c) 12 (21%) 14 (22%) 2. 6 (10%) 7 (11%) | |
| 1. Proportion achieving 24‐month remission at 3 years 2. Proportion excluded after randomisation due to adverse events or no efficacy | 1. PHT: 59%; SV: 64% 2. PHT: 23%; SV: 23% | |
| 1. Cognitive assessments 2. Withdrawals from randomised drug | 1. Significant difference favouring SV test of speed of information processing (P < 0.01) No significant differences between treatment groups for any other cognitive tests 2. PHT: 6/20 (30%); SV: 7/21 (33%) | |
| 1. Reduction in frequency of seizures at 24 weeks: (a) excellent (100% reduction) (b) good (75%‐99% reduction) (c) fair (50%‐74% reduction) (d) poor (< 50% reduction) 2. Adverse events | 1. PHT (n = 45); SV (n = 49) (a) 23 (51%) 24 (49%) (b) 13 (24%) 17 (35%) (c) 8 (18%) 5(10%) (d) 1 (2%) 3 (6%) 2. All reported adverse events were minor PHT: gum hyperplasia (18%), nystagmus (13%), gastrointestinal symptoms (4%), drowsiness (4%), ataxia (2%) SV: gastrointestinal symptoms (12%), drowsiness (6%), weight gain (2%) | |
| 1.Seizures during treatment 2. Adverse events | 1. PHT: 5 (33%); SV: 7 (39%) 2. PHT: 1 case of ataxia, 5 cases of acne. SV: 2 cases of gastrointestinal symptoms, 2 cases of hair loss, 4 cases of weight gain | |
| 1. Recurrence of seizures 2. Adverse events | 1. PHT: 14/52 (27%) SV: 10/48 (21%) 2. PHT: 33/52 (63%) SV: 15/48 (31%) |
PHT: phenytoin; SV: sodium valproate
Individual participant data were provided by trial authors for the remaining five trials which recruited a total of 669 participants, representing 60% of individuals from all 1119 eligible participants identified in eligible trials (Craig 1994; De Silva 1996; Heller 1995; Ramsay 1992; Turnbull 1985). Data were converted from paper format to computer datasets in two trials (Ramsay 1992; Turnbull 1985), computerised data were provided directly in one trial (Craig 1994), and a combination of both (although mostly computerised) were supplied by the authors of two trials (De Silva 1996; Heller 1995).
Data were available for the following participant characteristics (percentage of participants with data available): gender (100%); seizure type (100%); age at randomisation (99%); number of seizures in the six months prior to randomisation (79%); and time since first seizure to randomisation (73%). Electroencephalographic (EEG) data had been recorded for all five trials, but only computerised in two trials (Craig 1994; Turnbull 1985;). Similar difficulties were encountered with computerised tomography/magnetic resonance imaging (CT/MRI) data, and neurological examination findings.
One trial recruited only individuals with generalised onset tonic‐clonic seizures, some of whom were experiencing other generalised seizure types such as absence or myoclonus (Ramsay 1992). All generalised seizure types were recorded during follow‐up for this trial. The remaining four trials recruited individuals with partial onset seizures (simple/complex partial or secondarily generalised tonic‐clonic) and individuals with generalised onset tonic‐clonic seizures. For the individuals with generalised onset tonic‐clonic seizures recruited into these four trials, other generalised seizure types were not recorded during follow‐up. As a result, the majority of the data from the five trials does not address the treatment of generalised seizure types, such as absence or myoclonus, but applies only to generalised onset tonic‐clonic seizures. In our primary analysis, we use only the data for generalised onset tonic‐clonic seizures during follow‐up as this is the most consistent approach; we also report a sensitivity analysis which includes data on all generalised seizure types from Ramsay 1992.
Excluded studies
We excluded 14 duplicate trials (Berg 1993; Callaghan 1981; Callaghan 1983; Callaghan 1984; Craig 1993; Czapinski 1997b; Czapinski 1997c; Goggin 1984; Goggin 1986; Shakir 1980; Tallis 1994a; Tallis 1994b; Turnbull 1982; Wilder 1983), and we retained the most relevant primary reference for each trial in the review. One trial was not randomised (Zeng 2010), and four did not make a randomised comparison between phenytoin and valproate (Jannuzzi 2000; Kaminow 2003; Sabers 1995; Schmidt 2007; see Characteristics of excluded studies for detailed reasons for exclusion).
Risk of bias in included studies
For further details see Characteristics of included studies, Figure 2 and Figure 3.
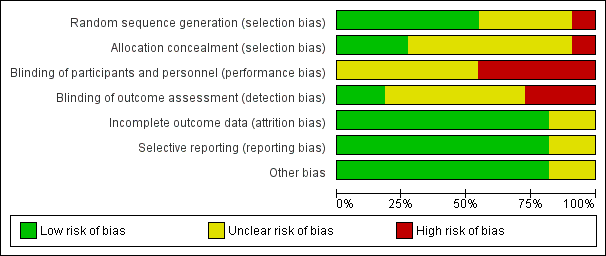
'Risk of bias' graph: review authors' judgements about each risk of bias item presented as percentages across all included studies.
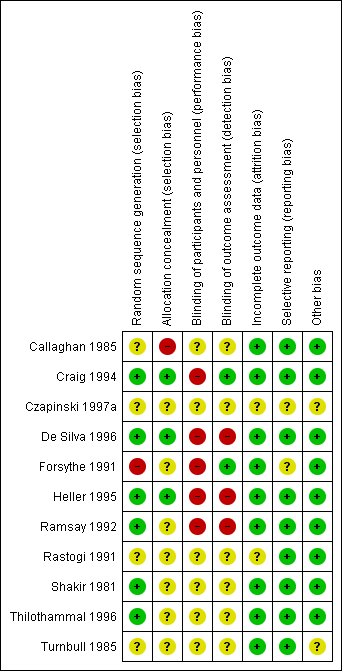
'Risk of bias' summary: review authors' judgements about each risk of bias item for each included study.
Allocation
(1) Trials for which individual participant data (IPD) were provided
Three trials reported adequate methods of randomisation and allocation concealment; two trials used permuted blocks to generate a random list and concealed allocation by using sealed opaque envelopes (De Silva 1996; Heller 1995). One trial used a computer minimisation programme and a pharmacy‐controlled allocation (Craig 1994); we judged these trials to be at low risk of bias for random sequence generation and allocation concealment. One trail reported that random number tables were used but did not report sufficient information about methods of allocation concealment. One trial did not report sufficient information about methods of randomisation and allocation concealment (Ramsay 1992; Turnbull 1985).
(2) Trials for which no IPD were available
Two trials reported adequate methods of randomisation: telephone randomisation in Shakir 1981, and a computer‐generated list of randomised numbers in Thilothammal 1996; we judged these studies at low risk of bias for random sequence generation. Two trials reported no information on methods of randomisation (Czapinski 1997a; Rastogi 1991) (unclear risk of bias), one trial reported unclear information on randomisation (Callaghan 1985) (unclear risk of bias), and one trial reported an inadequate method of randomisation, i.e. quota allocation (Forsythe 1991) (high risk of bias). We judged five of the six trials to be at unclear risk of bias as they reported no information on allocation concealment (Czapinski 1997a; Forsythe 1991; Rastogi 1991; Shakir 1981; Thilothammal 1996), and one trial at high risk of bias as it reported an inadequate method of allocation concealment based on 'drug of first preference' (Callaghan 1985).
Blinding
(1) Trials for which IPD were provided
One trial was single‐blinded (outcome assessor for cognitive testing) (Craig 1994) (low risk of bias), three trials were unblinded for "practical and ethical reasons" (De Silva 1996; Heller 1995; Ramsay 1992) (high risk of bias), and one trial provided no information on blinding (Turnbull 1985) (unclear risk of bias).
(2) Trials for which no IPD were available
One trial was described as double‐blinded (Thilothammal 1996) but it was unclear who was blinded, one trial was single‐blinded (outcome assessor for cognitive testing) (Forsythe 1991), and no information was provided on blinding in the other trials (Callaghan 1985; Czapinski 1997a; Rastogi 1991; Shakir 1981).
Incomplete outcome data
(1) Trials for which IPD were provided
In theory, a review using IPD should overcome issues of attrition bias, as unpublished data can be provided, unpublished outcomes calculated and all randomised participants can be analysed by an intention‐to‐treat approach. All five trials reported attrition rates and provided IPD for all randomised individuals (Craig 1994; De Silva 1996; Heller 1995; Ramsay 1992; Turnbull 1985); we judged all five trials at low risk of attrition bias.
(2) Trials for which no IPD were available
Four trials reported attrition rates and analysed all randomised participants using an intention‐to‐treat approach (Callaghan 1985; Forsythe 1991; Shakir 1981; Thilothammal 1996); low risk of attrition bias. Two trials did not provide sufficient information to assess attrition bias (Czapinski 1997a; Rastogi 1991); unclear risk of attrition bias.
Selective reporting
The authors of Craig 1994 provided a protocol; the outcomes specified in the protocol were consistent with the outcomes reported in the publication, and we therefore judged the risk of selective reporting bias to be low. Protocols were not available for any of the other ten included trials so we made a judgement of the risk of bias based on the information included in the publications (see Characteristics of included studies for more information). We judged eight of the other 10 studies at low risk of reporting bias; Czapinski 1997a and Forsythe 1991 were judged at unclear risk of reporting bias.
(1) Trials for which IPD were provided
In theory, a review using individual participant data should overcome issues of reporting biases, as unpublished data can be provided and unpublished outcomes calculated. Sufficient IPD were provided to calculate the four outcomes: 'Time to withdrawal of allocated treatment', 'Time to achieve six‐month remission', 'Time to achieve 12‐month remission' and 'Time to first seizure' for four of the five trials (De Silva 1996; Heller 1995; Ramsay 1992; Turnbull 1985). Withdrawal information was not provided for one trial (Craig 1994), so we could not calculate 'Time to withdrawal of allocated treatment', but we had sufficient information to calculate the other three outcomes.
(2) Trials for which no IPD were available
Seizure outcomes and adverse events were well reported in four trials (Callaghan 1985; Rastogi 1991; Shakir 1981; Thilothammal 1996); low risk of reporting bias. One trial reported cognitive outcomes and adverse events, but no seizure outcomes (Forsythe 1991); however as no protocol was available for this trial we do not know whether seizure outcomes were planned a priori, and we judged this trial at unclear risk of reporting bias. One trial was in abstract form only and did not provide sufficient information to assess selective reporting bias (Czapinski 1997a); also judged at unclear risk of reporting bias.
Other potential sources of bias
We detected no other potential sources of bias in any of the 11 trials included in the review.
Effects of interventions
See: Summary of findings for the main comparison
A summary of the outcomes reported in trials for which no IPD were available are reported in Table 1. Details regarding the number of individuals (with IPD) contributing to each analysis are given in Table 2. All results are summarised in Table 3 and Metaview. Survival curve plots are shown in Figure 4, Figure 5, Figure 6, Figure 7, Figure 8, Figure 9, Figure 10, and Figure 11. All survival curve plots were produced in Stata software version 11.2 using data from all trials providing IPD combined (Stata 2009). We would have liked to stratify by trial in survival curve plots, but we do not know of any software which allows for this; we hope that such software may be developed for future updates of this review.
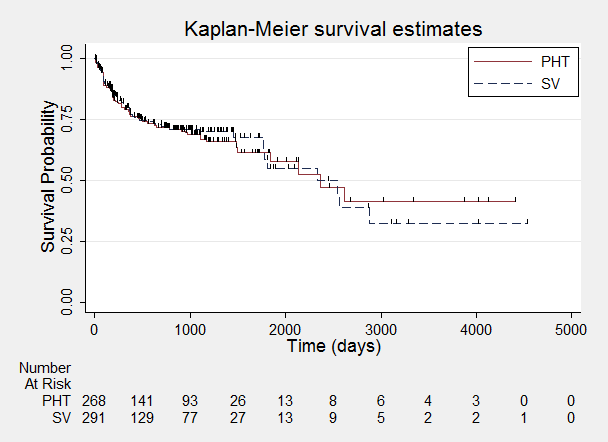
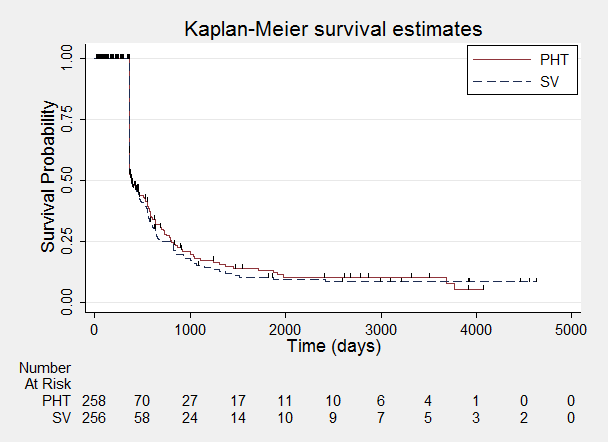
Time to withdrawal of allocated treatment.
One participant randomised to phenytoin (PHT) and nine participants randomised to valproate (SV) had time to withdrawal of zero days, and are therefore not included in "Number at Risk".
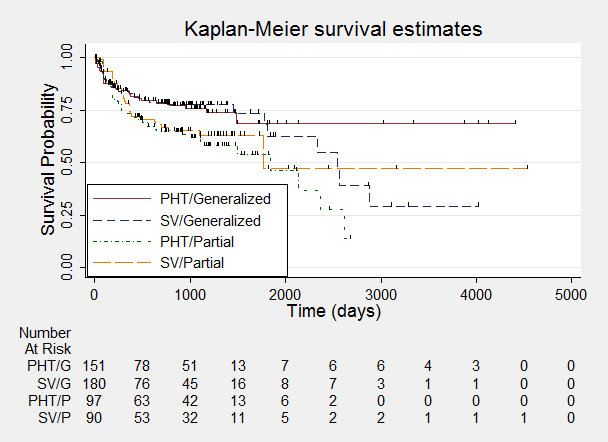
Time to withdrawal of allocated treatment ‐ stratified by epilepsy type.
One participant with generalised epilepsy randomised to phenytoin (PHT) and nine participants with generalised epilepsy randomised to valproate (SV) had time to withdrawal of zero days, and are therefore not included in "Number at Risk".
Time to achieve 12‐month remission.

Time to achieve 12‐month remission ‐ stratified by epilepsy type.
Time to achieve six‐month remission.

Time to achieve six‐month remission ‐ stratified by epilepsy type.

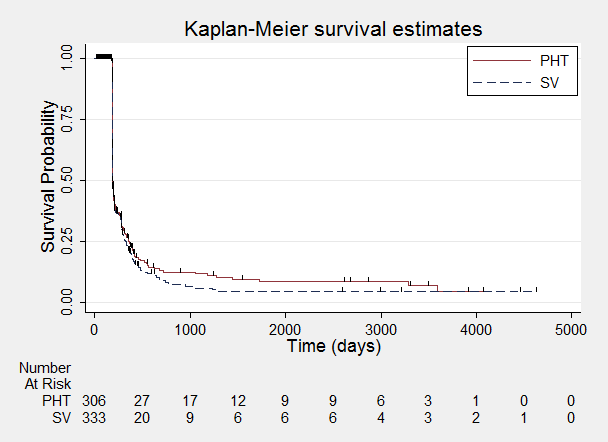
Time to first seizure.

Time to first seizure ‐ stratified by epilepsy type.
| Trial | Number randomised | Time to withdrawal of allocated treatment | Time to achieve 12‐month remission | Time to achieve 6‐month remission | Time to first seizure | ||||||||||
| PHT | SV | Total | PHT | SV | Total | PHT | SV | Total | PHT | SV | Total | PHT | SV | Total | |
| 81 | 85 | 166 | 0 | 0 | 0 | 71 | 76 | 147 | 71 | 76 | 147 | 71 | 76 | 147 | |
| 54 | 49 | 103 | 53 | 47 | 100 | 54 | 49 | 103 | 54 | 49 | 103 | 54 | 49 | 103 | |
| 20 | 21 | 41 | 20 | 21 | 41 | 0 | 0 | 0 | 0 | 0 | 0 | 0 | 0 | 0 | |
| 63 | 61 | 124 | 61 | 58 | 119 | 63 | 61 | 124 | 63 | 61 | 124 | 63 | 61 | 124 | |
| 50 | 86 | 136 | 50 | 86 | 136 | 0 | 0 | 0 | 48 | 77 | 125 | 48 | 77 | 125 | |
| 70 | 70 | 140 | 70 | 70 | 140 | 70 | 70 | 140 | 70 | 70 | 140 | 70 | 70 | 140 | |
| 15 | 18 | 33 | 15 | 18 | 33 | 0 | 0 | 0 | 0 | 0 | 0 | 0 | 0 | 0 | |
| Total | 353 | 390 | 743 | 269 | 300 | 569 | 258 | 256 | 514 | 306 | 333 | 639 | 306 | 333 | 639 |
1Withdrawal information not provided for Craig 1994, so cannot contribute to 'Time to withdrawal of allocated treatment'.
2Follow‐up for Ramsay 1992 is less than 12 months so cannot contribute to 'Time to achieve 12‐month remission'.
3Data extracted from Forsythe 1991 and Shakir 1981 publications to calculate time to withdrawal of allocated treatment. Insufficient published data to calculate other outcomes.
PHT: phenytoin; SV: sodium valproate
| Statistic | Time to withdrawal of allocated treatment | Time to achieve 12‐month remission | Time to achieve six‐month remission | Time to first seizure | |
| Test for heterogeneity | Chi² | (df = 5) 5.95 | (df = 3) 0.19 | (df = 4) 1.66 | (df = 4) 4.23 |
| P value | 0.31 | 0.98 | 0.80 | 0.38 | |
| I² | 16% | 0% | 0% | 5% | |
| Overall effect | HR (95% CI) | 1.02 (0.73 to 1.49) | 0.97 (0.77 to 1.22) | 0.92 (0.76 to 1.12) | 0.96 (0.78 to 1.18) |
| P value | 0.92 | 0.81 | 0.42 | 0.70 | |
| Test for interaction between treatment and epilepsy type | Chi² | (df = 1) 0.31 | (df = 1) 0.39 | (df = 1) 0.13 | (df = 1) 1.06 |
| P value | 0.58 | 0.53 | 0.72 | 0.3 | |
| I² | 0% | 0% | 0% | 5.6% | |
| Overall effect adjusted for epilepsy type | HR (95% CI) | 1.09 (0.76 to 1.55) | 0.98 (0.78 to 1.23) | 0.95 (0.78 to 1.15) | 0.93 (0.75 to 1.14) |
| P value | 0.19 | 0.87 | 0.60 | 0.47 |
CI: confidence interval; df: degrees of freedom of Chi² distribution; HR: Hazard ratio; P < 0.05 is classified as statistically significant
All hazard ratios (HRs) presented below are calculated by generic inverse variance fixed‐effect meta‐analysis unless otherwise stated.
(1) Time to withdrawal of allocated treatment (retention time)
For this outcome, a HR greater than one indicates a clinical advantage for valproate.
Unadjusted analysis
Time to withdrawal of allocated treatment and reason for withdrawal were available for 495 individuals from four trials (De Silva 1996; Heller 1995; Ramsay 1992; Turnbull 1985); 74% of individuals from five trials providing IPD (44% of all 1119 eligible individuals). Withdrawal data were not available for the fifth trial (Craig 1994). Sufficient IPD were available in the trial publications for a further 74 individuals from two trials (Forsythe 1991; Shakir 1981). Therefore, a total of 569 individuals (51% of 1119 eligible individuals) from six trials could contribute to the analysis of this outcome; 146 (26%) prematurely withdrew from treatment, 72/269 participants (27%) randomised to phenytoin and 74/300 participants (25%) randomised to valproate. See Table 4 for reasons for premature termination of the study by treatment and how we classified these withdrawals in analysis.
| Reason for early termination | Classification | De Silva 19962 | Heller 19952,3 | Ramsey 1992 | Turnbull 1985 | Total1 | |||||
| PHT n = 53 | SV n = 47 | PHT n = 63 | SV n = 58 | PHT n = 50 | SV n = 86 | PHT n = 70 | SV n = 70 | PHT n = 236 | SV n = 261 | ||
| Adverse events/intoxication | Event | 2 | 2 | 1 | 4 | 5 | 7 | 14 | 7 | 22 | 20 |
| Poor seizure control/lack of efficacy | Event | 10 | 11 | 8 | 9 | 2 | 1 | 0 | 2 | 20 | 23 |
| Both adverse events and lack of efficacy | Event | 5 | 4 | 2 | 6 | 0 | 0 | 2 | 1 | 9 | 11 |
| Non‐compliance | Event | 0 | 0 | 0 | 0 | 1 | 7 | 2 | 2 | 3 | 9 |
| Participant went into remission | Censored | 24 | 16 | 14 | 13 | 0 | 0 | 0 | 0 | 38 | 29 |
| Lost to follow‐up | Censored | 0 | 0 | 0 | 0 | 4 | 10 | 7 | 7 | 11 | 17 |
| Death4 | Censored | 0 | 0 | 0 | 0 | 0 | 0 | 3 | 3 | 3 | 3 |
| Other5 | Censored | 0 | 0 | 0 | 0 | 2 | 1 | 0 | 0 | 2 | 1 |
| Completed the study/did not withdraw | Censored | 12 | 14 | 38 | 26 | 36 | 60 | 42 | 48 | 128 | 148 |
n = number of individuals contributing to the outcome 'Time to withdrawal of allocated treatment'; PHT: phenytoin; SV: sodium valproate
1IPD for 'Time to withdrawal of allocated treatment' was not provided for Craig 1994.
2Three participants for Heller 1995 (all SV) and three for De Silva 1996 (one PHT and two SV) have missing reasons for treatment withdrawal.
3Four participants from Heller 1995 had missing withdrawal times and did not contribute to analysis but reasons for withdrawal are given.
4Death due to reasons not related to the study drug.
5Other reasons from Ramsay 1992 – two participants withdrew due to pregnancy and one for personal reasons.
The overall pooled HR (for 569 participants) was 1.02 (95% confidence interval (CI) 0.73 to 1.42, P = 0.92) indicating no clear advantage for either drug . There is no evidence of statistical heterogeneity between trials (Chi² = 5.95, df = 5, P = 0.31, I² = 16%) (see Analysis 1.1).
Table 4 shows that 29/128 (23%) participants on phenytoin and 31/148 (21%) participants on valproate withdrew from the study due to adverse events (or a combination of lack of efficacy and adverse events). See Table 5 for details of all adverse event data provided in the studies included in this review. In summary, the adverse events reported by two or more studies in this review are the following.
| Trial | Adverse event data1 | Summary of reported results | |
| Phenytoin (PHT) | SV (Sodium Valproate) | ||
| All adverse events developed (by drug) and adverse events leading to discontinuation of treatment | PHT (n = 58): gum hypertrophy (n = 2), rash (n = 2), ataxia (n = 2)
| SV (n = 64): weight gain (n = 4 – all discontinued treatment), drowsiness (n = 2), aggressive behaviour (n = 1 – discontinued treatment) | |
| Adverse event frequency (spontaneous reports)2 Discontinuations due to adverse events3 | PHT (n = 25): unsteadiness (n = 9), sleepiness (n = 7), drowsiness (n = 2), impaired concentration (n = 2), confusion (n = 1), constipation (n = 1), diarrhoea (n = 1), dysarthria (n = 1), lethargy (n = 1), nystagmus (n = 1), rash (n = 1), tired legs (n = 1) PHT discontinuations (n = 6): rash (n =1), diarrhoea (n = 1), confusion (n = 1), unsteadiness (n = 1), constipation (n = 1), sleepiness (n = 1) | SV (n = 17): unsteadiness (n = 2), sleepiness (n = 3), tremor (n = 5), oedema (n = 3), alopecia (n = 2), depression (n = 2), weight gain (n = 2) SV discontinuations (n = 2): weight gain and depression (n = 1), unsteadiness (n =1) | |
| “Exclusions” due to adverse events or no efficacy4 | Proportion “excluded”: PHT: 33.3% | Proportion “excluded”: SV: 23.3% | |
| “Unacceptable” adverse events leading to drug withdrawal5 | PHT (n = 54): drowsiness (n = 2), skin rash (n = 1) blood dyscrasia (n = 1), hirsutism (n = 1) | SV (n = 49): behavioural (n = 1), tremor (n = 1) | |
| No adverse event data reported (Withdrawal data only reported) | 1 participant (PHT) withdrew from the study due to depression and anorexia | No adverse event data (or withdrawals due to adverse events) reported | |
| “Unacceptable” adverse events leading to drug withdrawal5 | PHT (n = 63): myalgia (n = 1), irritability (n = 1)
| SV (n = 61): dizziness (n = 2) abnormal liver function test (n = 1) | |
| Most common adverse events (by treatment group)6 | PHT (n = 50): dyspepsia (n = 1), nausea (n = 2), dizziness (n = 2), somnolence (n = 5), tremor (n = 2), rash (n = 4)
| SV (n = 86): dyspepsia (n = 7), nausea (n = 10), dizziness (n = 5), somnolence (n = 8), tremor (n = 5), rash (n = 3) | |
| Commonest adverse events (reported as percentages by treatment group)6 | PHT (n = 45): gum hyperplasia (17.7%), nystagmus (13.33%), ataxia (2.2%), gastrointestinal disturbances (4.44%), drowsiness (4.44%) | SV (n = 49): gastrointestinal disturbances (12%), drowsiness (6.12%), weight gain (2.04%) | |
| Adverse events (narrative description)2 | PHT (n = 15): 1 case of ataxia, 5 cases of acne | SV (n = 18): 2 cases of gastrointestinal symptoms, 2 cases of hair loss, 4 cases of weight gain | |
| Assessment of adverse events2 | PHT (n = 52): 33 participants reported at least one side effect Reported frequencies: gingival hypertrophy (n = 30), ataxia (n = 13), sedation (n = 12), nausea and vomiting (n = 1) Other reported adverse events (no frequencies): nystagmus, confusion | SV (n = 48): 15 participants reported at least one side effect Reported frequencies: hyperactivity (n = 6), impaired school performance (n = 4), severe skin allergy (n = 1) | |
| Withdrawals due to dose‐related and idiosyncratic adverse events | PHT (n = 70): 11 withdrawals due to dose‐related adverse events (nystagmus, ataxia, tremor, diplopia and mental change) 5 withdrawals due to idiosyncratic adverse events (skin eruption, erythroderma and jaundice) | SV (n = 70): 9 withdrawals due to dose‐related adverse events (tremor, irritability, restlessness and alopecia) No withdrawals due to idiosyncratic adverse events | |
1Adverse event data, as reported narratively in the publications. Adverse event data were not requested in original IPD requests but will be for all future IPD requests. For numbers of withdrawals due to adverse events in studies for which IPD were provided (De Silva 1996; Heller 1995; Ramsay 1992; Turnbull 1985) see Table 4.
2Participants may report more than one adverse event.
3The published paper, Craig 1994, reports on a subset of 38 participants, so the adverse event data summary applies only to this subset. IPD were provided for 166 participants (no additional adverse event data provided).
4Czapinski 1997a is an abstract only so very little information is reported.
5Participants may have withdrawn due to adverse event alone or a combination of adverse events and poor efficacy (seizures).
6Most commonly reported adverse events only, no indication of overall frequency of all adverse events.
For valproate:
-
drowsiness/somnolence/sedation (reported by Callaghan 1985; Craig 1994; De Silva 1996; Ramsay 1992; Rastogi 1991);
-
weight gain (reported by Callaghan 1985; Craig 1994; Rastogi 1991; Shakir 1981);
-
tremor (reported by Craig 1994; De Silva 1996; Ramsay 1992; Turnbull 1985);
-
alopecia/hair loss (reported by Craig 1994; Shakir 1981; Turnbull 1985);
-
dizziness/unsteadiness (reported by Craig 1994; Heller 1995; Ramsay 1992);
-
skin allergy/rash (reported by Ramsay 1992; Thilothammal 1996); and
-
gastrointestinal problems (reported by Rastogi 1991; Shakir 1981).
For phenytoin:
-
gingival (gum) hypertrophy/hyperplasia (reported by Callaghan 1985; Rastogi 1991; Thilothammal 1996);
-
rash (reported by Callaghan 1985; Craig 1994; De Silva 1996; Ramsay 1992);
-
ataxia (reported by Callaghan 1985; Rastogi 1991; Shakir 1981; Thilothammal 1996; Turnbull 1985);
-
nausea (reported by Ramsay 1992; Thilothammal 1996);
-
dizziness/unsteadiness (reported by Craig 1994; Ramsay 1992);
-
nystagmus (reported by Craig 1994; Rastogi 1991; Thilothammal 1996; Turnbull 1985);
-
drowsiness/somnolence/sedation (reported by Craig 1994; De Silva 1996; Ramsay 1992; Rastogi 1991; Thilothammal 1996); and
-
tremor (reported by Ramsay 1992; Turnbull 1985).
It is difficult to summarise the 'most common' adverse events overall across the 11 studies due to the differences in methods of reporting adverse event data across the studies (see Table 5 for more information). We did not include adverse event data for individuals in the original IPD requests for earlier versions of this review, but we will in all future IPD requests.
Adjusted analysis
Withdrawal data for 41 participants extracted from Forsythe 1991 did not distinguish between seizure type (partial onset or generalised onset) and therefore could not be included in the meta‐analysis stratified by seizure type.
The overall pooled HR (adjusted by seizure type for 528 participants) was 1.09 (95% CI 0.76 to 1.55, P = 0.64) indicating a slight advantage for valproate which is not statistically significant (see Analysis 1.2). This result is similar to the unadjusted pooled HR (Analysis 1.1) and conclusions remain unchanged following the exclusion of 41 individuals in the stratified analysis (Forsythe 1991). For individuals with generalised onset seizures (341), the pooled HR was 0.98 (95% CI 0.59 to 1.64, P = 0.94), indicating no clear advantage for either drug. For individuals with partial onset seizures (187), the pooled HR was 1.20 (95% CI 0.74 to 1.95, P = 0.47), suggesting an advantage for valproate which is not statistically significant. There was no evidence of an interaction between epilepsy type (partial onset versus generalised onset) and treatment effect (Chi² = 0.31, df = 1, P = 0.58, I² = 0%). (See Analysis 1.2)
An important amount of heterogeneity was present between trials within the generalised onset seizure subgroup (Chi² = 8.44, df = 4, P = 0.08, I² = 53%). On visual inspection of the forest plot (see Analysis 1.2) one trial appears to be the source of this variability (Heller 1995), as this trial shows a large statistically significant treatment effect in favour of phenytoin, while the other four trials show a general non‐significant trend in favour of valproate (De Silva 1996; Ramsay 1992; Shakir 1981; Turnbull 1985).
In Ramsay 1992, there is an indication that the proportional hazards assumption may be violated (see Data synthesis); the P value of time‐varying covariate is 0.054; however visual inspection of the survival plot shows no indication of survival curves crossing, which would imply non‐proportional hazards (Figure 12). As a sensitivity analysis, a piecewise Cox regression model is fitted to investigate any change in treatment effect over time, assuming proportional hazards within each interval. The follow‐up period of Ramsay 1992 is split into three intervals based on the number of events and number of individuals at risk in each interval; time to withdrawal of allocated treatment occurring 0 to 50 days, 51 to 100 days, or after 100 days. Separate HRs can be estimated for each interval as follows.
-
For interval 0 to 50 days (13 events from 128 participants at risk) the HR was 2.79 (95% CI 0.91 to 8.54, P = 0.07), suggesting a large advantage for valproate which is not statistically significant.
-
For interval 51 to 100 days (6 events from 110 participants at risk) the HR was 0.95 (95% CI 0.41 to 2.23, P = 0.91), suggesting no clear advantage for either drug.
-
For interval after 100 days (4 events from 102 participants at risk) the HR was 0.83 (95% CI 0.39 to 1.77, P = 0.63), suggesting an advantage for phenytoin which is not statistically significant.
These results suggest some indication of a change in treatment effect over time, with phenytoin more likely to be withdrawn early and valproate more likely to be withdrawn later; however, the confidence intervals of the estimates are wide due to the small numbers of events within each interval so there is insufficient information to support the hypothesis of a change in treatment effect over time for Ramsay 1992. However, this study has a shorter length of follow‐up than the other studies included for this outcome (median time to withdrawal of allocated treatment for Ramsay 1992 was 180.5 days and was 815 days, 952 days, 851 days and 912 days for De Silva 1996, Heller 1995, Shakir 1981 and Turnbull 1985, respectively). The length of follow‐up, may therefore, be too short to examine the hypothesis of a change in treatment effect over time.
(2) Time to achieve 12‐month remission (seizure‐free period)
For this outcome, a HR greater than one indicates a clinical advantage for phenytoin.
Data for 514 individuals (77% of those providing IPD) from four trials were available for the analysis of this outcome (Craig 1994; De Silva 1996; Heller 1995; Turnbull 1985). Individuals were only followed up for six months in the fifth trial (Ramsay 1992), which could not contribute data to this outcome.
The overall pooled HR (for 514 participants) was 0.97 (95% CI 0.77 to 1.22, P = 0.81), indicating no clear advantage to either drug. There is no evidence of statistical heterogeneity between trials (Chi² = 0.19, df = 3, P = 0.98, I² = 0%) (see Analysis 1.3). For individuals with generalised seizures (270), the pooled HR was 1.04 (95% CI 0.77 to 1.40, P = 0.79 ), indicating no clear advantage for either drug. For individuals with partial onset seizures (244), the pooled HR was 0.90 (95% CI 0.63 to 1.29, P = 0.56), indicating an advantage for valproate which is not statistically significant. Overall, the pooled HR (adjusted for seizure type for 514 participants) was 0.98 (95% CI 0.78 to 1.23, P = 0.87), suggesting no clear clinical advantage for either drug. There was no evidence of an interaction between epilepsy type (partial onset versus generalised onset) and treatment (Chi² = 0.39, df = 1, P = 0.53) (see Analysis 1.4).
The proportional hazards assumption of the Cox model was satisfied for all trials.
(3) Time to achieve six‐month remission (seizure‐free period)
For this outcome, a HR greater than one indicates a clinical advantage for phenytoin.
Data for 639 individuals (96% of those providing IPD) from five trials were available for the analysis of this outcome.
The overall pooled HR (for 639 participants) was 0.92 (95% CI 0.76 to 1.12, P = 0.42), indicating an advantage of valproate which is not statistically significant. There is no evidence of statistical heterogeneity between trials (Chi² = 1.66, df = 4, P = 0.80, I² = 0%) (see Analysis 1.5). For individuals with generalised seizures (395), the pooled HR was 0.92 (95% CI 0.72 to 1.18, P = 0.53), suggesting an advantage for valproate which is not statistically significant. For individuals with partial onset seizures (244), the pooled HR was 0.99 (95% CI 0.73 to 1.35, P = 0.96), indicating no clear advantage for either drug. Overall, the pooled HR (adjusted for seizure type for 639 participants) was 0.95 (95% CI 0.78 to 1.15, P = 0.60), suggesting no clear advantage for either drug. There was no evidence of an interaction between epilepsy type (partial onset versus generalised onset) and treatment (Chi² = 0.13, df = 1, P = 0.72) (see Analysis 1.6).
The proportional hazards assumption of the Cox model was satisfied for all trials.
A sensitivity analysis including generalised seizures of all types during follow‐up (only recorded in Ramsay 1992) produced the following results: for individuals with generalised seizures (395), the pooled HR was 0.84 (95% CI 0.62 to 1.14, P = 0.26), suggesting an advantage for valproate which is not statistically significant. For individuals with partial onset seizures (244), the pooled HR was unchanged, 0.99 (95% CI 0.73 to 1.35, P = 0.96), indicating no clear advantage for either drug. Overall, the pooled HR (adjusted for seizure type) was 0.91 (95% CI 0.73 to 1.13, P = 0.40), suggesting an advantage for valproate which is not statistically significant.
By including information on other generalised seizure types in the trial by Ramsay 1992, a slightly greater advantage for valproate emerges. As the overall results from both analyses are similar and overall conclusions are unchanged, we will focus on the original analysis which includes only generalised tonic‐clonic seizures during follow‐up in all trials.
(4) Time to first seizure (post‐randomisation)
For this outcome, a HR greater than one indicates a clinical advantage for valproate.
Data for 639 individuals (96% of those providing IPD) from five trials were available for the analysis of this outcome.
The overall pooled HR (for 639 participants) was 0.96 (95% CI 0.78 to 1.18, P = 0.70) indicating no clear advantage for either drug. There is no evidence of statistical heterogeneity between trials (Chi² = 4.23, df = 4, P = 0.38, I² = 5%) (see Analysis 1.7).
For individuals with generalised seizures (395), the pooled HR was 1.03 (95% CI 0.77 to 1.39, P = 0.82), indicating no clear advantage for either drug. For individuals with partial onset seizures (244), the pooled HR was 0.83 (95% CI 0.62 to 1.11, P = 0.22), suggesting an advantage for phenytoin which is not statistically significant. Overall, the pooled HR (adjusted for seizure type for 639 participants) was 0.93 (95% CI 0.75 to 1.14, P = 0.45), suggesting an advantage for phenytoin which does not reach statistical significance. There was no evidence of an interaction between epilepsy type (partial onset versus generalised onset) and treatment effect (Chi² = 1.06, df = 1, P = 0.03) (see Analysis 1.8).
The proportional hazards assumption of the Cox model was satisfied for all trial‐specific estimates of the log(HR).
A sensitivity analysis including generalised seizures of all types during follow‐up (only recorded in Ramsay 1992). produced the following results: for individuals with generalised seizures, the pooled HR was 1.05 (95% CI 0.79 to 1.40, P = 0.74), indicating no clear advantage for either drug. For individuals with partial onset seizures, the pooled HR was unchanged, 0.83 (95% CI 0.62 to 1.11, P = 0.22), suggesting an advantage for phenytoin which is not statistically significant. Overall, the pooled HR (adjusted for seizure type) was 0.93 (95% CI 0.76 to 1.15, P = 0.52), suggesting an advantage for phenytoin which is not statistically significant.
As the overall results from both analyses are similar and overall conclusions are unchanged, we will focus on the original analysis which includes only generalised tonic‐clonic seizures during follow‐up in all trials.
(5) Misclassification of seizure type
We did not find evidence of an interaction between treatment and seizure type in any analysis. This result is surprising, given the strong clinical impression that valproate is more effective in generalised onset seizures while phenytoin is more effective in partial onset seizures. The impression that valproate is better for generalised seizures may derive from its effects on generalised seizures other than tonic‐clonic; however, we were unable to investigate these seizure types in this review. Misclassification of seizure type (whereby some individuals with generalised seizures have been mistakenly classed as having partial onset seizures, and vice versa) is a well recognised problem in epilepsy, and it may be that an interaction between treatment and seizure type has been masked because of this. Given clinical evidence that individuals with generalised onset seizures are unlikely to have an 'age at onset' greater than between 25 and 30 years (Malafosse 1994), we examined the distribution of age at onset for individuals with generalised seizures. This revealed that a substantial number of individuals classified as having generalised seizures had an age at onset over 30 years:
-
84 out of 86 individuals classified as having generalised onset seizures (98%) in Craig 1994;
-
37 out of 71 individuals (52%) in Heller 1995;
-
30 out of 136 (22%) in Ramsay 1992;
-
4 out of 14 (29%) in Shakir 1981; and
-
35 out of 77 (45%) in Turnbull 1985.
Therefore, a total of up to 190 out of 384 individuals (49%) classified as having generalised onset seizures may have had their seizure type misclassified (De Silva 1996 was a paediatric trial so no individuals over the age of 30 were recruited). Such a misclassification could bias our results against finding an interaction between treatment and seizure types (partial onset versus generalised onset) and could explain why we have not found strong evidence to support the clinical impression that such an interaction exists. We decided to investigate this further.
We undertook the following two analyses to investigate misclassification.
-
We reclassified all individuals with generalised seizures and age at onset greater than 30 into an 'uncertain seizure type' group.
-
We reclassified individuals with generalised seizures and age at onset greater than 30 as having partial onset seizures.
The results for each outcome are summarised in Table 6.
| Time to withdrawal of allocated treatment | Time to achieve 12‐month remission | Time to achieve 6‐month remission | Time to first seizure | |
| (i) Original analysis | P: 1.20 (0.76 to 1.95) G: 0.98 (0.59 to 1.64) O: 1.09 (0.76 to 1.55) | P: 0.90 (0.63 to 1.29) G: 1.04 (0.77 to 1.40) O: 0.98 (0.78 to 1.23) | P: 0.99 (0.73 to 1.35) G: 0.92 (0.72 to 1.18) O: 0.95 (0.78 to 1.15) | P: 0.83 (0.62 to 1.11) G: 1.03 (0.77 to 1.39) O: 0.93 (0.75 to 1.14) |
| (i) Test for interaction | Chi² = 0.31, df = 1, P = 0.58, I² = 0% | Chi² = 0.39, df = 1, P = 0.53, I² = 0% | Chi² = 0.13, df = 1, P = 0.72, I² = 0% | Chi² = 1.06, df = 1, P = 0.30, I² = 5.6% |
|
| ||||
| (ii) Generalised onset and age at onset > 30 classified as uncertain seizure type | P: 1.20 (0.76 to 1.95) G: 1.33 (0.74 to 2.38) U: 0.47 (0.12 to 1.85) O: 1.17 (0.82 to 1.67) | P: 0.90 (0.63 to 1.29) G: 0.93 (0.63 to 1.39) U: 1.36 (0.85 to 2.17) O: 1.01 (0.80 to 1.27) | P: 0.99 (0.73 to 1.35) G: 0.88 (0.62 to 1.25) U: 1.11 (0.76 to 1.61) O: 0.99 (0.81 to 1.20) | P: 0.83 (0.62 to 1.11) G: 1.34 (0.91 to 1.97) U: 0.74 (0.47 to 1.17) O: 0.93 (0.76 to 1.15) |
| (ii) Test for interaction | Chi² = 1.88, df = 2, P = 0.39, I² = 0% | Chi² = 2.07, df = 2, P = 0.36, I² = 3.3% | Chi² = 0.78, df = 2, P = 0.68, I² = 0% | Chi² = 4.87, df = 2, P = 0.09, I²= 58.9% |
|
| ||||
| (iii) Generalised onset and age at onset > 30 reclassified as partial onset | P: 0.98 (0.63 to 1.53) G: 1.33 (0.74 to 2.38) O: 1.10 (0.77 to 1.56) | P: 1.01 (0.76 to 1.34) G: 0.93 (0.63 to 1.39) O: 0.98 (0.78 to 1.24) | P: 1.00 (0.79 to 1.27) G: 0.88 (0.62 to 1.25) O: 0.97 (0.80 to 1.18) | P: 0.81 (0.64 to 1.04) G: 1.34 (0.91 to 1.97) O 0.94 (0.76 to 1.15) |
| (iii) Test for interaction | Chi² = 0.67, df = 1, P = 0.41, I² = 0% | Chi² = 0.10, df = 1, P = 0.75, I² = 0% | Chi² = 0.36, df = 1 P = 0.55, I² = 0% | Chi² = 4.55, df = 1 P = 0.03, I² = 78% |
P: partial epilepsy; G: generalised epilepsy; O: overall (all participants); U: uncertain epilepsy. Results are presented as pooled HR (95% CI) with fixed‐effect
Chi²: Chi² statistic; df: degrees of freedom of Chi² distribution.
P: P value (< 0.05 are classified as statistically significant).
100 participants reclassified to partial epilepsy or uncertain epilepsy type for outcome 'Time to withdrawal of allocated treatment'.
145 participants reclassified to partial epilepsy or uncertain epilepsy type for outcome 'Time to achieve 12‐month remission'.
171 participants reclassified to partial epilepsy or uncertain epilepsy type for outcome 'Time to achieve 6‐month remission' or 'Time to first seizure'.
See Analysis 1.2, Analysis 1.4, Analysis 1.6, and Analysis 1.8 for original analyses of 'Time to withdrawal of allocated treatment', 'Time to achieve 12‐month remission', 'Time to achieve 6‐month remission', and 'Time to first seizure' respectively.
See Analysis 1.9 and Analysis 1.10 for forest plots of 'Time to first seizure' sensitivity analyses for generalised and age at onset > 30 reclassified as uncertain epilepsy type and partial epilepsy, respectively. Forest plots are not presented for 'Time to withdrawal of allocated treatment', 'Time to achieve 6‐month remission', 'Time to achieve 12‐month remission' sensitivity analyses, as results were similar for partial onset and generalised onset subgroups, and conclusions are unchanged.
-
For 'Time to withdrawal of allocated treatment', reclassifying individuals does not provide stronger evidence of an interaction. However, results for the 'uncertain seizure type' subgroup (pooled HR 0.47, 95% CI 0.12 to 1.85), indicating a large but non‐significant advantage for phenytoin, are substantially different in the direction of effect from estimates for the 'partial onset seizures' subgroup (pooled HR 1.20, 95% CI 0.74 to 1.95), and generalised onset seizure groups (pooled HR 1.33, 95% CI 0.74 to 2.38), both indicating a non‐significant advantage for valproate.
-
Similarly, for 'Time to achieve 12‐month remission', reclassifying individuals does not provide stronger evidence of an interaction, and again results for the 'uncertain seizure type' subgroup (pooled HR 1.36, 95% CI 0.85 to 2.17), indicating a non‐significant advantage for phenytoin, are substantially different in the direction of effect from estimates for the 'partial onset seizures' subgroup (pooled HR 0.90, 95% CI 0.63 to 1.29), and generalised onset seizure groups (pooled HR 0.93, 95% CI 0.63 to 1.39), both indicating a non‐significant advantage for valproate.
-
The results for 'Time to achieve six‐month remission' are very similar regardless of whether individuals have been reclassified or not.
-
For 'Time to first seizure', reclassifying individuals results in a more obvious interaction between treatment and seizure type.
-
-
For generalised seizures, and age of onset more than 30 reclassified as 'uncertain seizure type', the result of the test of interaction between treatment and seizure type is Chi² = 4.87, df = 2, P = 0.09 (see Analysis 1.9).
-
For generalised seizures, and age of onset more than 30 reclassified as 'partial onset seizures', the result of the test of interaction between treatment and seizure type is Chi² = 4.55, df = 1, P = 0.03 (see Analysis 1.10).
-
The direction of effect for the 'uncertain seizure type' subgroup (pooled HR 0.74, 95% CI 0.47 to 1.17) is similar to that of the 'partial onset' subgroup (pooled HR 0.83, 95% CI 0.62 to 1.11), both indicating a non‐significant advantage for phenytoin. Valproate now appears even more effective in generalised onset seizures (pooled HR 1.34, 95% CI 0.91 to 1.97) when compared to the original analysis (see Analysis 1.9 and Analysis 1.10).
Reclassifying seizure type on the basis of age of onset provides evidence for an interaction between treatment and seizure type for the outcome 'Time to first seizure' only. A review comparing carbamazepine and valproate monotherapy for epilepsy undertook a similar investigation of seizure type misclassification (Marson 2000). For the outcome 'Time to achieve 12‐month remission', reclassifying seizure type on the basis of age of onset provided evidence of an interaction between seizure type and treatment for that outcome. In that review, however, a significant interaction between age at onset and treatment was also found for 'Time to first seizure'. There were therefore, two potential explanations for the interaction found when individuals were reclassified according to age of onset. Firstly, misclassification had masked the interaction between treatment and seizure type in the primary analyses, and reclassifying individuals according to age of onset has reduced the bias caused by misclassification. Alternatively, age at onset was acting as an independent predictor of outcome, and the misclassification analysis using age of onset forced the results to reflect this.
To investigate the hypothesis of age at onset acting as an independent predictor of outcome in this review, we performed the following analysis for the outcome 'Time to first seizure'.
-
A Cox Proportional Hazards regression model (stratified by trial) fitted with a single covariate as a treatment indicator (phenytoin = 1, valproate = 0) was fitted.
-
A Cox Proportional Hazards regression model (stratified by trial) fitted with two covariates, treatment and age (measured as a continuous variable) was fitted.
-
A Cox Proportional Hazards regression model (stratified by trial) fitted with three covariates, treatment, age, and an age*treatment interaction term, was fitted.
We compared the difference in ‐2(log likelihood) of models 1, 2, and 3; we compared differences to a Chi² distribution with one or two degrees of freedom. The ‐2(log likelihood) values of the three models were 3192.81, 3192.41 and 3189.058, respectively. We therefore found no evidence that age is an independent predictor of outcome (P = 0.528 comparing goodness of fit of models 1 and 2). However, there is some indication of an interaction between age at onset and treatment (P = 0.067 comparing goodness of fit of models 2 and 3) as in the carbamazepine versus valproate review (Marson 2000).
In model 3, the effect sizes for the three covariates are as follows.
-
Treatment HR 1.25 (95% CI 0.08 to 1.77, P = 0.213), indicating an advantage for valproate which is not statistically significant.
-
Age HR 1.002 (95% CI 0.99 to 1.01, P = 0.647), indicating no significant effect of age on outcome.
-
Age*treatment interaction HR 0.99 (95% CI 0.99 to 1.01, P = 0.067), indicating an interaction between treatment and age which is borderline statistically significant. This effect indicates that with increasing age of onset, treatment effect (advantage for valproate) seems to decrease by approximately 0.7% with each increasing year of age of onset. In other words, as in Marson 2000, there is an indication that younger individuals may fare better on valproate than older individuals, who fare better on phenytoin for this outcome.
Discussion
Summary of main results
The results of this review do not demonstrate a statistically significant effect in favour of either valproate or phenytoin for the primary global outcome 'Time to withdrawal of allocated treatment (retention time)'. This outcome is influenced by both the relative efficacy of the two drugs, and differences in tolerability and safety. As a difference in efficacy in one direction may be confounded by a difference in tolerability in the other, it may not be surprising that any estimated differences are small. The confidence intervals for this outcome are too wide to confirm equivalence and clinically important differences have not been excluded, particularly when results for generalised and partial onset seizure subgroups are examined. Furthermore, as at least three of the trials contributing individual participant data (IPD) to this outcome were open‐label, clinical preconceptions about the two treatments, such as that valproate is more effective in generalised seizures, while phenytoin is more effective in partial onset seizures, and lack of masking, may have influenced the withdrawal rates of the two treatments.
Similarly for the secondary outcomes 'Time to achieve 12‐month remission (seizure‐free period)', 'Time to achieve six‐month remission (seizure‐free period)', and 'Time to first seizure', although no statistically significant differences were found between phenytoin and valproate, the confidence intervals are too wide to confirm equivalence.
Overall completeness and applicability of evidence
We have gratefully received IPD for 669 individuals (60% of individuals from all eligible trials) from the authors of five trials, which included a comparison of phenytoin with valproate for the treatment of epilepsy (Craig 1994; De Silva 1996; Heller 1995; Ramsay 1992; Turnbull 1985). However, 376 individuals (33%) from four relevant trials could not be included in any analysis, as IPD were not available and outcomes of interest were not reported in the published reports (Callaghan 1985; Czapinski 1997a; Rastogi 1991; Thilothammal 1996). Sufficient data for 74 individuals (7%) were published in two trials to contribute to analysis for the primary outcome 'Time to withdrawal of allocated treatment' (Forsythe 1991; Shakir 1981), but insufficient data were available to include these individuals in the analyses of other outcomes. Having to exclude data for a third of eligible participants due to lack of IPD and insufficient reporting in study publications is likely to impact on the applicability of the evidence, however it is difficult to quantify exactly how large this impact could be.
Quality of the evidence
The five trials for which IPD were made available were of generally good quality, with all five trials describing adequate methods of randomisation, and Craig 1994, De Silva 1996 and Heller 1995 also describing adequate methods of allocation concealment. However, none of the five trials described a method of blinding of participants and personnel, and only one trial stated that cognitive outcome assessors were blinded to treatment allocation, raising the possibility of performance and detection bias (Craig 1994). Three trials were designed as open‐label for "practical and ethical reasons" (De Silva 1996; Heller 1995; Ramsay 1992); for example, Ramsay 1992 stated that the side effects of the respective drugs would "quickly unblind" the trial anyway. A further difference between the five trials was the population recruited; two trials recruited adults of all ages (Heller 1995; Turnbull 1985), one recruited children only (De Silva 1996), one recruited adults and children (Ramsay 1992), and one recruited adults over the age of 60 only (Craig 1994).
An important limitation of the current evidence base is that, of the five trials providing full IPD, only one collected data on generalised seizure types other than generalised tonic‐clonic seizures (Ramsay 1992). Hence, the results for seizure outcomes ('Time to achieve remission' and 'Time to first seizure'), apply only to generalised tonic‐clonic seizures, despite the fact that individuals may have been experiencing other generalised seizure types. This problem must be addressed in future trials.
For the reasons outlined in this section, the quality of the evidence was judged to be moderate for time to treatment withdrawal and low to very low for the outcomes of time to first seizure and time to remission (see summary of findings Table for the main comparison)
Potential biases in the review process
Examining the subgroup analyses for trends shows inconsistent results. For the primary outcome 'Time to withdrawal of allocated treatment', estimates indicate a potentially important advantage for valproate for partial onset seizures, with no clear advantage for either drug for generalised tonic‐clonic seizures, which goes against current practice and belief. For 'Time to achieve six‐month remission', estimates favour valproate for generalised tonic‐clonic seizures, with no clear trend for partial onset seizures. For 'Time to achieve 12‐month remission', estimates favour valproate for partial onset seizures, with no clear trend for generalised tonic‐clonic seizures, which again contradicts current practice and belief. For 'Time to first seizure', there is a trend in favour of phenytoin for partial onset seizures, with no clear trend for generalised tonic‐clonic seizures.
Despite strong prior clinical impressions that valproate is more effective in generalised seizures and that phenytoin is more effective in partial onset seizures, we have failed to detect a significant interaction between treatment and seizure type for any outcome to support current practice. It must however, be understood that the confidence intervals around the estimates are wide, and that these results do not exclude the possibility of important differences existing.
Why have we failed to find an interaction between drug and seizure type? It may well be that an interaction does not exist. Alternatively, it may be that an interaction does exist but we have failed to detect it. We suggest the following reasons why this might have occurred.
-
Our meta‐analysis may not have the statistical power needed to detect an interaction.
-
Generalised tonic‐clonic seizures were the only generalised seizure type contributing to the main analyses. It may be that there is no difference between phenytoin and valproate for control of this seizure type, but important differences could exist for absence and myoclonus seizure types. However, were this the case, we might have expected to see a treatment‐seizure type interaction for the outcome 'Time to treatment withdrawal of allocated treatment', if treatment were being withdrawn or a further drug added to combat other seizure types.
-
Due to the strong clinical impression that valproate is the treatment of choice for individuals with myoclonus and absence seizures, physicians may have been reluctant to randomise individuals with epilepsy syndromes particularly responsive to valproate into these trials (e.g. juvenile myoclonic epilepsy). This seems unlikely given that recruitment into those trials of individuals with generalised tonic‐clonic seizures took place some time before such beliefs became widely held in the UK.
-
The results of the original trials, and hence this meta‐analysis, may have been confounded by classification bias, i.e. individuals with generalised seizures may have been misclassified as having partial onset seizures and vice versa. There is good evidence from a similar review comparing carbamazepine and valproate that misclassification is indeed an important issue in epilepsy trials (Marson 2000). Within our review, the most striking indication that misclassification may be a problem is the classification of subjects in Craig 1994. In this trial, 95 out of 166 (56%) of the recruited individuals were classified as having a generalised epilepsy, which seems unlikely given that the individuals were newly diagnosed and over the age of 60 (Malafosse 1994). It is also interesting to note that Ramsay 1992 is the only trial in this review that attempted to recruit only individuals with generalised tonic‐clonic seizures, However, this trial recruited too few individuals to have the power to detect a difference between phenytoin and valproate. In this trial, for a subgroup of individuals with definite electroencephalographic (EEG) changes to support a diagnosis of an idiopathic generalised epilepsy, there appeared to be a greater (but not significant) advantage for valproate, compared to the trial population overall. This could again be interpreted as supporting the potential for misclassification, which in turn could confound an interaction between treatment and seizure type. We were unable to test for the effects of EEG changes on the interaction between treatment and seizure type due to EEG data not being collected for all trials, and even where it was available, it was not done in a uniform way. It is likely that these trials were initiated before the publication of the International League Against Epilepsy Classification of Epileptic Syndromes in 1989 (Commission 1989), but they did use the International League Against Epilepsy Classification of Epileptic Seizures that was published in 1981 (Commission 1981), which does allow individuals to be classified as those with partial onset or generalised seizures. The age of onset distribution of individuals classified as having generalised seizures indicates misclassification is likely to have occurred in up to 190 out of 384 (49%) individuals classified as having generalised onset seizures. Our results, based on reclassifying the 190 individuals, indicate that classification bias is a potentially important confounder of the results of this review, particularly the outcome 'Time to first seizure'. Furthermore, there is evidence for this outcome of an association between age of seizure onset and treatment allocation, suggesting that younger individuals may fare better on valproate, while older individuals fare better on phenytoin. For these reasons, it is important that the issue of misclassification is addressed in future trials.
-
Finally, it should be mentioned that the preparation of valproate used in the included trials may have influenced the results. The trials conducted in the UK all used sodium valproate (Epilim) (Craig 1994; De Silva 1996; Heller 1995; Turnbull 1985). Ramsay 1992, conducted in the USA, used valproic acid (Depakene) which is thought to cause more gastrointestinal side effects than preparations containing either a mixture of sodium valproate and valproic acid, or sodium valproate alone. There is no evidence from RCTs to support this, but there are some data from observational studies (Brasfield 1999; Cranor 1997; Wilder 1983a). Given that this meta‐analysis, and a similar meta‐analysis comparing valproate and carbamazepine have failed to find convincing evidence of differences in effect between different drugs (Marson 2000), it seems unlikely that differing preparations of the same drug are likely to have a major effect.
Agreements and disagreements with other studies or reviews
No single trial has found convincing differences between phenytoin and valproate with respect to seizure control or seizure type (Callaghan 1985; Craig 1994; Czapinski 1997a; De Silva 1996; Forsythe 1991; Heller 1995; Ramsay 1992; Rastogi 1991; Shakir 1981; Thilothammal 1996; Turnbull 1985). However, confidence intervals around estimates have been wide and equivalence cannot be inferred. Furthermore, this systematic review and meta‐analysis has not found any statistically significant differences between phenytoin and valproate for any of the outcomes measures. To our knowledge, this is the only systematic review and meta‐analysis which compares phenytoin and valproate monotherapy for partial onset seizures and generalised onset tonic‐clonic seizures.
'Risk of bias' graph: review authors' judgements about each risk of bias item presented as percentages across all included studies.
'Risk of bias' summary: review authors' judgements about each risk of bias item for each included study.
Time to withdrawal of allocated treatment.
One participant randomised to phenytoin (PHT) and nine participants randomised to valproate (SV) had time to withdrawal of zero days, and are therefore not included in "Number at Risk".
Time to withdrawal of allocated treatment ‐ stratified by epilepsy type.
One participant with generalised epilepsy randomised to phenytoin (PHT) and nine participants with generalised epilepsy randomised to valproate (SV) had time to withdrawal of zero days, and are therefore not included in "Number at Risk".
Time to achieve 12‐month remission.
Time to achieve 12‐month remission ‐ stratified by epilepsy type.
Time to achieve six‐month remission.
Time to achieve six‐month remission ‐ stratified by epilepsy type.
Time to first seizure ‐ stratified by epilepsy type.
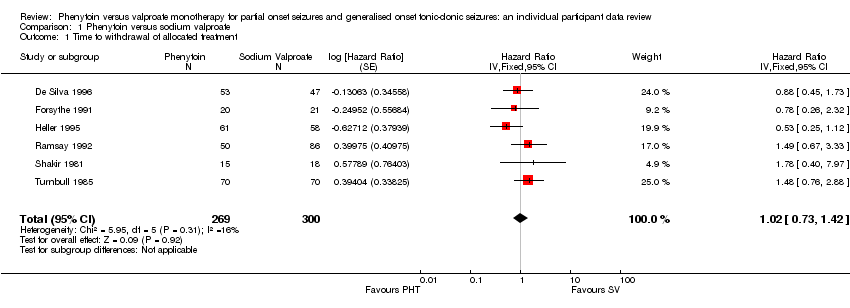
Comparison 1 Phenytoin versus sodium valproate, Outcome 1 Time to withdrawal of allocated treatment.

Comparison 1 Phenytoin versus sodium valproate, Outcome 2 Time to withdrawal of allocated treatment ‐ stratified by epilepsy type.
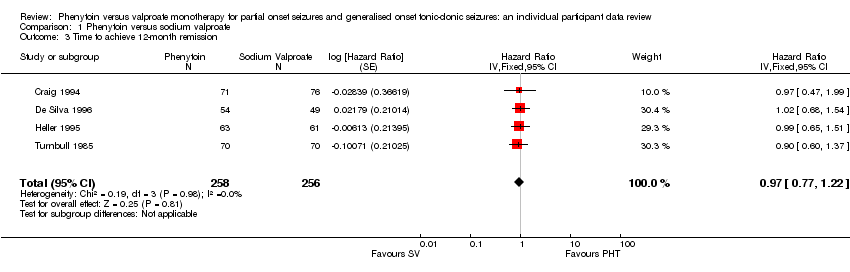
Comparison 1 Phenytoin versus sodium valproate, Outcome 3 Time to achieve 12‐month remission.
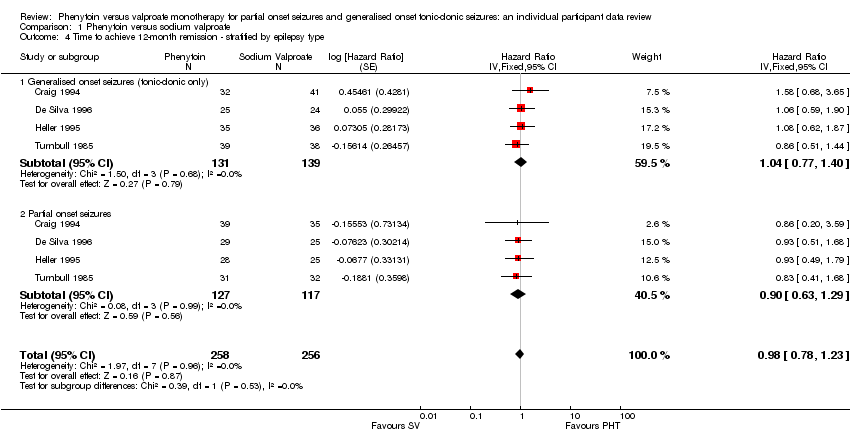
Comparison 1 Phenytoin versus sodium valproate, Outcome 4 Time to achieve 12‐month remission ‐ stratified by epilepsy type.
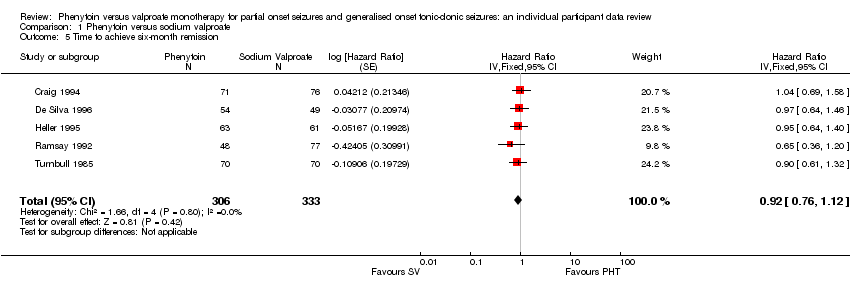
Comparison 1 Phenytoin versus sodium valproate, Outcome 5 Time to achieve six‐month remission.

Comparison 1 Phenytoin versus sodium valproate, Outcome 6 Time to achieve six‐month remission ‐ stratified by epilepsy type.
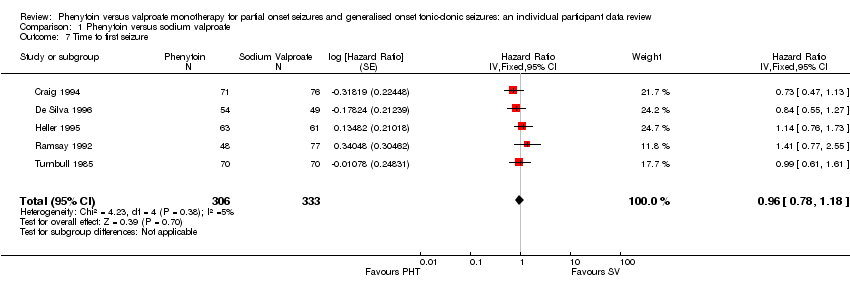
Comparison 1 Phenytoin versus sodium valproate, Outcome 7 Time to first seizure.
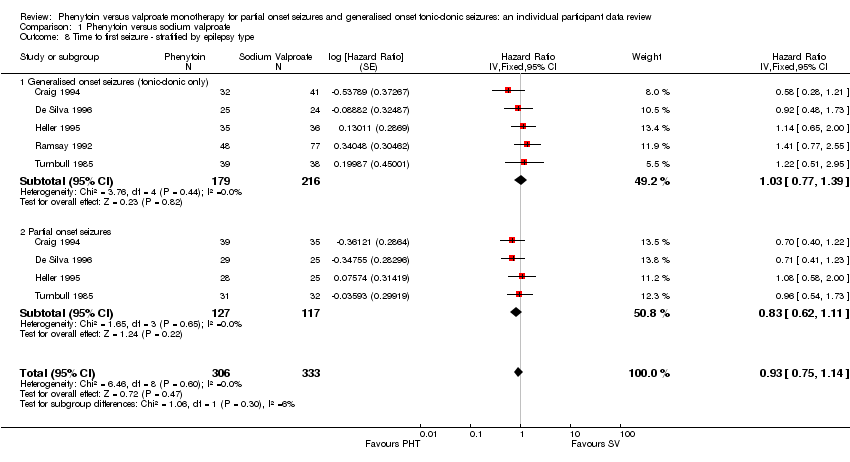
Comparison 1 Phenytoin versus sodium valproate, Outcome 8 Time to first seizure ‐ stratified by epilepsy type.
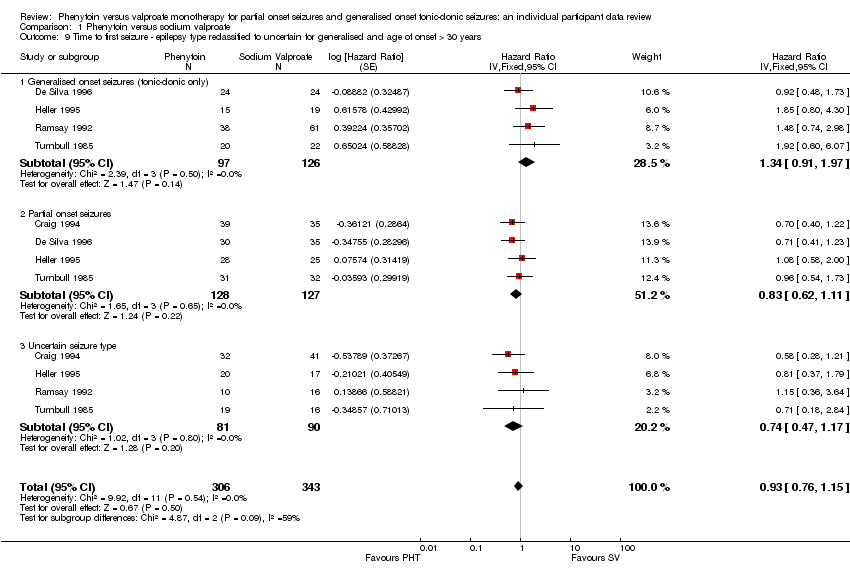
Comparison 1 Phenytoin versus sodium valproate, Outcome 9 Time to first seizure ‐ epilepsy type reclassified to uncertain for generalised and age of onset > 30 years.

Comparison 1 Phenytoin versus sodium valproate, Outcome 10 Time to first seizure ‐ epilepsy type reclassified to partial for generalised and age of onset > 30 years.
| Phenytoin compared with valproate for partial onset seizures and generalised onset tonic‐clonic seizures | ||||||
| Patient or population: Adults and children with newly‐onset partial or generalised tonic‐clonic seizures Settings: Outpatients Intervention: Valproate Comparison: Phenytoin | ||||||
| Outcomes | Illustrative comparative risks* (95% CI) | Relative effect | No of Participants | Quality of the evidence | Comments | |
| Assumed risk | Corresponding risk | |||||
| Phenytoin | Valproate | |||||
| Time to withdrawal of allocated treatment (retention time) ‐ stratified by epilepsy type Range of follow‐up (all participants): 1‐91 months | 27 per 100 | 25 per 100 (18 to 33) | HR 1.09 (0.76 to 1.55)1 | 528 | ⊕⊕⊕⊝ | HR > 1 indicates a clinical |
| Time to withdrawal of allocated treatment (retention time) ‐ stratified by epilepsy type: generalised onset seizures (tonic‐clonic only) Range of follow‐up (all participants): 1‐91 months | 18 per 100 | 19 per 100 (12 to 29) | HR 0.98 (0.59 to 1.64) | 341 | ⊕⊕⊕⊝ | HR > 1 indicates a clinical |
| Time to withdrawal of allocated treatment (retention time) ‐ stratified by epilepsy type: partial onset seizures Range of follow‐up (all participants): 1‐91 months | 39 per 100 | 34 per 100 (23 to 49) | HR 1.20 (0.74 to 1.95) | 187 (4 studies) | ⊕⊕⊕⊝ | HR > 1 indicates a clinical |
| Time to achieve 12‐month remission (seizure‐free period) ‐ stratified by epilepsy type Range of follow‐up (all participants): 1‐91 months | 67 per 100 | 67 per 100 (58 to 75) | HR 0.98 (0.78 to 1.23)1 | 514 (4 studies) | ⊕⊕⊕⊝ | HR > 1 indicates a clinical |
| Time to achieve 12‐month remission (seizure‐free period) ‐ stratified by epilepsy type: generalised onset seizures (tonic‐clonic only) Range of follow‐up (all participants): 1 ‐ 91 months | 67 per 100 | 69 per 100 (58 to 79) | HR 1.04 (0.77 to 1.40) | 270 (4 studies) | ⊕⊕⊝⊝ | HR > 1 indicates a clinical |
| Time to achieve 12‐month remission (seizure‐free period) ‐ stratified by epilepsy type: partial onset seizures Range of follow up (all participants): 1‐91 months | 67 per 100 | 63 per 100 (50 to 76) | HR 0.90 (0.63 to 1.29) | 244 (4 studies) | ⊕⊕⊕⊝ | HR > 1 indicates a clinical |
| Time to achieve 6‐month remission (seizure‐free period) ‐ stratified by epilepsy type Range of follow‐up (all participants): 1 ‐ 91 months | 60 per 100 | 58 per 100 (51 to 65) | HR 0.95 (0.78 to 1.15)1 | 639 (5 studies) | ⊕⊕⊕⊝ | HR > 1 indicates a clinical |
| Time to achieve 6‐month remission (seizure‐free period) ‐ stratified by epilepsy type: generalised onset seizures (tonic‐clonic only) Range of follow‐up (all participants): 1 ‐ 91 months | 69 per 100 | 66 per 100 (57 to 75) | HR 0.92 (0.72 to 1.18) | 395 (5 studies) | ⊕⊕⊝⊝ | HR > 1 indicates a clinical |
| Time to achieve 6‐month remission (seizure‐free period) ‐ stratified by epilepsy type: partial onset seizures Range of follow‐up (all participants): 1‐91 months | 51 per 100 | 50 per 100 (40 to 62) | HR 0.99 (0.73 to 1.35) | 244 (4 studies) | ⊕⊕⊕⊝ | HR > 1 indicates a clinical |
| Time to first seizure (post‐randomisation) ‐ stratified by epilepsy type Range of follow‐up (all participants): 1‐91 months | 59 per 100 | 62 per 100 (55 to 70) | HR 0.93 (0.75 to 1.14)1 | 639 (5 studies) | ⊕⊕⊝⊝ | HR > 1 indicates a clinical |
| Time to first seizure (post‐randomisation) ‐ stratified by epilepsy type: generalised onset seizures (tonic‐clonic only) Range of follow‐up (all participants): 1‐91 months | 48 per 100 | 47 per 100 (38 to 58) | HR 1.03 (0.77 to 1.39) | 395 (5 studies) | ⊕⊝⊝⊝ | HR > 1 indicates a clinical |
| Time to first seizure (post‐randomisation) ‐ stratified by epilepsy type: partial onset seizures Range of follow‐up (all participants): 1‐91 months | 75 per 100 | 81 per 100 (71 to 89) | HR 0.83 (0.62 to 1.11) | 244 (4 studies) | ⊕⊕⊝⊝ | HR > 1 indicates a clinical |
| *The basis for the assumed risk (e.g. the median control group risk across studies) is provided in footnotes. The assumed risk is calculated as the event rate in the phenytoin treatment group. The corresponding risk (and its 95% confidence interval) is based on the assumed risk in the comparison group and the relative effect of the intervention (and its 95% CI). | ||||||
| GRADE Working Group grades of evidence | ||||||
| 1Pooled HR for all participants adjusted for seizure type. | ||||||
| Trial | Outcomes reported | Summary of results |
| 1. Seizure control: (a) excellent (seizure‐free) (b) good (> 50% reduction) (c) poor (< 50% reduction) 2. Adverse events | 1. PHT (n = 58); SV (n = 64) (a) 39 (67%) 34 (53%) (b) 7 (12%) 16 (25%) (c) 12 (21%) 14 (22%) 2. 6 (10%) 7 (11%) | |
| 1. Proportion achieving 24‐month remission at 3 years 2. Proportion excluded after randomisation due to adverse events or no efficacy | 1. PHT: 59%; SV: 64% 2. PHT: 23%; SV: 23% | |
| 1. Cognitive assessments 2. Withdrawals from randomised drug | 1. Significant difference favouring SV test of speed of information processing (P < 0.01) No significant differences between treatment groups for any other cognitive tests 2. PHT: 6/20 (30%); SV: 7/21 (33%) | |
| 1. Reduction in frequency of seizures at 24 weeks: (a) excellent (100% reduction) (b) good (75%‐99% reduction) (c) fair (50%‐74% reduction) (d) poor (< 50% reduction) 2. Adverse events | 1. PHT (n = 45); SV (n = 49) (a) 23 (51%) 24 (49%) (b) 13 (24%) 17 (35%) (c) 8 (18%) 5(10%) (d) 1 (2%) 3 (6%) 2. All reported adverse events were minor PHT: gum hyperplasia (18%), nystagmus (13%), gastrointestinal symptoms (4%), drowsiness (4%), ataxia (2%) SV: gastrointestinal symptoms (12%), drowsiness (6%), weight gain (2%) | |
| 1.Seizures during treatment 2. Adverse events | 1. PHT: 5 (33%); SV: 7 (39%) 2. PHT: 1 case of ataxia, 5 cases of acne. SV: 2 cases of gastrointestinal symptoms, 2 cases of hair loss, 4 cases of weight gain | |
| 1. Recurrence of seizures 2. Adverse events | 1. PHT: 14/52 (27%) SV: 10/48 (21%) 2. PHT: 33/52 (63%) SV: 15/48 (31%) | |
| PHT: phenytoin; SV: sodium valproate | ||
| Trial | Number randomised | Time to withdrawal of allocated treatment | Time to achieve 12‐month remission | Time to achieve 6‐month remission | Time to first seizure | ||||||||||
| PHT | SV | Total | PHT | SV | Total | PHT | SV | Total | PHT | SV | Total | PHT | SV | Total | |
| 81 | 85 | 166 | 0 | 0 | 0 | 71 | 76 | 147 | 71 | 76 | 147 | 71 | 76 | 147 | |
| 54 | 49 | 103 | 53 | 47 | 100 | 54 | 49 | 103 | 54 | 49 | 103 | 54 | 49 | 103 | |
| 20 | 21 | 41 | 20 | 21 | 41 | 0 | 0 | 0 | 0 | 0 | 0 | 0 | 0 | 0 | |
| 63 | 61 | 124 | 61 | 58 | 119 | 63 | 61 | 124 | 63 | 61 | 124 | 63 | 61 | 124 | |
| 50 | 86 | 136 | 50 | 86 | 136 | 0 | 0 | 0 | 48 | 77 | 125 | 48 | 77 | 125 | |
| 70 | 70 | 140 | 70 | 70 | 140 | 70 | 70 | 140 | 70 | 70 | 140 | 70 | 70 | 140 | |
| 15 | 18 | 33 | 15 | 18 | 33 | 0 | 0 | 0 | 0 | 0 | 0 | 0 | 0 | 0 | |
| Total | 353 | 390 | 743 | 269 | 300 | 569 | 258 | 256 | 514 | 306 | 333 | 639 | 306 | 333 | 639 |
| 1Withdrawal information not provided for Craig 1994, so cannot contribute to 'Time to withdrawal of allocated treatment'. PHT: phenytoin; SV: sodium valproate | |||||||||||||||
| Statistic | Time to withdrawal of allocated treatment | Time to achieve 12‐month remission | Time to achieve six‐month remission | Time to first seizure | |
| Test for heterogeneity | Chi² | (df = 5) 5.95 | (df = 3) 0.19 | (df = 4) 1.66 | (df = 4) 4.23 |
| P value | 0.31 | 0.98 | 0.80 | 0.38 | |
| I² | 16% | 0% | 0% | 5% | |
| Overall effect | HR (95% CI) | 1.02 (0.73 to 1.49) | 0.97 (0.77 to 1.22) | 0.92 (0.76 to 1.12) | 0.96 (0.78 to 1.18) |
| P value | 0.92 | 0.81 | 0.42 | 0.70 | |
| Test for interaction between treatment and epilepsy type | Chi² | (df = 1) 0.31 | (df = 1) 0.39 | (df = 1) 0.13 | (df = 1) 1.06 |
| P value | 0.58 | 0.53 | 0.72 | 0.3 | |
| I² | 0% | 0% | 0% | 5.6% | |
| Overall effect adjusted for epilepsy type | HR (95% CI) | 1.09 (0.76 to 1.55) | 0.98 (0.78 to 1.23) | 0.95 (0.78 to 1.15) | 0.93 (0.75 to 1.14) |
| P value | 0.19 | 0.87 | 0.60 | 0.47 | |
| CI: confidence interval; df: degrees of freedom of Chi² distribution; HR: Hazard ratio; P < 0.05 is classified as statistically significant | |||||
| Reason for early termination | Classification | De Silva 19962 | Heller 19952,3 | Ramsey 1992 | Turnbull 1985 | Total1 | |||||
| PHT n = 53 | SV n = 47 | PHT n = 63 | SV n = 58 | PHT n = 50 | SV n = 86 | PHT n = 70 | SV n = 70 | PHT n = 236 | SV n = 261 | ||
| Adverse events/intoxication | Event | 2 | 2 | 1 | 4 | 5 | 7 | 14 | 7 | 22 | 20 |
| Poor seizure control/lack of efficacy | Event | 10 | 11 | 8 | 9 | 2 | 1 | 0 | 2 | 20 | 23 |
| Both adverse events and lack of efficacy | Event | 5 | 4 | 2 | 6 | 0 | 0 | 2 | 1 | 9 | 11 |
| Non‐compliance | Event | 0 | 0 | 0 | 0 | 1 | 7 | 2 | 2 | 3 | 9 |
| Participant went into remission | Censored | 24 | 16 | 14 | 13 | 0 | 0 | 0 | 0 | 38 | 29 |
| Lost to follow‐up | Censored | 0 | 0 | 0 | 0 | 4 | 10 | 7 | 7 | 11 | 17 |
| Death4 | Censored | 0 | 0 | 0 | 0 | 0 | 0 | 3 | 3 | 3 | 3 |
| Other5 | Censored | 0 | 0 | 0 | 0 | 2 | 1 | 0 | 0 | 2 | 1 |
| Completed the study/did not withdraw | Censored | 12 | 14 | 38 | 26 | 36 | 60 | 42 | 48 | 128 | 148 |
| n = number of individuals contributing to the outcome 'Time to withdrawal of allocated treatment'; PHT: phenytoin; SV: sodium valproate | |||||||||||
| Trial | Adverse event data1 | Summary of reported results | |
| Phenytoin (PHT) | SV (Sodium Valproate) | ||
| All adverse events developed (by drug) and adverse events leading to discontinuation of treatment | PHT (n = 58): gum hypertrophy (n = 2), rash (n = 2), ataxia (n = 2)
| SV (n = 64): weight gain (n = 4 – all discontinued treatment), drowsiness (n = 2), aggressive behaviour (n = 1 – discontinued treatment) | |
| Adverse event frequency (spontaneous reports)2 Discontinuations due to adverse events3 | PHT (n = 25): unsteadiness (n = 9), sleepiness (n = 7), drowsiness (n = 2), impaired concentration (n = 2), confusion (n = 1), constipation (n = 1), diarrhoea (n = 1), dysarthria (n = 1), lethargy (n = 1), nystagmus (n = 1), rash (n = 1), tired legs (n = 1) PHT discontinuations (n = 6): rash (n =1), diarrhoea (n = 1), confusion (n = 1), unsteadiness (n = 1), constipation (n = 1), sleepiness (n = 1) | SV (n = 17): unsteadiness (n = 2), sleepiness (n = 3), tremor (n = 5), oedema (n = 3), alopecia (n = 2), depression (n = 2), weight gain (n = 2) SV discontinuations (n = 2): weight gain and depression (n = 1), unsteadiness (n =1) | |
| “Exclusions” due to adverse events or no efficacy4 | Proportion “excluded”: PHT: 33.3% | Proportion “excluded”: SV: 23.3% | |
| “Unacceptable” adverse events leading to drug withdrawal5 | PHT (n = 54): drowsiness (n = 2), skin rash (n = 1) blood dyscrasia (n = 1), hirsutism (n = 1) | SV (n = 49): behavioural (n = 1), tremor (n = 1) | |
| No adverse event data reported (Withdrawal data only reported) | 1 participant (PHT) withdrew from the study due to depression and anorexia | No adverse event data (or withdrawals due to adverse events) reported | |
| “Unacceptable” adverse events leading to drug withdrawal5 | PHT (n = 63): myalgia (n = 1), irritability (n = 1)
| SV (n = 61): dizziness (n = 2) abnormal liver function test (n = 1) | |
| Most common adverse events (by treatment group)6 | PHT (n = 50): dyspepsia (n = 1), nausea (n = 2), dizziness (n = 2), somnolence (n = 5), tremor (n = 2), rash (n = 4)
| SV (n = 86): dyspepsia (n = 7), nausea (n = 10), dizziness (n = 5), somnolence (n = 8), tremor (n = 5), rash (n = 3) | |
| Commonest adverse events (reported as percentages by treatment group)6 | PHT (n = 45): gum hyperplasia (17.7%), nystagmus (13.33%), ataxia (2.2%), gastrointestinal disturbances (4.44%), drowsiness (4.44%) | SV (n = 49): gastrointestinal disturbances (12%), drowsiness (6.12%), weight gain (2.04%) | |
| Adverse events (narrative description)2 | PHT (n = 15): 1 case of ataxia, 5 cases of acne | SV (n = 18): 2 cases of gastrointestinal symptoms, 2 cases of hair loss, 4 cases of weight gain | |
| Assessment of adverse events2 | PHT (n = 52): 33 participants reported at least one side effect Reported frequencies: gingival hypertrophy (n = 30), ataxia (n = 13), sedation (n = 12), nausea and vomiting (n = 1) Other reported adverse events (no frequencies): nystagmus, confusion | SV (n = 48): 15 participants reported at least one side effect Reported frequencies: hyperactivity (n = 6), impaired school performance (n = 4), severe skin allergy (n = 1) | |
| Withdrawals due to dose‐related and idiosyncratic adverse events | PHT (n = 70): 11 withdrawals due to dose‐related adverse events (nystagmus, ataxia, tremor, diplopia and mental change) 5 withdrawals due to idiosyncratic adverse events (skin eruption, erythroderma and jaundice) | SV (n = 70): 9 withdrawals due to dose‐related adverse events (tremor, irritability, restlessness and alopecia) No withdrawals due to idiosyncratic adverse events | |
| 1Adverse event data, as reported narratively in the publications. Adverse event data were not requested in original IPD requests but will be for all future IPD requests. For numbers of withdrawals due to adverse events in studies for which IPD were provided (De Silva 1996; Heller 1995; Ramsay 1992; Turnbull 1985) see Table 4. | |||
| Time to withdrawal of allocated treatment | Time to achieve 12‐month remission | Time to achieve 6‐month remission | Time to first seizure | |
| (i) Original analysis | P: 1.20 (0.76 to 1.95) G: 0.98 (0.59 to 1.64) O: 1.09 (0.76 to 1.55) | P: 0.90 (0.63 to 1.29) G: 1.04 (0.77 to 1.40) O: 0.98 (0.78 to 1.23) | P: 0.99 (0.73 to 1.35) G: 0.92 (0.72 to 1.18) O: 0.95 (0.78 to 1.15) | P: 0.83 (0.62 to 1.11) G: 1.03 (0.77 to 1.39) O: 0.93 (0.75 to 1.14) |
| (i) Test for interaction | Chi² = 0.31, df = 1, P = 0.58, I² = 0% | Chi² = 0.39, df = 1, P = 0.53, I² = 0% | Chi² = 0.13, df = 1, P = 0.72, I² = 0% | Chi² = 1.06, df = 1, P = 0.30, I² = 5.6% |
|
| ||||
| (ii) Generalised onset and age at onset > 30 classified as uncertain seizure type | P: 1.20 (0.76 to 1.95) G: 1.33 (0.74 to 2.38) U: 0.47 (0.12 to 1.85) O: 1.17 (0.82 to 1.67) | P: 0.90 (0.63 to 1.29) G: 0.93 (0.63 to 1.39) U: 1.36 (0.85 to 2.17) O: 1.01 (0.80 to 1.27) | P: 0.99 (0.73 to 1.35) G: 0.88 (0.62 to 1.25) U: 1.11 (0.76 to 1.61) O: 0.99 (0.81 to 1.20) | P: 0.83 (0.62 to 1.11) G: 1.34 (0.91 to 1.97) U: 0.74 (0.47 to 1.17) O: 0.93 (0.76 to 1.15) |
| (ii) Test for interaction | Chi² = 1.88, df = 2, P = 0.39, I² = 0% | Chi² = 2.07, df = 2, P = 0.36, I² = 3.3% | Chi² = 0.78, df = 2, P = 0.68, I² = 0% | Chi² = 4.87, df = 2, P = 0.09, I²= 58.9% |
|
| ||||
| (iii) Generalised onset and age at onset > 30 reclassified as partial onset | P: 0.98 (0.63 to 1.53) G: 1.33 (0.74 to 2.38) O: 1.10 (0.77 to 1.56) | P: 1.01 (0.76 to 1.34) G: 0.93 (0.63 to 1.39) O: 0.98 (0.78 to 1.24) | P: 1.00 (0.79 to 1.27) G: 0.88 (0.62 to 1.25) O: 0.97 (0.80 to 1.18) | P: 0.81 (0.64 to 1.04) G: 1.34 (0.91 to 1.97) O 0.94 (0.76 to 1.15) |
| (iii) Test for interaction | Chi² = 0.67, df = 1, P = 0.41, I² = 0% | Chi² = 0.10, df = 1, P = 0.75, I² = 0% | Chi² = 0.36, df = 1 P = 0.55, I² = 0% | Chi² = 4.55, df = 1 P = 0.03, I² = 78% |
| P: partial epilepsy; G: generalised epilepsy; O: overall (all participants); U: uncertain epilepsy. Results are presented as pooled HR (95% CI) with fixed‐effect See Analysis 1.2, Analysis 1.4, Analysis 1.6, and Analysis 1.8 for original analyses of 'Time to withdrawal of allocated treatment', 'Time to achieve 12‐month remission', 'Time to achieve 6‐month remission', and 'Time to first seizure' respectively. See Analysis 1.9 and Analysis 1.10 for forest plots of 'Time to first seizure' sensitivity analyses for generalised and age at onset > 30 reclassified as uncertain epilepsy type and partial epilepsy, respectively. Forest plots are not presented for 'Time to withdrawal of allocated treatment', 'Time to achieve 6‐month remission', 'Time to achieve 12‐month remission' sensitivity analyses, as results were similar for partial onset and generalised onset subgroups, and conclusions are unchanged. | ||||
| Outcome or subgroup title | No. of studies | No. of participants | Statistical method | Effect size |
| 1 Time to withdrawal of allocated treatment Show forest plot | 6 | 569 | Hazard Ratio (Fixed, 95% CI) | 1.02 [0.73, 1.42] |
| 2 Time to withdrawal of allocated treatment ‐ stratified by epilepsy type Show forest plot | 5 | 528 | Hazard Ratio (Fixed, 95% CI) | 1.09 [0.76, 1.55] |
| 2.1 Generalised onset seizures (tonic‐clonic only) | 5 | 341 | Hazard Ratio (Fixed, 95% CI) | 0.98 [0.59, 1.64] |
| 2.2 Partial onset seizures | 4 | 187 | Hazard Ratio (Fixed, 95% CI) | 1.20 [0.74, 1.95] |
| 3 Time to achieve 12‐month remission Show forest plot | 4 | 514 | Hazard Ratio (Fixed, 95% CI) | 0.97 [0.77, 1.22] |
| 4 Time to achieve 12‐month remission ‐ stratified by epilepsy type Show forest plot | 4 | 514 | Hazard Ratio (Fixed, 95% CI) | 0.98 [0.78, 1.23] |
| 4.1 Generalised onset seizures (tonic‐clonic only) | 4 | 270 | Hazard Ratio (Fixed, 95% CI) | 1.04 [0.77, 1.40] |
| 4.2 Partial onset seizures | 4 | 244 | Hazard Ratio (Fixed, 95% CI) | 0.90 [0.63, 1.29] |
| 5 Time to achieve six‐month remission Show forest plot | 5 | 639 | Hazard Ratio (Fixed, 95% CI) | 0.92 [0.76, 1.12] |
| 6 Time to achieve six‐month remission ‐ stratified by epilepsy type Show forest plot | 5 | 639 | Hazard Ratio (Fixed, 95% CI) | 0.95 [0.78, 1.15] |
| 6.1 Generalised onset seizures (tonic‐clonic only) | 5 | 395 | Hazard Ratio (Fixed, 95% CI) | 0.92 [0.72, 1.18] |
| 6.2 Partial onset seizures | 4 | 244 | Hazard Ratio (Fixed, 95% CI) | 0.99 [0.73, 1.35] |
| 7 Time to first seizure Show forest plot | 5 | 639 | Hazard Ratio (Fixed, 95% CI) | 0.96 [0.78, 1.18] |
| 8 Time to first seizure ‐ stratified by epilepsy type Show forest plot | 5 | 639 | Hazard Ratio (Fixed, 95% CI) | 0.93 [0.75, 1.14] |
| 8.1 Generalised onset seizures (tonic‐clonic only) | 5 | 395 | Hazard Ratio (Fixed, 95% CI) | 1.03 [0.77, 1.39] |
| 8.2 Partial onset seizures | 4 | 244 | Hazard Ratio (Fixed, 95% CI) | 0.83 [0.62, 1.11] |
| 9 Time to first seizure ‐ epilepsy type reclassified to uncertain for generalised and age of onset > 30 years Show forest plot | 5 | 649 | Hazard Ratio (Fixed, 95% CI) | 0.93 [0.76, 1.15] |
| 9.1 Generalised onset seizures (tonic‐clonic only) | 4 | 223 | Hazard Ratio (Fixed, 95% CI) | 1.34 [0.91, 1.97] |
| 9.2 Partial onset seizures | 4 | 255 | Hazard Ratio (Fixed, 95% CI) | 0.83 [0.62, 1.11] |
| 9.3 Uncertain seizure type | 4 | 171 | Hazard Ratio (Fixed, 95% CI) | 0.74 [0.47, 1.17] |
| 10 Time to first seizure ‐ epilepsy type reclassified to partial for generalised and age of onset > 30 years Show forest plot | 5 | 639 | Hazard Ratio (Fixed, 95% CI) | 0.94 [0.76, 1.15] |
| 10.1 Generalised onset seizures (tonic‐clonic only) | 4 | 223 | Hazard Ratio (Fixed, 95% CI) | 1.34 [0.91, 1.97] |
| 10.2 Partial onset seizures | 5 | 416 | Hazard Ratio (Fixed, 95% CI) | 0.81 [0.64, 1.04] |