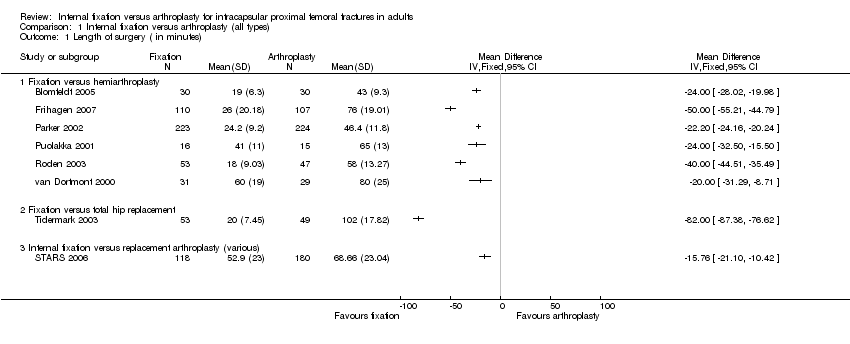
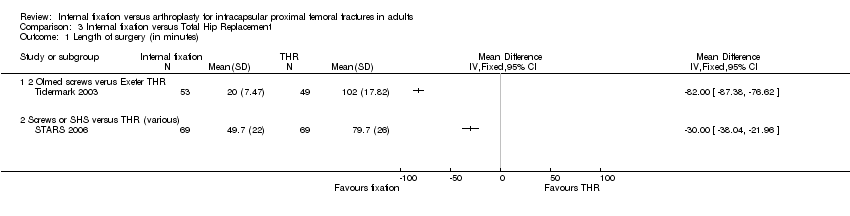
| 1 Length of surgery ( in minutes) Show forest plot | 8 | | Mean Difference (IV, Fixed, 95% CI) | Totals not selected |
|
| 1.1 Fixation versus hemiarthroplasty | 6 | | Mean Difference (IV, Fixed, 95% CI) | 0.0 [0.0, 0.0] |
| 1.2 Fixation versus total hip replacement | 1 | | Mean Difference (IV, Fixed, 95% CI) | 0.0 [0.0, 0.0] |
| 1.3 Internal fixation versus replacement arthroplasty (various) | 1 | | Mean Difference (IV, Fixed, 95% CI) | 0.0 [0.0, 0.0] |
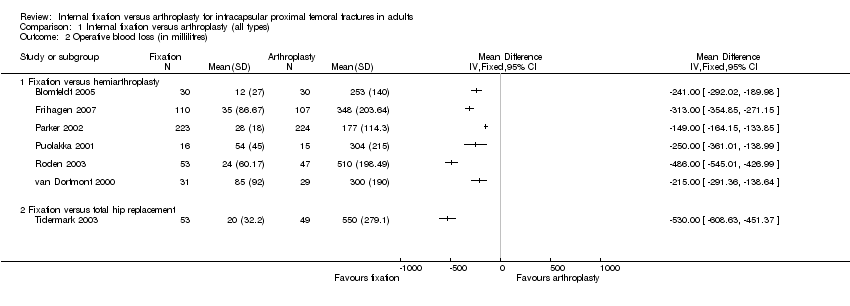
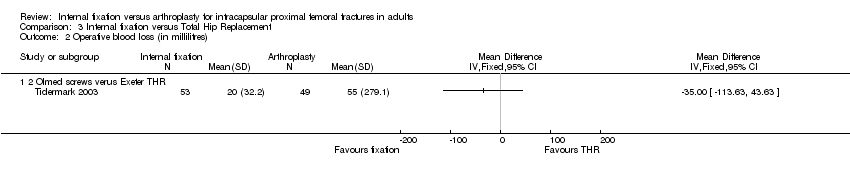
| 2 Operative blood loss (in millilitres) Show forest plot | 7 | | Mean Difference (IV, Fixed, 95% CI) | Totals not selected |
|
| 2.1 Fixation versus hemiarthroplasty | 6 | | Mean Difference (IV, Fixed, 95% CI) | 0.0 [0.0, 0.0] |
| 2.2 Fixation versus total hip replacement | 1 | | Mean Difference (IV, Fixed, 95% CI) | 0.0 [0.0, 0.0] |
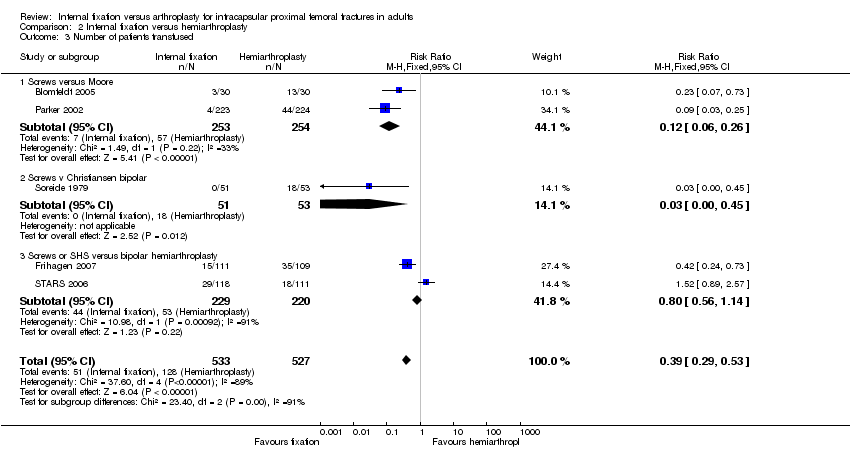
| 3 Number of patients transfused Show forest plot | 6 | 1231 | Risk Ratio (M‐H, Random, 95% CI) | 0.24 [0.09, 0.64] |
|
| 3.1 Fixation versus hemiarthroplasty | 4 | 831 | Risk Ratio (M‐H, Random, 95% CI) | 0.24 [0.11, 0.53] |
| 3.2 Fixation versus total hip replacement | 1 | 102 | Risk Ratio (M‐H, Random, 95% CI) | 0.07 [0.02, 0.22] |
| 3.3 Internal fixation versus replacement arthroplasty (various) | 1 | 298 | Risk Ratio (M‐H, Random, 95% CI) | 1.08 [0.71, 1.63] |
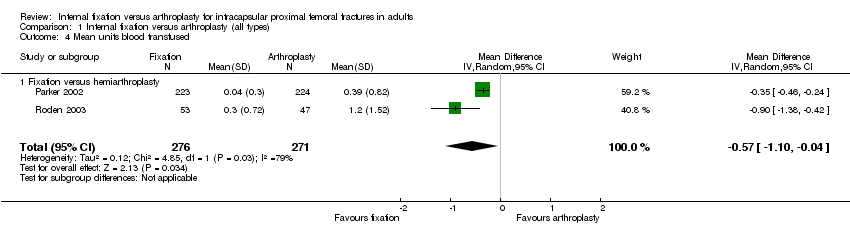
| 4 Mean units blood transfused Show forest plot | 2 | 547 | Mean Difference (IV, Random, 95% CI) | ‐0.57 [‐1.10, ‐0.04] |
|
| 4.1 Fixation versus hemiarthroplasty | 2 | 547 | Mean Difference (IV, Random, 95% CI) | ‐0.57 [‐1.10, ‐0.04] |
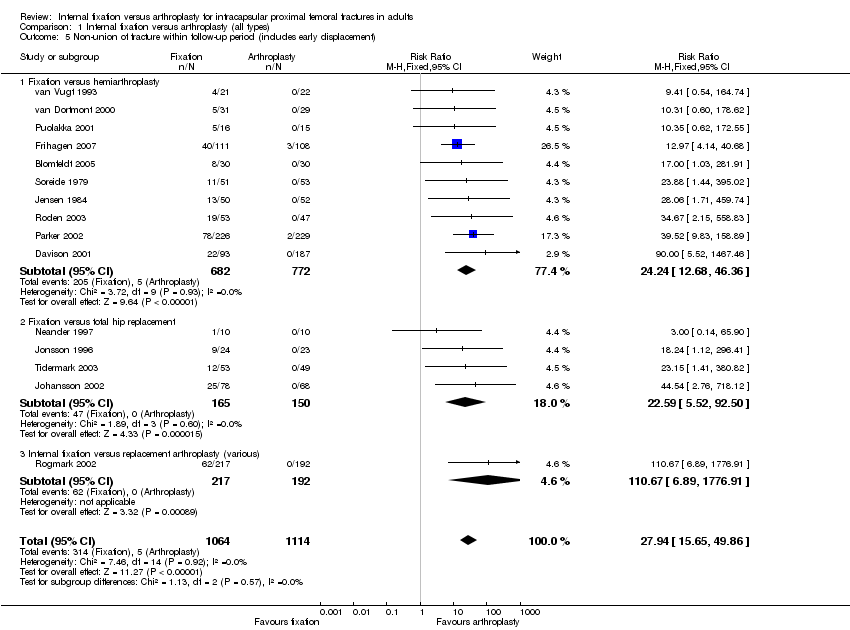
| 5 Non‐union of fracture within follow‐up period (includes early displacement) Show forest plot | 15 | 2178 | Risk Ratio (M‐H, Fixed, 95% CI) | 27.94 [15.65, 49.86] |
|
| 5.1 Fixation versus hemiarthroplasty | 10 | 1454 | Risk Ratio (M‐H, Fixed, 95% CI) | 24.24 [12.68, 46.36] |
| 5.2 Fixation versus total hip replacement | 4 | 315 | Risk Ratio (M‐H, Fixed, 95% CI) | 22.59 [5.52, 92.50] |
| 5.3 Internal fixation versus replacement arthroplasty (various) | 1 | 409 | Risk Ratio (M‐H, Fixed, 95% CI) | 110.67 [6.89, 1776.91] |
| 6 Avascular necrosis Show forest plot | 12 | 2051 | Risk Ratio (M‐H, Fixed, 95% CI) | 19.22 [8.16, 45.27] |
|
| 6.1 Fixation versus hemiarthroplasty | 9 | 1394 | Risk Ratio (M‐H, Fixed, 95% CI) | 13.06 [4.82, 35.42] |
| 6.2 Fixation versus total hip replacement | 2 | 248 | Risk Ratio (M‐H, Fixed, 95% CI) | 20.66 [2.83, 150.74] |
| 6.3 Internal fixation versus replacement arthroplasty (various) | 1 | 409 | Risk Ratio (M‐H, Fixed, 95% CI) | 61.09 [3.77, 989.69] |
| 7 Dislocation of prosthesis Show forest plot | 15 | | Risk Ratio (M‐H, Random, 95% CI) | Subtotals only |
|
| 7.1 Fixation versus hemiarthroplasty | 10 | 1806 | Risk Ratio (M‐H, Random, 95% CI) | 0.27 [0.06, 1.16] |
| 7.2 Fixation versus total hip replacement | 6 | 806 | Risk Ratio (M‐H, Random, 95% CI) | 0.08 [0.02, 0.25] |
| 7.3 Internal fixation versus replacement arthroplasty (various) | 1 | 298 | Risk Ratio (M‐H, Random, 95% CI) | 1.27 [0.40, 4.07] |
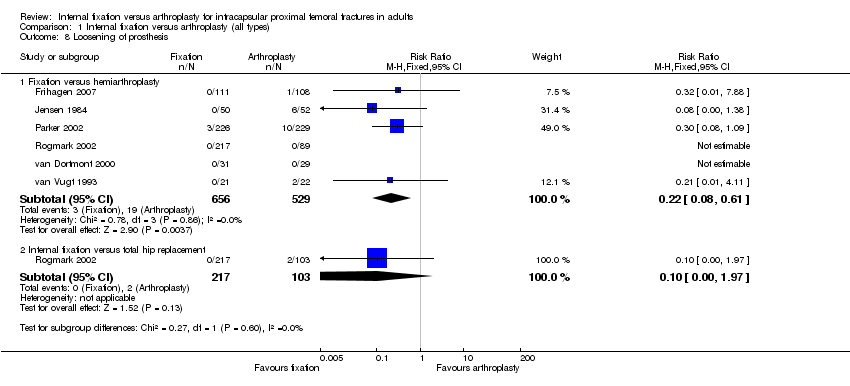
| 8 Loosening of prosthesis Show forest plot | 6 | | Risk Ratio (M‐H, Fixed, 95% CI) | Subtotals only |
|
| 8.1 Fixation versus hemiarthroplasty | 6 | 1185 | Risk Ratio (M‐H, Fixed, 95% CI) | 0.22 [0.08, 0.61] |
| 8.2 Internal fixation versus total hip replacement | 1 | 320 | Risk Ratio (M‐H, Fixed, 95% CI) | 0.10 [0.00, 1.97] |
| 9 Acetabular wear (as defined by each study) Show forest plot | 5 | 940 | Risk Ratio (M‐H, Fixed, 95% CI) | 0.21 [0.05, 0.90] |
|
| 9.1 Fixation versus hemiarthroplasty | 5 | 940 | Risk Ratio (M‐H, Fixed, 95% CI) | 0.21 [0.05, 0.90] |
| 10 Fracture below/around implant Show forest plot | 5 | 1128 | Risk Ratio (M‐H, Random, 95% CI) | 0.40 [0.09, 1.67] |
|
| 10.1 Fixation versus hemiarthroplasty | 3 | 617 | Risk Ratio (M‐H, Random, 95% CI) | 0.49 [0.05, 4.56] |
| 10.2 Fixation versus total hip replacement | 1 | 102 | Risk Ratio (M‐H, Random, 95% CI) | 0.31 [0.01, 7.40] |
| 10.3 Internal fixation versus replacement arthroplasty (various) | 1 | 409 | Risk Ratio (M‐H, Random, 95% CI) | 0.18 [0.02, 1.50] |
| 11 Re‐operations minor (e.g. removal of fixation, dislocation of arthroplasty) Show forest plot | 17 | 2618 | Risk Ratio (M‐H, Random, 95% CI) | 1.36 [0.69, 2.68] |
|
| 11.1 Fixation versus hemiarthroplasty | 11 | 1623 | Risk Ratio (M‐H, Random, 95% CI) | 2.36 [1.05, 5.30] |
| 11.2 Fixation versus total hip replacement | 4 | 315 | Risk Ratio (M‐H, Random, 95% CI) | 0.86 [0.16, 4.70] |
| 11.3 Internal fixation versus replacement arthroplasty (various) | 2 | 680 | Risk Ratio (M‐H, Random, 95% CI) | 0.24 [0.00, 22.30] |
| 12 Re‐operations moderate (e.g. fixation to arthroplasty, drainage, girdlestone) Show forest plot | 17 | 2618 | Risk Ratio (M‐H, Random, 95% CI) | 9.35 [5.79, 15.07] |
|
| 12.1 Fixation versus hemiarthroplasty | 11 | 1623 | Risk Ratio (M‐H, Random, 95% CI) | 7.56 [4.88, 11.72] |
| 12.2 Fixation versus total hip replacement | 4 | 315 | Risk Ratio (M‐H, Random, 95% CI) | 17.96 [4.31, 74.91] |
| 12.3 Internal fixation versus replacement arthroplasty (various) | 2 | 680 | Risk Ratio (M‐H, Random, 95% CI) | 45.28 [3.31, 619.46] |
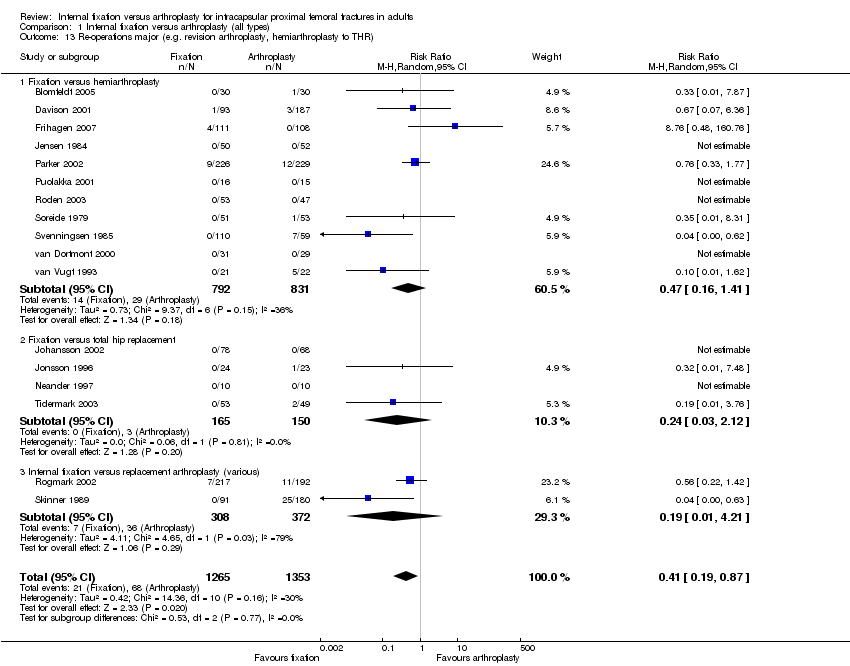
| 13 Re‐operations major (e.g. revision arthroplasty, hemiarthroplasty to THR) Show forest plot | 17 | 2618 | Risk Ratio (M‐H, Random, 95% CI) | 0.41 [0.19, 0.87] |
|
| 13.1 Fixation versus hemiarthroplasty | 11 | 1623 | Risk Ratio (M‐H, Random, 95% CI) | 0.47 [0.16, 1.41] |
| 13.2 Fixation versus total hip replacement | 4 | 315 | Risk Ratio (M‐H, Random, 95% CI) | 0.24 [0.03, 2.12] |
| 13.3 Internal fixation versus replacement arthroplasty (various) | 2 | 680 | Risk Ratio (M‐H, Random, 95% CI) | 0.19 [0.01, 4.21] |
| 14 Total re‐operation rate (within follow‐up period of study) Show forest plot | 19 | 3045 | Risk Ratio (M‐H, Random, 95% CI) | 3.22 [2.31, 4.47] |
|
| 14.1 Fixation versus hemiarthroplasty | 11 | 1623 | Risk Ratio (M‐H, Random, 95% CI) | 3.13 [1.95, 5.03] |
| 14.2 Fixation versus total hip replacement | 4 | 315 | Risk Ratio (M‐H, Random, 95% CI) | 3.43 [1.45, 8.10] |
| 14.3 Internal fixation versus replacement arthroplasty (various) | 4 | 1107 | Risk Ratio (M‐H, Random, 95% CI) | 3.26 [1.65, 6.43] |
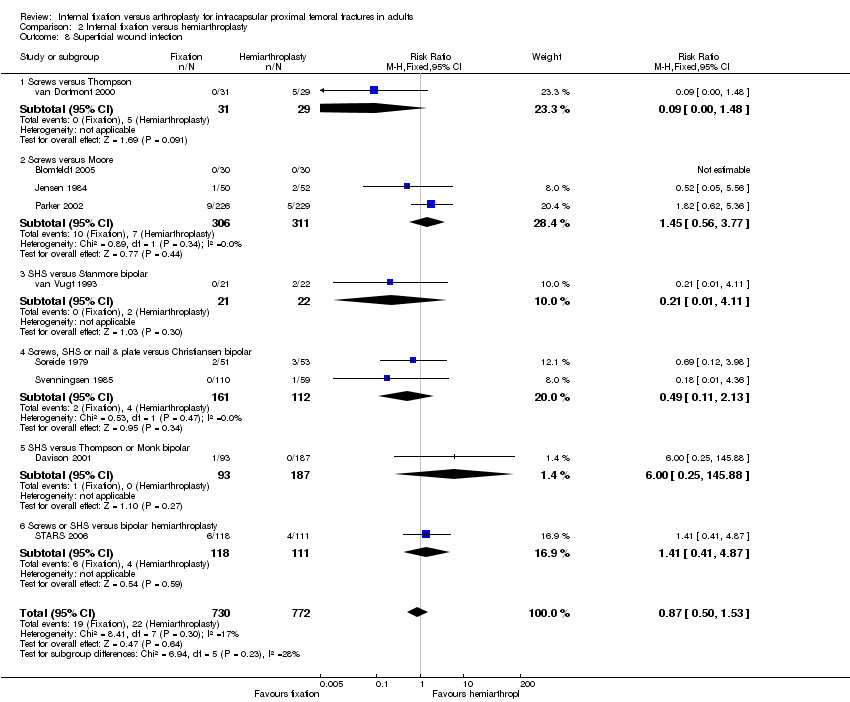
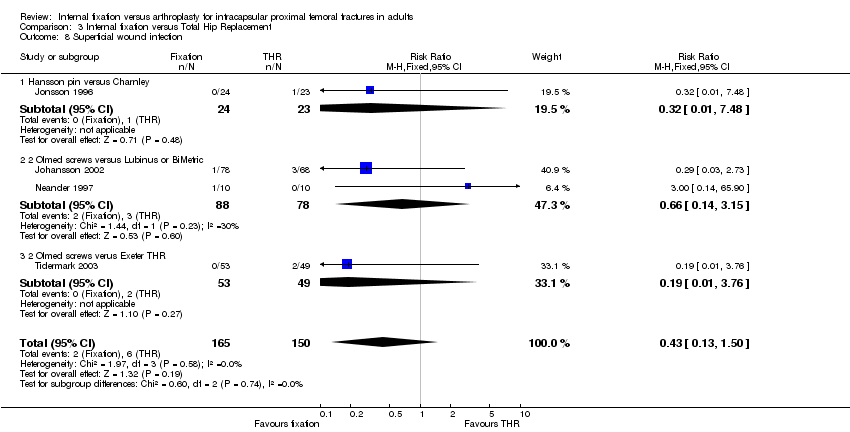
| 15 Superficial wound infection Show forest plot | 14 | 1986 | Risk Ratio (M‐H, Fixed, 95% CI) | 0.85 [0.53, 1.38] |
|
| 15.1 Fixation versus hemiarthroplasty | 9 | 1373 | Risk Ratio (M‐H, Fixed, 95% CI) | 0.86 [0.46, 1.58] |
| 15.2 Fixation versus total hip replacement | 4 | 315 | Risk Ratio (M‐H, Fixed, 95% CI) | 0.43 [0.13, 1.50] |
| 15.3 Internal fixation versus replacement arthroplasty (various) | 1 | 298 | Risk Ratio (M‐H, Fixed, 95% CI) | 1.53 [0.50, 4.62] |
| 16 Deep wound infection Show forest plot | 15 | 2825 | Risk Ratio (M‐H, Fixed, 95% CI) | 0.53 [0.30, 0.93] |
|
| 16.1 Fixation versus hemiarthroplasty | 10 | 1592 | Risk Ratio (M‐H, Fixed, 95% CI) | 0.47 [0.24, 0.91] |
| 16.2 Fixation versus total hip replacement | 2 | 248 | Risk Ratio (M‐H, Fixed, 95% CI) | 2.62 [0.11, 63.28] |
| 16.3 Internal fixation versus replacement arthroplasty (various) | 3 | 985 | Risk Ratio (M‐H, Fixed, 95% CI) | 0.59 [0.17, 2.07] |
| 17 Pneumonia Show forest plot | 5 | 1003 | Risk Ratio (M‐H, Fixed, 95% CI) | 0.84 [0.51, 1.40] |
|
| 17.1 Fixation versus hemiarthroplasty | 4 | 857 | Risk Ratio (M‐H, Fixed, 95% CI) | 0.95 [0.56, 1.61] |
| 17.2 Fixation versus total hip replacement | 1 | 146 | Risk Ratio (M‐H, Fixed, 95% CI) | 0.12 [0.01, 2.37] |
| 18 Deep vein thrombosis Show forest plot | 9 | 1558 | Risk Ratio (M‐H, Fixed, 95% CI) | 0.99 [0.50, 1.96] |
|
| 18.1 Fixation versus hemiarthroplasty | 4 | 945 | Risk Ratio (M‐H, Fixed, 95% CI) | 1.41 [0.50, 3.96] |
| 18.2 Fixation versus total hip replacement | 4 | 315 | Risk Ratio (M‐H, Fixed, 95% CI) | 0.35 [0.08, 1.52] |
| 18.3 Internal fixation versus replacement arthroplasty (various) | 1 | 298 | Risk Ratio (M‐H, Fixed, 95% CI) | 1.53 [0.39, 5.98] |
| 19 Pulmonary embolism Show forest plot | 9 | 1558 | Risk Ratio (M‐H, Fixed, 95% CI) | 1.30 [0.59, 2.86] |
|
| 19.1 Fixation versus hemiarthroplasty | 4 | 945 | Risk Ratio (M‐H, Fixed, 95% CI) | 1.89 [0.58, 6.15] |
| 19.2 Fixation versus total hip replacement | 4 | 315 | Risk Ratio (M‐H, Fixed, 95% CI) | 1.92 [0.37, 10.12] |
| 19.3 Internal fixation versus replacement arthroplasty (various) | 1 | 298 | Risk Ratio (M‐H, Fixed, 95% CI) | 0.51 [0.10, 2.48] |
| 20 Thromboembolic complications combined Show forest plot | 13 | 2174 | Risk Ratio (M‐H, Fixed, 95% CI) | 1.13 [0.70, 1.83] |
|
| 20.1 Fixation versus hemiarthroplasty | 7 | 1152 | Risk Ratio (M‐H, Fixed, 95% CI) | 1.34 [0.67, 2.68] |
| 20.2 Fixation versus total hip replacement | 4 | 315 | Risk Ratio (M‐H, Fixed, 95% CI) | 0.67 [0.22, 2.06] |
| 20.3 Internal fixation versus replacement arthroplasty (various) | 2 | 707 | Risk Ratio (M‐H, Fixed, 95% CI) | 1.19 [0.52, 2.72] |
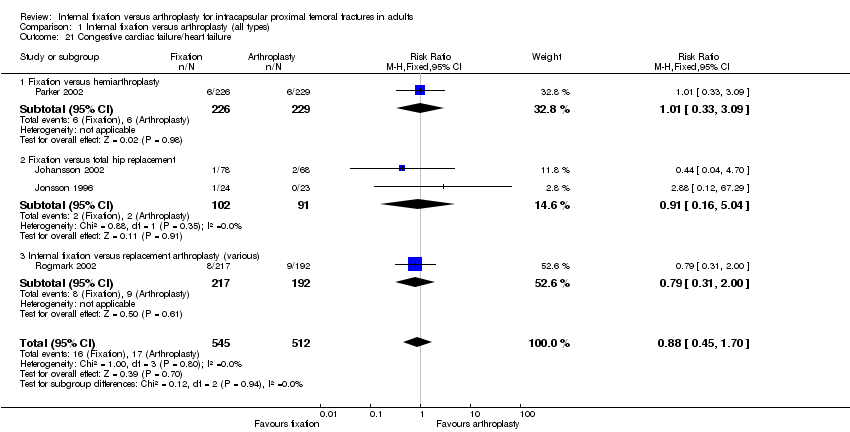
| 21 Congestive cardiac failure/heart failure Show forest plot | 4 | 1057 | Risk Ratio (M‐H, Fixed, 95% CI) | 0.88 [0.45, 1.70] |
|
| 21.1 Fixation versus hemiarthroplasty | 1 | 455 | Risk Ratio (M‐H, Fixed, 95% CI) | 1.01 [0.33, 3.09] |
| 21.2 Fixation versus total hip replacement | 2 | 193 | Risk Ratio (M‐H, Fixed, 95% CI) | 0.91 [0.16, 5.04] |
| 21.3 Internal fixation versus replacement arthroplasty (various) | 1 | 409 | Risk Ratio (M‐H, Fixed, 95% CI) | 0.79 [0.31, 2.00] |
| 22 Myocardial infarction Show forest plot | 6 | 1068 | Risk Ratio (M‐H, Fixed, 95% CI) | 0.58 [0.22, 1.51] |
|
| 22.1 Fixation versus hemiarthroplasty | 1 | 455 | Risk Ratio (M‐H, Fixed, 95% CI) | 5.07 [0.24, 104.94] |
| 22.2 Fixation versus total hip replacement | 4 | 315 | Risk Ratio (M‐H, Fixed, 95% CI) | 0.47 [0.12, 1.82] |
| 22.3 Internal fixation versus replacement arthroplasty (various) | 1 | 298 | Risk Ratio (M‐H, Fixed, 95% CI) | 0.25 [0.03, 2.08] |
| 23 Stroke (cerebrovascular accident) Show forest plot | 9 | 1645 | Risk Ratio (M‐H, Fixed, 95% CI) | 0.85 [0.43, 1.69] |
|
| 23.1 Fixation versus hemiarthroplasty | 4 | 725 | Risk Ratio (M‐H, Fixed, 95% CI) | 0.84 [0.23, 3.09] |
| 23.2 Fixation versus total hip replacement | 3 | 213 | Risk Ratio (M‐H, Fixed, 95% CI) | 0.94 [0.20, 4.50] |
| 23.3 Internal fixation versus replacement arthroplasty (various) | 2 | 707 | Risk Ratio (M‐H, Fixed, 95% CI) | 0.83 [0.32, 2.11] |
| 24 Confusional state Show forest plot | 2 | | Risk Ratio (M‐H, Fixed, 95% CI) | Subtotals only |
|
| 24.1 Fixation versus hemiarthroplasty | 2 | 675 | Risk Ratio (M‐H, Fixed, 95% CI) | 0.88 [0.55, 1.39] |
| 25 Gastrointestinal complications Show forest plot | 3 | 703 | Risk Ratio (M‐H, Fixed, 95% CI) | 0.54 [0.23, 1.30] |
|
| 25.1 Hemiarthroplasty | 2 | 557 | Risk Ratio (M‐H, Fixed, 95% CI) | 0.78 [0.28, 2.13] |
| 25.2 Total hip replacement | 1 | 146 | Risk Ratio (M‐H, Fixed, 95% CI) | 0.17 [0.02, 1.46] |
| 26 Pressure sores Show forest plot | 7 | 1380 | Risk Ratio (M‐H, Fixed, 95% CI) | 1.11 [0.55, 2.23] |
|
| 26.1 Fixation versus hemiarthroplasty | 4 | 819 | Risk Ratio (M‐H, Fixed, 95% CI) | 1.12 [0.47, 2.66] |
| 26.2 Fixation versus total hip replacement | 2 | 152 | Risk Ratio (M‐H, Fixed, 95% CI) | 1.45 [0.25, 8.31] |
| 26.3 Internal fixation versus replacement arthroplasty (various) | 1 | 409 | Risk Ratio (M‐H, Fixed, 95% CI) | 0.88 [0.18, 4.33] |
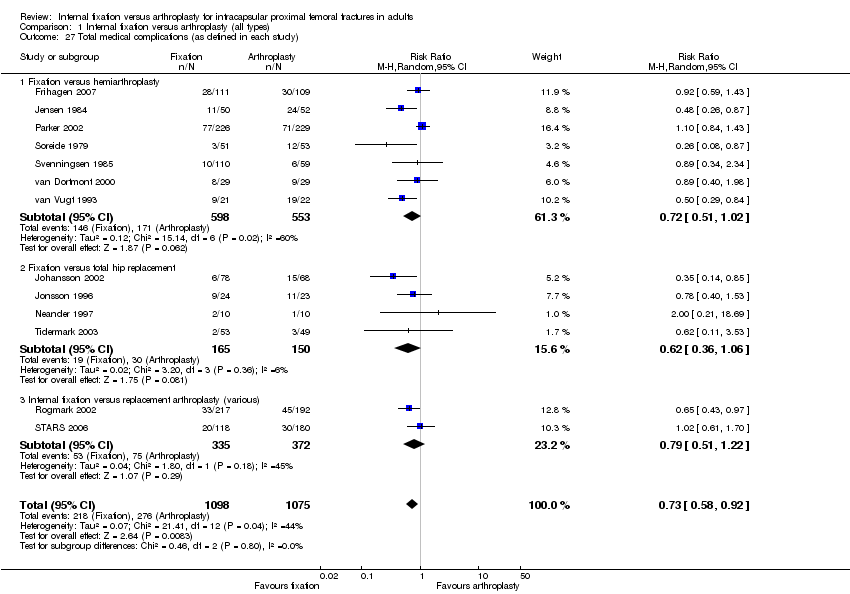
| 27 Total medical complications (as defined in each study) Show forest plot | 13 | 2173 | Risk Ratio (M‐H, Random, 95% CI) | 0.73 [0.58, 0.92] |
|
| 27.1 Fixation versus hemiarthroplasty | 7 | 1151 | Risk Ratio (M‐H, Random, 95% CI) | 0.72 [0.51, 1.02] |
| 27.2 Fixation versus total hip replacement | 4 | 315 | Risk Ratio (M‐H, Random, 95% CI) | 0.62 [0.36, 1.06] |
| 27.3 Internal fixation versus replacement arthroplasty (various) | 2 | 707 | Risk Ratio (M‐H, Random, 95% CI) | 0.79 [0.51, 1.22] |
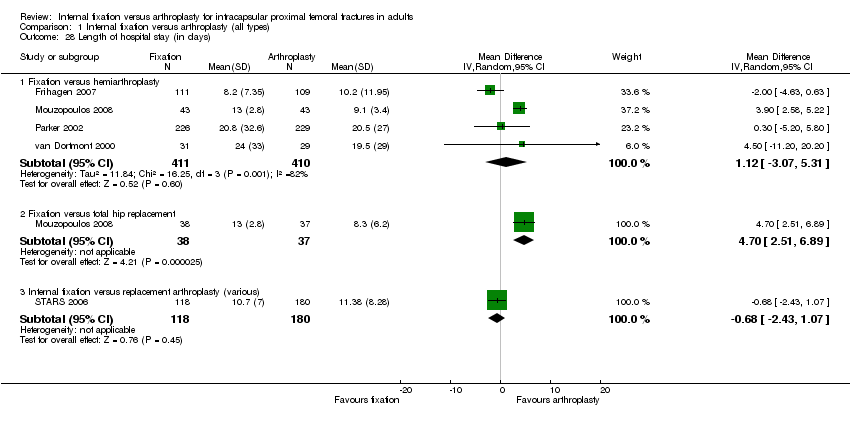
| 28 Length of hospital stay (in days) Show forest plot | 5 | | Mean Difference (IV, Random, 95% CI) | Subtotals only |
|
| 28.1 Fixation versus hemiarthroplasty | 4 | 821 | Mean Difference (IV, Random, 95% CI) | 1.12 [‐3.07, 5.31] |
| 28.2 Fixation versus total hip replacement | 1 | 75 | Mean Difference (IV, Random, 95% CI) | 4.70 [2.51, 6.89] |
| 28.3 Internal fixation versus replacement arthroplasty (various) | 1 | 298 | Mean Difference (IV, Random, 95% CI) | ‐0.68 [‐2.43, 1.07] |
| 29 Mortality 30 days Show forest plot | 4 | 780 | Risk Ratio (M‐H, Fixed, 95% CI) | 0.76 [0.46, 1.24] |
|
| 29.1 Fixation versus hemiarthroplasty | 4 | 780 | Risk Ratio (M‐H, Fixed, 95% CI) | 0.76 [0.46, 1.24] |
| 30 Mortality up to 3 to 6 months Show forest plot | 15 | 2320 | Risk Ratio (M‐H, Fixed, 95% CI) | 0.87 [0.70, 1.08] |
|
| 30.1 Fixation versus hemiarthroplasty | 10 | 1345 | Risk Ratio (M‐H, Fixed, 95% CI) | 0.84 [0.66, 1.07] |
| 30.2 Fixation versus total hip replacement | 3 | 268 | Risk Ratio (M‐H, Fixed, 95% CI) | 2.52 [0.89, 7.14] |
| 30.3 Internal fixation versus replacement arthroplasty (various) | 2 | 707 | Risk Ratio (M‐H, Fixed, 95% CI) | 0.66 [0.34, 1.27] |
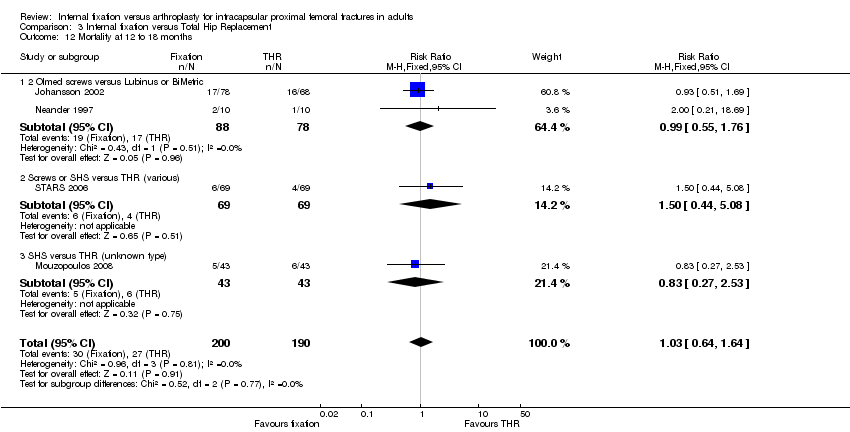
| 31 Mortality up to 12 months Show forest plot | 14 | 2317 | Risk Ratio (M‐H, Fixed, 95% CI) | 0.95 [0.81, 1.11] |
|
| 31.1 Fixation versus hemiarthroplasty | 8 | 1213 | Risk Ratio (M‐H, Fixed, 95% CI) | 0.94 [0.78, 1.13] |
| 31.2 Fixation versus total hip replacement | 3 | 268 | Risk Ratio (M‐H, Fixed, 95% CI) | 1.18 [0.68, 2.05] |
| 31.3 Internal fixation versus replacement arthroplasty (various) | 3 | 836 | Risk Ratio (M‐H, Fixed, 95% CI) | 0.89 [0.61, 1.30] |
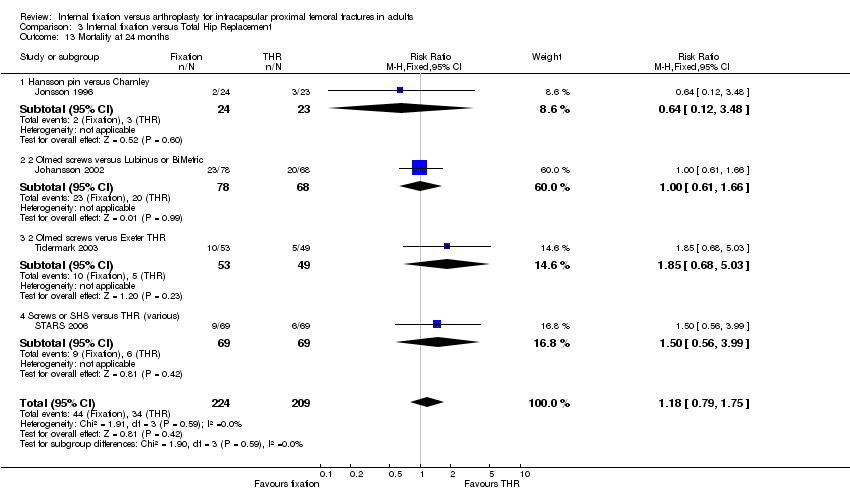
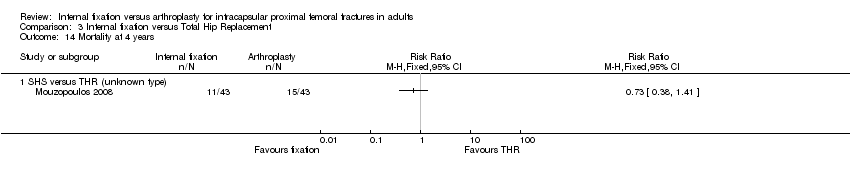
| 32 Mortality up to 24 to 48 months Show forest plot | 15 | 2335 | Risk Ratio (M‐H, Fixed, 95% CI) | 0.97 [0.87, 1.09] |
|
| 32.1 Fixation versus hemiarthroplasty | 9 | 1204 | Risk Ratio (M‐H, Fixed, 95% CI) | 0.96 [0.84, 1.10] |
| 32.2 Fixation versus total hip replacement | 3 | 295 | Risk Ratio (M‐H, Fixed, 95% CI) | 1.04 [0.71, 1.53] |
| 32.3 Internal fixation versus replacement arthroplasty (various) | 3 | 836 | Risk Ratio (M‐H, Fixed, 95% CI) | 0.98 [0.74, 1.29] |
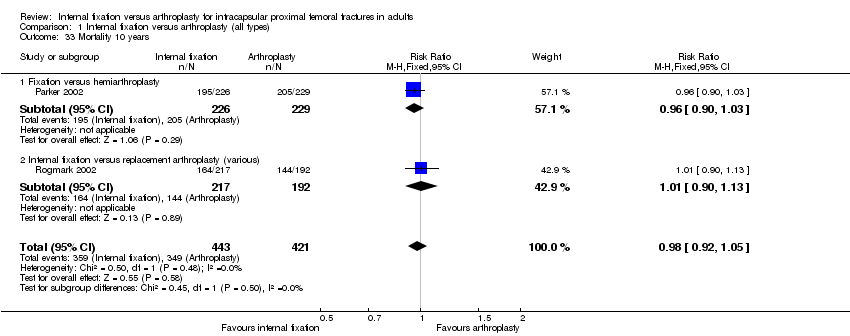
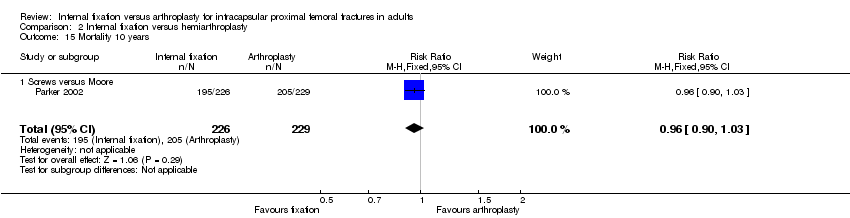
| 33 Mortality 10 years Show forest plot | 2 | 864 | Risk Ratio (M‐H, Fixed, 95% CI) | 0.98 [0.92, 1.05] |
|
| 33.1 Fixation versus hemiarthroplasty | 1 | 455 | Risk Ratio (M‐H, Fixed, 95% CI) | 0.96 [0.90, 1.03] |
| 33.2 Internal fixation versus replacement arthroplasty (various) | 1 | 409 | Risk Ratio (M‐H, Fixed, 95% CI) | 1.01 [0.90, 1.13] |
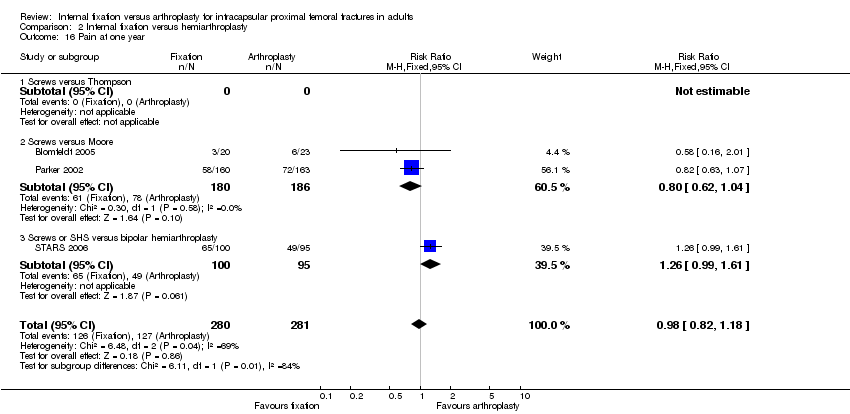
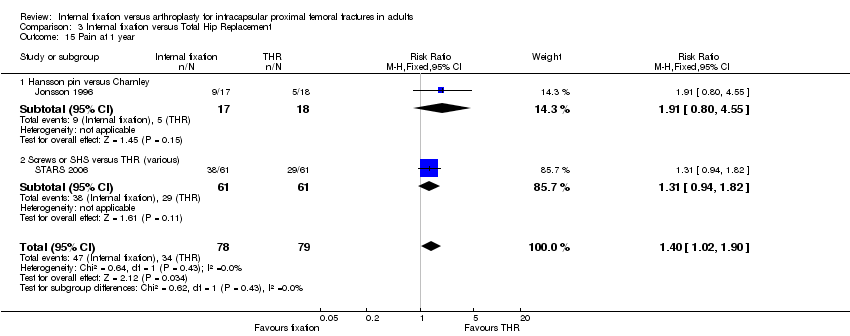
| 34 Residual pain at 1 year Show forest plot | 5 | 750 | Risk Ratio (M‐H, Random, 95% CI) | 1.24 [0.79, 1.94] |
|
| 34.1 Fixation versus hemiarthroplasty | 2 | 366 | Risk Ratio (M‐H, Random, 95% CI) | 0.81 [0.62, 1.05] |
| 34.2 Fixation versus total hip replacement | 2 | 128 | Risk Ratio (M‐H, Random, 95% CI) | 3.08 [0.90, 10.56] |
| 34.3 Internal fixation versus replacement arthroplasty (various) | 1 | 256 | Risk Ratio (M‐H, Random, 95% CI) | 1.3 [1.05, 1.61] |
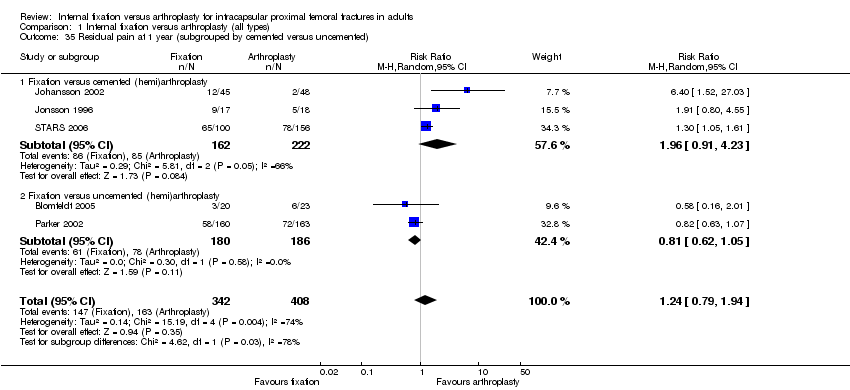
| 35 Residual pain at 1 year (subgrouped by cemented versus uncemented) Show forest plot | 5 | 750 | Risk Ratio (M‐H, Random, 95% CI) | 1.24 [0.79, 1.94] |
|
| 35.1 Fixation versus cemented (hemi)arthroplasty | 3 | 384 | Risk Ratio (M‐H, Random, 95% CI) | 1.96 [0.91, 4.23] |
| 35.2 Fixation versus uncemented (hemi)arthroplasty | 2 | 366 | Risk Ratio (M‐H, Random, 95% CI) | 0.81 [0.62, 1.05] |
| 36 Mean pain score at 1 to 2 years Show forest plot | 3 | 521 | Std. Mean Difference (IV, Random, 95% CI) | ‐0.21 [‐0.68, 0.26] |
|
| 36.1 Internal fixation versus hemiarthroplasty | 2 | 437 | Std. Mean Difference (IV, Random, 95% CI) | ‐0.02 [‐0.43, 0.39] |
| 36.2 Internal fixation versus replacement arthroplasty (various types) | 1 | 84 | Std. Mean Difference (IV, Random, 95% CI) | ‐0.62 [‐1.06, ‐0.19] |
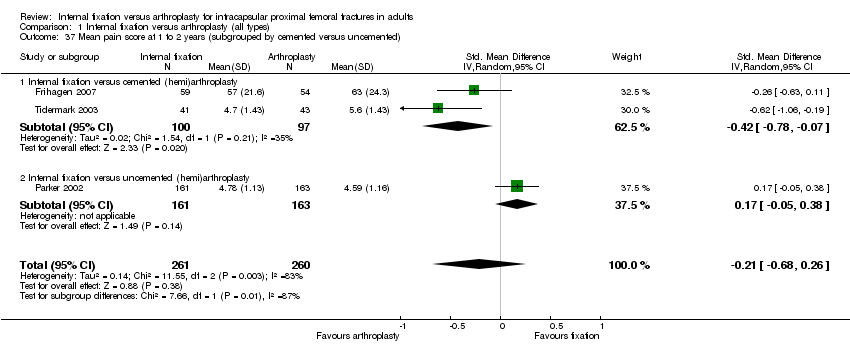
| 37 Mean pain score at 1 to 2 years (subgrouped by cemented versus uncemented) Show forest plot | 3 | 521 | Std. Mean Difference (IV, Random, 95% CI) | ‐0.21 [‐0.68, 0.26] |
|
| 37.1 Internal fixation versus cemented (hemi)arthroplasty | 2 | 197 | Std. Mean Difference (IV, Random, 95% CI) | ‐0.42 [‐0.78, ‐0.07] |
| 37.2 Internal fixation versus uncemented (hemi)arthroplasty | 1 | 324 | Std. Mean Difference (IV, Random, 95% CI) | 0.17 [‐0.05, 0.38] |
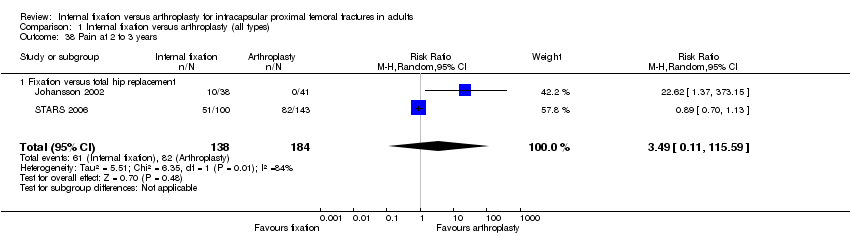
| 38 Pain at 2 to 3 years Show forest plot | 2 | 322 | Risk Ratio (M‐H, Random, 95% CI) | 3.49 [0.11, 115.59] |
|
| 38.1 Fixation versus total hip replacement | 2 | 322 | Risk Ratio (M‐H, Random, 95% CI) | 3.49 [0.11, 115.59] |
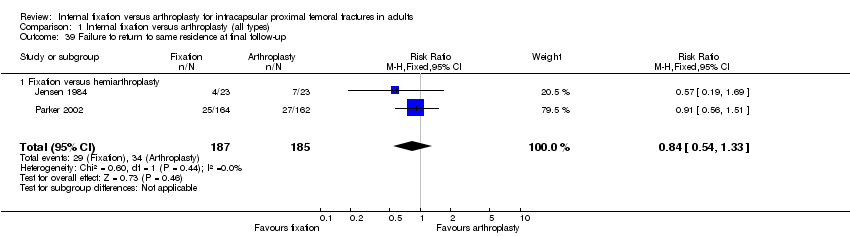
| 39 Failure to return to same residence at final follow‐up Show forest plot | 2 | 372 | Risk Ratio (M‐H, Fixed, 95% CI) | 0.84 [0.54, 1.33] |
|
| 39.1 Fixation versus hemiarthroplasty | 2 | 372 | Risk Ratio (M‐H, Fixed, 95% CI) | 0.84 [0.54, 1.33] |
| 40 Failure to regain mobility Show forest plot | 6 | 593 | Risk Ratio (M‐H, Random, 95% CI) | 1.02 [0.74, 1.39] |
|
| 40.1 Fixation versus hemiarthroplasty | 6 | 593 | Risk Ratio (M‐H, Random, 95% CI) | 1.02 [0.74, 1.39] |
| 41 Harris hip score (at 1 year) Show forest plot | 2 | | Mean Difference (IV, Fixed, 95% CI) | Subtotals only |
|
| 41.1 Fixation versus hemiarthroplasty | 2 | 223 | Mean Difference (IV, Fixed, 95% CI) | ‐6.61 [‐9.73, ‐3.49] |
| 41.2 Fixation versus total hip replacement | 1 | 65 | Mean Difference (IV, Fixed, 95% CI) | ‐10.30 [‐12.78, ‐7.82] |
| 42 Hip rating questionnaire at 1 year Show forest plot | 1 | | Mean Difference (IV, Fixed, 95% CI) | Totals not selected |
|
| 42.1 Fixation versus hemiarthroplasty | 1 | | Mean Difference (IV, Fixed, 95% CI) | 0.0 [0.0, 0.0] |
| 42.2 Fixation versus total hip replacement | 1 | | Mean Difference (IV, Fixed, 95% CI) | 0.0 [0.0, 0.0] |
| 43 Hip scores (at 1 year) Show forest plot | 3 | | Std. Mean Difference (IV, Fixed, 95% CI) | Subtotals only |
|
| 43.1 Fixation versus hemiarthroplasty | 3 | 374 | Std. Mean Difference (IV, Fixed, 95% CI) | ‐0.38 [‐0.58, ‐0.17] |
| 43.2 Fixation versus total hip replacement | 2 | 168 | Std. Mean Difference (IV, Fixed, 95% CI) | ‐0.77 [‐1.10, ‐0.45] |
| 44 Mean Eq‐5d score (at 1 year) Show forest plot | 2 | | Mean Difference (IV, Fixed, 95% CI) | Subtotals only |
|
| 44.1 Fixation versus hemiarthroplasty | 2 | 341 | Mean Difference (IV, Fixed, 95% CI) | ‐0.07 [‐0.14, ‐0.00] |
| 44.2 Fixation versus total hip replacement | 1 | 130 | Mean Difference (IV, Fixed, 95% CI) | ‐0.12 [‐0.33, 0.09] |
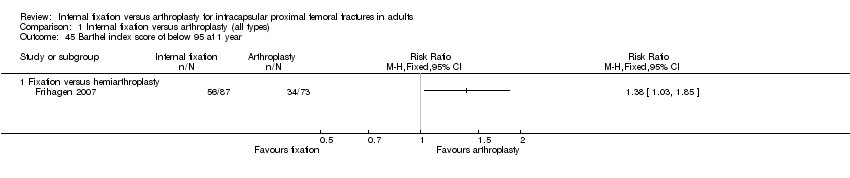
| 45 Barthel index score of below 95 at 1 year Show forest plot | 1 | | Risk Ratio (M‐H, Fixed, 95% CI) | Totals not selected |
|
| 45.1 Fixation versus hemiarthroplasty | 1 | | Risk Ratio (M‐H, Fixed, 95% CI) | 0.0 [0.0, 0.0] |