Fijación interna versus artroplastia para las fracturas intracapsulares del extremo proximal del fémur en adultos
Referencias
Referencias de los estudios incluidos en esta revisión
Referencias de los estudios excluidos de esta revisión
Referencias adicionales
Referencias de otras versiones publicadas de esta revisión
Characteristics of studies
Characteristics of included studies [ordered by study ID]
Ir a:
| Methods | Randomisation by: sealed envelopes technique | |
| Participants | One hospital, Karolinska Institute at Stockholm Söder Hospital, Sweden. | |
| Interventions | 1. Reduction and fixation with two cannulated screws versus | |
| Outcomes | Follow‐up for 24 months | |
| Notes | Additional information supplied by trialists | |
| Risk of bias | ||
| Bias | Authors' judgement | Support for judgement |
| Random sequence generation (selection bias) | Unclear risk | Not stated |
| Allocation concealment (selection bias) | Unclear risk | 'sealed envelopes technique' |
| Blinding (performance bias and detection bias) | High risk | not mentioned |
| Methods | Randomisation by: computer generation of random numbers. | |
| Participants | General hospital, Leicester, UK. | |
| Interventions | 1. Reduction and fixation with 'Ambi' compression hip screw (AHS) and 2 hole plate versus: | |
| Outcomes | Follow‐up for 5 years at 6/52, 1/12, 24/12, 36/12, 48/12, 60/12. Actual minimum 2 years | |
| Notes | Discrepancy with abstract 1997 which mentions 282 patients. | |
| Risk of bias | ||
| Bias | Authors' judgement | Support for judgement |
| Random sequence generation (selection bias) | Low risk | 'computer generation of random numbers' |
| Allocation concealment (selection bias) | Unclear risk | 'computer generation of random numbers' |
| Blinding (performance bias and detection bias) | Low risk | Home assessment of patients by observer blinded to type of operative treatment |
| Methods | Randomisation by: sealed opaque numbered envelopes. | |
| Participants | One university hospital, Oslo, Norway | |
| Interventions | 1. Reduction and fixation with two Olmed screws versus | |
| Outcomes | Follow‐up for 48 months | |
| Notes | ||
| Risk of bias | ||
| Bias | Authors' judgement | Support for judgement |
| Random sequence generation (selection bias) | Low risk | 'envelopes sealed and mixed before they were numbered' |
| Allocation concealment (selection bias) | Low risk | 'opaque envelopes' which were sealed and mixed before being numbered |
| Blinding (performance bias and detection bias) | Low risk | The physiotherapist undertaking the follow‐up assessments was blinded to the treatment group |
| Methods | Randomisation by: random numbers using sealed opaque envelopes. | |
| Participants | One hospital, Ashrus, Denmark. | |
| Interventions | 1. Reduction and fixation with 4 AO screws versus | |
| Outcomes | Follow‐up for 24 months | |
| Notes | Additional information from Dr Jensen | |
| Risk of bias | ||
| Bias | Authors' judgement | Support for judgement |
| Random sequence generation (selection bias) | Low risk | random numbers using sealed opaque envelopes. |
| Allocation concealment (selection bias) | Unclear risk | random numbers using sealed opaque envelopes |
| Blinding (performance bias and detection bias) | High risk | no mention of blinding |
| Methods | Randomisation by: sequentially numbered sealed envelopes. Only those patients allocated to THR were consented to the study | |
| Participants | One orthopaedic hospital, Linkoping, Sweden. | |
| Interventions | 1. Reduction and fixation with 2 parallel Olmed screws versus | |
| Outcomes | Follow‐up for 24 months | |
| Notes | 146 fractures in 143 patients. 5 further cases were allocated to THR but refused to participate and excluded and a further 11 were excluded after randomisation. Additional publication looking at heterotopic ossification. Appears to use same patients as main study although there is a discrepancy in the dates patients were included between the two papers. | |
| Risk of bias | ||
| Bias | Authors' judgement | Support for judgement |
| Random sequence generation (selection bias) | Unclear risk | Not stated how the envelopes were prepared. |
| Allocation concealment (selection bias) | Unclear risk | Numbered sequentially sealed envelopes were used and then only those allocated to THR were consented to the study. It remains unclear if for those allocated to THR any patients refused and were then excluded. |
| Blinding (performance bias and detection bias) | High risk | no mention of blinding |
| Methods | Randomisation by: sealed envelope. | |
| Participants | One hospital, Malmo, Sweden. | |
| Interventions | 1. Reduction and fixation with Hansson hook pins versus | |
| Outcomes | Follow‐up for 24 months | |
| Notes | Pilot study. | |
| Risk of bias | ||
| Bias | Authors' judgement | Support for judgement |
| Random sequence generation (selection bias) | Unclear risk | 'sealed envelope' |
| Allocation concealment (selection bias) | Unclear risk | 'sealed envelope' |
| Blinding (performance bias and detection bias) | High risk | no mention of blinding |
| Methods | Method of randomisation: alternation | |
| Participants | Orthopaedic unit in Athens, Greece From April 1999 to April 2002 | |
| Interventions | 1. Internal fixation with a Sliding Hip Screw 2. Merte hemiarthroplasty versus | |
| Outcomes | Follow‐up for 48 months | |
| Notes | Eight patients who had had a previous hip fracture and 18 patients who had a revision operation were excluded from the follow‐up assessments. | |
| Risk of bias | ||
| Bias | Authors' judgement | Support for judgement |
| Random sequence generation (selection bias) | High risk | 'these 129 participants were randomly divided, by two orthopaedic surgeons, into three groups according to the type of surgical operation there were to undergo, following this order: hemi‐arthroplasty, total arthroplasty, internal fixation, etc" |
| Allocation concealment (selection bias) | High risk | alternation: as above |
| Blinding (performance bias and detection bias) | Low risk | Assessors of function were blinded to the type of surgery |
| Methods | Randomisation by: closed envelopes. | |
| Participants | One hospital, Stockholm, Sweden. | |
| Interventions | 1. Reduction and fixation with 2 parallel Olmed screws versus | |
| Outcomes | Follow‐up for 18 months | |
| Notes | Four patients not included in bone mineral density analysis | |
| Risk of bias | ||
| Bias | Authors' judgement | Support for judgement |
| Random sequence generation (selection bias) | Unclear risk | no mentioned |
| Allocation concealment (selection bias) | Unclear risk | closed envelopes |
| Blinding (performance bias and detection bias) | High risk | no mention of blinding |
| Methods | Randomisation by: sealed opaque identical envelopes containing the instructions about the type of operation. | |
| Participants | One hospital, Peterborough, UK. | |
| Interventions | 1. Reduction and fixation with 3 AO screws versus | |
| Outcomes | Follow‐up for minimum 1 year for all survivors for initial report. Subsequent long‐term follow‐up report with mean follow‐up of survivors of 10.6 years (range 9‐15 years) | |
| Notes | One year results published as for the principle reference. Subsequent report with long‐term follow up of the patients. Additional data supplied by MJ Parker. | |
| Risk of bias | ||
| Bias | Authors' judgement | Support for judgement |
| Random sequence generation (selection bias) | Unclear risk | envelopes containing the operative instructions were not independently prepared |
| Allocation concealment (selection bias) | Unclear risk | sealed opaque identical envelopes |
| Blinding (performance bias and detection bias) | High risk | All outcomes recorded by lead trialists |
| Methods | Randomisation by: sealed envelopes. | |
| Participants | one centre, Tampere, Finland | |
| Interventions | 1. Reduction and fixation with 3 Ulleval screws versus | |
| Outcomes | Follow‐up for 2 years at 6 weeks, 3, 12, 24 months | |
| Notes | Study terminated early due to high complication rate in fixation group. One patient randomised to receive internal fixation was excluded from the study as acceptable reduction of the fracture could not be achieved and this patient was treated with an arthroplasty. | |
| Risk of bias | ||
| Bias | Authors' judgement | Support for judgement |
| Random sequence generation (selection bias) | Unclear risk | not stated |
| Allocation concealment (selection bias) | Unclear risk | 'sealed envelopes' |
| Blinding (performance bias and detection bias) | High risk | no mention of blinding of assessors of pain and function |
| Methods | Randomisation by: sealed envelopes. | |
| Participants | One hospital, Sundsvall County Hospital, Sweden. | |
| Interventions | 1. Reduction and fixation with 2 von Bahr screws versus | |
| Outcomes | Follow‐up for minimum 5 years all survivors | |
| Notes | Extra information supplied by trialists | |
| Risk of bias | ||
| Bias | Authors' judgement | Support for judgement |
| Random sequence generation (selection bias) | Unclear risk | not stated |
| Allocation concealment (selection bias) | Unclear risk | 'sealed envelopes' opened in the operating room |
| Blinding (performance bias and detection bias) | High risk | no mention of blinding of assessors of pain and function |
| Methods | Randomisation by: sealed, opaque numbered envelopes drawn sequentially. | |
| Participants | Multicentre: 12 centres in Sweden | |
| Interventions | 1. Reduction and fixation with Hansson hook‐pins or Olmed screws versus | |
| Outcomes | Follow‐up for 24 months | |
| Notes | Twenty‐six patients did not attend 2 year control (failure status reported at 1 year) | |
| Risk of bias | ||
| Bias | Authors' judgement | Support for judgement |
| Random sequence generation (selection bias) | Unclear risk | not clearly stated |
| Allocation concealment (selection bias) | Low risk | 'sealed numbered opaque envelopes' |
| Blinding (performance bias and detection bias) | High risk | no mention of blinding of assessors of pain and function |
| Methods | Randomisation by: day of week | |
| Participants | One hospital, Kent, UK. | |
| Interventions | 1. Reduction and fixation with Richard's compression screw plate | |
| Outcomes | Follow‐up for 13 years | |
| Notes | 290 patients randomised; 19 patients excluded after randomisation (patients not traceable, missing medical records, wrong randomisation or patients unfit to be assessed) 1 year results published in Injury 1989 for 278 patients. | |
| Risk of bias | ||
| Bias | Authors' judgement | Support for judgement |
| Random sequence generation (selection bias) | High risk | 'randomly allocated according to one of the following three methods of treatment according to the day of the week on which they were admitted' |
| Allocation concealment (selection bias) | High risk | 'randomly allocated according to one of the following three methods of treatment according to the day of the week on which they were admitted' |
| Blinding (performance bias and detection bias) | High risk | No mention of blinding of assessors of pain and function |
| Methods | Randomisation by: date of birth. | |
| Participants | One hospital, Bergen, Norway. | |
| Interventions | ‐Reduction and fixation with von Bahr screws versus | |
| Outcomes | Follow‐up for 12 months | |
| Notes | Fractures include Garden II‐IV. | |
| Risk of bias | ||
| Bias | Authors' judgement | Support for judgement |
| Random sequence generation (selection bias) | High risk | 'randomized into two groups according to their date of birth' |
| Allocation concealment (selection bias) | High risk | 'randomized into two groups according to their date of birth' |
| Blinding (performance bias and detection bias) | High risk | No mention of blinding of assessors of pain and function |
| Methods | Randomisation by: computer telephone randomisation service. | |
| Participants | 11 hospitals in Scotland, UK | |
| Interventions | 1. Reduction and fixation with cancellous screws or sliding hip screw | |
| Outcomes | Follow‐up for 24 months | |
| Notes | Additional information supplied by trialists | |
| Risk of bias | ||
| Bias | Authors' judgement | Support for judgement |
| Random sequence generation (selection bias) | Low risk | 'centralized fully automated computer‐based telephone service' |
| Allocation concealment (selection bias) | Low risk | 'centralized fully automated computer‐based telephone service' |
| Blinding (performance bias and detection bias) | High risk | No mention of blinding of assessors of pain and function |
| Methods | Randomisation by: method not stated. | |
| Participants | One hospital, Trondheim, Norway. | |
| Interventions | 1. Reduction and fixation with compression screw versus | |
| Outcomes | Follow‐up for 36 months. | |
| Notes | Translation obtained for main points of article. Previous publication in Acta Orthop Scand 1984 reports better results in SHS group compared to nail‐plate in undisplaced and displaced fractures. | |
| Risk of bias | ||
| Bias | Authors' judgement | Support for judgement |
| Random sequence generation (selection bias) | Unclear risk | Not stated |
| Allocation concealment (selection bias) | Unclear risk | Not stated |
| Blinding (performance bias and detection bias) | High risk | No mention of blinding of assessors of pain and function |
| Methods | Randomisation by: sealed envelopes. | |
| Participants | One hospital, Karolinska Institute at Stockholm Söder Hospital, Sweden. | |
| Interventions | 1. Reduction and fixation with two cannulated screws versus | |
| Outcomes | Follow‐up for 48 months | |
| Notes | Additional information provided by trialists | |
| Risk of bias | ||
| Bias | Authors' judgement | Support for judgement |
| Random sequence generation (selection bias) | Unclear risk | 'sealed envelope technique' |
| Allocation concealment (selection bias) | Unclear risk | 'sealed envelope technique' |
| Blinding (performance bias and detection bias) | High risk | No mention of blinding of assessors of pain and function |
| Methods | Randomisation by: method not stated. | |
| Participants | One hospital, Rotterdam, Netherlands. | |
| Interventions | 1. Reduction and fixation with 3 AO/ASIF screws versus | |
| Outcomes | Follow‐up for 24 months | |
| Notes | Study specifically for patients with senile dementia | |
| Risk of bias | ||
| Bias | Authors' judgement | Support for judgement |
| Random sequence generation (selection bias) | Unclear risk | Not stated |
| Allocation concealment (selection bias) | Unclear risk | Not stated |
| Blinding (performance bias and detection bias) | High risk | No mention of blinding of assessors of pain and function |
| Methods | Randomisation by: method not stated. | |
| Participants | One hospital, Leyenburg, The Hague, Netherlands. | |
| Interventions | 1. Reduction and fixation with dynamic hip screw versus | |
| Outcomes | Follow‐up for 36 months | |
| Notes | ||
| Risk of bias | ||
| Bias | Authors' judgement | Support for judgement |
| Random sequence generation (selection bias) | Unclear risk | Not stated |
| Allocation concealment (selection bias) | Unclear risk | Not stated |
| Blinding (performance bias and detection bias) | High risk | No mention of blinding of assessors of pain and function |
Characteristics of excluded studies [ordered by study ID]
Ir a:
| Study | Reason for exclusion |
| This study involved 34 patients, aged over 50 years, who were allocated to fixation with Knowles or Neufeld pins or replacement with a cemented bipolar hemiarthroplasty (type not specified). Follow‐up of patients averaged 19 months. Minimal data reported. Patients receiving hemiarthroplasties had statistically significantly longer anaesthetic and surgery time and greater blood loss. For length of hospital stay, average pain grade and average mobility grade there was no statistical difference between the two groups. | |
| This study was reported as a randomised comparison of 60 patients with an intracapsular fracture treated with a sliding hip screw and 62 patients treated with a hemiarthroplasty. The choice of treatment was by the preference of the attending surgeon on the day of admission. This study was excluded as it was considered as an inappropriate method of randomisation. (Additional information supplied by the trialists.) | |
| Retrospective survey of 186 patients treated with internal fixation (Smith Petersen pin or pin and plate) or primary prosthesis (Judet or Moore). The author concluded that there was a lower morbidity and mortality rate following fixation. Excluded as not randomised. | |
| Retrospective review of 200 patients treated with internal fixation (Thornton nail‐plate, Ken nail or Knowles pins) or prosthetic replacement (Thompson or Moore) . The author concluded that internal fixation gave lower morbidity, mortality and better results than prosthetic replacement. Excluded as not randomised. | |
| This was a randomised trial of 100 patients allocated to fixation with Olmed screws or replacement with a cemented BiMetric total hip replacement. Follow‐up was for 48 months. The authors concluded that there was an unacceptably high complication and re‐operation rate in the osteosynthesis group. Patients with total hip arthroplasty had fewer complications and a better clinical outcome after four years. This trial was excluded due to inadequate randomisation procedure. The first 20 patients were randomised with closed envelopes but the last 80 were allocated according to the day of week they were admitted (Monday to Thursday total hip replacement, Friday to Sunday reduction and fixation). The 17 year follow‐up of the trial was registered in 2011. | |
| This was a comparative study of 200 patients, 94 treated by internal fixation with two Garden screws and 104 with a hemiarthroplasty. Treatment was determined by the preference of the on call consultant, with some using internal fixation and the others arthroplasty. Results showed no significant difference in mortality. Internal fixation had a shorter hospital stay and a higher re‐admission and re‐operation rate. The study was excluded as it was not a randomised study. | |
| This paper was described in the text as a ‘randomized trial of surgical treatment’. Of the 45 included patients, 10 patients were subsequently excluded because of loss to follow‐up. For the remaining 35 patients, 5 were treated with internal fixation with Smith‐Peterson nailing, 10 by internal fixation with Garden screws, 7 with a Thompson hemiarthroplasty and 13 with an Austin Moore hemiarthroplasty. There was limited description of patient characteristics, treatment methods and trial methodology. The only outcomes reported clearly were wound sepsis requiring antibiotics for two patients in the fixation group and five in the arthroplasty group. Nine cases of failure of surgical treatment were reported in the fixation group but it was unclear what constituted failure of treatment. Five wound haematomas and transient sciatic nerve paralysis were reported in the arthroplasty group. Re‐operations were not reported. Regain of mobility was reported at one year but the numbers were unclear. The study was excluded because of the inadequate trial methodology and reporting of the results. | |
| This study was only reported as an abstract. The study involved 151 patients allocated to Garden cross screw fixation or Austin Moore or Thompson prostheses. The author considered that prosthetic replacement gave significantly better results. The study was excluded as it provided no adequate data. | |
| This was a comparative study of 301 patients following fixation with 3 AO screws or replacement with a cemented Thompson hemiarthroplasty. The authors reported a lower incidence of immediate postoperative mortality and infection in the fixation group. Excluded as not randomised. | |
| This was described in the abstract of the paper as a prospective study of 50 patients who were treated with either an Austin Moore hemiarthroplasty or internal fixation with a sliding hip screws, Moor’s pins or cancellous screws. The full text of the article was not obtainable. The study was excluded because of lack of information and it was unlikely that it was a randomised trial. | |
| This was a randomised study of 218 patients. Patients were allocated to three arms ‐ fixation with Garden screws, a cemented Thompson using an anterior approach or to a cemented Thompson using a posterior approach. Patients in the fixation arm whose fractures were irreducible in theatre were then randomised to an anterior or posterior Thompson. These were then analysed as a fourth group with no details of which surgical approach they received. Interpreting results was confusing. Follow‐up of patients was for 24 months or until revision. Operative mortality in the irreducible group was reported as unacceptable. The authors concluded that the anterior hemiarthroplasty was the safest treatment . This study was excluded due to its poor methodological quality. The comparison between anterior and posterior approach is being considered in a separate Cochrane review. | |
| Retrospective study comparing internal fixation with Pugh's nail and plate with a Thompson hemiarthroplasty in 100 patients. The authors found results comparable at one year but failure rate was higher following internal fixation. Excluded because the study was not randomised. |
Data and analyses
| Outcome or subgroup title | No. of studies | No. of participants | Statistical method | Effect size |
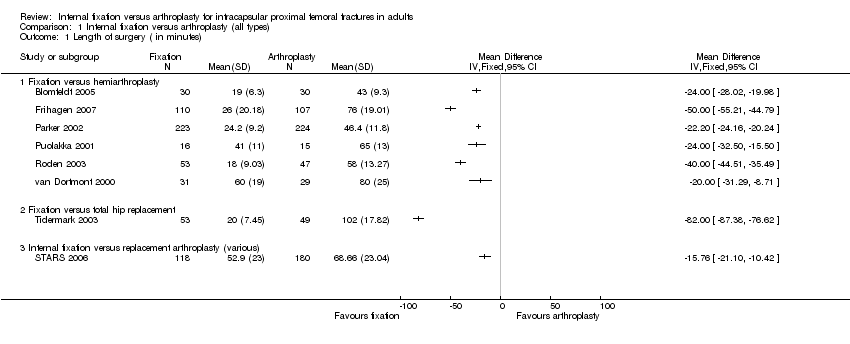
| 1 Length of surgery ( in minutes) Show forest plot | 8 | Mean Difference (IV, Fixed, 95% CI) | Totals not selected | |
| Analysis 1.1  Comparison 1 Internal fixation versus arthroplasty (all types), Outcome 1 Length of surgery ( in minutes). | ||||
| 1.1 Fixation versus hemiarthroplasty | 6 | Mean Difference (IV, Fixed, 95% CI) | 0.0 [0.0, 0.0] | |
| 1.2 Fixation versus total hip replacement | 1 | Mean Difference (IV, Fixed, 95% CI) | 0.0 [0.0, 0.0] | |
| 1.3 Internal fixation versus replacement arthroplasty (various) | 1 | Mean Difference (IV, Fixed, 95% CI) | 0.0 [0.0, 0.0] | |
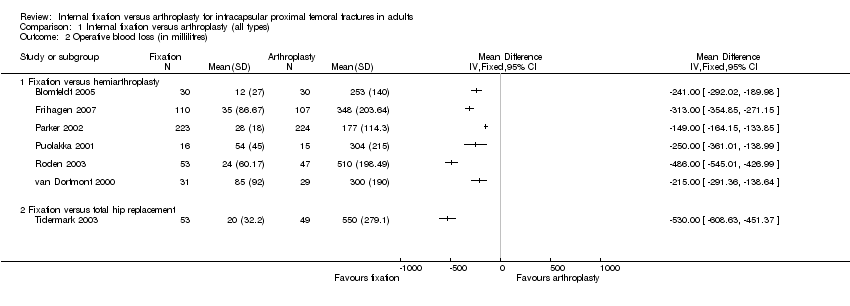
| 2 Operative blood loss (in millilitres) Show forest plot | 7 | Mean Difference (IV, Fixed, 95% CI) | Totals not selected | |
| Analysis 1.2  Comparison 1 Internal fixation versus arthroplasty (all types), Outcome 2 Operative blood loss (in millilitres). | ||||
| 2.1 Fixation versus hemiarthroplasty | 6 | Mean Difference (IV, Fixed, 95% CI) | 0.0 [0.0, 0.0] | |
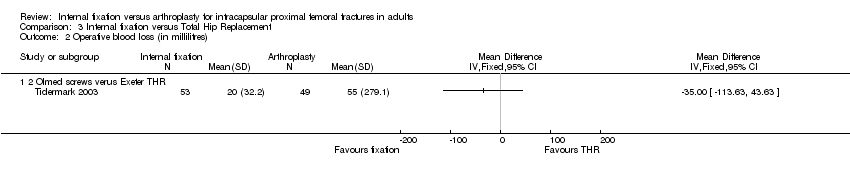
| 2.2 Fixation versus total hip replacement | 1 | Mean Difference (IV, Fixed, 95% CI) | 0.0 [0.0, 0.0] | |
| 3 Number of patients transfused Show forest plot | 6 | 1231 | Risk Ratio (M‐H, Random, 95% CI) | 0.24 [0.09, 0.64] |
| Analysis 1.3  Comparison 1 Internal fixation versus arthroplasty (all types), Outcome 3 Number of patients transfused. | ||||
| 3.1 Fixation versus hemiarthroplasty | 4 | 831 | Risk Ratio (M‐H, Random, 95% CI) | 0.24 [0.11, 0.53] |
| 3.2 Fixation versus total hip replacement | 1 | 102 | Risk Ratio (M‐H, Random, 95% CI) | 0.07 [0.02, 0.22] |
| 3.3 Internal fixation versus replacement arthroplasty (various) | 1 | 298 | Risk Ratio (M‐H, Random, 95% CI) | 1.08 [0.71, 1.63] |
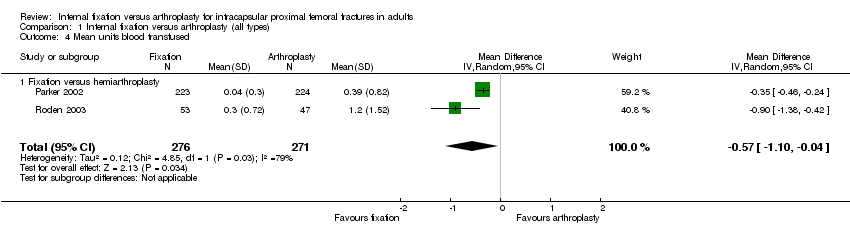
| 4 Mean units blood transfused Show forest plot | 2 | 547 | Mean Difference (IV, Random, 95% CI) | ‐0.57 [‐1.10, ‐0.04] |
| Analysis 1.4  Comparison 1 Internal fixation versus arthroplasty (all types), Outcome 4 Mean units blood transfused. | ||||
| 4.1 Fixation versus hemiarthroplasty | 2 | 547 | Mean Difference (IV, Random, 95% CI) | ‐0.57 [‐1.10, ‐0.04] |
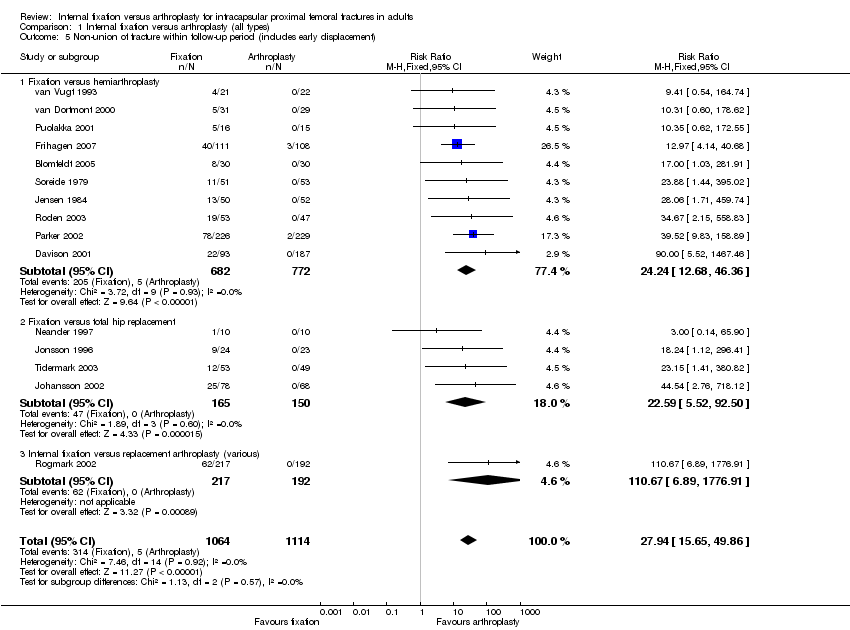
| 5 Non‐union of fracture within follow‐up period (includes early displacement) Show forest plot | 15 | 2178 | Risk Ratio (M‐H, Fixed, 95% CI) | 27.94 [15.65, 49.86] |
| Analysis 1.5  Comparison 1 Internal fixation versus arthroplasty (all types), Outcome 5 Non‐union of fracture within follow‐up period (includes early displacement). | ||||
| 5.1 Fixation versus hemiarthroplasty | 10 | 1454 | Risk Ratio (M‐H, Fixed, 95% CI) | 24.24 [12.68, 46.36] |
| 5.2 Fixation versus total hip replacement | 4 | 315 | Risk Ratio (M‐H, Fixed, 95% CI) | 22.59 [5.52, 92.50] |
| 5.3 Internal fixation versus replacement arthroplasty (various) | 1 | 409 | Risk Ratio (M‐H, Fixed, 95% CI) | 110.67 [6.89, 1776.91] |
| 6 Avascular necrosis Show forest plot | 12 | 2051 | Risk Ratio (M‐H, Fixed, 95% CI) | 19.22 [8.16, 45.27] |
| Analysis 1.6  Comparison 1 Internal fixation versus arthroplasty (all types), Outcome 6 Avascular necrosis. | ||||
| 6.1 Fixation versus hemiarthroplasty | 9 | 1394 | Risk Ratio (M‐H, Fixed, 95% CI) | 13.06 [4.82, 35.42] |
| 6.2 Fixation versus total hip replacement | 2 | 248 | Risk Ratio (M‐H, Fixed, 95% CI) | 20.66 [2.83, 150.74] |
| 6.3 Internal fixation versus replacement arthroplasty (various) | 1 | 409 | Risk Ratio (M‐H, Fixed, 95% CI) | 61.09 [3.77, 989.69] |
| 7 Dislocation of prosthesis Show forest plot | 15 | Risk Ratio (M‐H, Random, 95% CI) | Subtotals only | |
| Analysis 1.7  Comparison 1 Internal fixation versus arthroplasty (all types), Outcome 7 Dislocation of prosthesis. | ||||
| 7.1 Fixation versus hemiarthroplasty | 10 | 1806 | Risk Ratio (M‐H, Random, 95% CI) | 0.27 [0.06, 1.16] |
| 7.2 Fixation versus total hip replacement | 6 | 806 | Risk Ratio (M‐H, Random, 95% CI) | 0.08 [0.02, 0.25] |
| 7.3 Internal fixation versus replacement arthroplasty (various) | 1 | 298 | Risk Ratio (M‐H, Random, 95% CI) | 1.27 [0.40, 4.07] |
| 8 Loosening of prosthesis Show forest plot | 6 | Risk Ratio (M‐H, Fixed, 95% CI) | Subtotals only | |
| Analysis 1.8  Comparison 1 Internal fixation versus arthroplasty (all types), Outcome 8 Loosening of prosthesis. | ||||
| 8.1 Fixation versus hemiarthroplasty | 6 | 1185 | Risk Ratio (M‐H, Fixed, 95% CI) | 0.22 [0.08, 0.61] |
| 8.2 Internal fixation versus total hip replacement | 1 | 320 | Risk Ratio (M‐H, Fixed, 95% CI) | 0.10 [0.00, 1.97] |
| 9 Acetabular wear (as defined by each study) Show forest plot | 5 | 940 | Risk Ratio (M‐H, Fixed, 95% CI) | 0.21 [0.05, 0.90] |
| Analysis 1.9  Comparison 1 Internal fixation versus arthroplasty (all types), Outcome 9 Acetabular wear (as defined by each study). | ||||
| 9.1 Fixation versus hemiarthroplasty | 5 | 940 | Risk Ratio (M‐H, Fixed, 95% CI) | 0.21 [0.05, 0.90] |
| 10 Fracture below/around implant Show forest plot | 5 | 1128 | Risk Ratio (M‐H, Random, 95% CI) | 0.40 [0.09, 1.67] |
| Analysis 1.10  Comparison 1 Internal fixation versus arthroplasty (all types), Outcome 10 Fracture below/around implant. | ||||
| 10.1 Fixation versus hemiarthroplasty | 3 | 617 | Risk Ratio (M‐H, Random, 95% CI) | 0.49 [0.05, 4.56] |
| 10.2 Fixation versus total hip replacement | 1 | 102 | Risk Ratio (M‐H, Random, 95% CI) | 0.31 [0.01, 7.40] |
| 10.3 Internal fixation versus replacement arthroplasty (various) | 1 | 409 | Risk Ratio (M‐H, Random, 95% CI) | 0.18 [0.02, 1.50] |
| 11 Re‐operations minor (e.g. removal of fixation, dislocation of arthroplasty) Show forest plot | 17 | 2618 | Risk Ratio (M‐H, Random, 95% CI) | 1.36 [0.69, 2.68] |
| Analysis 1.11  Comparison 1 Internal fixation versus arthroplasty (all types), Outcome 11 Re‐operations minor (e.g. removal of fixation, dislocation of arthroplasty). | ||||
| 11.1 Fixation versus hemiarthroplasty | 11 | 1623 | Risk Ratio (M‐H, Random, 95% CI) | 2.36 [1.05, 5.30] |
| 11.2 Fixation versus total hip replacement | 4 | 315 | Risk Ratio (M‐H, Random, 95% CI) | 0.86 [0.16, 4.70] |
| 11.3 Internal fixation versus replacement arthroplasty (various) | 2 | 680 | Risk Ratio (M‐H, Random, 95% CI) | 0.24 [0.00, 22.30] |
| 12 Re‐operations moderate (e.g. fixation to arthroplasty, drainage, girdlestone) Show forest plot | 17 | 2618 | Risk Ratio (M‐H, Random, 95% CI) | 9.35 [5.79, 15.07] |
| Analysis 1.12  Comparison 1 Internal fixation versus arthroplasty (all types), Outcome 12 Re‐operations moderate (e.g. fixation to arthroplasty, drainage, girdlestone). | ||||
| 12.1 Fixation versus hemiarthroplasty | 11 | 1623 | Risk Ratio (M‐H, Random, 95% CI) | 7.56 [4.88, 11.72] |
| 12.2 Fixation versus total hip replacement | 4 | 315 | Risk Ratio (M‐H, Random, 95% CI) | 17.96 [4.31, 74.91] |
| 12.3 Internal fixation versus replacement arthroplasty (various) | 2 | 680 | Risk Ratio (M‐H, Random, 95% CI) | 45.28 [3.31, 619.46] |
| 13 Re‐operations major (e.g. revision arthroplasty, hemiarthroplasty to THR) Show forest plot | 17 | 2618 | Risk Ratio (M‐H, Random, 95% CI) | 0.41 [0.19, 0.87] |
| Analysis 1.13  Comparison 1 Internal fixation versus arthroplasty (all types), Outcome 13 Re‐operations major (e.g. revision arthroplasty, hemiarthroplasty to THR). | ||||
| 13.1 Fixation versus hemiarthroplasty | 11 | 1623 | Risk Ratio (M‐H, Random, 95% CI) | 0.47 [0.16, 1.41] |
| 13.2 Fixation versus total hip replacement | 4 | 315 | Risk Ratio (M‐H, Random, 95% CI) | 0.24 [0.03, 2.12] |
| 13.3 Internal fixation versus replacement arthroplasty (various) | 2 | 680 | Risk Ratio (M‐H, Random, 95% CI) | 0.19 [0.01, 4.21] |
| 14 Total re‐operation rate (within follow‐up period of study) Show forest plot | 19 | 3045 | Risk Ratio (M‐H, Random, 95% CI) | 3.22 [2.31, 4.47] |
| Analysis 1.14  Comparison 1 Internal fixation versus arthroplasty (all types), Outcome 14 Total re‐operation rate (within follow‐up period of study). | ||||
| 14.1 Fixation versus hemiarthroplasty | 11 | 1623 | Risk Ratio (M‐H, Random, 95% CI) | 3.13 [1.95, 5.03] |
| 14.2 Fixation versus total hip replacement | 4 | 315 | Risk Ratio (M‐H, Random, 95% CI) | 3.43 [1.45, 8.10] |
| 14.3 Internal fixation versus replacement arthroplasty (various) | 4 | 1107 | Risk Ratio (M‐H, Random, 95% CI) | 3.26 [1.65, 6.43] |
| 15 Superficial wound infection Show forest plot | 14 | 1986 | Risk Ratio (M‐H, Fixed, 95% CI) | 0.85 [0.53, 1.38] |
| Analysis 1.15  Comparison 1 Internal fixation versus arthroplasty (all types), Outcome 15 Superficial wound infection. | ||||
| 15.1 Fixation versus hemiarthroplasty | 9 | 1373 | Risk Ratio (M‐H, Fixed, 95% CI) | 0.86 [0.46, 1.58] |
| 15.2 Fixation versus total hip replacement | 4 | 315 | Risk Ratio (M‐H, Fixed, 95% CI) | 0.43 [0.13, 1.50] |
| 15.3 Internal fixation versus replacement arthroplasty (various) | 1 | 298 | Risk Ratio (M‐H, Fixed, 95% CI) | 1.53 [0.50, 4.62] |
| 16 Deep wound infection Show forest plot | 15 | 2825 | Risk Ratio (M‐H, Fixed, 95% CI) | 0.53 [0.30, 0.93] |
| Analysis 1.16  Comparison 1 Internal fixation versus arthroplasty (all types), Outcome 16 Deep wound infection. | ||||
| 16.1 Fixation versus hemiarthroplasty | 10 | 1592 | Risk Ratio (M‐H, Fixed, 95% CI) | 0.47 [0.24, 0.91] |
| 16.2 Fixation versus total hip replacement | 2 | 248 | Risk Ratio (M‐H, Fixed, 95% CI) | 2.62 [0.11, 63.28] |
| 16.3 Internal fixation versus replacement arthroplasty (various) | 3 | 985 | Risk Ratio (M‐H, Fixed, 95% CI) | 0.59 [0.17, 2.07] |
| 17 Pneumonia Show forest plot | 5 | 1003 | Risk Ratio (M‐H, Fixed, 95% CI) | 0.84 [0.51, 1.40] |
| Analysis 1.17  Comparison 1 Internal fixation versus arthroplasty (all types), Outcome 17 Pneumonia. | ||||
| 17.1 Fixation versus hemiarthroplasty | 4 | 857 | Risk Ratio (M‐H, Fixed, 95% CI) | 0.95 [0.56, 1.61] |
| 17.2 Fixation versus total hip replacement | 1 | 146 | Risk Ratio (M‐H, Fixed, 95% CI) | 0.12 [0.01, 2.37] |
| 18 Deep vein thrombosis Show forest plot | 9 | 1558 | Risk Ratio (M‐H, Fixed, 95% CI) | 0.99 [0.50, 1.96] |
| Analysis 1.18  Comparison 1 Internal fixation versus arthroplasty (all types), Outcome 18 Deep vein thrombosis. | ||||
| 18.1 Fixation versus hemiarthroplasty | 4 | 945 | Risk Ratio (M‐H, Fixed, 95% CI) | 1.41 [0.50, 3.96] |
| 18.2 Fixation versus total hip replacement | 4 | 315 | Risk Ratio (M‐H, Fixed, 95% CI) | 0.35 [0.08, 1.52] |
| 18.3 Internal fixation versus replacement arthroplasty (various) | 1 | 298 | Risk Ratio (M‐H, Fixed, 95% CI) | 1.53 [0.39, 5.98] |
| 19 Pulmonary embolism Show forest plot | 9 | 1558 | Risk Ratio (M‐H, Fixed, 95% CI) | 1.30 [0.59, 2.86] |
| Analysis 1.19  Comparison 1 Internal fixation versus arthroplasty (all types), Outcome 19 Pulmonary embolism. | ||||
| 19.1 Fixation versus hemiarthroplasty | 4 | 945 | Risk Ratio (M‐H, Fixed, 95% CI) | 1.89 [0.58, 6.15] |
| 19.2 Fixation versus total hip replacement | 4 | 315 | Risk Ratio (M‐H, Fixed, 95% CI) | 1.92 [0.37, 10.12] |
| 19.3 Internal fixation versus replacement arthroplasty (various) | 1 | 298 | Risk Ratio (M‐H, Fixed, 95% CI) | 0.51 [0.10, 2.48] |
| 20 Thromboembolic complications combined Show forest plot | 13 | 2174 | Risk Ratio (M‐H, Fixed, 95% CI) | 1.13 [0.70, 1.83] |
| Analysis 1.20  Comparison 1 Internal fixation versus arthroplasty (all types), Outcome 20 Thromboembolic complications combined. | ||||
| 20.1 Fixation versus hemiarthroplasty | 7 | 1152 | Risk Ratio (M‐H, Fixed, 95% CI) | 1.34 [0.67, 2.68] |
| 20.2 Fixation versus total hip replacement | 4 | 315 | Risk Ratio (M‐H, Fixed, 95% CI) | 0.67 [0.22, 2.06] |
| 20.3 Internal fixation versus replacement arthroplasty (various) | 2 | 707 | Risk Ratio (M‐H, Fixed, 95% CI) | 1.19 [0.52, 2.72] |
| 21 Congestive cardiac failure/heart failure Show forest plot | 4 | 1057 | Risk Ratio (M‐H, Fixed, 95% CI) | 0.88 [0.45, 1.70] |
| Analysis 1.21  Comparison 1 Internal fixation versus arthroplasty (all types), Outcome 21 Congestive cardiac failure/heart failure. | ||||
| 21.1 Fixation versus hemiarthroplasty | 1 | 455 | Risk Ratio (M‐H, Fixed, 95% CI) | 1.01 [0.33, 3.09] |
| 21.2 Fixation versus total hip replacement | 2 | 193 | Risk Ratio (M‐H, Fixed, 95% CI) | 0.91 [0.16, 5.04] |
| 21.3 Internal fixation versus replacement arthroplasty (various) | 1 | 409 | Risk Ratio (M‐H, Fixed, 95% CI) | 0.79 [0.31, 2.00] |
| 22 Myocardial infarction Show forest plot | 6 | 1068 | Risk Ratio (M‐H, Fixed, 95% CI) | 0.58 [0.22, 1.51] |
| Analysis 1.22  Comparison 1 Internal fixation versus arthroplasty (all types), Outcome 22 Myocardial infarction. | ||||
| 22.1 Fixation versus hemiarthroplasty | 1 | 455 | Risk Ratio (M‐H, Fixed, 95% CI) | 5.07 [0.24, 104.94] |
| 22.2 Fixation versus total hip replacement | 4 | 315 | Risk Ratio (M‐H, Fixed, 95% CI) | 0.47 [0.12, 1.82] |
| 22.3 Internal fixation versus replacement arthroplasty (various) | 1 | 298 | Risk Ratio (M‐H, Fixed, 95% CI) | 0.25 [0.03, 2.08] |
| 23 Stroke (cerebrovascular accident) Show forest plot | 9 | 1645 | Risk Ratio (M‐H, Fixed, 95% CI) | 0.85 [0.43, 1.69] |
| Analysis 1.23  Comparison 1 Internal fixation versus arthroplasty (all types), Outcome 23 Stroke (cerebrovascular accident). | ||||
| 23.1 Fixation versus hemiarthroplasty | 4 | 725 | Risk Ratio (M‐H, Fixed, 95% CI) | 0.84 [0.23, 3.09] |
| 23.2 Fixation versus total hip replacement | 3 | 213 | Risk Ratio (M‐H, Fixed, 95% CI) | 0.94 [0.20, 4.50] |
| 23.3 Internal fixation versus replacement arthroplasty (various) | 2 | 707 | Risk Ratio (M‐H, Fixed, 95% CI) | 0.83 [0.32, 2.11] |
| 24 Confusional state Show forest plot | 2 | Risk Ratio (M‐H, Fixed, 95% CI) | Subtotals only | |
| Analysis 1.24  Comparison 1 Internal fixation versus arthroplasty (all types), Outcome 24 Confusional state. | ||||
| 24.1 Fixation versus hemiarthroplasty | 2 | 675 | Risk Ratio (M‐H, Fixed, 95% CI) | 0.88 [0.55, 1.39] |
| 25 Gastrointestinal complications Show forest plot | 3 | 703 | Risk Ratio (M‐H, Fixed, 95% CI) | 0.54 [0.23, 1.30] |
| Analysis 1.25  Comparison 1 Internal fixation versus arthroplasty (all types), Outcome 25 Gastrointestinal complications. | ||||
| 25.1 Hemiarthroplasty | 2 | 557 | Risk Ratio (M‐H, Fixed, 95% CI) | 0.78 [0.28, 2.13] |
| 25.2 Total hip replacement | 1 | 146 | Risk Ratio (M‐H, Fixed, 95% CI) | 0.17 [0.02, 1.46] |
| 26 Pressure sores Show forest plot | 7 | 1380 | Risk Ratio (M‐H, Fixed, 95% CI) | 1.11 [0.55, 2.23] |
| Analysis 1.26  Comparison 1 Internal fixation versus arthroplasty (all types), Outcome 26 Pressure sores. | ||||
| 26.1 Fixation versus hemiarthroplasty | 4 | 819 | Risk Ratio (M‐H, Fixed, 95% CI) | 1.12 [0.47, 2.66] |
| 26.2 Fixation versus total hip replacement | 2 | 152 | Risk Ratio (M‐H, Fixed, 95% CI) | 1.45 [0.25, 8.31] |
| 26.3 Internal fixation versus replacement arthroplasty (various) | 1 | 409 | Risk Ratio (M‐H, Fixed, 95% CI) | 0.88 [0.18, 4.33] |
| 27 Total medical complications (as defined in each study) Show forest plot | 13 | 2173 | Risk Ratio (M‐H, Random, 95% CI) | 0.73 [0.58, 0.92] |
| Analysis 1.27  Comparison 1 Internal fixation versus arthroplasty (all types), Outcome 27 Total medical complications (as defined in each study). | ||||
| 27.1 Fixation versus hemiarthroplasty | 7 | 1151 | Risk Ratio (M‐H, Random, 95% CI) | 0.72 [0.51, 1.02] |
| 27.2 Fixation versus total hip replacement | 4 | 315 | Risk Ratio (M‐H, Random, 95% CI) | 0.62 [0.36, 1.06] |
| 27.3 Internal fixation versus replacement arthroplasty (various) | 2 | 707 | Risk Ratio (M‐H, Random, 95% CI) | 0.79 [0.51, 1.22] |
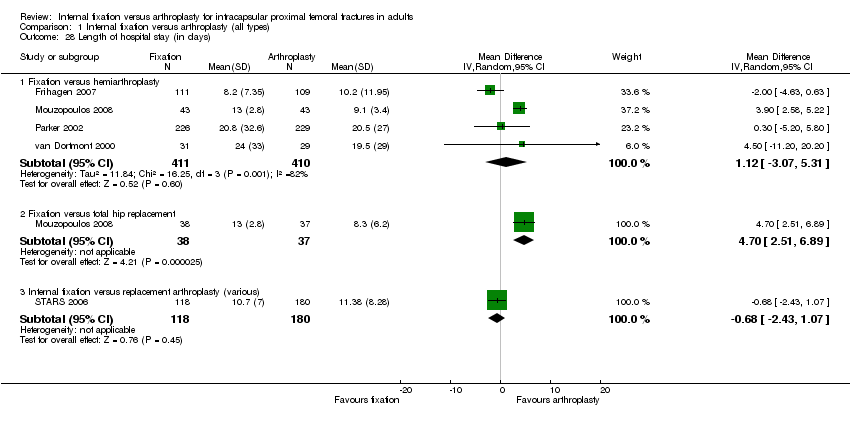
| 28 Length of hospital stay (in days) Show forest plot | 5 | Mean Difference (IV, Random, 95% CI) | Subtotals only | |
| Analysis 1.28  Comparison 1 Internal fixation versus arthroplasty (all types), Outcome 28 Length of hospital stay (in days). | ||||
| 28.1 Fixation versus hemiarthroplasty | 4 | 821 | Mean Difference (IV, Random, 95% CI) | 1.12 [‐3.07, 5.31] |
| 28.2 Fixation versus total hip replacement | 1 | 75 | Mean Difference (IV, Random, 95% CI) | 4.70 [2.51, 6.89] |
| 28.3 Internal fixation versus replacement arthroplasty (various) | 1 | 298 | Mean Difference (IV, Random, 95% CI) | ‐0.68 [‐2.43, 1.07] |
| 29 Mortality 30 days Show forest plot | 4 | 780 | Risk Ratio (M‐H, Fixed, 95% CI) | 0.76 [0.46, 1.24] |
| Analysis 1.29  Comparison 1 Internal fixation versus arthroplasty (all types), Outcome 29 Mortality 30 days. | ||||
| 29.1 Fixation versus hemiarthroplasty | 4 | 780 | Risk Ratio (M‐H, Fixed, 95% CI) | 0.76 [0.46, 1.24] |
| 30 Mortality up to 3 to 6 months Show forest plot | 15 | 2320 | Risk Ratio (M‐H, Fixed, 95% CI) | 0.87 [0.70, 1.08] |
| Analysis 1.30  Comparison 1 Internal fixation versus arthroplasty (all types), Outcome 30 Mortality up to 3 to 6 months. | ||||
| 30.1 Fixation versus hemiarthroplasty | 10 | 1345 | Risk Ratio (M‐H, Fixed, 95% CI) | 0.84 [0.66, 1.07] |
| 30.2 Fixation versus total hip replacement | 3 | 268 | Risk Ratio (M‐H, Fixed, 95% CI) | 2.52 [0.89, 7.14] |
| 30.3 Internal fixation versus replacement arthroplasty (various) | 2 | 707 | Risk Ratio (M‐H, Fixed, 95% CI) | 0.66 [0.34, 1.27] |
| 31 Mortality up to 12 months Show forest plot | 14 | 2317 | Risk Ratio (M‐H, Fixed, 95% CI) | 0.95 [0.81, 1.11] |
| Analysis 1.31  Comparison 1 Internal fixation versus arthroplasty (all types), Outcome 31 Mortality up to 12 months. | ||||
| 31.1 Fixation versus hemiarthroplasty | 8 | 1213 | Risk Ratio (M‐H, Fixed, 95% CI) | 0.94 [0.78, 1.13] |
| 31.2 Fixation versus total hip replacement | 3 | 268 | Risk Ratio (M‐H, Fixed, 95% CI) | 1.18 [0.68, 2.05] |
| 31.3 Internal fixation versus replacement arthroplasty (various) | 3 | 836 | Risk Ratio (M‐H, Fixed, 95% CI) | 0.89 [0.61, 1.30] |
| 32 Mortality up to 24 to 48 months Show forest plot | 15 | 2335 | Risk Ratio (M‐H, Fixed, 95% CI) | 0.97 [0.87, 1.09] |
| Analysis 1.32  Comparison 1 Internal fixation versus arthroplasty (all types), Outcome 32 Mortality up to 24 to 48 months. | ||||
| 32.1 Fixation versus hemiarthroplasty | 9 | 1204 | Risk Ratio (M‐H, Fixed, 95% CI) | 0.96 [0.84, 1.10] |
| 32.2 Fixation versus total hip replacement | 3 | 295 | Risk Ratio (M‐H, Fixed, 95% CI) | 1.04 [0.71, 1.53] |
| 32.3 Internal fixation versus replacement arthroplasty (various) | 3 | 836 | Risk Ratio (M‐H, Fixed, 95% CI) | 0.98 [0.74, 1.29] |
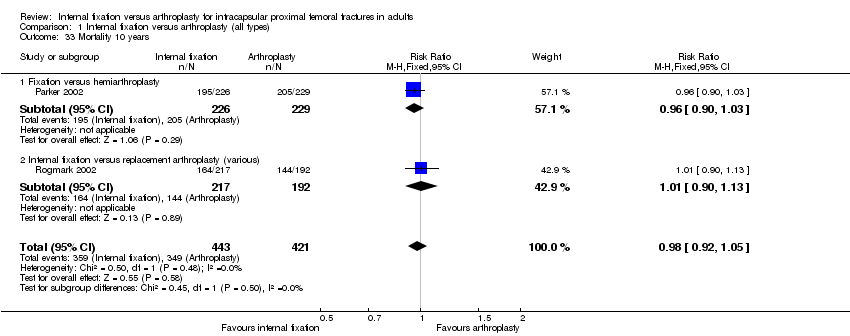
| 33 Mortality 10 years Show forest plot | 2 | 864 | Risk Ratio (M‐H, Fixed, 95% CI) | 0.98 [0.92, 1.05] |
| Analysis 1.33  Comparison 1 Internal fixation versus arthroplasty (all types), Outcome 33 Mortality 10 years. | ||||
| 33.1 Fixation versus hemiarthroplasty | 1 | 455 | Risk Ratio (M‐H, Fixed, 95% CI) | 0.96 [0.90, 1.03] |
| 33.2 Internal fixation versus replacement arthroplasty (various) | 1 | 409 | Risk Ratio (M‐H, Fixed, 95% CI) | 1.01 [0.90, 1.13] |
| 34 Residual pain at 1 year Show forest plot | 5 | 750 | Risk Ratio (M‐H, Random, 95% CI) | 1.24 [0.79, 1.94] |
| Analysis 1.34  Comparison 1 Internal fixation versus arthroplasty (all types), Outcome 34 Residual pain at 1 year. | ||||
| 34.1 Fixation versus hemiarthroplasty | 2 | 366 | Risk Ratio (M‐H, Random, 95% CI) | 0.81 [0.62, 1.05] |
| 34.2 Fixation versus total hip replacement | 2 | 128 | Risk Ratio (M‐H, Random, 95% CI) | 3.08 [0.90, 10.56] |
| 34.3 Internal fixation versus replacement arthroplasty (various) | 1 | 256 | Risk Ratio (M‐H, Random, 95% CI) | 1.3 [1.05, 1.61] |
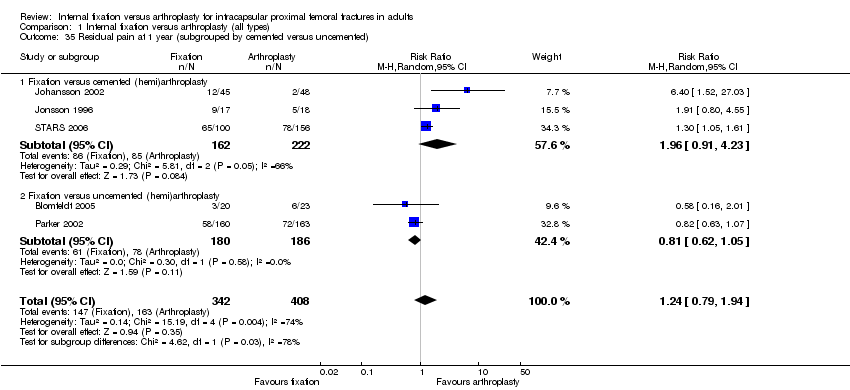
| 35 Residual pain at 1 year (subgrouped by cemented versus uncemented) Show forest plot | 5 | 750 | Risk Ratio (M‐H, Random, 95% CI) | 1.24 [0.79, 1.94] |
| Analysis 1.35  Comparison 1 Internal fixation versus arthroplasty (all types), Outcome 35 Residual pain at 1 year (subgrouped by cemented versus uncemented). | ||||
| 35.1 Fixation versus cemented (hemi)arthroplasty | 3 | 384 | Risk Ratio (M‐H, Random, 95% CI) | 1.96 [0.91, 4.23] |
| 35.2 Fixation versus uncemented (hemi)arthroplasty | 2 | 366 | Risk Ratio (M‐H, Random, 95% CI) | 0.81 [0.62, 1.05] |
| 36 Mean pain score at 1 to 2 years Show forest plot | 3 | 521 | Std. Mean Difference (IV, Random, 95% CI) | ‐0.21 [‐0.68, 0.26] |
| Analysis 1.36  Comparison 1 Internal fixation versus arthroplasty (all types), Outcome 36 Mean pain score at 1 to 2 years. | ||||
| 36.1 Internal fixation versus hemiarthroplasty | 2 | 437 | Std. Mean Difference (IV, Random, 95% CI) | ‐0.02 [‐0.43, 0.39] |
| 36.2 Internal fixation versus replacement arthroplasty (various types) | 1 | 84 | Std. Mean Difference (IV, Random, 95% CI) | ‐0.62 [‐1.06, ‐0.19] |
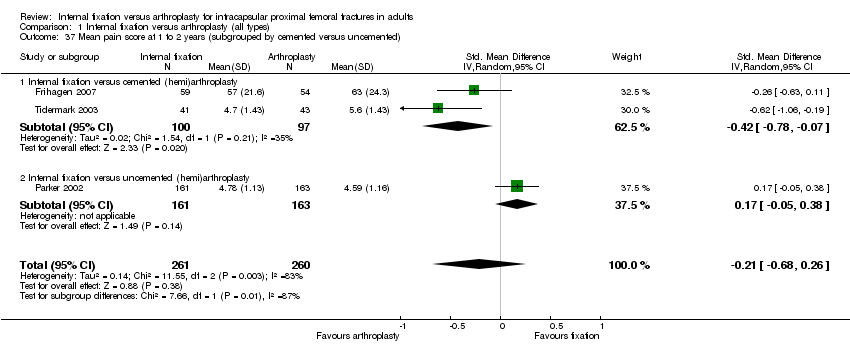
| 37 Mean pain score at 1 to 2 years (subgrouped by cemented versus uncemented) Show forest plot | 3 | 521 | Std. Mean Difference (IV, Random, 95% CI) | ‐0.21 [‐0.68, 0.26] |
| Analysis 1.37  Comparison 1 Internal fixation versus arthroplasty (all types), Outcome 37 Mean pain score at 1 to 2 years (subgrouped by cemented versus uncemented). | ||||
| 37.1 Internal fixation versus cemented (hemi)arthroplasty | 2 | 197 | Std. Mean Difference (IV, Random, 95% CI) | ‐0.42 [‐0.78, ‐0.07] |
| 37.2 Internal fixation versus uncemented (hemi)arthroplasty | 1 | 324 | Std. Mean Difference (IV, Random, 95% CI) | 0.17 [‐0.05, 0.38] |
| 38 Pain at 2 to 3 years Show forest plot | 2 | 322 | Risk Ratio (M‐H, Random, 95% CI) | 3.49 [0.11, 115.59] |
| Analysis 1.38  Comparison 1 Internal fixation versus arthroplasty (all types), Outcome 38 Pain at 2 to 3 years. | ||||
| 38.1 Fixation versus total hip replacement | 2 | 322 | Risk Ratio (M‐H, Random, 95% CI) | 3.49 [0.11, 115.59] |
| 39 Failure to return to same residence at final follow‐up Show forest plot | 2 | 372 | Risk Ratio (M‐H, Fixed, 95% CI) | 0.84 [0.54, 1.33] |
| Analysis 1.39  Comparison 1 Internal fixation versus arthroplasty (all types), Outcome 39 Failure to return to same residence at final follow‐up. | ||||
| 39.1 Fixation versus hemiarthroplasty | 2 | 372 | Risk Ratio (M‐H, Fixed, 95% CI) | 0.84 [0.54, 1.33] |
| 40 Failure to regain mobility Show forest plot | 6 | 593 | Risk Ratio (M‐H, Random, 95% CI) | 1.02 [0.74, 1.39] |
| Analysis 1.40  Comparison 1 Internal fixation versus arthroplasty (all types), Outcome 40 Failure to regain mobility. | ||||
| 40.1 Fixation versus hemiarthroplasty | 6 | 593 | Risk Ratio (M‐H, Random, 95% CI) | 1.02 [0.74, 1.39] |
| 41 Harris hip score (at 1 year) Show forest plot | 2 | Mean Difference (IV, Fixed, 95% CI) | Subtotals only | |
| Analysis 1.41  Comparison 1 Internal fixation versus arthroplasty (all types), Outcome 41 Harris hip score (at 1 year). | ||||
| 41.1 Fixation versus hemiarthroplasty | 2 | 223 | Mean Difference (IV, Fixed, 95% CI) | ‐6.61 [‐9.73, ‐3.49] |
| 41.2 Fixation versus total hip replacement | 1 | 65 | Mean Difference (IV, Fixed, 95% CI) | ‐10.30 [‐12.78, ‐7.82] |
| 42 Hip rating questionnaire at 1 year Show forest plot | 1 | Mean Difference (IV, Fixed, 95% CI) | Totals not selected | |
| Analysis 1.42  Comparison 1 Internal fixation versus arthroplasty (all types), Outcome 42 Hip rating questionnaire at 1 year. | ||||
| 42.1 Fixation versus hemiarthroplasty | 1 | Mean Difference (IV, Fixed, 95% CI) | 0.0 [0.0, 0.0] | |
| 42.2 Fixation versus total hip replacement | 1 | Mean Difference (IV, Fixed, 95% CI) | 0.0 [0.0, 0.0] | |
| 43 Hip scores (at 1 year) Show forest plot | 3 | Std. Mean Difference (IV, Fixed, 95% CI) | Subtotals only | |
| Analysis 1.43  Comparison 1 Internal fixation versus arthroplasty (all types), Outcome 43 Hip scores (at 1 year). | ||||
| 43.1 Fixation versus hemiarthroplasty | 3 | 374 | Std. Mean Difference (IV, Fixed, 95% CI) | ‐0.38 [‐0.58, ‐0.17] |
| 43.2 Fixation versus total hip replacement | 2 | 168 | Std. Mean Difference (IV, Fixed, 95% CI) | ‐0.77 [‐1.10, ‐0.45] |
| 44 Mean Eq‐5d score (at 1 year) Show forest plot | 2 | Mean Difference (IV, Fixed, 95% CI) | Subtotals only | |
| Analysis 1.44  Comparison 1 Internal fixation versus arthroplasty (all types), Outcome 44 Mean Eq‐5d score (at 1 year). | ||||
| 44.1 Fixation versus hemiarthroplasty | 2 | 341 | Mean Difference (IV, Fixed, 95% CI) | ‐0.07 [‐0.14, ‐0.00] |
| 44.2 Fixation versus total hip replacement | 1 | 130 | Mean Difference (IV, Fixed, 95% CI) | ‐0.12 [‐0.33, 0.09] |
| 45 Barthel index score of below 95 at 1 year Show forest plot | 1 | Risk Ratio (M‐H, Fixed, 95% CI) | Totals not selected | |
| Analysis 1.45  Comparison 1 Internal fixation versus arthroplasty (all types), Outcome 45 Barthel index score of below 95 at 1 year. | ||||
| 45.1 Fixation versus hemiarthroplasty | 1 | Risk Ratio (M‐H, Fixed, 95% CI) | 0.0 [0.0, 0.0] | |
| Outcome or subgroup title | No. of studies | No. of participants | Statistical method | Effect size |
| 1 Length of surgery (in minutes) Show forest plot | 6 | Mean Difference (IV, Random, 95% CI) | Totals not selected | |
| Analysis 2.1  Comparison 2 Internal fixation versus hemiarthroplasty, Outcome 1 Length of surgery (in minutes). | ||||
| 1.1 Screws versus Thompson | 2 | Mean Difference (IV, Random, 95% CI) | 0.0 [0.0, 0.0] | |
| 1.2 Screws versus Moore | 2 | Mean Difference (IV, Random, 95% CI) | 0.0 [0.0, 0.0] | |
| 1.3 Screws or SHS versus bipolar hemiarthroplasty | 2 | Mean Difference (IV, Random, 95% CI) | 0.0 [0.0, 0.0] | |
| 2 Operative blood loss (in millilitres) Show forest plot | 5 | Mean Difference (IV, Random, 95% CI) | Totals not selected | |
| Analysis 2.2  Comparison 2 Internal fixation versus hemiarthroplasty, Outcome 2 Operative blood loss (in millilitres). | ||||
| 2.1 Screws versus Thompson | 2 | Mean Difference (IV, Random, 95% CI) | 0.0 [0.0, 0.0] | |
| 2.2 Screws versus Moore | 2 | Mean Difference (IV, Random, 95% CI) | 0.0 [0.0, 0.0] | |
| 2.3 Screws or SHS versus bipolar hemiarthroplasty | 1 | Mean Difference (IV, Random, 95% CI) | 0.0 [0.0, 0.0] | |
| 3 Number of patients transfused Show forest plot | 5 | 1060 | Risk Ratio (M‐H, Fixed, 95% CI) | 0.39 [0.29, 0.53] |
| Analysis 2.3  Comparison 2 Internal fixation versus hemiarthroplasty, Outcome 3 Number of patients transfused. | ||||
| 3.1 Screws versus Moore | 2 | 507 | Risk Ratio (M‐H, Fixed, 95% CI) | 0.12 [0.06, 0.26] |
| 3.2 Screws v Christiansen bipolar | 1 | 104 | Risk Ratio (M‐H, Fixed, 95% CI) | 0.03 [0.00, 0.45] |
| 3.3 Screws or SHS versus bipolar hemiarthroplasty | 2 | 449 | Risk Ratio (M‐H, Fixed, 95% CI) | 0.80 [0.56, 1.14] |
| 4 Re‐operations minor ( eg fixation‐ removal of metalwork, dislocation of hemiarthroplasty) Show forest plot | 12 | Risk Ratio (M‐H, Random, 95% CI) | Subtotals only | |
| Analysis 2.4  Comparison 2 Internal fixation versus hemiarthroplasty, Outcome 4 Re‐operations minor ( eg fixation‐ removal of metalwork, dislocation of hemiarthroplasty). | ||||
| 4.1 Screws versus Thompson | 2 | 91 | Risk Ratio (M‐H, Random, 95% CI) | 0.31 [0.01, 7.15] |
| 4.2 Screws versus Moore | 3 | 617 | Risk Ratio (M‐H, Random, 95% CI) | 5.39 [0.23, 126.75] |
| 4.3 SHS versus Moore | 1 | 182 | Risk Ratio (M‐H, Random, 95% CI) | 0.04 [0.00, 0.67] |
| 4.4 SHS versus Stanmore bipolar | 1 | 43 | Risk Ratio (M‐H, Random, 95% CI) | 0.0 [0.0, 0.0] |
| 4.5 Screws, SHS or nail & plate versus Christiansen bipolar | 2 | 273 | Risk Ratio (M‐H, Random, 95% CI) | 1.15 [0.04, 31.12] |
| 4.6 SHS versus Thompson or Monk bipolar | 1 | 280 | Risk Ratio (M‐H, Random, 95% CI) | 4.02 [0.75, 21.56] |
| 4.7 2 von Bahr screws versus Variokopf bipolar hemiarthroplasty | 1 | 100 | Risk Ratio (M‐H, Random, 95% CI) | 1.06 [0.35, 3.26] |
| 4.8 2 Olmed screws versus bipolar hemiarthroplasty | 1 | 219 | Risk Ratio (M‐H, Random, 95% CI) | 2.80 [1.31, 5.98] |
| 5 Re‐operations moderate (eg fixation to hemiarthroplasty or total hip replacement, drainage, girdlestone) Show forest plot | 12 | Risk Ratio (M‐H, Random, 95% CI) | Subtotals only | |
| Analysis 2.5  Comparison 2 Internal fixation versus hemiarthroplasty, Outcome 5 Re‐operations moderate (eg fixation to hemiarthroplasty or total hip replacement, drainage, girdlestone). | ||||
| 5.1 Screws versus Thompson | 2 | 91 | Risk Ratio (M‐H, Random, 95% CI) | 6.12 [1.13, 33.22] |
| 5.2 Screws versus Moore | 3 | 617 | Risk Ratio (M‐H, Random, 95% CI) | 8.15 [2.46, 26.98] |
| 5.3 SHS versus Moore | 1 | 182 | Risk Ratio (M‐H, Random, 95% CI) | 10.00 [3.16, 31.60] |
| 5.4 SHS versus Stanmore bipolar | 1 | 43 | Risk Ratio (M‐H, Random, 95% CI) | 3.14 [0.71, 13.87] |
| 5.5 Screws, SHS or nail & plate versus Christiansen bipolar | 2 | 273 | Risk Ratio (M‐H, Random, 95% CI) | 3.72 [1.28, 10.76] |
| 5.6 SHS versus Thompson or Monk bipolar | 1 | 280 | Risk Ratio (M‐H, Random, 95% CI) | 17.43 [5.41, 56.09] |
| 5.7 2 von Bahr screws versus Variokopf bipolar hemiarthroplasty | 1 | 100 | Risk Ratio (M‐H, Random, 95% CI) | 7.39 [2.38, 22.91] |
| 5.8 2 Olmed screws versus bipolar hemiarthroplasty | 1 | 219 | Risk Ratio (M‐H, Random, 95% CI) | 8.37 [3.45, 20.32] |
| 6 Re‐operations major (eg revision hemiarthroplasty or conversion to total hip replacement) Show forest plot | 12 | Risk Ratio (M‐H, Fixed, 95% CI) | Subtotals only | |
| Analysis 2.6  Comparison 2 Internal fixation versus hemiarthroplasty, Outcome 6 Re‐operations major (eg revision hemiarthroplasty or conversion to total hip replacement). | ||||
| 6.1 Screws versus Thompson | 2 | 91 | Risk Ratio (M‐H, Fixed, 95% CI) | 0.0 [0.0, 0.0] |
| 6.2 Screws versus Moore | 3 | 617 | Risk Ratio (M‐H, Fixed, 95% CI) | 0.71 [0.32, 1.60] |
| 6.3 SHS versus Moore | 1 | 182 | Risk Ratio (M‐H, Fixed, 95% CI) | 0.03 [0.00, 0.42] |
| 6.4 SHS versus Stanmore bipolar | 1 | 43 | Risk Ratio (M‐H, Fixed, 95% CI) | 0.10 [0.01, 1.62] |
| 6.5 Screws, SHS or nail & plate versus Christiansen bipolar | 2 | 273 | Risk Ratio (M‐H, Fixed, 95% CI) | 0.08 [0.01, 0.52] |
| 6.6 SHS versus Thompson or Monk bipolar | 1 | 280 | Risk Ratio (M‐H, Fixed, 95% CI) | 0.67 [0.07, 6.36] |
| 6.7 2 von Bahr screws versus Variokopf bipolar hemiarthroplasty | 1 | 100 | Risk Ratio (M‐H, Fixed, 95% CI) | 0.30 [0.01, 7.10] |
| 6.8 2 Olmed screws versus bipolar hemiarthroplasty | 1 | 219 | Risk Ratio (M‐H, Fixed, 95% CI) | 8.76 [0.48, 160.76] |
| 7 Total re‐operation rate (within follow‐up period of study) Show forest plot | 14 | Risk Ratio (M‐H, Fixed, 95% CI) | Subtotals only | |
| Analysis 2.7  Comparison 2 Internal fixation versus hemiarthroplasty, Outcome 7 Total re‐operation rate (within follow‐up period of study). | ||||
| 7.1 Screws versus Thompson | 2 | 91 | Risk Ratio (M‐H, Fixed, 95% CI) | 5.15 [1.22, 21.68] |
| 7.2 Screws versus Moore | 3 | 617 | Risk Ratio (M‐H, Fixed, 95% CI) | 5.82 [3.85, 8.79] |
| 7.3 SHS versus Moore | 1 | 182 | Risk Ratio (M‐H, Fixed, 95% CI) | 1.36 [0.85, 2.18] |
| 7.4 SHS versus Stanmore bipolar | 1 | 43 | Risk Ratio (M‐H, Fixed, 95% CI) | 0.90 [0.36, 2.23] |
| 7.5 Screws, SHS or nail & plate versus Christiansen bipolar | 2 | 273 | Risk Ratio (M‐H, Fixed, 95% CI) | 1.33 [0.72, 2.47] |
| 7.6 SHS versus Thompson or Monk bipolar | 1 | 280 | Risk Ratio (M‐H, Fixed, 95% CI) | 7.04 [3.34, 14.83] |
| 7.7 SHS versus hemiarthroplasty (unknown type) | 1 | 86 | Risk Ratio (M‐H, Fixed, 95% CI) | 2.4 [0.92, 6.23] |
| 7.8 Screws or SHS versus bipolar hemiarthroplasty | 1 | 229 | Risk Ratio (M‐H, Fixed, 95% CI) | 7.21 [3.21, 16.22] |
| 7.9 2 von Bahr screws versus Variokopf bipolar hemiarthroplasty | 1 | 100 | Risk Ratio (M‐H, Fixed, 95% CI) | 3.93 [1.91, 8.07] |
| 7.10 2 Olmed screws versus bipolar hemiarthroplasty | 1 | 219 | Risk Ratio (M‐H, Fixed, 95% CI) | 4.16 [2.28, 7.58] |
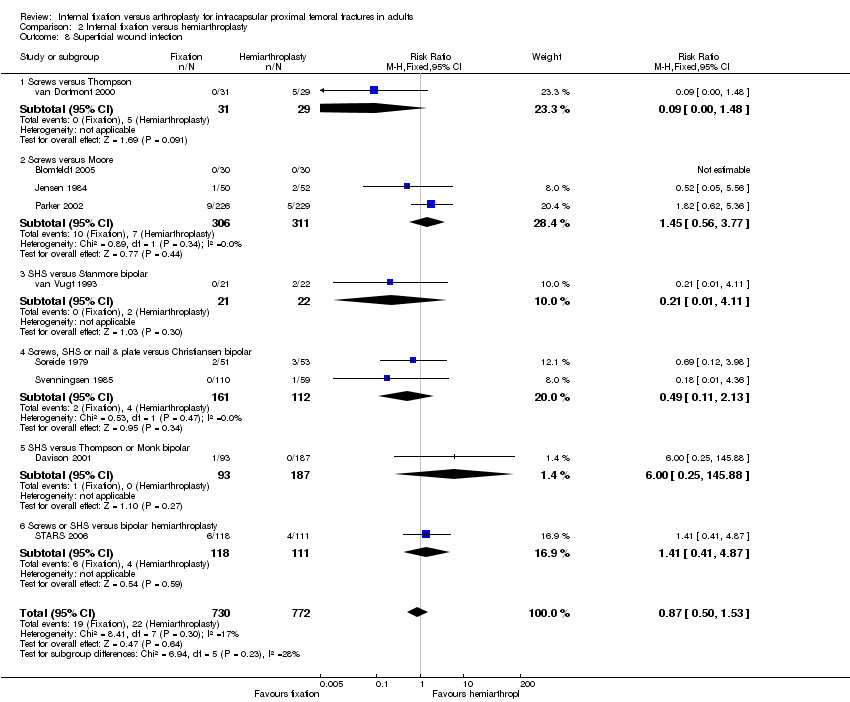
| 8 Superficial wound infection Show forest plot | 9 | 1502 | Risk Ratio (M‐H, Fixed, 95% CI) | 0.87 [0.50, 1.53] |
| Analysis 2.8  Comparison 2 Internal fixation versus hemiarthroplasty, Outcome 8 Superficial wound infection. | ||||
| 8.1 Screws versus Thompson | 1 | 60 | Risk Ratio (M‐H, Fixed, 95% CI) | 0.09 [0.00, 1.48] |
| 8.2 Screws versus Moore | 3 | 617 | Risk Ratio (M‐H, Fixed, 95% CI) | 1.45 [0.56, 3.77] |
| 8.3 SHS versus Stanmore bipolar | 1 | 43 | Risk Ratio (M‐H, Fixed, 95% CI) | 0.21 [0.01, 4.11] |
| 8.4 Screws, SHS or nail & plate versus Christiansen bipolar | 2 | 273 | Risk Ratio (M‐H, Fixed, 95% CI) | 0.49 [0.11, 2.13] |
| 8.5 SHS versus Thompson or Monk bipolar | 1 | 280 | Risk Ratio (M‐H, Fixed, 95% CI) | 6.0 [0.25, 145.88] |
| 8.6 Screws or SHS versus bipolar hemiarthroplasty | 1 | 229 | Risk Ratio (M‐H, Fixed, 95% CI) | 1.41 [0.41, 4.87] |
| 9 Deep wound infection Show forest plot | 11 | Risk Ratio (M‐H, Fixed, 95% CI) | Subtotals only | |
| Analysis 2.9  Comparison 2 Internal fixation versus hemiarthroplasty, Outcome 9 Deep wound infection. | ||||
| 9.1 Screws versus Thompson | 1 | 60 | Risk Ratio (M‐H, Fixed, 95% CI) | 0.0 [0.0, 0.0] |
| 9.2 Screws versus Moore | 3 | 617 | Risk Ratio (M‐H, Fixed, 95% CI) | 0.17 [0.04, 0.75] |
| 9.3 SHS versus Moore | 1 | 198 | Risk Ratio (M‐H, Fixed, 95% CI) | 0.15 [0.01, 2.79] |
| 9.4 SHS versus Stanmore bipolar | 1 | 43 | Risk Ratio (M‐H, Fixed, 95% CI) | 0.0 [0.0, 0.0] |
| 9.5 Screws, SHS or nail & plate versus Christiansen bipolar | 2 | 273 | Risk Ratio (M‐H, Fixed, 95% CI) | 0.35 [0.08, 1.66] |
| 9.6 SHS versus Thompson or Monk bipolar | 1 | 280 | Risk Ratio (M‐H, Fixed, 95% CI) | 0.67 [0.03, 16.21] |
| 9.7 Screws or SHS versus bipolar hemiarthroplasty | 2 | 448 | Risk Ratio (M‐H, Fixed, 95% CI) | 1.23 [0.48, 3.11] |
| 10 Length of hospital stay (in days) Show forest plot | 5 | 1036 | Mean Difference (IV, Random, 95% CI) | 0.79 [‐2.13, 3.72] |
| Analysis 2.10  Comparison 2 Internal fixation versus hemiarthroplasty, Outcome 10 Length of hospital stay (in days). | ||||
| 10.1 Screws versus Thompson | 1 | 60 | Mean Difference (IV, Random, 95% CI) | 4.5 [‐11.20, 20.20] |
| 10.2 Screws versus Moore | 1 | 455 | Mean Difference (IV, Random, 95% CI) | 0.30 [‐5.20, 5.80] |
| 10.3 Screws or SHS versus bipolar hemiarthroplasty | 2 | 449 | Mean Difference (IV, Random, 95% CI) | ‐0.80 [‐2.60, 1.00] |
| 10.4 SHS versus hemiarthroplasty (unknown type) | 1 | 72 | Mean Difference (IV, Random, 95% CI) | 3.90 [2.45, 5.35] |
| 11 Mortality at 30 days Show forest plot | 4 | 780 | Risk Ratio (M‐H, Fixed, 95% CI) | 0.76 [0.46, 1.24] |
| Analysis 2.11  Comparison 2 Internal fixation versus hemiarthroplasty, Outcome 11 Mortality at 30 days. | ||||
| 11.1 SHS or screws versus bipolar hemiarthroplasty | 4 | 780 | Risk Ratio (M‐H, Fixed, 95% CI) | 0.76 [0.46, 1.24] |
| 12 Mortality up to 3 to 6 months Show forest plot | 10 | 1474 | Risk Ratio (M‐H, Fixed, 95% CI) | 0.81 [0.64, 1.03] |
| Analysis 2.12  Comparison 2 Internal fixation versus hemiarthroplasty, Outcome 12 Mortality up to 3 to 6 months. | ||||
| 12.1 Screws versus Thompson | 2 | 91 | Risk Ratio (M‐H, Fixed, 95% CI) | 1.02 [0.52, 2.00] |
| 12.2 Screws versus Moore | 3 | 617 | Risk Ratio (M‐H, Fixed, 95% CI) | 0.77 [0.56, 1.08] |
| 12.3 SHS versus Stanmore bipolar | 1 | 42 | Risk Ratio (M‐H, Fixed, 95% CI) | 0.25 [0.03, 2.05] |
| 12.4 Screws, SHS or nail & plate versus Christiansen bipolar | 2 | 273 | Risk Ratio (M‐H, Fixed, 95% CI) | 1.12 [0.61, 2.08] |
| 12.5 Screws or SHS versus bipolar hemiarthroplasty | 2 | 451 | Risk Ratio (M‐H, Fixed, 95% CI) | 0.71 [0.41, 1.23] |
| 13 Mortality up to 12 months Show forest plot | 10 | 1528 | Risk Ratio (M‐H, Fixed, 95% CI) | 0.93 [0.78, 1.11] |
| Analysis 2.13  Comparison 2 Internal fixation versus hemiarthroplasty, Outcome 13 Mortality up to 12 months. | ||||
| 13.1 Screws versus Thompson | 1 | 60 | Risk Ratio (M‐H, Fixed, 95% CI) | 1.34 [0.85, 2.11] |
| 13.2 Screws versus Moore | 3 | 617 | Risk Ratio (M‐H, Fixed, 95% CI) | 0.94 [0.73, 1.21] |
| 13.3 SHS versus Stanmore bipolar | 1 | 41 | Risk Ratio (M‐H, Fixed, 95% CI) | 0.42 [0.09, 1.92] |
| 13.4 Screws, SHS or nail & plate versus Christiansen bipolar | 2 | 273 | Risk Ratio (M‐H, Fixed, 95% CI) | 0.96 [0.60, 1.54] |
| 13.5 Screws or SHS versus bipolar hemiarthroplasty | 2 | 451 | Risk Ratio (M‐H, Fixed, 95% CI) | 0.82 [0.55, 1.24] |
| 13.6 SHS versus hemiarthroplasty (unknown type) | 1 | 86 | Risk Ratio (M‐H, Fixed, 95% CI) | 0.83 [0.27, 2.53] |
| 14 Mortality 24 to 48 months Show forest plot | 11 | 1519 | Risk Ratio (M‐H, Fixed, 95% CI) | 0.95 [0.84, 1.08] |
| Analysis 2.14  Comparison 2 Internal fixation versus hemiarthroplasty, Outcome 14 Mortality 24 to 48 months. | ||||
| 14.1 Screws versus Thompson | 2 | 91 | Risk Ratio (M‐H, Fixed, 95% CI) | 1.16 [0.91, 1.49] |
| 14.2 Screws versus Moore | 3 | 580 | Risk Ratio (M‐H, Fixed, 95% CI) | 0.88 [0.73, 1.06] |
| 14.3 2 von Bahr screws versus Variokopf bipolar hemiarthroplasty | 1 | 100 | Risk Ratio (M‐H, Fixed, 95% CI) | 1.55 [0.48, 4.97] |
| 14.4 SHS versus Stanmore bipolar | 1 | 42 | Risk Ratio (M‐H, Fixed, 95% CI) | 0.83 [0.30, 2.31] |
| 14.5 SHS or nail & plate versus Christiansen bipolar | 1 | 169 | Risk Ratio (M‐H, Fixed, 95% CI) | 1.02 [0.67, 1.56] |
| 14.6 Screws or SHS versus bipolar hemiarthroplasty | 2 | 451 | Risk Ratio (M‐H, Fixed, 95% CI) | 0.97 [0.71, 1.32] |
| 14.7 SHS versus hemiarthroplasty (unknown type) | 1 | 86 | Risk Ratio (M‐H, Fixed, 95% CI) | 0.85 [0.43, 1.67] |
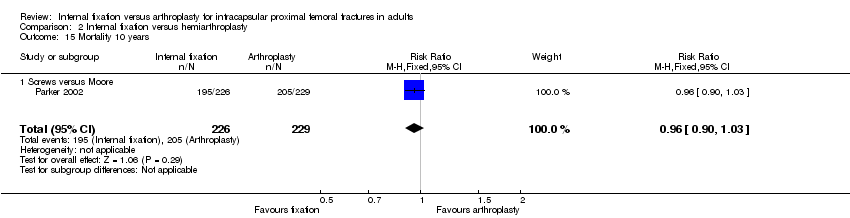
| 15 Mortality 10 years Show forest plot | 1 | 455 | Risk Ratio (M‐H, Fixed, 95% CI) | 0.96 [0.90, 1.03] |
| Analysis 2.15  Comparison 2 Internal fixation versus hemiarthroplasty, Outcome 15 Mortality 10 years. | ||||
| 15.1 Screws versus Moore | 1 | 455 | Risk Ratio (M‐H, Fixed, 95% CI) | 0.96 [0.90, 1.03] |
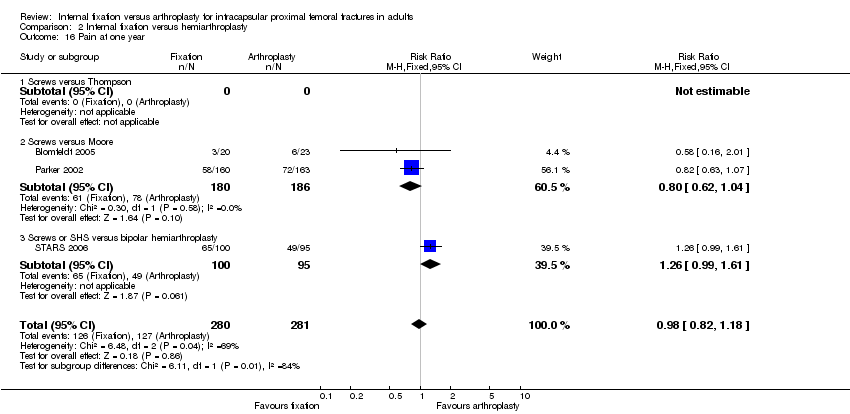
| 16 Pain at one year Show forest plot | 3 | 561 | Risk Ratio (M‐H, Fixed, 95% CI) | 0.98 [0.82, 1.18] |
| Analysis 2.16  Comparison 2 Internal fixation versus hemiarthroplasty, Outcome 16 Pain at one year. | ||||
| 16.1 Screws versus Thompson | 0 | 0 | Risk Ratio (M‐H, Fixed, 95% CI) | 0.0 [0.0, 0.0] |
| 16.2 Screws versus Moore | 2 | 366 | Risk Ratio (M‐H, Fixed, 95% CI) | 0.80 [0.62, 1.04] |
| 16.3 Screws or SHS versus bipolar hemiarthroplasty | 1 | 195 | Risk Ratio (M‐H, Fixed, 95% CI) | 1.26 [0.99, 1.61] |
| 17 Failure to return to same residence at final follow‐up Show forest plot | 2 | 372 | Risk Ratio (M‐H, Fixed, 95% CI) | 0.84 [0.54, 1.33] |
| Analysis 2.17  Comparison 2 Internal fixation versus hemiarthroplasty, Outcome 17 Failure to return to same residence at final follow‐up. | ||||
| 17.1 Screws versus Moore | 2 | 372 | Risk Ratio (M‐H, Fixed, 95% CI) | 0.84 [0.54, 1.33] |
| 18 Failure to regain mobility Show forest plot | 6 | 593 | Risk Ratio (M‐H, Fixed, 95% CI) | 0.99 [0.86, 1.15] |
| Analysis 2.18  Comparison 2 Internal fixation versus hemiarthroplasty, Outcome 18 Failure to regain mobility. | ||||
| 18.1 Screws versus Thompson | 1 | 24 | Risk Ratio (M‐H, Fixed, 95% CI) | 1.87 [0.53, 6.57] |
| 18.2 Screws versus Moore | 3 | 419 | Risk Ratio (M‐H, Fixed, 95% CI) | 0.88 [0.75, 1.04] |
| 18.3 2 von Bahr screws versus Variokopf bipolar hemiarthroplasty | 1 | 84 | Risk Ratio (M‐H, Fixed, 95% CI) | 1.95 [1.15, 3.30] |
| 18.4 Screws v Christiansen bipolar | 1 | 66 | Risk Ratio (M‐H, Fixed, 95% CI) | 0.99 [0.69, 1.43] |
| Outcome or subgroup title | No. of studies | No. of participants | Statistical method | Effect size |
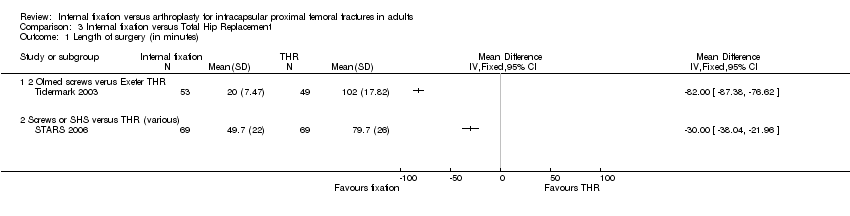
| 1 Length of surgery (in minutes) Show forest plot | 2 | Mean Difference (IV, Fixed, 95% CI) | Totals not selected | |
| Analysis 3.1  Comparison 3 Internal fixation versus Total Hip Replacement, Outcome 1 Length of surgery (in minutes). | ||||
| 1.1 2 Olmed screws verus Exeter THR | 1 | Mean Difference (IV, Fixed, 95% CI) | 0.0 [0.0, 0.0] | |
| 1.2 Screws or SHS versus THR (various) | 1 | Mean Difference (IV, Fixed, 95% CI) | 0.0 [0.0, 0.0] | |
| 2 Operative blood loss (in millilitres) Show forest plot | 1 | Mean Difference (IV, Fixed, 95% CI) | Totals not selected | |
| Analysis 3.2  Comparison 3 Internal fixation versus Total Hip Replacement, Outcome 2 Operative blood loss (in millilitres). | ||||
| 2.1 2 Olmed screws verus Exeter THR | 1 | Mean Difference (IV, Fixed, 95% CI) | 0.0 [0.0, 0.0] | |
| 3 Number of patients transfused Show forest plot | 2 | 240 | Risk Ratio (M‐H, Fixed, 95% CI) | 0.32 [0.20, 0.50] |
| Analysis 3.3  Comparison 3 Internal fixation versus Total Hip Replacement, Outcome 3 Number of patients transfused. | ||||
| 3.1 2 Olmed screws verus Exeter THR | 1 | 102 | Risk Ratio (M‐H, Fixed, 95% CI) | 0.07 [0.02, 0.22] |
| 3.2 Screws or SHS versus THR (various) | 1 | 138 | Risk Ratio (M‐H, Fixed, 95% CI) | 0.74 [0.43, 1.26] |
| 4 Re‐operations minor (Fixation removal of metalwork, dislocation of THR) Show forest plot | 5 | Risk Ratio (M‐H, Fixed, 95% CI) | Subtotals only | |
| Analysis 3.4  Comparison 3 Internal fixation versus Total Hip Replacement, Outcome 4 Re‐operations minor (Fixation removal of metalwork, dislocation of THR). | ||||
| 4.1 Hansson pin versus Charnley | 1 | 47 | Risk Ratio (M‐H, Fixed, 95% CI) | 0.19 [0.01, 3.80] |
| 4.2 2 Olmed screws versus Lubinus or BiMetric | 2 | 166 | Risk Ratio (M‐H, Fixed, 95% CI) | 0.52 [0.23, 1.14] |
| 4.3 2 Olmed screws verus Exeter THR | 1 | 102 | Risk Ratio (M‐H, Fixed, 95% CI) | 9.25 [1.23, 69.60] |
| 4.4 SHS versus Howse II | 1 | 180 | Risk Ratio (M‐H, Fixed, 95% CI) | 0.03 [0.00, 0.43] |
| 5 Re‐operations moderate (Fixation to hemiarthroplasty or THR, drainage, girdlestone) Show forest plot | 5 | Risk Ratio (M‐H, Fixed, 95% CI) | Subtotals only | |
| Analysis 3.5  Comparison 3 Internal fixation versus Total Hip Replacement, Outcome 5 Re‐operations moderate (Fixation to hemiarthroplasty or THR, drainage, girdlestone). | ||||
| 5.1 Hansson pin versus Charnley | 1 | 47 | Risk Ratio (M‐H, Fixed, 95% CI) | 14.4 [0.87, 238.56] |
| 5.2 2 Olmed screws versus Lubinus or BiMetric | 2 | 166 | Risk Ratio (M‐H, Fixed, 95% CI) | 27.16 [3.66, 201.50] |
| 5.3 2 Olmed screws verus Exeter THR | 1 | 102 | Risk Ratio (M‐H, Fixed, 95% CI) | 34.26 [2.12, 553.64] |
| 5.4 SHS versus Howse II | 1 | 180 | Risk Ratio (M‐H, Fixed, 95% CI) | 59.67 [3.70, 961.20] |
| 6 Re‐operations major (revision THR) Show forest plot | 5 | Risk Ratio (M‐H, Fixed, 95% CI) | Subtotals only | |
| Analysis 3.6  Comparison 3 Internal fixation versus Total Hip Replacement, Outcome 6 Re‐operations major (revision THR). | ||||
| 6.1 Hannson pin versus Charnley | 1 | 47 | Risk Ratio (M‐H, Fixed, 95% CI) | 0.32 [0.01, 7.48] |
| 6.2 2 Olmed screws versus Lubinus or BiMetric | 2 | 166 | Risk Ratio (M‐H, Fixed, 95% CI) | 0.0 [0.0, 0.0] |
| 6.3 2 Olmed screws verus Exeter THR | 1 | 102 | Risk Ratio (M‐H, Fixed, 95% CI) | 0.19 [0.01, 3.76] |
| 6.4 SHS versus Howse II | 1 | 180 | Risk Ratio (M‐H, Fixed, 95% CI) | 0.08 [0.00, 1.32] |
| 7 Total re‐operation rate (within follow‐up period of study) Show forest plot | 7 | Risk Ratio (M‐H, Fixed, 95% CI) | Subtotals only | |
| Analysis 3.7  Comparison 3 Internal fixation versus Total Hip Replacement, Outcome 7 Total re‐operation rate (within follow‐up period of study). | ||||
| 7.1 Hansson pin versus Charnley | 1 | 47 | Risk Ratio (M‐H, Fixed, 95% CI) | 3.35 [0.78, 14.50] |
| 7.2 2 Olmed screws versus Lubinus or Bimetric | 2 | 166 | Risk Ratio (M‐H, Fixed, 95% CI) | 2.32 [1.36, 3.94] |
| 7.3 2 Olmed screws verus Exeter THR | 1 | 102 | Risk Ratio (M‐H, Fixed, 95% CI) | 11.56 [2.89, 46.25] |
| 7.4 SHS versus Howse II | 1 | 180 | Risk Ratio (M‐H, Fixed, 95% CI) | 1.47 [0.90, 2.38] |
| 7.5 Screws or SHS versus THR (various) | 1 | 138 | Risk Ratio (M‐H, Fixed, 95% CI) | 4.5 [1.98, 10.21] |
| 7.6 SHS versus THR (unknown type) | 1 | 86 | Risk Ratio (M‐H, Fixed, 95% CI) | 12.0 [1.63, 88.29] |
| 8 Superficial wound infection Show forest plot | 4 | 315 | Risk Ratio (M‐H, Fixed, 95% CI) | 0.43 [0.13, 1.50] |
| Analysis 3.8  Comparison 3 Internal fixation versus Total Hip Replacement, Outcome 8 Superficial wound infection. | ||||
| 8.1 Hansson pin versus Charnley | 1 | 47 | Risk Ratio (M‐H, Fixed, 95% CI) | 0.32 [0.01, 7.48] |
| 8.2 2 Olmed screws versus Lubinus or BiMetric | 2 | 166 | Risk Ratio (M‐H, Fixed, 95% CI) | 0.66 [0.14, 3.15] |
| 8.3 2 Olmed screws verus Exeter THR | 1 | 102 | Risk Ratio (M‐H, Fixed, 95% CI) | 0.19 [0.01, 3.76] |
| 9 Deep wound infection Show forest plot | 3 | Risk Ratio (M‐H, Fixed, 95% CI) | Subtotals only | |
| Analysis 3.9  Comparison 3 Internal fixation versus Total Hip Replacement, Outcome 9 Deep wound infection. | ||||
| 9.1 SHS versus Howse II | 1 | 178 | Risk Ratio (M‐H, Fixed, 95% CI) | 0.16 [0.01, 3.36] |
| 9.2 2 Olmed screws versus Lubinus or BiMetric | 1 | 146 | Risk Ratio (M‐H, Fixed, 95% CI) | 2.62 [0.11, 63.28] |
| 9.3 2 Olmed screws verus Exeter THR | 1 | 102 | Risk Ratio (M‐H, Fixed, 95% CI) | 0.0 [0.0, 0.0] |
| 10 Hospital stay (days) Show forest plot | 2 | Mean Difference (IV, Fixed, 95% CI) | Totals not selected | |
| Analysis 3.10  Comparison 3 Internal fixation versus Total Hip Replacement, Outcome 10 Hospital stay (days). | ||||
| 10.1 Screws or SHS versus THR (various) | 1 | Mean Difference (IV, Fixed, 95% CI) | 0.0 [0.0, 0.0] | |
| 10.2 SHS versus THR (unknown type) | 1 | Mean Difference (IV, Fixed, 95% CI) | 0.0 [0.0, 0.0] | |
| 11 Mortality up to 2 to 4 months Show forest plot | 4 | 406 | Risk Ratio (M‐H, Fixed, 95% CI) | 2.21 [0.91, 5.40] |
| Analysis 3.11  Comparison 3 Internal fixation versus Total Hip Replacement, Outcome 11 Mortality up to 2 to 4 months. | ||||
| 11.1 2 Olmed screws versus Lubinus or BiMetric | 2 | 166 | Risk Ratio (M‐H, Fixed, 95% CI) | 2.03 [0.65, 6.29] |
| 11.2 2 Olmed screws verus Exeter THR | 1 | 102 | Risk Ratio (M‐H, Fixed, 95% CI) | 6.48 [0.34, 122.37] |
| 11.3 Screws or SHS versus THR (various) | 1 | 138 | Risk Ratio (M‐H, Fixed, 95% CI) | 1.5 [0.26, 8.70] |
| 12 Mortality at 12 to 18 months Show forest plot | 4 | 390 | Risk Ratio (M‐H, Fixed, 95% CI) | 1.03 [0.64, 1.64] |
| Analysis 3.12  Comparison 3 Internal fixation versus Total Hip Replacement, Outcome 12 Mortality at 12 to 18 months. | ||||
| 12.1 2 Olmed screws versus Lubinus or BiMetric | 2 | 166 | Risk Ratio (M‐H, Fixed, 95% CI) | 0.99 [0.55, 1.76] |
| 12.2 Screws or SHS versus THR (various) | 1 | 138 | Risk Ratio (M‐H, Fixed, 95% CI) | 1.5 [0.44, 5.08] |
| 12.3 SHS versus THR (unknown type) | 1 | 86 | Risk Ratio (M‐H, Fixed, 95% CI) | 0.83 [0.27, 2.53] |
| 13 Mortality at 24 months Show forest plot | 4 | 433 | Risk Ratio (M‐H, Fixed, 95% CI) | 1.18 [0.79, 1.75] |
| Analysis 3.13  Comparison 3 Internal fixation versus Total Hip Replacement, Outcome 13 Mortality at 24 months. | ||||
| 13.1 Hansson pin versus Charnley | 1 | 47 | Risk Ratio (M‐H, Fixed, 95% CI) | 0.64 [0.12, 3.48] |
| 13.2 2 Olmed screws versus Lubinus or BiMetric | 1 | 146 | Risk Ratio (M‐H, Fixed, 95% CI) | 1.00 [0.61, 1.66] |
| 13.3 2 Olmed screws verus Exeter THR | 1 | 102 | Risk Ratio (M‐H, Fixed, 95% CI) | 1.85 [0.68, 5.03] |
| 13.4 Screws or SHS versus THR (various) | 1 | 138 | Risk Ratio (M‐H, Fixed, 95% CI) | 1.5 [0.56, 3.99] |
| 14 Mortality at 4 years Show forest plot | 1 | Risk Ratio (M‐H, Fixed, 95% CI) | Totals not selected | |
| Analysis 3.14  Comparison 3 Internal fixation versus Total Hip Replacement, Outcome 14 Mortality at 4 years. | ||||
| 14.1 SHS versus THR (unknown type) | 1 | Risk Ratio (M‐H, Fixed, 95% CI) | 0.0 [0.0, 0.0] | |
| 15 Pain at 1 year Show forest plot | 2 | 157 | Risk Ratio (M‐H, Fixed, 95% CI) | 1.40 [1.02, 1.90] |
| Analysis 3.15  Comparison 3 Internal fixation versus Total Hip Replacement, Outcome 15 Pain at 1 year. | ||||
| 15.1 Hansson pin versus Charnley | 1 | 35 | Risk Ratio (M‐H, Fixed, 95% CI) | 1.91 [0.80, 4.55] |
| 15.2 Screws or SHS versus THR (various) | 1 | 122 | Risk Ratio (M‐H, Fixed, 95% CI) | 1.31 [0.94, 1.82] |

Risk of bias summary: review authors' judgements about each risk of bias item for each included study.

Risk of bias graph: review authors' judgements about each risk of bias item presented as percentages across all included studies.
Comparison 1 Internal fixation versus arthroplasty (all types), Outcome 1 Length of surgery ( in minutes).
Comparison 1 Internal fixation versus arthroplasty (all types), Outcome 2 Operative blood loss (in millilitres).

Comparison 1 Internal fixation versus arthroplasty (all types), Outcome 3 Number of patients transfused.
Comparison 1 Internal fixation versus arthroplasty (all types), Outcome 4 Mean units blood transfused.
Comparison 1 Internal fixation versus arthroplasty (all types), Outcome 5 Non‐union of fracture within follow‐up period (includes early displacement).

Comparison 1 Internal fixation versus arthroplasty (all types), Outcome 6 Avascular necrosis.

Comparison 1 Internal fixation versus arthroplasty (all types), Outcome 7 Dislocation of prosthesis.
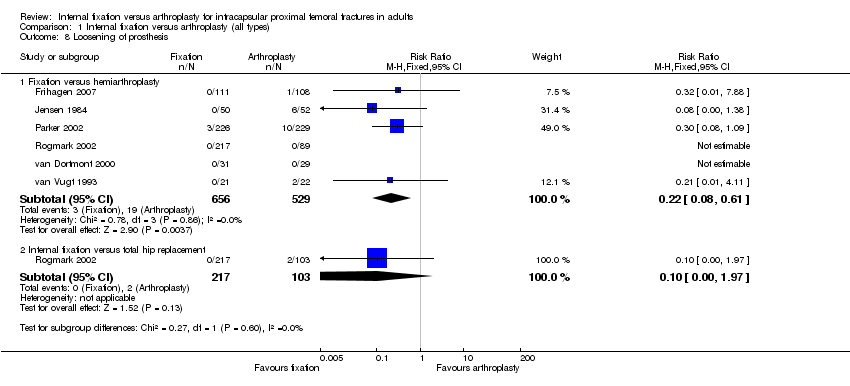
Comparison 1 Internal fixation versus arthroplasty (all types), Outcome 8 Loosening of prosthesis.

Comparison 1 Internal fixation versus arthroplasty (all types), Outcome 9 Acetabular wear (as defined by each study).

Comparison 1 Internal fixation versus arthroplasty (all types), Outcome 10 Fracture below/around implant.

Comparison 1 Internal fixation versus arthroplasty (all types), Outcome 11 Re‐operations minor (e.g. removal of fixation, dislocation of arthroplasty).

Comparison 1 Internal fixation versus arthroplasty (all types), Outcome 12 Re‐operations moderate (e.g. fixation to arthroplasty, drainage, girdlestone).
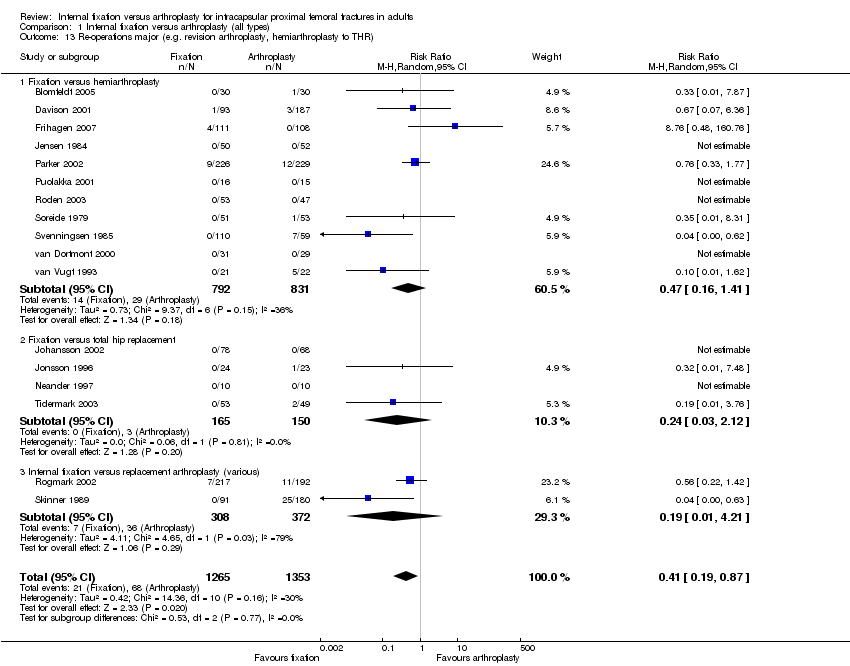
Comparison 1 Internal fixation versus arthroplasty (all types), Outcome 13 Re‐operations major (e.g. revision arthroplasty, hemiarthroplasty to THR).

Comparison 1 Internal fixation versus arthroplasty (all types), Outcome 14 Total re‐operation rate (within follow‐up period of study).

Comparison 1 Internal fixation versus arthroplasty (all types), Outcome 15 Superficial wound infection.

Comparison 1 Internal fixation versus arthroplasty (all types), Outcome 16 Deep wound infection.

Comparison 1 Internal fixation versus arthroplasty (all types), Outcome 17 Pneumonia.

Comparison 1 Internal fixation versus arthroplasty (all types), Outcome 18 Deep vein thrombosis.

Comparison 1 Internal fixation versus arthroplasty (all types), Outcome 19 Pulmonary embolism.

Comparison 1 Internal fixation versus arthroplasty (all types), Outcome 20 Thromboembolic complications combined.
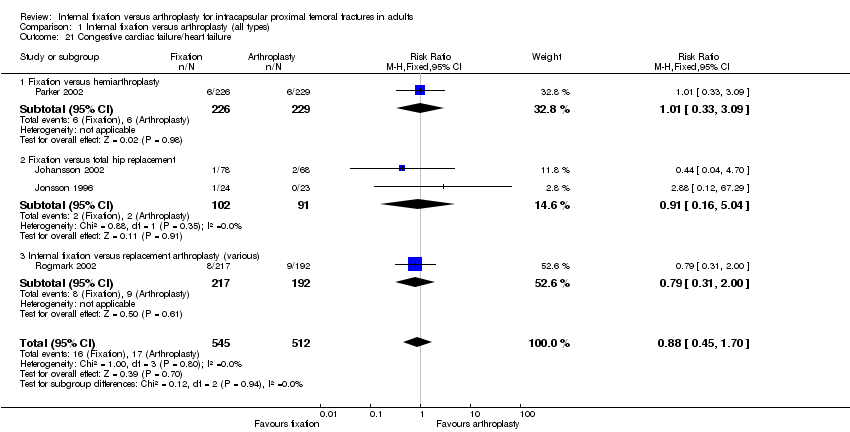
Comparison 1 Internal fixation versus arthroplasty (all types), Outcome 21 Congestive cardiac failure/heart failure.

Comparison 1 Internal fixation versus arthroplasty (all types), Outcome 22 Myocardial infarction.

Comparison 1 Internal fixation versus arthroplasty (all types), Outcome 23 Stroke (cerebrovascular accident).

Comparison 1 Internal fixation versus arthroplasty (all types), Outcome 24 Confusional state.

Comparison 1 Internal fixation versus arthroplasty (all types), Outcome 25 Gastrointestinal complications.

Comparison 1 Internal fixation versus arthroplasty (all types), Outcome 26 Pressure sores.
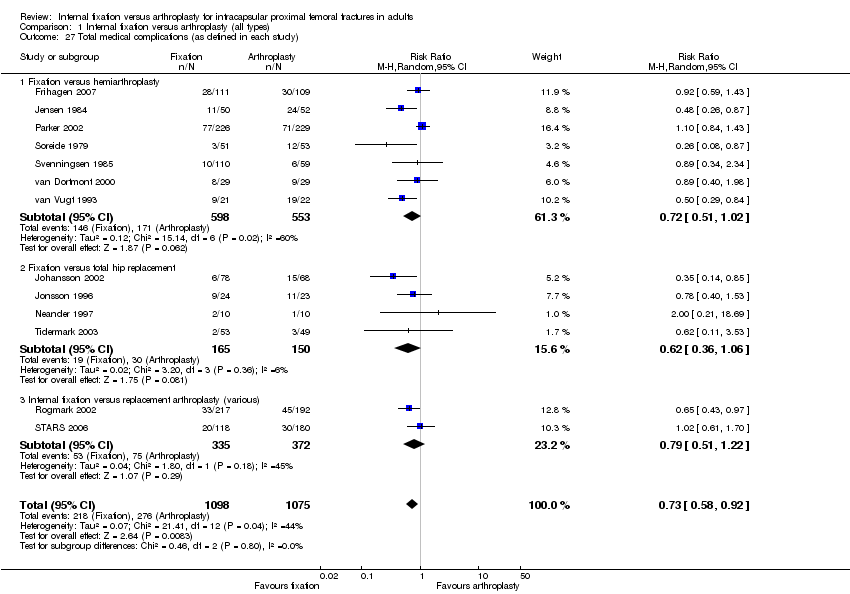
Comparison 1 Internal fixation versus arthroplasty (all types), Outcome 27 Total medical complications (as defined in each study).
Comparison 1 Internal fixation versus arthroplasty (all types), Outcome 28 Length of hospital stay (in days).

Comparison 1 Internal fixation versus arthroplasty (all types), Outcome 29 Mortality 30 days.

Comparison 1 Internal fixation versus arthroplasty (all types), Outcome 30 Mortality up to 3 to 6 months.

Comparison 1 Internal fixation versus arthroplasty (all types), Outcome 31 Mortality up to 12 months.

Comparison 1 Internal fixation versus arthroplasty (all types), Outcome 32 Mortality up to 24 to 48 months.
Comparison 1 Internal fixation versus arthroplasty (all types), Outcome 33 Mortality 10 years.

Comparison 1 Internal fixation versus arthroplasty (all types), Outcome 34 Residual pain at 1 year.
Comparison 1 Internal fixation versus arthroplasty (all types), Outcome 35 Residual pain at 1 year (subgrouped by cemented versus uncemented).

Comparison 1 Internal fixation versus arthroplasty (all types), Outcome 36 Mean pain score at 1 to 2 years.
Comparison 1 Internal fixation versus arthroplasty (all types), Outcome 37 Mean pain score at 1 to 2 years (subgrouped by cemented versus uncemented).
Comparison 1 Internal fixation versus arthroplasty (all types), Outcome 38 Pain at 2 to 3 years.
Comparison 1 Internal fixation versus arthroplasty (all types), Outcome 39 Failure to return to same residence at final follow‐up.

Comparison 1 Internal fixation versus arthroplasty (all types), Outcome 40 Failure to regain mobility.

Comparison 1 Internal fixation versus arthroplasty (all types), Outcome 41 Harris hip score (at 1 year).

Comparison 1 Internal fixation versus arthroplasty (all types), Outcome 42 Hip rating questionnaire at 1 year.

Comparison 1 Internal fixation versus arthroplasty (all types), Outcome 43 Hip scores (at 1 year).

Comparison 1 Internal fixation versus arthroplasty (all types), Outcome 44 Mean Eq‐5d score (at 1 year).
Comparison 1 Internal fixation versus arthroplasty (all types), Outcome 45 Barthel index score of below 95 at 1 year.

Comparison 2 Internal fixation versus hemiarthroplasty, Outcome 1 Length of surgery (in minutes).

Comparison 2 Internal fixation versus hemiarthroplasty, Outcome 2 Operative blood loss (in millilitres).
Comparison 2 Internal fixation versus hemiarthroplasty, Outcome 3 Number of patients transfused.

Comparison 2 Internal fixation versus hemiarthroplasty, Outcome 4 Re‐operations minor ( eg fixation‐ removal of metalwork, dislocation of hemiarthroplasty).

Comparison 2 Internal fixation versus hemiarthroplasty, Outcome 5 Re‐operations moderate (eg fixation to hemiarthroplasty or total hip replacement, drainage, girdlestone).

Comparison 2 Internal fixation versus hemiarthroplasty, Outcome 6 Re‐operations major (eg revision hemiarthroplasty or conversion to total hip replacement).

Comparison 2 Internal fixation versus hemiarthroplasty, Outcome 7 Total re‐operation rate (within follow‐up period of study).
Comparison 2 Internal fixation versus hemiarthroplasty, Outcome 8 Superficial wound infection.

Comparison 2 Internal fixation versus hemiarthroplasty, Outcome 9 Deep wound infection.

Comparison 2 Internal fixation versus hemiarthroplasty, Outcome 10 Length of hospital stay (in days).

Comparison 2 Internal fixation versus hemiarthroplasty, Outcome 11 Mortality at 30 days.

Comparison 2 Internal fixation versus hemiarthroplasty, Outcome 12 Mortality up to 3 to 6 months.

Comparison 2 Internal fixation versus hemiarthroplasty, Outcome 13 Mortality up to 12 months.

Comparison 2 Internal fixation versus hemiarthroplasty, Outcome 14 Mortality 24 to 48 months.
Comparison 2 Internal fixation versus hemiarthroplasty, Outcome 15 Mortality 10 years.
Comparison 2 Internal fixation versus hemiarthroplasty, Outcome 16 Pain at one year.

Comparison 2 Internal fixation versus hemiarthroplasty, Outcome 17 Failure to return to same residence at final follow‐up.

Comparison 2 Internal fixation versus hemiarthroplasty, Outcome 18 Failure to regain mobility.
Comparison 3 Internal fixation versus Total Hip Replacement, Outcome 1 Length of surgery (in minutes).
Comparison 3 Internal fixation versus Total Hip Replacement, Outcome 2 Operative blood loss (in millilitres).

Comparison 3 Internal fixation versus Total Hip Replacement, Outcome 3 Number of patients transfused.

Comparison 3 Internal fixation versus Total Hip Replacement, Outcome 4 Re‐operations minor (Fixation removal of metalwork, dislocation of THR).

Comparison 3 Internal fixation versus Total Hip Replacement, Outcome 5 Re‐operations moderate (Fixation to hemiarthroplasty or THR, drainage, girdlestone).

Comparison 3 Internal fixation versus Total Hip Replacement, Outcome 6 Re‐operations major (revision THR).

Comparison 3 Internal fixation versus Total Hip Replacement, Outcome 7 Total re‐operation rate (within follow‐up period of study).
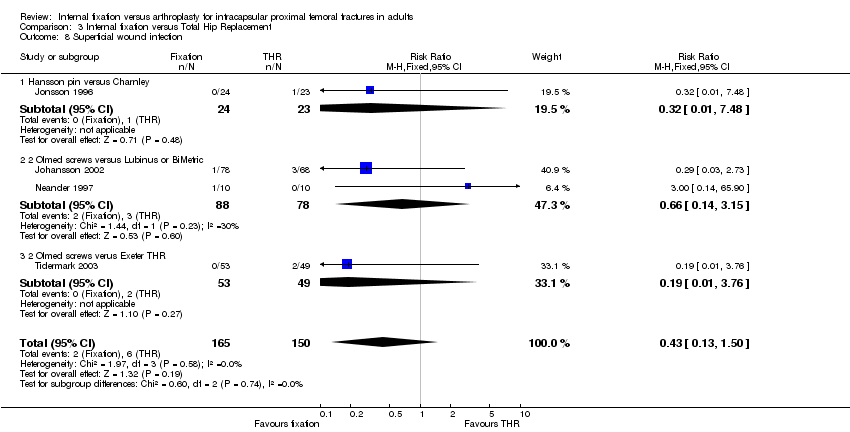
Comparison 3 Internal fixation versus Total Hip Replacement, Outcome 8 Superficial wound infection.

Comparison 3 Internal fixation versus Total Hip Replacement, Outcome 9 Deep wound infection.

Comparison 3 Internal fixation versus Total Hip Replacement, Outcome 10 Hospital stay (days).

Comparison 3 Internal fixation versus Total Hip Replacement, Outcome 11 Mortality up to 2 to 4 months.
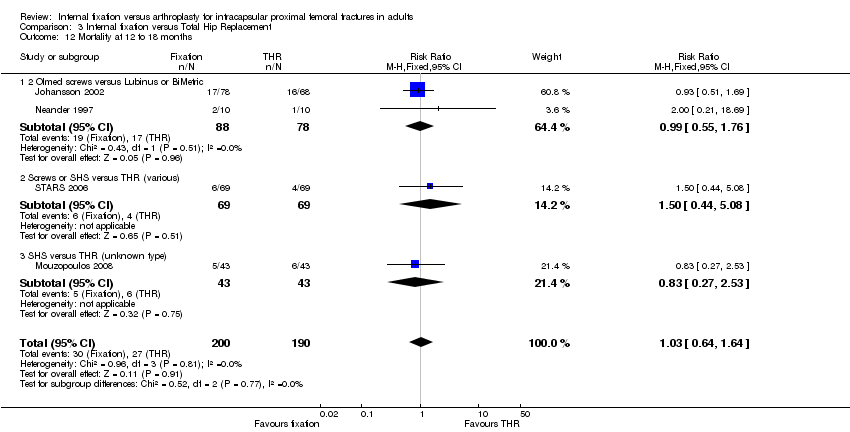
Comparison 3 Internal fixation versus Total Hip Replacement, Outcome 12 Mortality at 12 to 18 months.
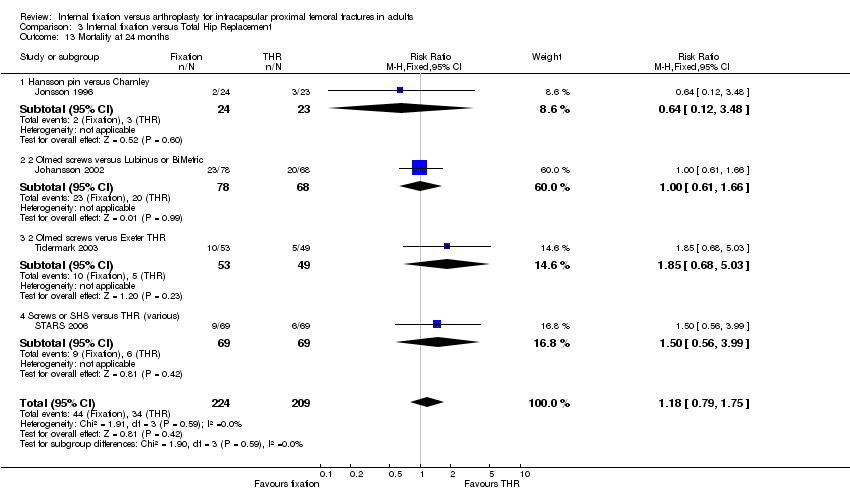
Comparison 3 Internal fixation versus Total Hip Replacement, Outcome 13 Mortality at 24 months.
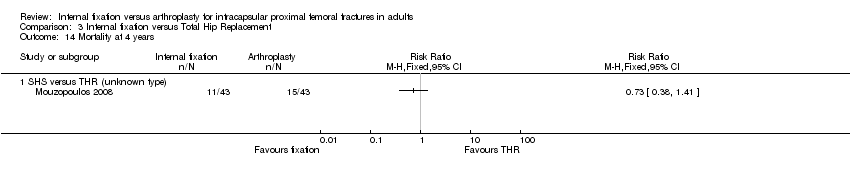
Comparison 3 Internal fixation versus Total Hip Replacement, Outcome 14 Mortality at 4 years.
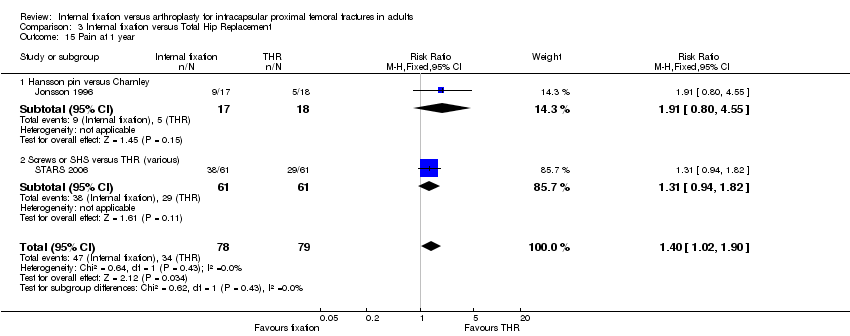
Comparison 3 Internal fixation versus Total Hip Replacement, Outcome 15 Pain at 1 year.
| 1. Was there clear concealment of allocation? | Score 3 if allocation was concealed (e.g. numbered sealed opaque envelopes drawn consecutively). Score 2 if there was a possible chance of disclosure before allocation. Score 1 if the method of allocation concealment or randomisation was not stated or was unclear. Score 0 if allocation concealment was clearly not concealed such as those trials using quasi‐randomisation (e.g. even or odd date of birth). |
| 2. Were the inclusion and exclusion criteria clearly defined? | Score 1 if text states the type of fracture and which patients were included and/or excluded. Otherwise score 0. |
| 3. Were the outcomes of trial participants who withdrew or excluded after allocation described and included in an intention‐to‐treat analysis? | Score 1 if yes or text states that no withdrawals occurred, or data are presented that, by clearly showing 'participant flow', allow this to be inferred. Otherwise score 0. |
| 4. Were the treatment and control groups adequately described at entry and if so were the groups well matched or appropriate co‐variate adjustment made? | Score 1 if at least four admission details given (e.g. age, sex, mobility, function score, mental test score, fracture type) with no significant difference between groups or appropriate adjustment made. Otherwise score 0. |
| 5. Did the surgeons have prior experience of the operations they performed in the trial, prior to its commencement? | Score 1 if text states there was an introductory period or that surgeons were experienced. Otherwise score 0. |
| 6. Were the care programmes other than trial options identical? | Score 1 if text states they were or if this can be inferred. Otherwise score 0. |
| 7. Were the outcome measures clearly defined in the text with a definition of any ambiguous terms encountered? | Score 1 if yes. Otherwise score 0. |
| 8. Were the outcome assessors blind to assignment status? | Score 1 if assessors of pain and function at follow‐up were blinded to treatment outcome. Otherwise score 0. |
| 9. Was the timing of outcome measures appropriate? A minimum of 24 months active follow‐up for all surviving trial participants. | Score 1 if yes. Otherwise score 0. |
| 10. Was loss to follow‐up reported and if so were less than 5% of trial participants lost to follow‐up? | Score 1 if yes. Otherwise score 0. |
| Study ID | Item 1 | Item 2 | Item 3 | Item 4 | Item 5 | Item 6 | Item 7 | Item 8 | Item 9 | Item 10 |
| 0 | 0 | 0 | 0 | 0 | 0 | 1 | 0 | 0 | 0 | |
| 2 | 0 | 0 | 0 | 0 | 1 | 1 | 0 | 1 | 1 | |
| 1 | 0 | 0 | 0 | 0 | 0 | 1 | 0 | 1 | 1 | |
| 0 | 1 | 0 | 0 | 0 | 0 | 1 | 0 | 0 | 0 | |
| 1 | 1 | 0 | 1 | 0 | 0 | 1 | 0 | 1 | 1 | |
| 2 | 1 | 0 | 0 | 0 | 1 | 1 | 0 | 1 | 1 | |
| 1 | 1 | 0 | 0 | 0 | 0 | 1 | 0 | 0 | 1 | |
| 2 | 1 | 1 | 1 | 0 | 1 | 1 | 0 | 1 | 1 | |
| 2 | 1 | 0 | 1 | 0 | 1 | 0 | 1 | 1 | 0 | |
| 2 | 1 | 0 | 1 | 0 | 0 | 1 | 0 | 1 | 1 | |
| 1 | 1 | 0 | 0 | 0 | 1 | 1 | 0 | 1 | 0 | |
| 2 | 1 | 1 | 1 | 1 | 1 | 0 | 0 | 1 | 1 | |
| 3 | 1 | 0 | 0 | 1 | 1 | 1 | 0 | 1 | 1 | |
| 2 | 1 | 0 | 0 | 0 | 0 | 0 | 0 | 1 | 1 | |
| 2 | 1 | 0 | 1 | 1 | 1 | 1 | 0 | 1 | 1 | |
| 2 | 1 | 1 | 1 | 1 | 1 | 1 | 0 | 1 | 1 | |
| 3 | 1 | 1 | 0 | 0 | 0 | 1 | 0 | 1 | 1 | |
| 3 | 1 | 1 | 1 | 0 | 0 | 1 | 1 | 1 | 1 | |
| 0 | 1 | 0 | 1 | 0 | 1 | 1 | 1 | 1 | 0 |
| Outcome or subgroup title | No. of studies | No. of participants | Statistical method | Effect size |
| 1 Length of surgery ( in minutes) Show forest plot | 8 | Mean Difference (IV, Fixed, 95% CI) | Totals not selected | |
| 1.1 Fixation versus hemiarthroplasty | 6 | Mean Difference (IV, Fixed, 95% CI) | 0.0 [0.0, 0.0] | |
| 1.2 Fixation versus total hip replacement | 1 | Mean Difference (IV, Fixed, 95% CI) | 0.0 [0.0, 0.0] | |
| 1.3 Internal fixation versus replacement arthroplasty (various) | 1 | Mean Difference (IV, Fixed, 95% CI) | 0.0 [0.0, 0.0] | |
| 2 Operative blood loss (in millilitres) Show forest plot | 7 | Mean Difference (IV, Fixed, 95% CI) | Totals not selected | |
| 2.1 Fixation versus hemiarthroplasty | 6 | Mean Difference (IV, Fixed, 95% CI) | 0.0 [0.0, 0.0] | |
| 2.2 Fixation versus total hip replacement | 1 | Mean Difference (IV, Fixed, 95% CI) | 0.0 [0.0, 0.0] | |
| 3 Number of patients transfused Show forest plot | 6 | 1231 | Risk Ratio (M‐H, Random, 95% CI) | 0.24 [0.09, 0.64] |
| 3.1 Fixation versus hemiarthroplasty | 4 | 831 | Risk Ratio (M‐H, Random, 95% CI) | 0.24 [0.11, 0.53] |
| 3.2 Fixation versus total hip replacement | 1 | 102 | Risk Ratio (M‐H, Random, 95% CI) | 0.07 [0.02, 0.22] |
| 3.3 Internal fixation versus replacement arthroplasty (various) | 1 | 298 | Risk Ratio (M‐H, Random, 95% CI) | 1.08 [0.71, 1.63] |
| 4 Mean units blood transfused Show forest plot | 2 | 547 | Mean Difference (IV, Random, 95% CI) | ‐0.57 [‐1.10, ‐0.04] |
| 4.1 Fixation versus hemiarthroplasty | 2 | 547 | Mean Difference (IV, Random, 95% CI) | ‐0.57 [‐1.10, ‐0.04] |
| 5 Non‐union of fracture within follow‐up period (includes early displacement) Show forest plot | 15 | 2178 | Risk Ratio (M‐H, Fixed, 95% CI) | 27.94 [15.65, 49.86] |
| 5.1 Fixation versus hemiarthroplasty | 10 | 1454 | Risk Ratio (M‐H, Fixed, 95% CI) | 24.24 [12.68, 46.36] |
| 5.2 Fixation versus total hip replacement | 4 | 315 | Risk Ratio (M‐H, Fixed, 95% CI) | 22.59 [5.52, 92.50] |
| 5.3 Internal fixation versus replacement arthroplasty (various) | 1 | 409 | Risk Ratio (M‐H, Fixed, 95% CI) | 110.67 [6.89, 1776.91] |
| 6 Avascular necrosis Show forest plot | 12 | 2051 | Risk Ratio (M‐H, Fixed, 95% CI) | 19.22 [8.16, 45.27] |
| 6.1 Fixation versus hemiarthroplasty | 9 | 1394 | Risk Ratio (M‐H, Fixed, 95% CI) | 13.06 [4.82, 35.42] |
| 6.2 Fixation versus total hip replacement | 2 | 248 | Risk Ratio (M‐H, Fixed, 95% CI) | 20.66 [2.83, 150.74] |
| 6.3 Internal fixation versus replacement arthroplasty (various) | 1 | 409 | Risk Ratio (M‐H, Fixed, 95% CI) | 61.09 [3.77, 989.69] |
| 7 Dislocation of prosthesis Show forest plot | 15 | Risk Ratio (M‐H, Random, 95% CI) | Subtotals only | |
| 7.1 Fixation versus hemiarthroplasty | 10 | 1806 | Risk Ratio (M‐H, Random, 95% CI) | 0.27 [0.06, 1.16] |
| 7.2 Fixation versus total hip replacement | 6 | 806 | Risk Ratio (M‐H, Random, 95% CI) | 0.08 [0.02, 0.25] |
| 7.3 Internal fixation versus replacement arthroplasty (various) | 1 | 298 | Risk Ratio (M‐H, Random, 95% CI) | 1.27 [0.40, 4.07] |
| 8 Loosening of prosthesis Show forest plot | 6 | Risk Ratio (M‐H, Fixed, 95% CI) | Subtotals only | |
| 8.1 Fixation versus hemiarthroplasty | 6 | 1185 | Risk Ratio (M‐H, Fixed, 95% CI) | 0.22 [0.08, 0.61] |
| 8.2 Internal fixation versus total hip replacement | 1 | 320 | Risk Ratio (M‐H, Fixed, 95% CI) | 0.10 [0.00, 1.97] |
| 9 Acetabular wear (as defined by each study) Show forest plot | 5 | 940 | Risk Ratio (M‐H, Fixed, 95% CI) | 0.21 [0.05, 0.90] |
| 9.1 Fixation versus hemiarthroplasty | 5 | 940 | Risk Ratio (M‐H, Fixed, 95% CI) | 0.21 [0.05, 0.90] |
| 10 Fracture below/around implant Show forest plot | 5 | 1128 | Risk Ratio (M‐H, Random, 95% CI) | 0.40 [0.09, 1.67] |
| 10.1 Fixation versus hemiarthroplasty | 3 | 617 | Risk Ratio (M‐H, Random, 95% CI) | 0.49 [0.05, 4.56] |
| 10.2 Fixation versus total hip replacement | 1 | 102 | Risk Ratio (M‐H, Random, 95% CI) | 0.31 [0.01, 7.40] |
| 10.3 Internal fixation versus replacement arthroplasty (various) | 1 | 409 | Risk Ratio (M‐H, Random, 95% CI) | 0.18 [0.02, 1.50] |
| 11 Re‐operations minor (e.g. removal of fixation, dislocation of arthroplasty) Show forest plot | 17 | 2618 | Risk Ratio (M‐H, Random, 95% CI) | 1.36 [0.69, 2.68] |
| 11.1 Fixation versus hemiarthroplasty | 11 | 1623 | Risk Ratio (M‐H, Random, 95% CI) | 2.36 [1.05, 5.30] |
| 11.2 Fixation versus total hip replacement | 4 | 315 | Risk Ratio (M‐H, Random, 95% CI) | 0.86 [0.16, 4.70] |
| 11.3 Internal fixation versus replacement arthroplasty (various) | 2 | 680 | Risk Ratio (M‐H, Random, 95% CI) | 0.24 [0.00, 22.30] |
| 12 Re‐operations moderate (e.g. fixation to arthroplasty, drainage, girdlestone) Show forest plot | 17 | 2618 | Risk Ratio (M‐H, Random, 95% CI) | 9.35 [5.79, 15.07] |
| 12.1 Fixation versus hemiarthroplasty | 11 | 1623 | Risk Ratio (M‐H, Random, 95% CI) | 7.56 [4.88, 11.72] |
| 12.2 Fixation versus total hip replacement | 4 | 315 | Risk Ratio (M‐H, Random, 95% CI) | 17.96 [4.31, 74.91] |
| 12.3 Internal fixation versus replacement arthroplasty (various) | 2 | 680 | Risk Ratio (M‐H, Random, 95% CI) | 45.28 [3.31, 619.46] |
| 13 Re‐operations major (e.g. revision arthroplasty, hemiarthroplasty to THR) Show forest plot | 17 | 2618 | Risk Ratio (M‐H, Random, 95% CI) | 0.41 [0.19, 0.87] |
| 13.1 Fixation versus hemiarthroplasty | 11 | 1623 | Risk Ratio (M‐H, Random, 95% CI) | 0.47 [0.16, 1.41] |
| 13.2 Fixation versus total hip replacement | 4 | 315 | Risk Ratio (M‐H, Random, 95% CI) | 0.24 [0.03, 2.12] |
| 13.3 Internal fixation versus replacement arthroplasty (various) | 2 | 680 | Risk Ratio (M‐H, Random, 95% CI) | 0.19 [0.01, 4.21] |
| 14 Total re‐operation rate (within follow‐up period of study) Show forest plot | 19 | 3045 | Risk Ratio (M‐H, Random, 95% CI) | 3.22 [2.31, 4.47] |
| 14.1 Fixation versus hemiarthroplasty | 11 | 1623 | Risk Ratio (M‐H, Random, 95% CI) | 3.13 [1.95, 5.03] |
| 14.2 Fixation versus total hip replacement | 4 | 315 | Risk Ratio (M‐H, Random, 95% CI) | 3.43 [1.45, 8.10] |
| 14.3 Internal fixation versus replacement arthroplasty (various) | 4 | 1107 | Risk Ratio (M‐H, Random, 95% CI) | 3.26 [1.65, 6.43] |
| 15 Superficial wound infection Show forest plot | 14 | 1986 | Risk Ratio (M‐H, Fixed, 95% CI) | 0.85 [0.53, 1.38] |
| 15.1 Fixation versus hemiarthroplasty | 9 | 1373 | Risk Ratio (M‐H, Fixed, 95% CI) | 0.86 [0.46, 1.58] |
| 15.2 Fixation versus total hip replacement | 4 | 315 | Risk Ratio (M‐H, Fixed, 95% CI) | 0.43 [0.13, 1.50] |
| 15.3 Internal fixation versus replacement arthroplasty (various) | 1 | 298 | Risk Ratio (M‐H, Fixed, 95% CI) | 1.53 [0.50, 4.62] |
| 16 Deep wound infection Show forest plot | 15 | 2825 | Risk Ratio (M‐H, Fixed, 95% CI) | 0.53 [0.30, 0.93] |
| 16.1 Fixation versus hemiarthroplasty | 10 | 1592 | Risk Ratio (M‐H, Fixed, 95% CI) | 0.47 [0.24, 0.91] |
| 16.2 Fixation versus total hip replacement | 2 | 248 | Risk Ratio (M‐H, Fixed, 95% CI) | 2.62 [0.11, 63.28] |
| 16.3 Internal fixation versus replacement arthroplasty (various) | 3 | 985 | Risk Ratio (M‐H, Fixed, 95% CI) | 0.59 [0.17, 2.07] |
| 17 Pneumonia Show forest plot | 5 | 1003 | Risk Ratio (M‐H, Fixed, 95% CI) | 0.84 [0.51, 1.40] |
| 17.1 Fixation versus hemiarthroplasty | 4 | 857 | Risk Ratio (M‐H, Fixed, 95% CI) | 0.95 [0.56, 1.61] |
| 17.2 Fixation versus total hip replacement | 1 | 146 | Risk Ratio (M‐H, Fixed, 95% CI) | 0.12 [0.01, 2.37] |
| 18 Deep vein thrombosis Show forest plot | 9 | 1558 | Risk Ratio (M‐H, Fixed, 95% CI) | 0.99 [0.50, 1.96] |
| 18.1 Fixation versus hemiarthroplasty | 4 | 945 | Risk Ratio (M‐H, Fixed, 95% CI) | 1.41 [0.50, 3.96] |
| 18.2 Fixation versus total hip replacement | 4 | 315 | Risk Ratio (M‐H, Fixed, 95% CI) | 0.35 [0.08, 1.52] |
| 18.3 Internal fixation versus replacement arthroplasty (various) | 1 | 298 | Risk Ratio (M‐H, Fixed, 95% CI) | 1.53 [0.39, 5.98] |
| 19 Pulmonary embolism Show forest plot | 9 | 1558 | Risk Ratio (M‐H, Fixed, 95% CI) | 1.30 [0.59, 2.86] |
| 19.1 Fixation versus hemiarthroplasty | 4 | 945 | Risk Ratio (M‐H, Fixed, 95% CI) | 1.89 [0.58, 6.15] |
| 19.2 Fixation versus total hip replacement | 4 | 315 | Risk Ratio (M‐H, Fixed, 95% CI) | 1.92 [0.37, 10.12] |
| 19.3 Internal fixation versus replacement arthroplasty (various) | 1 | 298 | Risk Ratio (M‐H, Fixed, 95% CI) | 0.51 [0.10, 2.48] |
| 20 Thromboembolic complications combined Show forest plot | 13 | 2174 | Risk Ratio (M‐H, Fixed, 95% CI) | 1.13 [0.70, 1.83] |
| 20.1 Fixation versus hemiarthroplasty | 7 | 1152 | Risk Ratio (M‐H, Fixed, 95% CI) | 1.34 [0.67, 2.68] |
| 20.2 Fixation versus total hip replacement | 4 | 315 | Risk Ratio (M‐H, Fixed, 95% CI) | 0.67 [0.22, 2.06] |
| 20.3 Internal fixation versus replacement arthroplasty (various) | 2 | 707 | Risk Ratio (M‐H, Fixed, 95% CI) | 1.19 [0.52, 2.72] |
| 21 Congestive cardiac failure/heart failure Show forest plot | 4 | 1057 | Risk Ratio (M‐H, Fixed, 95% CI) | 0.88 [0.45, 1.70] |
| 21.1 Fixation versus hemiarthroplasty | 1 | 455 | Risk Ratio (M‐H, Fixed, 95% CI) | 1.01 [0.33, 3.09] |
| 21.2 Fixation versus total hip replacement | 2 | 193 | Risk Ratio (M‐H, Fixed, 95% CI) | 0.91 [0.16, 5.04] |
| 21.3 Internal fixation versus replacement arthroplasty (various) | 1 | 409 | Risk Ratio (M‐H, Fixed, 95% CI) | 0.79 [0.31, 2.00] |
| 22 Myocardial infarction Show forest plot | 6 | 1068 | Risk Ratio (M‐H, Fixed, 95% CI) | 0.58 [0.22, 1.51] |
| 22.1 Fixation versus hemiarthroplasty | 1 | 455 | Risk Ratio (M‐H, Fixed, 95% CI) | 5.07 [0.24, 104.94] |
| 22.2 Fixation versus total hip replacement | 4 | 315 | Risk Ratio (M‐H, Fixed, 95% CI) | 0.47 [0.12, 1.82] |
| 22.3 Internal fixation versus replacement arthroplasty (various) | 1 | 298 | Risk Ratio (M‐H, Fixed, 95% CI) | 0.25 [0.03, 2.08] |
| 23 Stroke (cerebrovascular accident) Show forest plot | 9 | 1645 | Risk Ratio (M‐H, Fixed, 95% CI) | 0.85 [0.43, 1.69] |
| 23.1 Fixation versus hemiarthroplasty | 4 | 725 | Risk Ratio (M‐H, Fixed, 95% CI) | 0.84 [0.23, 3.09] |
| 23.2 Fixation versus total hip replacement | 3 | 213 | Risk Ratio (M‐H, Fixed, 95% CI) | 0.94 [0.20, 4.50] |
| 23.3 Internal fixation versus replacement arthroplasty (various) | 2 | 707 | Risk Ratio (M‐H, Fixed, 95% CI) | 0.83 [0.32, 2.11] |
| 24 Confusional state Show forest plot | 2 | Risk Ratio (M‐H, Fixed, 95% CI) | Subtotals only | |
| 24.1 Fixation versus hemiarthroplasty | 2 | 675 | Risk Ratio (M‐H, Fixed, 95% CI) | 0.88 [0.55, 1.39] |
| 25 Gastrointestinal complications Show forest plot | 3 | 703 | Risk Ratio (M‐H, Fixed, 95% CI) | 0.54 [0.23, 1.30] |
| 25.1 Hemiarthroplasty | 2 | 557 | Risk Ratio (M‐H, Fixed, 95% CI) | 0.78 [0.28, 2.13] |
| 25.2 Total hip replacement | 1 | 146 | Risk Ratio (M‐H, Fixed, 95% CI) | 0.17 [0.02, 1.46] |
| 26 Pressure sores Show forest plot | 7 | 1380 | Risk Ratio (M‐H, Fixed, 95% CI) | 1.11 [0.55, 2.23] |
| 26.1 Fixation versus hemiarthroplasty | 4 | 819 | Risk Ratio (M‐H, Fixed, 95% CI) | 1.12 [0.47, 2.66] |
| 26.2 Fixation versus total hip replacement | 2 | 152 | Risk Ratio (M‐H, Fixed, 95% CI) | 1.45 [0.25, 8.31] |
| 26.3 Internal fixation versus replacement arthroplasty (various) | 1 | 409 | Risk Ratio (M‐H, Fixed, 95% CI) | 0.88 [0.18, 4.33] |
| 27 Total medical complications (as defined in each study) Show forest plot | 13 | 2173 | Risk Ratio (M‐H, Random, 95% CI) | 0.73 [0.58, 0.92] |
| 27.1 Fixation versus hemiarthroplasty | 7 | 1151 | Risk Ratio (M‐H, Random, 95% CI) | 0.72 [0.51, 1.02] |
| 27.2 Fixation versus total hip replacement | 4 | 315 | Risk Ratio (M‐H, Random, 95% CI) | 0.62 [0.36, 1.06] |
| 27.3 Internal fixation versus replacement arthroplasty (various) | 2 | 707 | Risk Ratio (M‐H, Random, 95% CI) | 0.79 [0.51, 1.22] |
| 28 Length of hospital stay (in days) Show forest plot | 5 | Mean Difference (IV, Random, 95% CI) | Subtotals only | |
| 28.1 Fixation versus hemiarthroplasty | 4 | 821 | Mean Difference (IV, Random, 95% CI) | 1.12 [‐3.07, 5.31] |
| 28.2 Fixation versus total hip replacement | 1 | 75 | Mean Difference (IV, Random, 95% CI) | 4.70 [2.51, 6.89] |
| 28.3 Internal fixation versus replacement arthroplasty (various) | 1 | 298 | Mean Difference (IV, Random, 95% CI) | ‐0.68 [‐2.43, 1.07] |
| 29 Mortality 30 days Show forest plot | 4 | 780 | Risk Ratio (M‐H, Fixed, 95% CI) | 0.76 [0.46, 1.24] |
| 29.1 Fixation versus hemiarthroplasty | 4 | 780 | Risk Ratio (M‐H, Fixed, 95% CI) | 0.76 [0.46, 1.24] |
| 30 Mortality up to 3 to 6 months Show forest plot | 15 | 2320 | Risk Ratio (M‐H, Fixed, 95% CI) | 0.87 [0.70, 1.08] |
| 30.1 Fixation versus hemiarthroplasty | 10 | 1345 | Risk Ratio (M‐H, Fixed, 95% CI) | 0.84 [0.66, 1.07] |
| 30.2 Fixation versus total hip replacement | 3 | 268 | Risk Ratio (M‐H, Fixed, 95% CI) | 2.52 [0.89, 7.14] |
| 30.3 Internal fixation versus replacement arthroplasty (various) | 2 | 707 | Risk Ratio (M‐H, Fixed, 95% CI) | 0.66 [0.34, 1.27] |
| 31 Mortality up to 12 months Show forest plot | 14 | 2317 | Risk Ratio (M‐H, Fixed, 95% CI) | 0.95 [0.81, 1.11] |
| 31.1 Fixation versus hemiarthroplasty | 8 | 1213 | Risk Ratio (M‐H, Fixed, 95% CI) | 0.94 [0.78, 1.13] |
| 31.2 Fixation versus total hip replacement | 3 | 268 | Risk Ratio (M‐H, Fixed, 95% CI) | 1.18 [0.68, 2.05] |
| 31.3 Internal fixation versus replacement arthroplasty (various) | 3 | 836 | Risk Ratio (M‐H, Fixed, 95% CI) | 0.89 [0.61, 1.30] |
| 32 Mortality up to 24 to 48 months Show forest plot | 15 | 2335 | Risk Ratio (M‐H, Fixed, 95% CI) | 0.97 [0.87, 1.09] |
| 32.1 Fixation versus hemiarthroplasty | 9 | 1204 | Risk Ratio (M‐H, Fixed, 95% CI) | 0.96 [0.84, 1.10] |
| 32.2 Fixation versus total hip replacement | 3 | 295 | Risk Ratio (M‐H, Fixed, 95% CI) | 1.04 [0.71, 1.53] |
| 32.3 Internal fixation versus replacement arthroplasty (various) | 3 | 836 | Risk Ratio (M‐H, Fixed, 95% CI) | 0.98 [0.74, 1.29] |
| 33 Mortality 10 years Show forest plot | 2 | 864 | Risk Ratio (M‐H, Fixed, 95% CI) | 0.98 [0.92, 1.05] |
| 33.1 Fixation versus hemiarthroplasty | 1 | 455 | Risk Ratio (M‐H, Fixed, 95% CI) | 0.96 [0.90, 1.03] |
| 33.2 Internal fixation versus replacement arthroplasty (various) | 1 | 409 | Risk Ratio (M‐H, Fixed, 95% CI) | 1.01 [0.90, 1.13] |
| 34 Residual pain at 1 year Show forest plot | 5 | 750 | Risk Ratio (M‐H, Random, 95% CI) | 1.24 [0.79, 1.94] |
| 34.1 Fixation versus hemiarthroplasty | 2 | 366 | Risk Ratio (M‐H, Random, 95% CI) | 0.81 [0.62, 1.05] |
| 34.2 Fixation versus total hip replacement | 2 | 128 | Risk Ratio (M‐H, Random, 95% CI) | 3.08 [0.90, 10.56] |
| 34.3 Internal fixation versus replacement arthroplasty (various) | 1 | 256 | Risk Ratio (M‐H, Random, 95% CI) | 1.3 [1.05, 1.61] |
| 35 Residual pain at 1 year (subgrouped by cemented versus uncemented) Show forest plot | 5 | 750 | Risk Ratio (M‐H, Random, 95% CI) | 1.24 [0.79, 1.94] |
| 35.1 Fixation versus cemented (hemi)arthroplasty | 3 | 384 | Risk Ratio (M‐H, Random, 95% CI) | 1.96 [0.91, 4.23] |
| 35.2 Fixation versus uncemented (hemi)arthroplasty | 2 | 366 | Risk Ratio (M‐H, Random, 95% CI) | 0.81 [0.62, 1.05] |
| 36 Mean pain score at 1 to 2 years Show forest plot | 3 | 521 | Std. Mean Difference (IV, Random, 95% CI) | ‐0.21 [‐0.68, 0.26] |
| 36.1 Internal fixation versus hemiarthroplasty | 2 | 437 | Std. Mean Difference (IV, Random, 95% CI) | ‐0.02 [‐0.43, 0.39] |
| 36.2 Internal fixation versus replacement arthroplasty (various types) | 1 | 84 | Std. Mean Difference (IV, Random, 95% CI) | ‐0.62 [‐1.06, ‐0.19] |
| 37 Mean pain score at 1 to 2 years (subgrouped by cemented versus uncemented) Show forest plot | 3 | 521 | Std. Mean Difference (IV, Random, 95% CI) | ‐0.21 [‐0.68, 0.26] |
| 37.1 Internal fixation versus cemented (hemi)arthroplasty | 2 | 197 | Std. Mean Difference (IV, Random, 95% CI) | ‐0.42 [‐0.78, ‐0.07] |
| 37.2 Internal fixation versus uncemented (hemi)arthroplasty | 1 | 324 | Std. Mean Difference (IV, Random, 95% CI) | 0.17 [‐0.05, 0.38] |
| 38 Pain at 2 to 3 years Show forest plot | 2 | 322 | Risk Ratio (M‐H, Random, 95% CI) | 3.49 [0.11, 115.59] |
| 38.1 Fixation versus total hip replacement | 2 | 322 | Risk Ratio (M‐H, Random, 95% CI) | 3.49 [0.11, 115.59] |
| 39 Failure to return to same residence at final follow‐up Show forest plot | 2 | 372 | Risk Ratio (M‐H, Fixed, 95% CI) | 0.84 [0.54, 1.33] |
| 39.1 Fixation versus hemiarthroplasty | 2 | 372 | Risk Ratio (M‐H, Fixed, 95% CI) | 0.84 [0.54, 1.33] |
| 40 Failure to regain mobility Show forest plot | 6 | 593 | Risk Ratio (M‐H, Random, 95% CI) | 1.02 [0.74, 1.39] |
| 40.1 Fixation versus hemiarthroplasty | 6 | 593 | Risk Ratio (M‐H, Random, 95% CI) | 1.02 [0.74, 1.39] |
| 41 Harris hip score (at 1 year) Show forest plot | 2 | Mean Difference (IV, Fixed, 95% CI) | Subtotals only | |
| 41.1 Fixation versus hemiarthroplasty | 2 | 223 | Mean Difference (IV, Fixed, 95% CI) | ‐6.61 [‐9.73, ‐3.49] |
| 41.2 Fixation versus total hip replacement | 1 | 65 | Mean Difference (IV, Fixed, 95% CI) | ‐10.30 [‐12.78, ‐7.82] |
| 42 Hip rating questionnaire at 1 year Show forest plot | 1 | Mean Difference (IV, Fixed, 95% CI) | Totals not selected | |
| 42.1 Fixation versus hemiarthroplasty | 1 | Mean Difference (IV, Fixed, 95% CI) | 0.0 [0.0, 0.0] | |
| 42.2 Fixation versus total hip replacement | 1 | Mean Difference (IV, Fixed, 95% CI) | 0.0 [0.0, 0.0] | |
| 43 Hip scores (at 1 year) Show forest plot | 3 | Std. Mean Difference (IV, Fixed, 95% CI) | Subtotals only | |
| 43.1 Fixation versus hemiarthroplasty | 3 | 374 | Std. Mean Difference (IV, Fixed, 95% CI) | ‐0.38 [‐0.58, ‐0.17] |
| 43.2 Fixation versus total hip replacement | 2 | 168 | Std. Mean Difference (IV, Fixed, 95% CI) | ‐0.77 [‐1.10, ‐0.45] |
| 44 Mean Eq‐5d score (at 1 year) Show forest plot | 2 | Mean Difference (IV, Fixed, 95% CI) | Subtotals only | |
| 44.1 Fixation versus hemiarthroplasty | 2 | 341 | Mean Difference (IV, Fixed, 95% CI) | ‐0.07 [‐0.14, ‐0.00] |
| 44.2 Fixation versus total hip replacement | 1 | 130 | Mean Difference (IV, Fixed, 95% CI) | ‐0.12 [‐0.33, 0.09] |
| 45 Barthel index score of below 95 at 1 year Show forest plot | 1 | Risk Ratio (M‐H, Fixed, 95% CI) | Totals not selected | |
| 45.1 Fixation versus hemiarthroplasty | 1 | Risk Ratio (M‐H, Fixed, 95% CI) | 0.0 [0.0, 0.0] | |
| Outcome or subgroup title | No. of studies | No. of participants | Statistical method | Effect size |
| 1 Length of surgery (in minutes) Show forest plot | 6 | Mean Difference (IV, Random, 95% CI) | Totals not selected | |
| 1.1 Screws versus Thompson | 2 | Mean Difference (IV, Random, 95% CI) | 0.0 [0.0, 0.0] | |
| 1.2 Screws versus Moore | 2 | Mean Difference (IV, Random, 95% CI) | 0.0 [0.0, 0.0] | |
| 1.3 Screws or SHS versus bipolar hemiarthroplasty | 2 | Mean Difference (IV, Random, 95% CI) | 0.0 [0.0, 0.0] | |
| 2 Operative blood loss (in millilitres) Show forest plot | 5 | Mean Difference (IV, Random, 95% CI) | Totals not selected | |
| 2.1 Screws versus Thompson | 2 | Mean Difference (IV, Random, 95% CI) | 0.0 [0.0, 0.0] | |
| 2.2 Screws versus Moore | 2 | Mean Difference (IV, Random, 95% CI) | 0.0 [0.0, 0.0] | |
| 2.3 Screws or SHS versus bipolar hemiarthroplasty | 1 | Mean Difference (IV, Random, 95% CI) | 0.0 [0.0, 0.0] | |
| 3 Number of patients transfused Show forest plot | 5 | 1060 | Risk Ratio (M‐H, Fixed, 95% CI) | 0.39 [0.29, 0.53] |
| 3.1 Screws versus Moore | 2 | 507 | Risk Ratio (M‐H, Fixed, 95% CI) | 0.12 [0.06, 0.26] |
| 3.2 Screws v Christiansen bipolar | 1 | 104 | Risk Ratio (M‐H, Fixed, 95% CI) | 0.03 [0.00, 0.45] |
| 3.3 Screws or SHS versus bipolar hemiarthroplasty | 2 | 449 | Risk Ratio (M‐H, Fixed, 95% CI) | 0.80 [0.56, 1.14] |
| 4 Re‐operations minor ( eg fixation‐ removal of metalwork, dislocation of hemiarthroplasty) Show forest plot | 12 | Risk Ratio (M‐H, Random, 95% CI) | Subtotals only | |
| 4.1 Screws versus Thompson | 2 | 91 | Risk Ratio (M‐H, Random, 95% CI) | 0.31 [0.01, 7.15] |
| 4.2 Screws versus Moore | 3 | 617 | Risk Ratio (M‐H, Random, 95% CI) | 5.39 [0.23, 126.75] |
| 4.3 SHS versus Moore | 1 | 182 | Risk Ratio (M‐H, Random, 95% CI) | 0.04 [0.00, 0.67] |
| 4.4 SHS versus Stanmore bipolar | 1 | 43 | Risk Ratio (M‐H, Random, 95% CI) | 0.0 [0.0, 0.0] |
| 4.5 Screws, SHS or nail & plate versus Christiansen bipolar | 2 | 273 | Risk Ratio (M‐H, Random, 95% CI) | 1.15 [0.04, 31.12] |
| 4.6 SHS versus Thompson or Monk bipolar | 1 | 280 | Risk Ratio (M‐H, Random, 95% CI) | 4.02 [0.75, 21.56] |
| 4.7 2 von Bahr screws versus Variokopf bipolar hemiarthroplasty | 1 | 100 | Risk Ratio (M‐H, Random, 95% CI) | 1.06 [0.35, 3.26] |
| 4.8 2 Olmed screws versus bipolar hemiarthroplasty | 1 | 219 | Risk Ratio (M‐H, Random, 95% CI) | 2.80 [1.31, 5.98] |
| 5 Re‐operations moderate (eg fixation to hemiarthroplasty or total hip replacement, drainage, girdlestone) Show forest plot | 12 | Risk Ratio (M‐H, Random, 95% CI) | Subtotals only | |
| 5.1 Screws versus Thompson | 2 | 91 | Risk Ratio (M‐H, Random, 95% CI) | 6.12 [1.13, 33.22] |
| 5.2 Screws versus Moore | 3 | 617 | Risk Ratio (M‐H, Random, 95% CI) | 8.15 [2.46, 26.98] |
| 5.3 SHS versus Moore | 1 | 182 | Risk Ratio (M‐H, Random, 95% CI) | 10.00 [3.16, 31.60] |
| 5.4 SHS versus Stanmore bipolar | 1 | 43 | Risk Ratio (M‐H, Random, 95% CI) | 3.14 [0.71, 13.87] |
| 5.5 Screws, SHS or nail & plate versus Christiansen bipolar | 2 | 273 | Risk Ratio (M‐H, Random, 95% CI) | 3.72 [1.28, 10.76] |
| 5.6 SHS versus Thompson or Monk bipolar | 1 | 280 | Risk Ratio (M‐H, Random, 95% CI) | 17.43 [5.41, 56.09] |
| 5.7 2 von Bahr screws versus Variokopf bipolar hemiarthroplasty | 1 | 100 | Risk Ratio (M‐H, Random, 95% CI) | 7.39 [2.38, 22.91] |
| 5.8 2 Olmed screws versus bipolar hemiarthroplasty | 1 | 219 | Risk Ratio (M‐H, Random, 95% CI) | 8.37 [3.45, 20.32] |
| 6 Re‐operations major (eg revision hemiarthroplasty or conversion to total hip replacement) Show forest plot | 12 | Risk Ratio (M‐H, Fixed, 95% CI) | Subtotals only | |
| 6.1 Screws versus Thompson | 2 | 91 | Risk Ratio (M‐H, Fixed, 95% CI) | 0.0 [0.0, 0.0] |
| 6.2 Screws versus Moore | 3 | 617 | Risk Ratio (M‐H, Fixed, 95% CI) | 0.71 [0.32, 1.60] |
| 6.3 SHS versus Moore | 1 | 182 | Risk Ratio (M‐H, Fixed, 95% CI) | 0.03 [0.00, 0.42] |
| 6.4 SHS versus Stanmore bipolar | 1 | 43 | Risk Ratio (M‐H, Fixed, 95% CI) | 0.10 [0.01, 1.62] |
| 6.5 Screws, SHS or nail & plate versus Christiansen bipolar | 2 | 273 | Risk Ratio (M‐H, Fixed, 95% CI) | 0.08 [0.01, 0.52] |
| 6.6 SHS versus Thompson or Monk bipolar | 1 | 280 | Risk Ratio (M‐H, Fixed, 95% CI) | 0.67 [0.07, 6.36] |
| 6.7 2 von Bahr screws versus Variokopf bipolar hemiarthroplasty | 1 | 100 | Risk Ratio (M‐H, Fixed, 95% CI) | 0.30 [0.01, 7.10] |
| 6.8 2 Olmed screws versus bipolar hemiarthroplasty | 1 | 219 | Risk Ratio (M‐H, Fixed, 95% CI) | 8.76 [0.48, 160.76] |
| 7 Total re‐operation rate (within follow‐up period of study) Show forest plot | 14 | Risk Ratio (M‐H, Fixed, 95% CI) | Subtotals only | |
| 7.1 Screws versus Thompson | 2 | 91 | Risk Ratio (M‐H, Fixed, 95% CI) | 5.15 [1.22, 21.68] |
| 7.2 Screws versus Moore | 3 | 617 | Risk Ratio (M‐H, Fixed, 95% CI) | 5.82 [3.85, 8.79] |
| 7.3 SHS versus Moore | 1 | 182 | Risk Ratio (M‐H, Fixed, 95% CI) | 1.36 [0.85, 2.18] |
| 7.4 SHS versus Stanmore bipolar | 1 | 43 | Risk Ratio (M‐H, Fixed, 95% CI) | 0.90 [0.36, 2.23] |
| 7.5 Screws, SHS or nail & plate versus Christiansen bipolar | 2 | 273 | Risk Ratio (M‐H, Fixed, 95% CI) | 1.33 [0.72, 2.47] |
| 7.6 SHS versus Thompson or Monk bipolar | 1 | 280 | Risk Ratio (M‐H, Fixed, 95% CI) | 7.04 [3.34, 14.83] |
| 7.7 SHS versus hemiarthroplasty (unknown type) | 1 | 86 | Risk Ratio (M‐H, Fixed, 95% CI) | 2.4 [0.92, 6.23] |
| 7.8 Screws or SHS versus bipolar hemiarthroplasty | 1 | 229 | Risk Ratio (M‐H, Fixed, 95% CI) | 7.21 [3.21, 16.22] |
| 7.9 2 von Bahr screws versus Variokopf bipolar hemiarthroplasty | 1 | 100 | Risk Ratio (M‐H, Fixed, 95% CI) | 3.93 [1.91, 8.07] |
| 7.10 2 Olmed screws versus bipolar hemiarthroplasty | 1 | 219 | Risk Ratio (M‐H, Fixed, 95% CI) | 4.16 [2.28, 7.58] |
| 8 Superficial wound infection Show forest plot | 9 | 1502 | Risk Ratio (M‐H, Fixed, 95% CI) | 0.87 [0.50, 1.53] |
| 8.1 Screws versus Thompson | 1 | 60 | Risk Ratio (M‐H, Fixed, 95% CI) | 0.09 [0.00, 1.48] |
| 8.2 Screws versus Moore | 3 | 617 | Risk Ratio (M‐H, Fixed, 95% CI) | 1.45 [0.56, 3.77] |
| 8.3 SHS versus Stanmore bipolar | 1 | 43 | Risk Ratio (M‐H, Fixed, 95% CI) | 0.21 [0.01, 4.11] |
| 8.4 Screws, SHS or nail & plate versus Christiansen bipolar | 2 | 273 | Risk Ratio (M‐H, Fixed, 95% CI) | 0.49 [0.11, 2.13] |
| 8.5 SHS versus Thompson or Monk bipolar | 1 | 280 | Risk Ratio (M‐H, Fixed, 95% CI) | 6.0 [0.25, 145.88] |
| 8.6 Screws or SHS versus bipolar hemiarthroplasty | 1 | 229 | Risk Ratio (M‐H, Fixed, 95% CI) | 1.41 [0.41, 4.87] |
| 9 Deep wound infection Show forest plot | 11 | Risk Ratio (M‐H, Fixed, 95% CI) | Subtotals only | |
| 9.1 Screws versus Thompson | 1 | 60 | Risk Ratio (M‐H, Fixed, 95% CI) | 0.0 [0.0, 0.0] |
| 9.2 Screws versus Moore | 3 | 617 | Risk Ratio (M‐H, Fixed, 95% CI) | 0.17 [0.04, 0.75] |
| 9.3 SHS versus Moore | 1 | 198 | Risk Ratio (M‐H, Fixed, 95% CI) | 0.15 [0.01, 2.79] |
| 9.4 SHS versus Stanmore bipolar | 1 | 43 | Risk Ratio (M‐H, Fixed, 95% CI) | 0.0 [0.0, 0.0] |
| 9.5 Screws, SHS or nail & plate versus Christiansen bipolar | 2 | 273 | Risk Ratio (M‐H, Fixed, 95% CI) | 0.35 [0.08, 1.66] |
| 9.6 SHS versus Thompson or Monk bipolar | 1 | 280 | Risk Ratio (M‐H, Fixed, 95% CI) | 0.67 [0.03, 16.21] |
| 9.7 Screws or SHS versus bipolar hemiarthroplasty | 2 | 448 | Risk Ratio (M‐H, Fixed, 95% CI) | 1.23 [0.48, 3.11] |
| 10 Length of hospital stay (in days) Show forest plot | 5 | 1036 | Mean Difference (IV, Random, 95% CI) | 0.79 [‐2.13, 3.72] |
| 10.1 Screws versus Thompson | 1 | 60 | Mean Difference (IV, Random, 95% CI) | 4.5 [‐11.20, 20.20] |
| 10.2 Screws versus Moore | 1 | 455 | Mean Difference (IV, Random, 95% CI) | 0.30 [‐5.20, 5.80] |
| 10.3 Screws or SHS versus bipolar hemiarthroplasty | 2 | 449 | Mean Difference (IV, Random, 95% CI) | ‐0.80 [‐2.60, 1.00] |
| 10.4 SHS versus hemiarthroplasty (unknown type) | 1 | 72 | Mean Difference (IV, Random, 95% CI) | 3.90 [2.45, 5.35] |
| 11 Mortality at 30 days Show forest plot | 4 | 780 | Risk Ratio (M‐H, Fixed, 95% CI) | 0.76 [0.46, 1.24] |
| 11.1 SHS or screws versus bipolar hemiarthroplasty | 4 | 780 | Risk Ratio (M‐H, Fixed, 95% CI) | 0.76 [0.46, 1.24] |
| 12 Mortality up to 3 to 6 months Show forest plot | 10 | 1474 | Risk Ratio (M‐H, Fixed, 95% CI) | 0.81 [0.64, 1.03] |
| 12.1 Screws versus Thompson | 2 | 91 | Risk Ratio (M‐H, Fixed, 95% CI) | 1.02 [0.52, 2.00] |
| 12.2 Screws versus Moore | 3 | 617 | Risk Ratio (M‐H, Fixed, 95% CI) | 0.77 [0.56, 1.08] |
| 12.3 SHS versus Stanmore bipolar | 1 | 42 | Risk Ratio (M‐H, Fixed, 95% CI) | 0.25 [0.03, 2.05] |
| 12.4 Screws, SHS or nail & plate versus Christiansen bipolar | 2 | 273 | Risk Ratio (M‐H, Fixed, 95% CI) | 1.12 [0.61, 2.08] |
| 12.5 Screws or SHS versus bipolar hemiarthroplasty | 2 | 451 | Risk Ratio (M‐H, Fixed, 95% CI) | 0.71 [0.41, 1.23] |
| 13 Mortality up to 12 months Show forest plot | 10 | 1528 | Risk Ratio (M‐H, Fixed, 95% CI) | 0.93 [0.78, 1.11] |
| 13.1 Screws versus Thompson | 1 | 60 | Risk Ratio (M‐H, Fixed, 95% CI) | 1.34 [0.85, 2.11] |
| 13.2 Screws versus Moore | 3 | 617 | Risk Ratio (M‐H, Fixed, 95% CI) | 0.94 [0.73, 1.21] |
| 13.3 SHS versus Stanmore bipolar | 1 | 41 | Risk Ratio (M‐H, Fixed, 95% CI) | 0.42 [0.09, 1.92] |
| 13.4 Screws, SHS or nail & plate versus Christiansen bipolar | 2 | 273 | Risk Ratio (M‐H, Fixed, 95% CI) | 0.96 [0.60, 1.54] |
| 13.5 Screws or SHS versus bipolar hemiarthroplasty | 2 | 451 | Risk Ratio (M‐H, Fixed, 95% CI) | 0.82 [0.55, 1.24] |
| 13.6 SHS versus hemiarthroplasty (unknown type) | 1 | 86 | Risk Ratio (M‐H, Fixed, 95% CI) | 0.83 [0.27, 2.53] |
| 14 Mortality 24 to 48 months Show forest plot | 11 | 1519 | Risk Ratio (M‐H, Fixed, 95% CI) | 0.95 [0.84, 1.08] |
| 14.1 Screws versus Thompson | 2 | 91 | Risk Ratio (M‐H, Fixed, 95% CI) | 1.16 [0.91, 1.49] |
| 14.2 Screws versus Moore | 3 | 580 | Risk Ratio (M‐H, Fixed, 95% CI) | 0.88 [0.73, 1.06] |
| 14.3 2 von Bahr screws versus Variokopf bipolar hemiarthroplasty | 1 | 100 | Risk Ratio (M‐H, Fixed, 95% CI) | 1.55 [0.48, 4.97] |
| 14.4 SHS versus Stanmore bipolar | 1 | 42 | Risk Ratio (M‐H, Fixed, 95% CI) | 0.83 [0.30, 2.31] |
| 14.5 SHS or nail & plate versus Christiansen bipolar | 1 | 169 | Risk Ratio (M‐H, Fixed, 95% CI) | 1.02 [0.67, 1.56] |
| 14.6 Screws or SHS versus bipolar hemiarthroplasty | 2 | 451 | Risk Ratio (M‐H, Fixed, 95% CI) | 0.97 [0.71, 1.32] |
| 14.7 SHS versus hemiarthroplasty (unknown type) | 1 | 86 | Risk Ratio (M‐H, Fixed, 95% CI) | 0.85 [0.43, 1.67] |
| 15 Mortality 10 years Show forest plot | 1 | 455 | Risk Ratio (M‐H, Fixed, 95% CI) | 0.96 [0.90, 1.03] |
| 15.1 Screws versus Moore | 1 | 455 | Risk Ratio (M‐H, Fixed, 95% CI) | 0.96 [0.90, 1.03] |
| 16 Pain at one year Show forest plot | 3 | 561 | Risk Ratio (M‐H, Fixed, 95% CI) | 0.98 [0.82, 1.18] |
| 16.1 Screws versus Thompson | 0 | 0 | Risk Ratio (M‐H, Fixed, 95% CI) | 0.0 [0.0, 0.0] |
| 16.2 Screws versus Moore | 2 | 366 | Risk Ratio (M‐H, Fixed, 95% CI) | 0.80 [0.62, 1.04] |
| 16.3 Screws or SHS versus bipolar hemiarthroplasty | 1 | 195 | Risk Ratio (M‐H, Fixed, 95% CI) | 1.26 [0.99, 1.61] |
| 17 Failure to return to same residence at final follow‐up Show forest plot | 2 | 372 | Risk Ratio (M‐H, Fixed, 95% CI) | 0.84 [0.54, 1.33] |
| 17.1 Screws versus Moore | 2 | 372 | Risk Ratio (M‐H, Fixed, 95% CI) | 0.84 [0.54, 1.33] |
| 18 Failure to regain mobility Show forest plot | 6 | 593 | Risk Ratio (M‐H, Fixed, 95% CI) | 0.99 [0.86, 1.15] |
| 18.1 Screws versus Thompson | 1 | 24 | Risk Ratio (M‐H, Fixed, 95% CI) | 1.87 [0.53, 6.57] |
| 18.2 Screws versus Moore | 3 | 419 | Risk Ratio (M‐H, Fixed, 95% CI) | 0.88 [0.75, 1.04] |
| 18.3 2 von Bahr screws versus Variokopf bipolar hemiarthroplasty | 1 | 84 | Risk Ratio (M‐H, Fixed, 95% CI) | 1.95 [1.15, 3.30] |
| 18.4 Screws v Christiansen bipolar | 1 | 66 | Risk Ratio (M‐H, Fixed, 95% CI) | 0.99 [0.69, 1.43] |
| Outcome or subgroup title | No. of studies | No. of participants | Statistical method | Effect size |
| 1 Length of surgery (in minutes) Show forest plot | 2 | Mean Difference (IV, Fixed, 95% CI) | Totals not selected | |
| 1.1 2 Olmed screws verus Exeter THR | 1 | Mean Difference (IV, Fixed, 95% CI) | 0.0 [0.0, 0.0] | |
| 1.2 Screws or SHS versus THR (various) | 1 | Mean Difference (IV, Fixed, 95% CI) | 0.0 [0.0, 0.0] | |
| 2 Operative blood loss (in millilitres) Show forest plot | 1 | Mean Difference (IV, Fixed, 95% CI) | Totals not selected | |
| 2.1 2 Olmed screws verus Exeter THR | 1 | Mean Difference (IV, Fixed, 95% CI) | 0.0 [0.0, 0.0] | |
| 3 Number of patients transfused Show forest plot | 2 | 240 | Risk Ratio (M‐H, Fixed, 95% CI) | 0.32 [0.20, 0.50] |
| 3.1 2 Olmed screws verus Exeter THR | 1 | 102 | Risk Ratio (M‐H, Fixed, 95% CI) | 0.07 [0.02, 0.22] |
| 3.2 Screws or SHS versus THR (various) | 1 | 138 | Risk Ratio (M‐H, Fixed, 95% CI) | 0.74 [0.43, 1.26] |
| 4 Re‐operations minor (Fixation removal of metalwork, dislocation of THR) Show forest plot | 5 | Risk Ratio (M‐H, Fixed, 95% CI) | Subtotals only | |
| 4.1 Hansson pin versus Charnley | 1 | 47 | Risk Ratio (M‐H, Fixed, 95% CI) | 0.19 [0.01, 3.80] |
| 4.2 2 Olmed screws versus Lubinus or BiMetric | 2 | 166 | Risk Ratio (M‐H, Fixed, 95% CI) | 0.52 [0.23, 1.14] |
| 4.3 2 Olmed screws verus Exeter THR | 1 | 102 | Risk Ratio (M‐H, Fixed, 95% CI) | 9.25 [1.23, 69.60] |
| 4.4 SHS versus Howse II | 1 | 180 | Risk Ratio (M‐H, Fixed, 95% CI) | 0.03 [0.00, 0.43] |
| 5 Re‐operations moderate (Fixation to hemiarthroplasty or THR, drainage, girdlestone) Show forest plot | 5 | Risk Ratio (M‐H, Fixed, 95% CI) | Subtotals only | |
| 5.1 Hansson pin versus Charnley | 1 | 47 | Risk Ratio (M‐H, Fixed, 95% CI) | 14.4 [0.87, 238.56] |
| 5.2 2 Olmed screws versus Lubinus or BiMetric | 2 | 166 | Risk Ratio (M‐H, Fixed, 95% CI) | 27.16 [3.66, 201.50] |
| 5.3 2 Olmed screws verus Exeter THR | 1 | 102 | Risk Ratio (M‐H, Fixed, 95% CI) | 34.26 [2.12, 553.64] |
| 5.4 SHS versus Howse II | 1 | 180 | Risk Ratio (M‐H, Fixed, 95% CI) | 59.67 [3.70, 961.20] |
| 6 Re‐operations major (revision THR) Show forest plot | 5 | Risk Ratio (M‐H, Fixed, 95% CI) | Subtotals only | |
| 6.1 Hannson pin versus Charnley | 1 | 47 | Risk Ratio (M‐H, Fixed, 95% CI) | 0.32 [0.01, 7.48] |
| 6.2 2 Olmed screws versus Lubinus or BiMetric | 2 | 166 | Risk Ratio (M‐H, Fixed, 95% CI) | 0.0 [0.0, 0.0] |
| 6.3 2 Olmed screws verus Exeter THR | 1 | 102 | Risk Ratio (M‐H, Fixed, 95% CI) | 0.19 [0.01, 3.76] |
| 6.4 SHS versus Howse II | 1 | 180 | Risk Ratio (M‐H, Fixed, 95% CI) | 0.08 [0.00, 1.32] |
| 7 Total re‐operation rate (within follow‐up period of study) Show forest plot | 7 | Risk Ratio (M‐H, Fixed, 95% CI) | Subtotals only | |
| 7.1 Hansson pin versus Charnley | 1 | 47 | Risk Ratio (M‐H, Fixed, 95% CI) | 3.35 [0.78, 14.50] |
| 7.2 2 Olmed screws versus Lubinus or Bimetric | 2 | 166 | Risk Ratio (M‐H, Fixed, 95% CI) | 2.32 [1.36, 3.94] |
| 7.3 2 Olmed screws verus Exeter THR | 1 | 102 | Risk Ratio (M‐H, Fixed, 95% CI) | 11.56 [2.89, 46.25] |
| 7.4 SHS versus Howse II | 1 | 180 | Risk Ratio (M‐H, Fixed, 95% CI) | 1.47 [0.90, 2.38] |
| 7.5 Screws or SHS versus THR (various) | 1 | 138 | Risk Ratio (M‐H, Fixed, 95% CI) | 4.5 [1.98, 10.21] |
| 7.6 SHS versus THR (unknown type) | 1 | 86 | Risk Ratio (M‐H, Fixed, 95% CI) | 12.0 [1.63, 88.29] |
| 8 Superficial wound infection Show forest plot | 4 | 315 | Risk Ratio (M‐H, Fixed, 95% CI) | 0.43 [0.13, 1.50] |
| 8.1 Hansson pin versus Charnley | 1 | 47 | Risk Ratio (M‐H, Fixed, 95% CI) | 0.32 [0.01, 7.48] |
| 8.2 2 Olmed screws versus Lubinus or BiMetric | 2 | 166 | Risk Ratio (M‐H, Fixed, 95% CI) | 0.66 [0.14, 3.15] |
| 8.3 2 Olmed screws verus Exeter THR | 1 | 102 | Risk Ratio (M‐H, Fixed, 95% CI) | 0.19 [0.01, 3.76] |
| 9 Deep wound infection Show forest plot | 3 | Risk Ratio (M‐H, Fixed, 95% CI) | Subtotals only | |
| 9.1 SHS versus Howse II | 1 | 178 | Risk Ratio (M‐H, Fixed, 95% CI) | 0.16 [0.01, 3.36] |
| 9.2 2 Olmed screws versus Lubinus or BiMetric | 1 | 146 | Risk Ratio (M‐H, Fixed, 95% CI) | 2.62 [0.11, 63.28] |
| 9.3 2 Olmed screws verus Exeter THR | 1 | 102 | Risk Ratio (M‐H, Fixed, 95% CI) | 0.0 [0.0, 0.0] |
| 10 Hospital stay (days) Show forest plot | 2 | Mean Difference (IV, Fixed, 95% CI) | Totals not selected | |
| 10.1 Screws or SHS versus THR (various) | 1 | Mean Difference (IV, Fixed, 95% CI) | 0.0 [0.0, 0.0] | |
| 10.2 SHS versus THR (unknown type) | 1 | Mean Difference (IV, Fixed, 95% CI) | 0.0 [0.0, 0.0] | |
| 11 Mortality up to 2 to 4 months Show forest plot | 4 | 406 | Risk Ratio (M‐H, Fixed, 95% CI) | 2.21 [0.91, 5.40] |
| 11.1 2 Olmed screws versus Lubinus or BiMetric | 2 | 166 | Risk Ratio (M‐H, Fixed, 95% CI) | 2.03 [0.65, 6.29] |
| 11.2 2 Olmed screws verus Exeter THR | 1 | 102 | Risk Ratio (M‐H, Fixed, 95% CI) | 6.48 [0.34, 122.37] |
| 11.3 Screws or SHS versus THR (various) | 1 | 138 | Risk Ratio (M‐H, Fixed, 95% CI) | 1.5 [0.26, 8.70] |
| 12 Mortality at 12 to 18 months Show forest plot | 4 | 390 | Risk Ratio (M‐H, Fixed, 95% CI) | 1.03 [0.64, 1.64] |
| 12.1 2 Olmed screws versus Lubinus or BiMetric | 2 | 166 | Risk Ratio (M‐H, Fixed, 95% CI) | 0.99 [0.55, 1.76] |
| 12.2 Screws or SHS versus THR (various) | 1 | 138 | Risk Ratio (M‐H, Fixed, 95% CI) | 1.5 [0.44, 5.08] |
| 12.3 SHS versus THR (unknown type) | 1 | 86 | Risk Ratio (M‐H, Fixed, 95% CI) | 0.83 [0.27, 2.53] |
| 13 Mortality at 24 months Show forest plot | 4 | 433 | Risk Ratio (M‐H, Fixed, 95% CI) | 1.18 [0.79, 1.75] |
| 13.1 Hansson pin versus Charnley | 1 | 47 | Risk Ratio (M‐H, Fixed, 95% CI) | 0.64 [0.12, 3.48] |
| 13.2 2 Olmed screws versus Lubinus or BiMetric | 1 | 146 | Risk Ratio (M‐H, Fixed, 95% CI) | 1.00 [0.61, 1.66] |
| 13.3 2 Olmed screws verus Exeter THR | 1 | 102 | Risk Ratio (M‐H, Fixed, 95% CI) | 1.85 [0.68, 5.03] |
| 13.4 Screws or SHS versus THR (various) | 1 | 138 | Risk Ratio (M‐H, Fixed, 95% CI) | 1.5 [0.56, 3.99] |
| 14 Mortality at 4 years Show forest plot | 1 | Risk Ratio (M‐H, Fixed, 95% CI) | Totals not selected | |
| 14.1 SHS versus THR (unknown type) | 1 | Risk Ratio (M‐H, Fixed, 95% CI) | 0.0 [0.0, 0.0] | |
| 15 Pain at 1 year Show forest plot | 2 | 157 | Risk Ratio (M‐H, Fixed, 95% CI) | 1.40 [1.02, 1.90] |
| 15.1 Hansson pin versus Charnley | 1 | 35 | Risk Ratio (M‐H, Fixed, 95% CI) | 1.91 [0.80, 4.55] |
| 15.2 Screws or SHS versus THR (various) | 1 | 122 | Risk Ratio (M‐H, Fixed, 95% CI) | 1.31 [0.94, 1.82] |