Scolaris Content Display Scolaris Content Display

Comparison 1 Shouldice vs other techniques, Outcome 1 Recurrence.
Figuras y tablas -
Analysis 1.1

Comparison 1 Shouldice vs other techniques, Outcome 1 Recurrence.

Comparison 1 Shouldice vs other techniques, Outcome 2 Lenght of postoperative stay (days).
Figuras y tablas -
Analysis 1.2

Comparison 1 Shouldice vs other techniques, Outcome 2 Lenght of postoperative stay (days).

Comparison 1 Shouldice vs other techniques, Outcome 3 Chronic pain.
Figuras y tablas -
Analysis 1.3

Comparison 1 Shouldice vs other techniques, Outcome 3 Chronic pain.

Comparison 1 Shouldice vs other techniques, Outcome 4 Wound Infection.
Figuras y tablas -
Analysis 1.4

Comparison 1 Shouldice vs other techniques, Outcome 4 Wound Infection.

Comparison 1 Shouldice vs other techniques, Outcome 5 Seroma.
Figuras y tablas -
Analysis 1.5

Comparison 1 Shouldice vs other techniques, Outcome 5 Seroma.

Comparison 1 Shouldice vs other techniques, Outcome 6 Testicular atrophy.
Figuras y tablas -
Analysis 1.6

Comparison 1 Shouldice vs other techniques, Outcome 6 Testicular atrophy.

Comparison 1 Shouldice vs other techniques, Outcome 7 Haematoma.
Figuras y tablas -
Analysis 1.7

Comparison 1 Shouldice vs other techniques, Outcome 7 Haematoma.

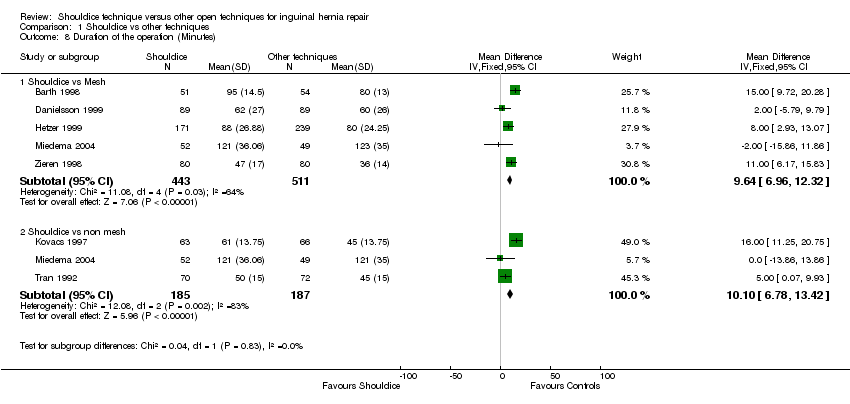
Comparison 1 Shouldice vs other techniques, Outcome 8 Duration of the operation (Minutes).
Figuras y tablas -
Analysis 1.8

Comparison 1 Shouldice vs other techniques, Outcome 8 Duration of the operation (Minutes).

Table 1. Assessment of methodological quality: Jadad Scale

Study

Randomization

Double‐blinding

Dropout/Withdrawls

TotalScore

Barth

1

0

0

1

Beets

2

2

0

4

Butters

2

1

1

3

Danielsson

1

0

1

2

Hay

2

1

0

3

Hetzer

0

0

1

1

Kingsnorth

2

1

0

3

Kovacs

0

1

1

2

Kux

0

1

1

2

McGillicuddy

0

0

1

1

Miedema

2

1

1

4

Nordin

1

2

0

3

Paul

1

1

0

2

Thapar

1

0

1

2

Tran

1

0

0

1

Zieren

1

1

1

3

Figuras y tablas -
Table 1. Assessment of methodological quality: Jadad Scale
Comparison 1. Shouldice vs other techniques

Outcome or subgroup title

No. of studies

No. of participants

Statistical method

Effect size

1 Recurrence Show forest plot

13

Peto Odds Ratio (Peto, Fixed, 95% CI)

Subtotals only

1.1 Shouldice vs mesh

6

1565

Peto Odds Ratio (Peto, Fixed, 95% CI)

3.80 [1.99, 7.26]

1.2 Shouldice vs non‐mesh

8

2865

Peto Odds Ratio (Peto, Fixed, 95% CI)

0.62 [0.45, 0.85]

2 Lenght of postoperative stay (days) Show forest plot

8

Mean Difference (IV, Random, 95% CI)

Subtotals only

2.1 Shouldice vs mesh

4

1045

Mean Difference (IV, Random, 95% CI)

0.38 [‐0.41, 1.18]

2.2 Shouldice vs non mesh

4

565

Mean Difference (IV, Random, 95% CI)

0.25 [0.01, 0.49]

3 Chronic pain Show forest plot

7

Peto Odds Ratio (Peto, Fixed, 95% CI)

Subtotals only

3.1 Shouldice vs mesh

5

1371

Peto Odds Ratio (Peto, Fixed, 95% CI)

0.87 [0.55, 1.39]

3.2 Shouldice vs non mesh

3

1968

Peto Odds Ratio (Peto, Fixed, 95% CI)

0.70 [0.40, 1.22]

4 Wound Infection Show forest plot

13

Peto Odds Ratio (Peto, Fixed, 95% CI)

Subtotals only

4.1 Shouldice vs mesh

7

1938

Peto Odds Ratio (Peto, Fixed, 95% CI)

0.74 [0.37, 1.49]

4.2 Shouldice vs non mesh

7

2635

Peto Odds Ratio (Peto, Fixed, 95% CI)

1.34 [0.70, 2.54]

5 Seroma Show forest plot

4

Peto Odds Ratio (Peto, Fixed, 95% CI)

Subtotals only

5.1 Shouldice vs mesh

3

1165

Peto Odds Ratio (Peto, Fixed, 95% CI)

0.96 [0.37, 2.50]

5.2 Shouldice vs non mesh

1

142

Peto Odds Ratio (Peto, Fixed, 95% CI)

2.86 [0.39, 20.74]

6 Testicular atrophy Show forest plot

6

Odds Ratio (M‐H, Random, 95% CI)

Subtotals only

6.1 Shouldice vs mesh

3

1155

Odds Ratio (M‐H, Random, 95% CI)

1.05 [0.04, 27.38]

6.2 Shouldice vs non mesh

3

1995

Odds Ratio (M‐H, Random, 95% CI)

1.09 [0.21, 5.50]

7 Haematoma Show forest plot

10

Peto Odds Ratio (Peto, Fixed, 95% CI)

Subtotals only

7.1 Shouldice vs mesh

3

562

Peto Odds Ratio (Peto, Fixed, 95% CI)

0.64 [0.25, 1.64]

7.2 Shouldice vs non mesh

7

2797

Peto Odds Ratio (Peto, Fixed, 95% CI)

0.84 [0.63, 1.13]

8 Duration of the operation (Minutes) Show forest plot

7

Mean Difference (IV, Fixed, 95% CI)

Subtotals only

8.1 Shouldice vs Mesh

5

954

Mean Difference (IV, Fixed, 95% CI)

9.64 [6.96, 12.32]

8.2 Shouldice vs non mesh

3

372

Mean Difference (IV, Fixed, 95% CI)

10.10 [6.78, 13.42]

Figuras y tablas -
Comparison 1. Shouldice vs other techniques