Oral non‐steroidal anti‐inflammatory drug therapy for lung disease in cystic fibrosis
Referencias
References to studies included in this review
References to studies excluded from this review
References to studies awaiting assessment
Additional references
References to other published versions of this review
Characteristics of studies
Characteristics of included studies [ordered by study ID]
| Methods | Randomized, double‐blinded, placebo‐controlled, 3‐month dose escalation study in children with CF. | |
| Participants | 19 children with CF aged 6‐12 years. | |
| Interventions | 3‐month dose escalation study. Participants received 300 mg ibuprofen orally and twice daily during the first month, and, depending on pharmacokinetic studies, 400 mg in the second month, and 600 mg in the third month. Control ‐ placebo. | |
| Outcomes | Compliance. | |
| Notes | ||
| Risk of bias | ||
| Bias | Authors' judgement | Support for judgement |
| Random sequence generation (selection bias) | Low risk | Adequate, randomisation was based upon a computer‐generated randomisation sequence. |
| Allocation concealment (selection bias) | Low risk | Adequate, the randomisation sequence was provided by the pharmaceutical company (Upjohn). |
| Blinding (performance bias and detection bias) | Low risk | Described as double blinded. The pharmaceutical company provided the clinics with identical‐appearing placebo tablets. |
| Incomplete outcome data (attrition bias) | Low risk | Less than 15% of participants excluded (three participants) due to poor venous access, behavioural problems and difficulty in transport to follow up trial visits. |
| Selective reporting (reporting bias) | High risk | Outcomes listed were reported, but the trial investigators monitored a large number of potential adverse effects of ibuprofen: reporting was confined to those considered to be most important and findings which were not statistically significant were not reported |
| Other bias | Unclear risk | Reported adverse events. |
| Methods | Randomized double‐blinded, placebo‐controlled study. | |
| Participants | 85 people with CF aged 5‐39 years. A total of 28 participants withdrew from study, with similar numbers in both groups (15 in treatment group, 13 in placebo group). | |
| Interventions | Participants randomly assigned to receive high‐dose oral ibuprofen twice daily for 4 years or placebo twice daily for 4 years. Dose 20‐30 mg per kg of body weight, to a maximum of 1600 mg, determined by pharmacokinetic analyses. | |
| Outcomes | Compliance (pill counts and blood monitoring) | |
| Notes | ||
| Risk of bias | ||
| Bias | Authors' judgement | Support for judgement |
| Random sequence generation (selection bias) | Low risk | Adequate, randomisation was carried out with permuted blocks of four participants each stratified by age (under 13 years, 13 to 18 years and 19 years or over). |
| Allocation concealment (selection bias) | Low risk | Adequate, paper states that only the pharmacologist and pharmacist were privy to the allocation. |
| Blinding (performance bias and detection bias) | Low risk | Described as double blinded. The placebo tablets were identical in appearance to the ibuprofen tablets. |
| Incomplete outcome data (attrition bias) | Low risk | Analysis was based on intention‐to‐treat. A total of 28 participants withdrew from study, with similar numbers in both groups (15 in treatment group, 13 in placebo group). |
| Selective reporting (reporting bias) | High risk | Outcomes listed were reported, but the trial investigators monitored a large number of potential adverse effects of ibuprofen: reporting was confined to those considered to be most important and findings which were not statistically significant were not reported |
| Other bias | Unclear risk | Intention‐to‐treat and completed treatment analysis are presented, intention‐to‐treat analysis was only used in the meta‐analysis. Reported adverse events. Funded by the Cystic Fibrosis Foundation and the National Institutes of Health. |
| Methods | Multicenter double‐blind placebo‐controlled trial. | |
| Participants | 142 children with CF aged 6‐18 years. 18 participants (9 in each group) did not complete full 2 years of follow up, 11 due to adverse events (4 in treatment group, 7 in placebo group). | |
| Interventions | All participants underwent a baseline pharmacokinetic study (baseline every hour for 3 hours), employing 200 mg tablets (Upjohn‐Pharmacia) at a dose of 20 to 30 mg/kg to a maximum of 1600 mg. The number of assigned pills were then adjusted by the coordinating pharmacologist to provide a peak plasma concentration of 50 to 100 microg/ml for each participant in the study. Participants then were asked to take the prescribed number of pills (ibuprofen or placebo) twice daily. | |
| Outcomes | Annual rate of change in FEV1 % predicted, FVC % predicted, anthropometric data, chest radiograph score, number of hospitalizations (and length of stay), adverse effects, compliance, concomitant therapy(antibiotics, inhaled anti‐inflammatory agents). | |
| Notes | ||
| Risk of bias | ||
| Bias | Authors' judgement | Support for judgement |
| Random sequence generation (selection bias) | Low risk | Adequate, participants were allocated using a predefined block‐randomisation schedule. |
| Allocation concealment (selection bias) | Low risk | Adequate, a central pharmacy coded and shipped the tablets to the participating centers; the code was broken by the central pharmacy only on request from the Safety and Monitoring Committee. |
| Blinding (performance bias and detection bias) | Low risk | Described as double blinded. Paper states that participants, care‐givers and study personnel were all blinded to treatment assignment. |
| Incomplete outcome data (attrition bias) | Low risk | Analysis was based on intention‐to‐treat. 18 participants (9 in each group) did not complete full 2 years of follow up, 11 due to adverse events (4 in treatment group, 7 in placebo group); details of these events in paper. |
| Selective reporting (reporting bias) | Low risk | Outcomes listed were reported. |
| Other bias | Unclear risk | Reported adverse events. Funders did not have a role in the analysis or publication of results. |
| Methods | Randomized, double‐blinded, placebo‐controlled study of piroxicam or placebo. | |
| Participants | 41 people with CF aged 5 ‐ 37 years. | |
| Interventions | Doses were according to participants' body weight: <15 kg: 5 mg/day; 16‐25 kg: 10 mg/day; 26‐45 kg: 15 mg/day and >46 kg: 20 mg/day. Piroxicam and placebo were taken by the participants in a single morning dose. Treatment was suspended during periods of hospitalization and reinstated after discharge. Participants for whom treatment was suspended for more than 30 days were removed from the trial. | |
| Outcomes | Dropout rates. | |
| Notes | ||
| Risk of bias | ||
| Bias | Authors' judgement | Support for judgement |
| Random sequence generation (selection bias) | Unclear risk | Process was described as random in the paper, but the randomisation method was not described. |
| Allocation concealment (selection bias) | Unclear risk | Unclear, concealment of allocation was not discussed. |
| Blinding (performance bias and detection bias) | Low risk | Described as double blinded. Paper describes the placebo tablets as being "indistinguishable" from the piroxicam tablets. |
| Incomplete outcome data (attrition bias) | Low risk | More than 15% of participants were excluded from the intention‐to‐treat analysis (n = 8) (Sordelli 1994). Four participants from the treatment group and four from the control group did not complete the study. Reasons for exclusion included abdominal pain, hematemesis, hepatic dysfunction and acute respiratory exacerbation. |
| Selective reporting (reporting bias) | Low risk | Outcomes listed were reported. |
| Other bias | Unclear risk | Reported adverse events. |
CF: cystic fibrosis
FEF25‐75: forced mid‐expiratory flow
FEV1: forced expiratory volume in one second
FVC: forced vital capacity
NSAID: non‐steroidal anti‐inflammatory drug
Characteristics of excluded studies [ordered by study ID]
| Study | Reason for exclusion |
| Follow‐up period did not meet inclusion criteria | |
| Not a study of NSAIDs. Study reported a mucolytic combined with nebulizer therapy compared to nebulizer therapy alone. | |
| Study reported effect of single dose of aspirin only. | |
| Not an RCT; participants are measured pre‐post intervention | |
| Not a study of NSAIDs ‐ study of digitoxin. |
NSAID: non‐steroidal anti‐inflammatory drug
Characteristics of studies awaiting assessment [ordered by study ID]
| Methods | Double‐blind RCT. Parallel design. Duration; 15 days Location: 4 sites in the UK. |
| Participants | 27 participants with mild to moderate disease, of either gender aged 18 to 55 years at time of screening. |
| Interventions | 3 cohorts of 9 participants, each cohort with 6 in CTX group and 3 in placebo group. Ascending dose study. CTX‐4430: 25 mg orally once‐daily. CTX‐4430: 50 mg orally once‐daily. CTX‐4430: 100 mg orally once‐daily. Placebo (mannitol): orally once‐daily. |
| Outcomes | Observations on days 1, 8 and 15: physical examinations, ECG, pulse oximetry, pulmonary function, clinical laboratory results (inflammatory markers in blood and sputum), adverse events. |
| Notes | NCT01944735. Principal investigator: J Stuart Elborn, MD, FRCP. |
ECG: echocardiogram
FEV1: forced expiratory volume at one second
FVC: forced vital capacity
IL‐8: Interleukin‐8
NSAID: non‐steroidal anti‐inflammatory
PHA: phytohemagglutinin
TNF‐α: tumour necrosis factor alpha
Data and analyses
| Outcome or subgroup title | No. of studies | No. of participants | Statistical method | Effect size |
| 1 Annual rate of change in % predicted FEV1 Show forest plot | 2 | 226 | Mean Difference (IV, Fixed, 95% CI) | 1.32 [0.21, 2.42] |
| Analysis 1.1  Comparison 1 Oral nonsteroidal anti‐inflammatory drug versus placebo, Outcome 1 Annual rate of change in % predicted FEV1. | ||||
| 2 Annual rate of change in % predicted FEV1 (split by age) Show forest plot | 2 | 226 | Mean Difference (IV, Fixed, 95% CI) | 1.16 [0.07, 2.25] |
| Analysis 1.2  Comparison 1 Oral nonsteroidal anti‐inflammatory drug versus placebo, Outcome 2 Annual rate of change in % predicted FEV1 (split by age). | ||||
| 2.1 Under 13 years at randomisation | 2 | 147 | Mean Difference (IV, Fixed, 95% CI) | 1.41 [0.03, 2.80] |
| 2.2 13 years or over at randomisation | 2 | 79 | Mean Difference (IV, Fixed, 95% CI) | 0.75 [‐1.02, 2.52] |
| 3 Annual rate of change in % predicted FVC Show forest plot | 2 | 226 | Mean Difference (IV, Fixed, 95% CI) | 1.27 [0.26, 2.28] |
| Analysis 1.3 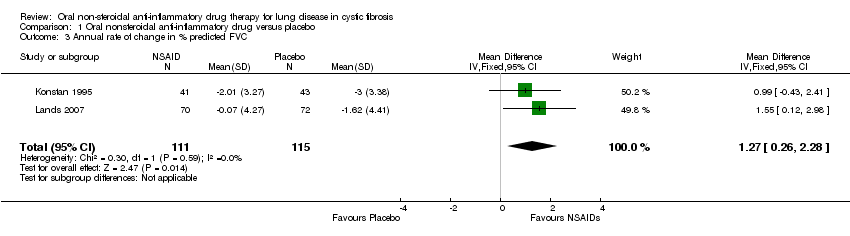 Comparison 1 Oral nonsteroidal anti‐inflammatory drug versus placebo, Outcome 3 Annual rate of change in % predicted FVC. | ||||
| 4 Annual rate of change in % predicted FVC (split by age) Show forest plot | 2 | 226 | Mean Difference (IV, Fixed, 95% CI) | 1.09 [0.12, 2.06] |
| Analysis 1.4  Comparison 1 Oral nonsteroidal anti‐inflammatory drug versus placebo, Outcome 4 Annual rate of change in % predicted FVC (split by age). | ||||
| 4.1 Under 13 years at randomisation | 2 | 147 | Mean Difference (IV, Fixed, 95% CI) | 1.32 [0.04, 2.60] |
| 4.2 13 years and over at randomisation | 2 | 79 | Mean Difference (IV, Fixed, 95% CI) | 0.78 [‐0.71, 2.27] |
| 5 Annual rate of change in % predicted FEF25‐75% Show forest plot | 2 | 218 | Mean Difference (IV, Fixed, 95% CI) | 1.80 [0.15, 3.45] |
| Analysis 1.5  Comparison 1 Oral nonsteroidal anti‐inflammatory drug versus placebo, Outcome 5 Annual rate of change in % predicted FEF25‐75%. | ||||
| 6 Annual rate of change in % predicted FEF25‐75% (split by age) Show forest plot | 2 | 214 | Mean Difference (IV, Fixed, 95% CI) | 1.72 [0.10, 3.34] |
| Analysis 1.6  Comparison 1 Oral nonsteroidal anti‐inflammatory drug versus placebo, Outcome 6 Annual rate of change in % predicted FEF25‐75% (split by age). | ||||
| 6.1 Under 13 years at randomisation | 2 | 138 | Mean Difference (IV, Fixed, 95% CI) | 2.03 [‐0.09, 4.16] |
| 6.2 13 years or older at randomisation | 2 | 76 | Mean Difference (IV, Fixed, 95% CI) | 1.28 [‐1.22, 3.79] |
| 7 Proportion with at least one respiratory hospitalisation Show forest plot | 1 | Peto Odds Ratio (Peto, Fixed, 95% CI) | Totals not selected | |
| Analysis 1.7  Comparison 1 Oral nonsteroidal anti‐inflammatory drug versus placebo, Outcome 7 Proportion with at least one respiratory hospitalisation. | ||||
| 8 Proportion with at least one hospital admission Show forest plot | 4 | 286 | Peto Odds Ratio (Peto, Fixed, 95% CI) | 0.61 [0.37, 1.01] |
| Analysis 1.8  Comparison 1 Oral nonsteroidal anti‐inflammatory drug versus placebo, Outcome 8 Proportion with at least one hospital admission. | ||||
| 9 Number of deaths Show forest plot | 3 | 245 | Peto Odds Ratio (Peto, Fixed, 95% CI) | 0.0 [0.0, 0.0] |
| Analysis 1.9  Comparison 1 Oral nonsteroidal anti‐inflammatory drug versus placebo, Outcome 9 Number of deaths. | ||||
| 10 Annual rate of change in % ideal body weight Show forest plot | 1 | Mean Difference (IV, Fixed, 95% CI) | Totals not selected | |
| Analysis 1.10 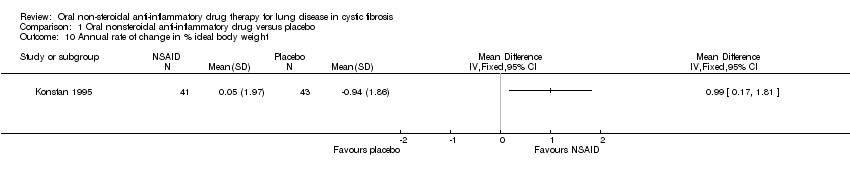 Comparison 1 Oral nonsteroidal anti‐inflammatory drug versus placebo, Outcome 10 Annual rate of change in % ideal body weight. | ||||
| 11 Annual rate of change in % ideal body weight (split by age) Show forest plot | 1 | 84 | Mean Difference (IV, Fixed, 95% CI) | 0.81 [0.08, 1.53] |
| Analysis 1.11 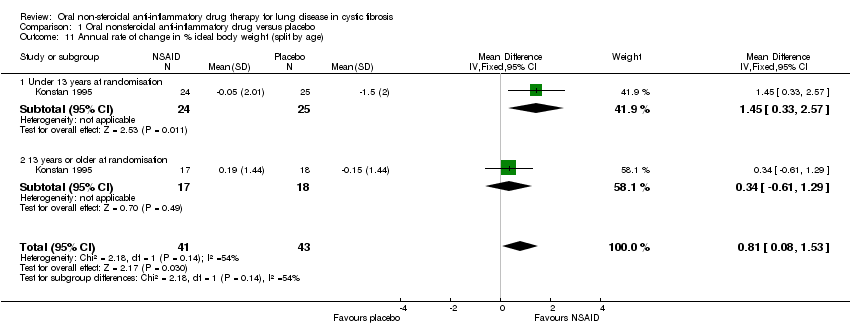 Comparison 1 Oral nonsteroidal anti‐inflammatory drug versus placebo, Outcome 11 Annual rate of change in % ideal body weight (split by age). | ||||
| 11.1 Under 13 years at randomisation | 1 | 49 | Mean Difference (IV, Fixed, 95% CI) | 1.45 [0.33, 2.57] |
| 11.2 13 years or older at randomisation | 1 | 35 | Mean Difference (IV, Fixed, 95% CI) | 0.34 [‐0.61, 1.29] |
| 12 Chest X‐ray score Show forest plot | 2 | 226 | Mean Difference (IV, Fixed, 95% CI) | 0.37 [‐0.08, 0.81] |
| Analysis 1.12  Comparison 1 Oral nonsteroidal anti‐inflammatory drug versus placebo, Outcome 12 Chest X‐ray score. | ||||
| 13 Chest X‐ray score (split by age) Show forest plot | 1 | 84 | Mean Difference (IV, Fixed, 95% CI) | 0.51 [‐0.04, 1.07] |
| Analysis 1.13  Comparison 1 Oral nonsteroidal anti‐inflammatory drug versus placebo, Outcome 13 Chest X‐ray score (split by age). | ||||
| 13.1 Under 13 years at randomisation | 1 | 49 | Mean Difference (IV, Fixed, 95% CI) | 0.45 [‐0.24, 1.14] |
| 13.2 13 years or older at randomisation | 1 | 35 | Mean Difference (IV, Fixed, 95% CI) | 0.63 [‐0.30, 1.56] |
| 14 Increase in abdominal pain Show forest plot | 2 | 226 | Peto Odds Ratio (Peto, Fixed, 95% CI) | 0.54 [0.20, 1.48] |
| Analysis 1.14 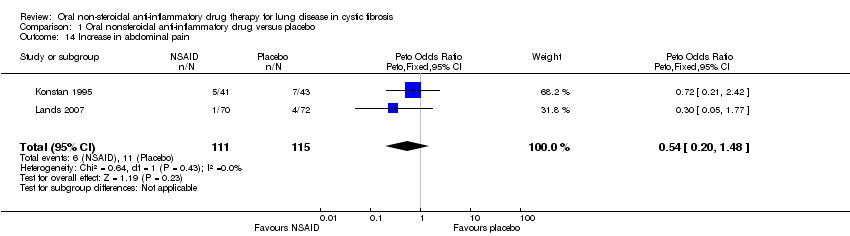 Comparison 1 Oral nonsteroidal anti‐inflammatory drug versus placebo, Outcome 14 Increase in abdominal pain. | ||||
| 15 Decrease in abdominal pain Show forest plot | 1 | Peto Odds Ratio (Peto, Fixed, 95% CI) | Totals not selected | |
| Analysis 1.15  Comparison 1 Oral nonsteroidal anti‐inflammatory drug versus placebo, Outcome 15 Decrease in abdominal pain. | ||||
| 16 Proportion with at least one gastrointestinal hospitalisation Show forest plot | 1 | Peto Odds Ratio (Peto, Fixed, 95% CI) | Totals not selected | |
| Analysis 1.16  Comparison 1 Oral nonsteroidal anti‐inflammatory drug versus placebo, Outcome 16 Proportion with at least one gastrointestinal hospitalisation. | ||||
| 17 Stool frequency Show forest plot | 1 | Peto Odds Ratio (Peto, Fixed, 95% CI) | Totals not selected | |
| Analysis 1.17  Comparison 1 Oral nonsteroidal anti‐inflammatory drug versus placebo, Outcome 17 Stool frequency. | ||||
| 18 Occult blood Show forest plot | 1 | Peto Odds Ratio (Peto, Fixed, 95% CI) | Totals not selected | |
| Analysis 1.18 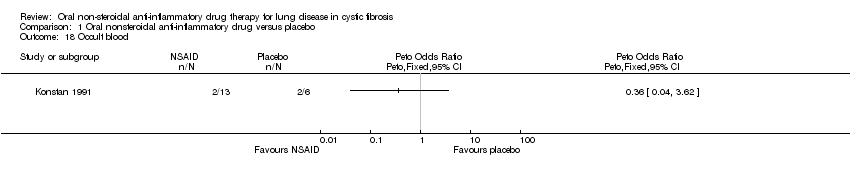 Comparison 1 Oral nonsteroidal anti‐inflammatory drug versus placebo, Outcome 18 Occult blood. | ||||
| 19 Increase in epistaxis Show forest plot | 1 | Peto Odds Ratio (Peto, Fixed, 95% CI) | Totals not selected | |
| Analysis 1.19  Comparison 1 Oral nonsteroidal anti‐inflammatory drug versus placebo, Outcome 19 Increase in epistaxis. | ||||
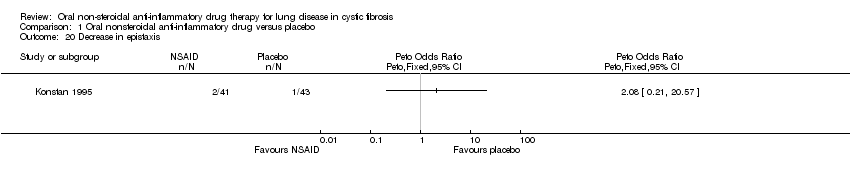
| 20 Decrease in epistaxis Show forest plot | 1 | Peto Odds Ratio (Peto, Fixed, 95% CI) | Totals not selected | |
| Analysis 1.20  Comparison 1 Oral nonsteroidal anti‐inflammatory drug versus placebo, Outcome 20 Decrease in epistaxis. | ||||
| 21 Increase in conjunctivitis Show forest plot | 2 | 226 | Peto Odds Ratio (Peto, Fixed, 95% CI) | 0.72 [0.22, 2.40] |
| Analysis 1.21 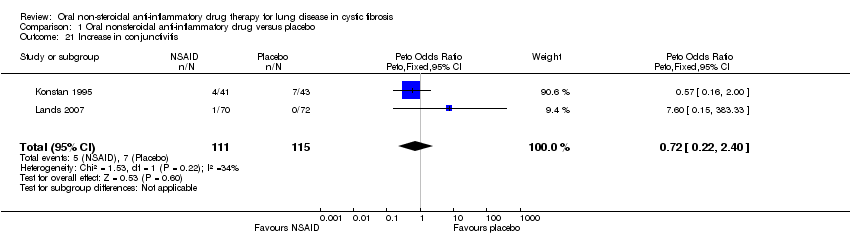 Comparison 1 Oral nonsteroidal anti‐inflammatory drug versus placebo, Outcome 21 Increase in conjunctivitis. | ||||
| 22 Decrease in conjunctivitis Show forest plot | 1 | Peto Odds Ratio (Peto, Fixed, 95% CI) | Totals not selected | |
| Analysis 1.22 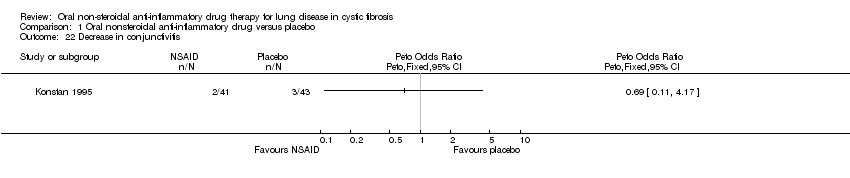 Comparison 1 Oral nonsteroidal anti‐inflammatory drug versus placebo, Outcome 22 Decrease in conjunctivitis. | ||||
| 23 Increase in nausea Show forest plot | 1 | Peto Odds Ratio (Peto, Fixed, 95% CI) | Totals not selected | |
| Analysis 1.23  Comparison 1 Oral nonsteroidal anti‐inflammatory drug versus placebo, Outcome 23 Increase in nausea. | ||||
| 24 Increase in diarrhoea Show forest plot | 1 | Peto Odds Ratio (Peto, Fixed, 95% CI) | Totals not selected | |
| Analysis 1.24  Comparison 1 Oral nonsteroidal anti‐inflammatory drug versus placebo, Outcome 24 Increase in diarrhoea. | ||||

Comparison 1 Oral nonsteroidal anti‐inflammatory drug versus placebo, Outcome 1 Annual rate of change in % predicted FEV1.
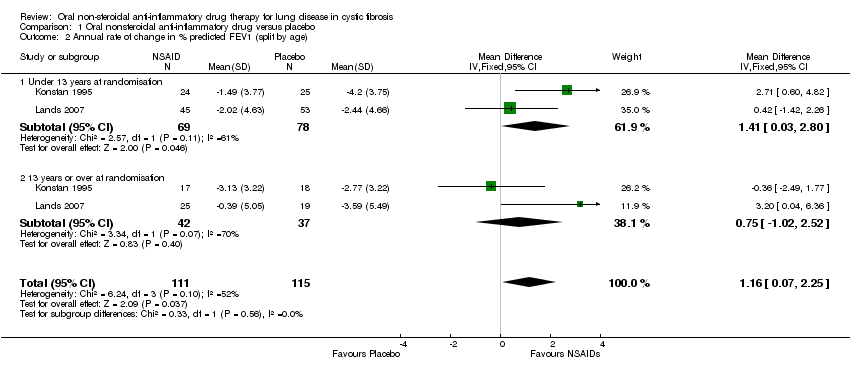
Comparison 1 Oral nonsteroidal anti‐inflammatory drug versus placebo, Outcome 2 Annual rate of change in % predicted FEV1 (split by age).

Comparison 1 Oral nonsteroidal anti‐inflammatory drug versus placebo, Outcome 3 Annual rate of change in % predicted FVC.
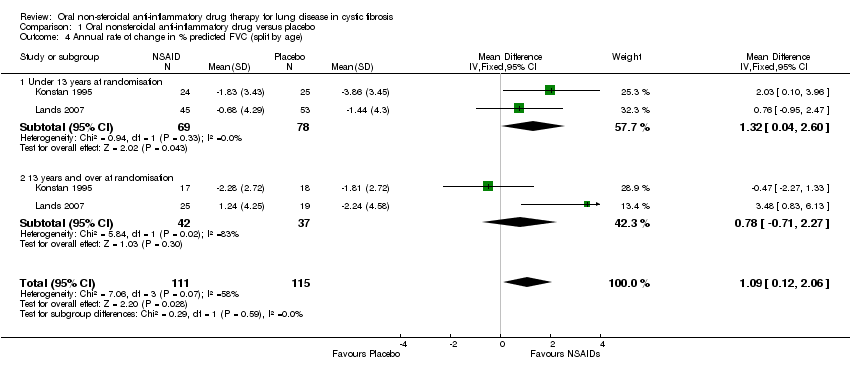
Comparison 1 Oral nonsteroidal anti‐inflammatory drug versus placebo, Outcome 4 Annual rate of change in % predicted FVC (split by age).
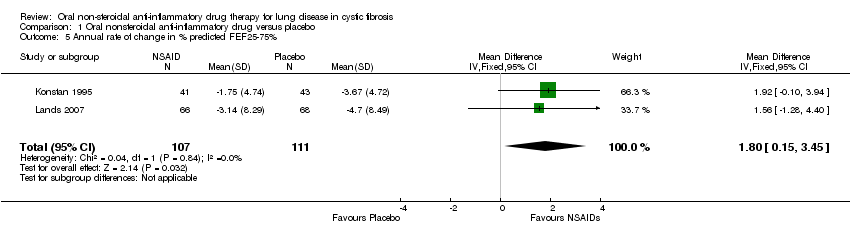
Comparison 1 Oral nonsteroidal anti‐inflammatory drug versus placebo, Outcome 5 Annual rate of change in % predicted FEF25‐75%.
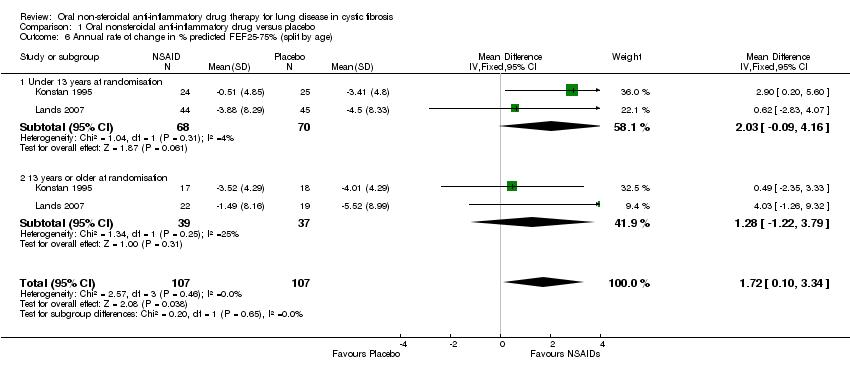
Comparison 1 Oral nonsteroidal anti‐inflammatory drug versus placebo, Outcome 6 Annual rate of change in % predicted FEF25‐75% (split by age).

Comparison 1 Oral nonsteroidal anti‐inflammatory drug versus placebo, Outcome 7 Proportion with at least one respiratory hospitalisation.
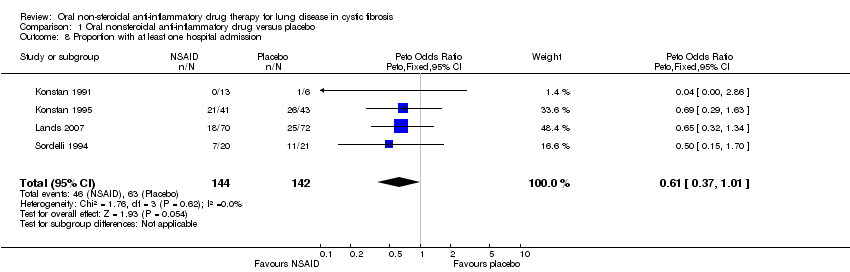
Comparison 1 Oral nonsteroidal anti‐inflammatory drug versus placebo, Outcome 8 Proportion with at least one hospital admission.
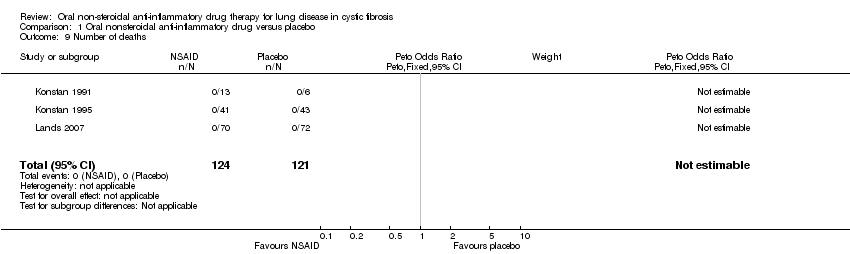
Comparison 1 Oral nonsteroidal anti‐inflammatory drug versus placebo, Outcome 9 Number of deaths.

Comparison 1 Oral nonsteroidal anti‐inflammatory drug versus placebo, Outcome 10 Annual rate of change in % ideal body weight.

Comparison 1 Oral nonsteroidal anti‐inflammatory drug versus placebo, Outcome 11 Annual rate of change in % ideal body weight (split by age).

Comparison 1 Oral nonsteroidal anti‐inflammatory drug versus placebo, Outcome 12 Chest X‐ray score.
Comparison 1 Oral nonsteroidal anti‐inflammatory drug versus placebo, Outcome 13 Chest X‐ray score (split by age).

Comparison 1 Oral nonsteroidal anti‐inflammatory drug versus placebo, Outcome 14 Increase in abdominal pain.

Comparison 1 Oral nonsteroidal anti‐inflammatory drug versus placebo, Outcome 15 Decrease in abdominal pain.
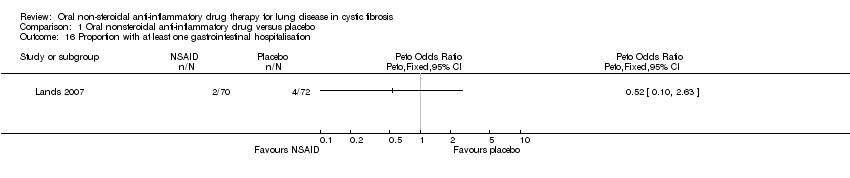
Comparison 1 Oral nonsteroidal anti‐inflammatory drug versus placebo, Outcome 16 Proportion with at least one gastrointestinal hospitalisation.
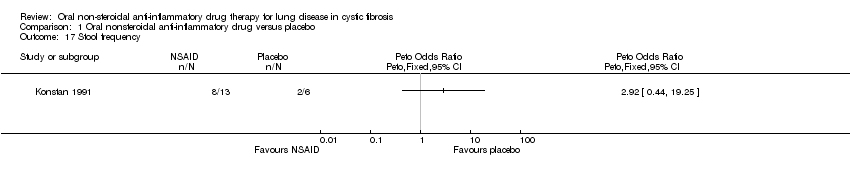
Comparison 1 Oral nonsteroidal anti‐inflammatory drug versus placebo, Outcome 17 Stool frequency.

Comparison 1 Oral nonsteroidal anti‐inflammatory drug versus placebo, Outcome 18 Occult blood.

Comparison 1 Oral nonsteroidal anti‐inflammatory drug versus placebo, Outcome 19 Increase in epistaxis.
Comparison 1 Oral nonsteroidal anti‐inflammatory drug versus placebo, Outcome 20 Decrease in epistaxis.

Comparison 1 Oral nonsteroidal anti‐inflammatory drug versus placebo, Outcome 21 Increase in conjunctivitis.

Comparison 1 Oral nonsteroidal anti‐inflammatory drug versus placebo, Outcome 22 Decrease in conjunctivitis.

Comparison 1 Oral nonsteroidal anti‐inflammatory drug versus placebo, Outcome 23 Increase in nausea.

Comparison 1 Oral nonsteroidal anti‐inflammatory drug versus placebo, Outcome 24 Increase in diarrhoea.
| Outcome or subgroup title | No. of studies | No. of participants | Statistical method | Effect size |
| 1 Annual rate of change in % predicted FEV1 Show forest plot | 2 | 226 | Mean Difference (IV, Fixed, 95% CI) | 1.32 [0.21, 2.42] |
| 2 Annual rate of change in % predicted FEV1 (split by age) Show forest plot | 2 | 226 | Mean Difference (IV, Fixed, 95% CI) | 1.16 [0.07, 2.25] |
| 2.1 Under 13 years at randomisation | 2 | 147 | Mean Difference (IV, Fixed, 95% CI) | 1.41 [0.03, 2.80] |
| 2.2 13 years or over at randomisation | 2 | 79 | Mean Difference (IV, Fixed, 95% CI) | 0.75 [‐1.02, 2.52] |
| 3 Annual rate of change in % predicted FVC Show forest plot | 2 | 226 | Mean Difference (IV, Fixed, 95% CI) | 1.27 [0.26, 2.28] |
| 4 Annual rate of change in % predicted FVC (split by age) Show forest plot | 2 | 226 | Mean Difference (IV, Fixed, 95% CI) | 1.09 [0.12, 2.06] |
| 4.1 Under 13 years at randomisation | 2 | 147 | Mean Difference (IV, Fixed, 95% CI) | 1.32 [0.04, 2.60] |
| 4.2 13 years and over at randomisation | 2 | 79 | Mean Difference (IV, Fixed, 95% CI) | 0.78 [‐0.71, 2.27] |
| 5 Annual rate of change in % predicted FEF25‐75% Show forest plot | 2 | 218 | Mean Difference (IV, Fixed, 95% CI) | 1.80 [0.15, 3.45] |
| 6 Annual rate of change in % predicted FEF25‐75% (split by age) Show forest plot | 2 | 214 | Mean Difference (IV, Fixed, 95% CI) | 1.72 [0.10, 3.34] |
| 6.1 Under 13 years at randomisation | 2 | 138 | Mean Difference (IV, Fixed, 95% CI) | 2.03 [‐0.09, 4.16] |
| 6.2 13 years or older at randomisation | 2 | 76 | Mean Difference (IV, Fixed, 95% CI) | 1.28 [‐1.22, 3.79] |
| 7 Proportion with at least one respiratory hospitalisation Show forest plot | 1 | Peto Odds Ratio (Peto, Fixed, 95% CI) | Totals not selected | |
| 8 Proportion with at least one hospital admission Show forest plot | 4 | 286 | Peto Odds Ratio (Peto, Fixed, 95% CI) | 0.61 [0.37, 1.01] |
| 9 Number of deaths Show forest plot | 3 | 245 | Peto Odds Ratio (Peto, Fixed, 95% CI) | 0.0 [0.0, 0.0] |
| 10 Annual rate of change in % ideal body weight Show forest plot | 1 | Mean Difference (IV, Fixed, 95% CI) | Totals not selected | |
| 11 Annual rate of change in % ideal body weight (split by age) Show forest plot | 1 | 84 | Mean Difference (IV, Fixed, 95% CI) | 0.81 [0.08, 1.53] |
| 11.1 Under 13 years at randomisation | 1 | 49 | Mean Difference (IV, Fixed, 95% CI) | 1.45 [0.33, 2.57] |
| 11.2 13 years or older at randomisation | 1 | 35 | Mean Difference (IV, Fixed, 95% CI) | 0.34 [‐0.61, 1.29] |
| 12 Chest X‐ray score Show forest plot | 2 | 226 | Mean Difference (IV, Fixed, 95% CI) | 0.37 [‐0.08, 0.81] |
| 13 Chest X‐ray score (split by age) Show forest plot | 1 | 84 | Mean Difference (IV, Fixed, 95% CI) | 0.51 [‐0.04, 1.07] |
| 13.1 Under 13 years at randomisation | 1 | 49 | Mean Difference (IV, Fixed, 95% CI) | 0.45 [‐0.24, 1.14] |
| 13.2 13 years or older at randomisation | 1 | 35 | Mean Difference (IV, Fixed, 95% CI) | 0.63 [‐0.30, 1.56] |
| 14 Increase in abdominal pain Show forest plot | 2 | 226 | Peto Odds Ratio (Peto, Fixed, 95% CI) | 0.54 [0.20, 1.48] |
| 15 Decrease in abdominal pain Show forest plot | 1 | Peto Odds Ratio (Peto, Fixed, 95% CI) | Totals not selected | |
| 16 Proportion with at least one gastrointestinal hospitalisation Show forest plot | 1 | Peto Odds Ratio (Peto, Fixed, 95% CI) | Totals not selected | |
| 17 Stool frequency Show forest plot | 1 | Peto Odds Ratio (Peto, Fixed, 95% CI) | Totals not selected | |
| 18 Occult blood Show forest plot | 1 | Peto Odds Ratio (Peto, Fixed, 95% CI) | Totals not selected | |
| 19 Increase in epistaxis Show forest plot | 1 | Peto Odds Ratio (Peto, Fixed, 95% CI) | Totals not selected | |
| 20 Decrease in epistaxis Show forest plot | 1 | Peto Odds Ratio (Peto, Fixed, 95% CI) | Totals not selected | |
| 21 Increase in conjunctivitis Show forest plot | 2 | 226 | Peto Odds Ratio (Peto, Fixed, 95% CI) | 0.72 [0.22, 2.40] |
| 22 Decrease in conjunctivitis Show forest plot | 1 | Peto Odds Ratio (Peto, Fixed, 95% CI) | Totals not selected | |
| 23 Increase in nausea Show forest plot | 1 | Peto Odds Ratio (Peto, Fixed, 95% CI) | Totals not selected | |
| 24 Increase in diarrhoea Show forest plot | 1 | Peto Odds Ratio (Peto, Fixed, 95% CI) | Totals not selected | |