| 1 Annual rate of change in % predicted FEV1 Show forest plot | 2 | 226 | Mean Difference (IV, Fixed, 95% CI) | 1.32 [0.21, 2.42] |
|
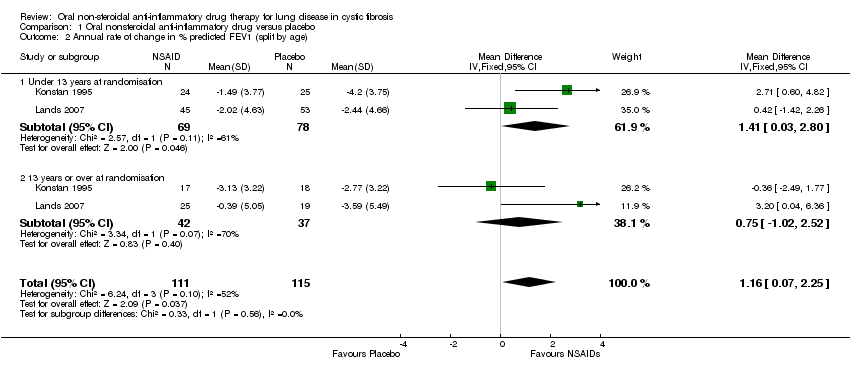
| 2 Annual rate of change in % predicted FEV1 (split by age) Show forest plot | 2 | 226 | Mean Difference (IV, Fixed, 95% CI) | 1.16 [0.07, 2.25] |
|
| 2.1 Under 13 years at randomisation | 2 | 147 | Mean Difference (IV, Fixed, 95% CI) | 1.41 [0.03, 2.80] |
| 2.2 13 years or over at randomisation | 2 | 79 | Mean Difference (IV, Fixed, 95% CI) | 0.75 [‐1.02, 2.52] |
| 3 Annual rate of change in % predicted FVC Show forest plot | 2 | 226 | Mean Difference (IV, Fixed, 95% CI) | 1.27 [0.26, 2.28] |
|
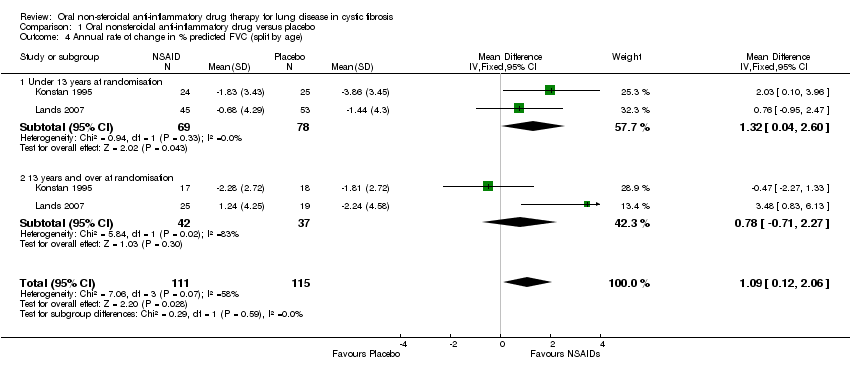
| 4 Annual rate of change in % predicted FVC (split by age) Show forest plot | 2 | 226 | Mean Difference (IV, Fixed, 95% CI) | 1.09 [0.12, 2.06] |
|
| 4.1 Under 13 years at randomisation | 2 | 147 | Mean Difference (IV, Fixed, 95% CI) | 1.32 [0.04, 2.60] |
| 4.2 13 years and over at randomisation | 2 | 79 | Mean Difference (IV, Fixed, 95% CI) | 0.78 [‐0.71, 2.27] |
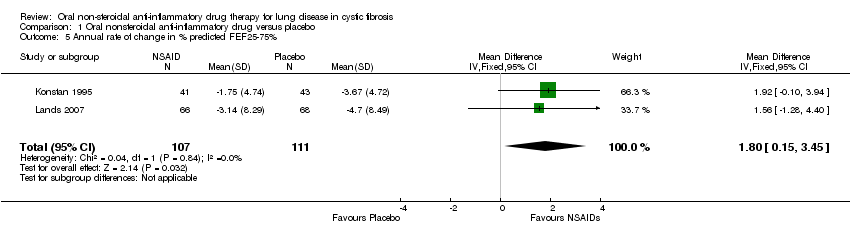
| 5 Annual rate of change in % predicted FEF25‐75% Show forest plot | 2 | 218 | Mean Difference (IV, Fixed, 95% CI) | 1.80 [0.15, 3.45] |
|
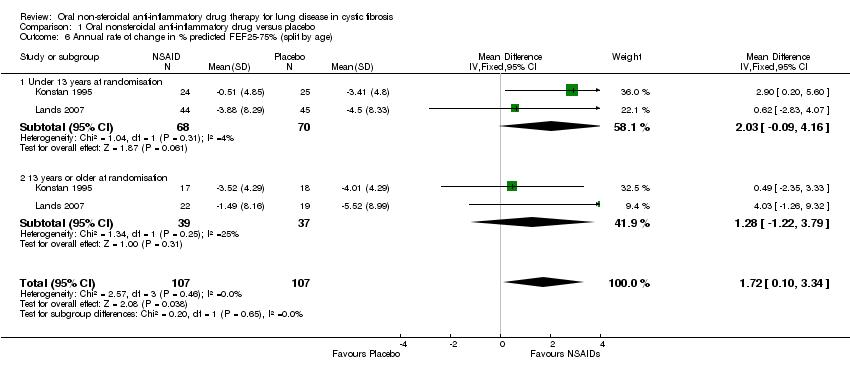
| 6 Annual rate of change in % predicted FEF25‐75% (split by age) Show forest plot | 2 | 214 | Mean Difference (IV, Fixed, 95% CI) | 1.72 [0.10, 3.34] |
|
| 6.1 Under 13 years at randomisation | 2 | 138 | Mean Difference (IV, Fixed, 95% CI) | 2.03 [‐0.09, 4.16] |
| 6.2 13 years or older at randomisation | 2 | 76 | Mean Difference (IV, Fixed, 95% CI) | 1.28 [‐1.22, 3.79] |
| 7 Proportion with at least one respiratory hospitalisation Show forest plot | 1 | | Peto Odds Ratio (Peto, Fixed, 95% CI) | Totals not selected |
|
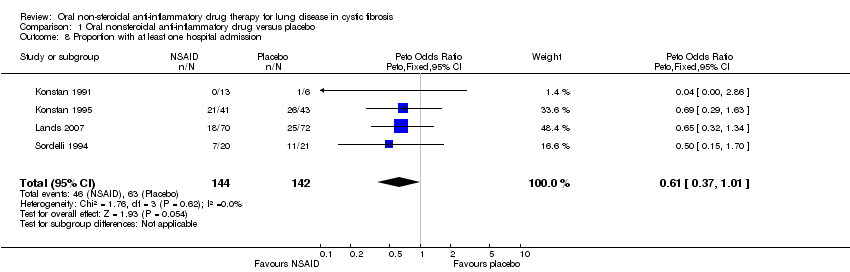
| 8 Proportion with at least one hospital admission Show forest plot | 4 | 286 | Peto Odds Ratio (Peto, Fixed, 95% CI) | 0.61 [0.37, 1.01] |
|
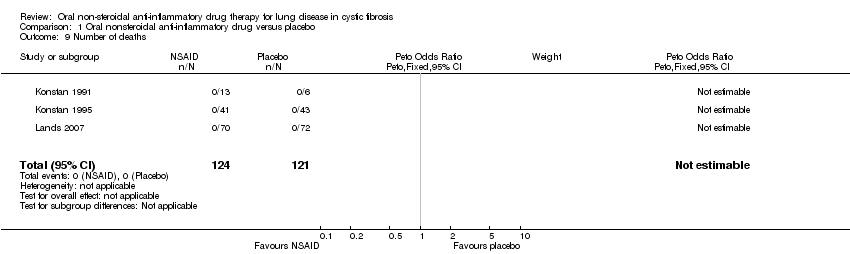
| 9 Number of deaths Show forest plot | 3 | 245 | Peto Odds Ratio (Peto, Fixed, 95% CI) | 0.0 [0.0, 0.0] |
|
| 10 Annual rate of change in % ideal body weight Show forest plot | 1 | | Mean Difference (IV, Fixed, 95% CI) | Totals not selected |
|
| 11 Annual rate of change in % ideal body weight (split by age) Show forest plot | 1 | 84 | Mean Difference (IV, Fixed, 95% CI) | 0.81 [0.08, 1.53] |
|
| 11.1 Under 13 years at randomisation | 1 | 49 | Mean Difference (IV, Fixed, 95% CI) | 1.45 [0.33, 2.57] |
| 11.2 13 years or older at randomisation | 1 | 35 | Mean Difference (IV, Fixed, 95% CI) | 0.34 [‐0.61, 1.29] |
| 12 Chest X‐ray score Show forest plot | 2 | 226 | Mean Difference (IV, Fixed, 95% CI) | 0.37 [‐0.08, 0.81] |
|
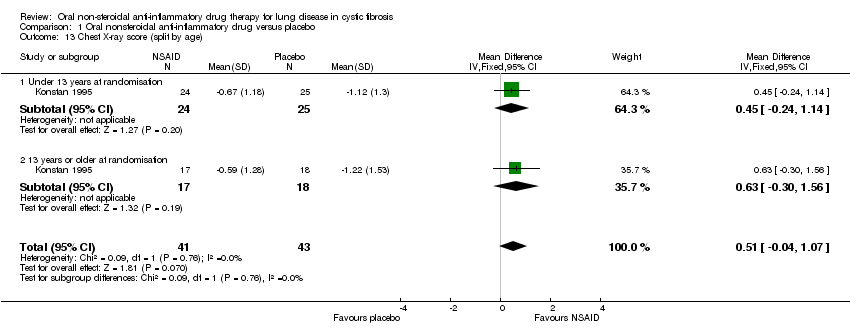
| 13 Chest X‐ray score (split by age) Show forest plot | 1 | 84 | Mean Difference (IV, Fixed, 95% CI) | 0.51 [‐0.04, 1.07] |
|
| 13.1 Under 13 years at randomisation | 1 | 49 | Mean Difference (IV, Fixed, 95% CI) | 0.45 [‐0.24, 1.14] |
| 13.2 13 years or older at randomisation | 1 | 35 | Mean Difference (IV, Fixed, 95% CI) | 0.63 [‐0.30, 1.56] |
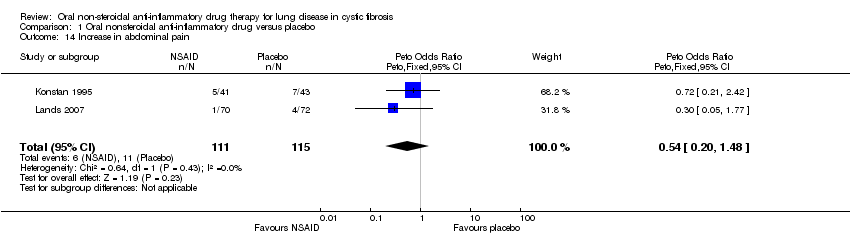
| 14 Increase in abdominal pain Show forest plot | 2 | 226 | Peto Odds Ratio (Peto, Fixed, 95% CI) | 0.54 [0.20, 1.48] |
|
| 15 Decrease in abdominal pain Show forest plot | 1 | | Peto Odds Ratio (Peto, Fixed, 95% CI) | Totals not selected |
|
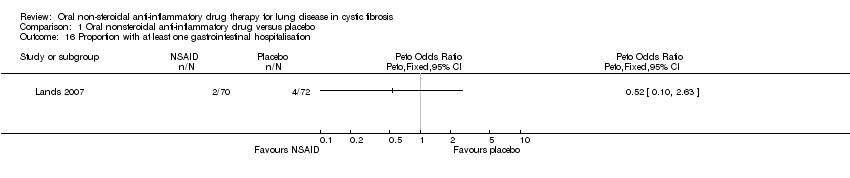
| 16 Proportion with at least one gastrointestinal hospitalisation Show forest plot | 1 | | Peto Odds Ratio (Peto, Fixed, 95% CI) | Totals not selected |
|
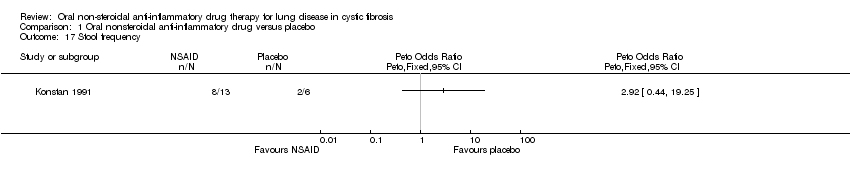
| 17 Stool frequency Show forest plot | 1 | | Peto Odds Ratio (Peto, Fixed, 95% CI) | Totals not selected |
|
| 18 Occult blood Show forest plot | 1 | | Peto Odds Ratio (Peto, Fixed, 95% CI) | Totals not selected |
|
| 19 Increase in epistaxis Show forest plot | 1 | | Peto Odds Ratio (Peto, Fixed, 95% CI) | Totals not selected |
|
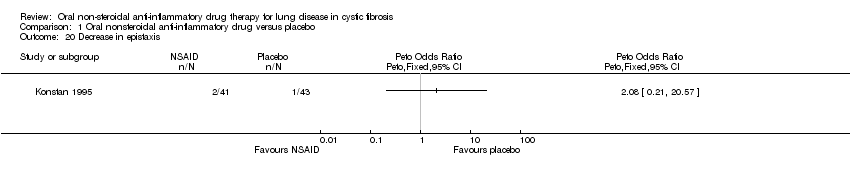
| 20 Decrease in epistaxis Show forest plot | 1 | | Peto Odds Ratio (Peto, Fixed, 95% CI) | Totals not selected |
|
| 21 Increase in conjunctivitis Show forest plot | 2 | 226 | Peto Odds Ratio (Peto, Fixed, 95% CI) | 0.72 [0.22, 2.40] |
|
| 22 Decrease in conjunctivitis Show forest plot | 1 | | Peto Odds Ratio (Peto, Fixed, 95% CI) | Totals not selected |
|
| 23 Increase in nausea Show forest plot | 1 | | Peto Odds Ratio (Peto, Fixed, 95% CI) | Totals not selected |
|
| 24 Increase in diarrhoea Show forest plot | 1 | | Peto Odds Ratio (Peto, Fixed, 95% CI) | Totals not selected |
|