Endometrial resection / ablation techniques for heavy menstrual bleeding
Referencias
References to studies included in this review
References to studies excluded from this review
References to studies awaiting assessment
Additional references
Characteristics of studies
Characteristics of included studies [ordered by study ID]
| Methods | Randomisation: computer‐generated sequences in balanced blocks of 5, imbalanced randomization 2:1 & opaque envelope. | |
| Participants | 57 women with unstated ages (mean Novasure 40.5(6.0), mean Cavaterm 40.5(8.1) recruited from James Cook University Hospital in the UK. | |
| Interventions | (1) Novasure (TM) endometrial ablation | |
| Outcomes | Primary: amenorrhoea; menstrual change, QOL, sexual activity, patient satisfaction, procedure acceptability. | |
| Notes | ||
| Risk of bias | ||
| Bias | Authors' judgement | Support for judgement |
| Adequate sequence generation? | Low risk | Computer generated sequences in balanced blocks of five |
| Allocation concealment? | Low risk | Opaque envelopes |
| Blinding? | Low risk | Participants, nursing staff, GP and assessors of outcomes at later follow up all blinded |
| Incomplete outcome data addressed? | Low risk | One participant in each group withdrew after randomisation and prior to surgery |
| Free of selective reporting? | Unclear risk | No prior published protocol identified |
| Free of other bias? | Unclear risk | Groups appeared balanced at baseline but medical equipment company provided funding |
| Methods | Randomisation: Random number sequence computer generated + numbered concealed opaque envelopes. | |
| Participants | 372 women with mean age 41 years, recruited from gynaecology clinics at Aberdeen Royal Infirmary, Scotland. | |
| Interventions | All women had clinical assessment and endometrial biopsy prior to treatment, and also endometrial preparation with a single injection of goserelin 3.6 mg subcutaneously 5 weeks prior to surgery. | |
| Outcomes | Operative complications; post‐operative recovery; relief of menstrual and other symptoms; need for further surgical treatment; satisfaction with treatment; differential resource use. | |
| Notes | Recruitment of participants took place over 2 different time periods. 105 women were randomised to ELA or TCRE for an earlier study. After a gap of 8 months, an additional 267 women were recruited. | |
| Risk of bias | ||
| Bias | Authors' judgement | Support for judgement |
| Adequate sequence generation? | Low risk | Computer generated |
| Allocation concealment? | Low risk | Numbered sealed opaque envelopes stratified per consultant |
| Blinding? | High risk | Open study |
| Incomplete outcome data addressed? | High risk | Different numbers of participants provided data for different outcomes; 366/372 for operative details, 321/372 for satisfaction; 306/372 for menstrual loss. |
| Free of selective reporting? | Unclear risk | No prior published protocol identified |
| Free of other bias? | Unclear risk | Recruitment of participants over 2 different time period and the 2 groups differed in baseline characteristics. 15% of one group crossed over to the other treatment but analyses were undertaken according to randomised group. |
| Methods | Randomisation: computer generated at a 2:1 ratio with opaque sealed envelopes. | |
| Participants | 126 women with mean age 43 years, recruited from a large teaching hospital (500 beds) in the Netherlands. | |
| Interventions | (1) Novasure endometrial ablation | |
| Outcomes | Primary: | |
| Notes | A technical failure with the Novasure generator part way during the trial. As a result, 2 analyses were performed: | |
| Risk of bias | ||
| Bias | Authors' judgement | Support for judgement |
| Adequate sequence generation? | Low risk | Computer generated |
| Allocation concealment? | Low risk | Opaque sealed envelopes |
| Blinding? | Low risk | Participants and coordinator of follow up |
| Incomplete outcome data addressed? | Low risk | Minimal loss to follow up over 5 years (6/126) |
| Free of selective reporting? | Unclear risk | No prior published protocol identified |
| Free of other bias? | Unclear risk | Support to trial by medical equipment company. At baseline, more women (16%) in the bipolar group had a retroverted uterus when compared with women (9%) in the balloon group. |
| Methods | Randomisation: Geigy random numbers in sealed envelopes (even=coagulation, uneven=resection). | |
| Participants | 120 women aged >35 years (mean coagulation 42.6, mean resection 44.8) recruited from an unreported location. | |
| Interventions | (1) Transcervical hysteroscopic endometrial coagulation (n=61) | |
| Outcomes | Primary: rate of hysterectomy 5 and 10 years later; days with bleeding; would they recommend treatment. | |
| Notes | ||
| Risk of bias | ||
| Bias | Authors' judgement | Support for judgement |
| Adequate sequence generation? | Low risk | Documenta Geigy random numbers; even numbers rollerball, odd numbers TCRE |
| Allocation concealment? | Low risk | Numbered sealed envelopes opened just prior to surgery |
| Blinding? | High risk | Unlikely |
| Incomplete outcome data addressed? | Low risk | True intention to treat analysis. No dropouts for assessment of primary outcomes |
| Free of selective reporting? | Unclear risk | No prior published protocol identified |
| Free of other bias? | Low risk | Groups balanced at baseline. |
| Methods | Randomisation: computer generated telephone number sequence in a 1:1 allocation ratio. Parallel group randomised trial in 6 centres in France, blinding unlikely. Number of women randomised: 62 Number of women analysed: 45 at 12 months (1 in Cavaterm group and 8 in TCRE group were excluded prior to treatment mostly because of non eligibility; 1 in each group decided to withdraw before treatment; of the remaining 51 treated women, 2 in TCRE group withdrawn because of menopause and pulmonary embolism and 2 in Cavaterm group because of loss to follow up) Power calculation for sample size (26 participants in each arm for 80% power to detect 42% difference in amenorrhoea rate between groups). Analysis not by intention to treat and randomisation unbalanced after withdrawals. Source of funding: Wallsten (a medical equipment company in Switzerland) acknowledged for technical assistance ‐ unknown whether funding provided. | |
| Participants | 62 women with a median age of 45 years (Cavaterm) and 46 years (TCRE) recruited between Feb 2000 and Dec 2001 from departments of Obstetrics and Gynaecology in university hospitals in France (6 centres) Inclusion: women with menorrhagia unresponsive to medical treatment requesting conservative surgical management; no longer wishing to become pregnant; Higham blood loss score >100; internal uterine cavity length 4‐12cm; normal endometrial biopsy; normal cervical cytology; completed family; using a reliable method of contraception Exclusion: endometrial malignancy; active pelvic infection; submucous fibroids; polyps; uterine malformation; history of endometrial ablation; hormone treatment (GnRHa or danazol) in previous 6 months | |
| Interventions | (1) Cavaterm thermal balloon ablation (2) Transcervical resection of the endometrium (TCRE) Duration: 6 and 12 month follow up | |
| Outcomes | Primary: amenorrhoea rates; PBAC scores Secondary: satisfaction; safety (technical complication rate, duration of surgery; clinical complications (intra and postoperative); pain scores; hospital stay' resumption of normal or work activities; additional surgery | |
| Notes | ||
| Risk of bias | ||
| Bias | Authors' judgement | Support for judgement |
| Adequate sequence generation? | Low risk | Computer generated telephone number sequence in 1:1 allocation ratio |
| Allocation concealment? | Low risk | Centralised system |
| Blinding? | High risk | Unlikely |
| Incomplete outcome data addressed? | High risk | Withdrawals unbalanced between groups ‐ created unbalanced randomisation |
| Free of selective reporting? | Unclear risk | No prior protocol identified; not clear whether all adverse effects reported |
| Free of other bias? | High risk | Menstrual blood loss higher in the Cavaterm group at baseline. Medical equipment company acknowledged ‐ not sure if they provided funding. |
| Methods | Randomisation: | |
| Participants | 263 women with mean age 41 years, recruited from gynaecology outpatient department of Aberdeen Royal Infirmary (referred for surgery) between Sept 1996 and February 1998. | |
| Interventions | Endometrial thinning with goserelin 3.6 mg 5 weeks prior to surgery for all women | |
| Outcomes | Primary: | |
| Notes | ||
| Risk of bias | ||
| Bias | Authors' judgement | Support for judgement |
| Adequate sequence generation? | Low risk | Computer generated random number tables in balanced blocks of 20 |
| Allocation concealment? | Low risk | Sealed opaque envelopes opened by an independent person |
| Blinding? | High risk | Unlikely |
| Incomplete outcome data addressed? | Low risk | Total dropouts 23/263 for menstrual and satisfaction outcomes ‐ balanced between groups and unlikely to affect estimates |
| Free of selective reporting? | Unclear risk | No prior published protocol identified |
| Free of other bias? | Unclear risk | Funding by medical equipment company |
| Methods | Randomisation: list of random numbers for each site (separate for <40 and >40). | |
| Participants | 265 women aged 25 ‐ 50 recruited from centres in the USA. | |
| Interventions | (1) Novasure Impedance ‐ controlled endometrial oblation | |
| Outcomes | Pictorial blood loss assessment chart; procedure time; sedation; intraoperative adverse events / postop adverse effects | |
| Notes | ||
| Risk of bias | ||
| Bias | Authors' judgement | Support for judgement |
| Adequate sequence generation? | Low risk | List of random numbers |
| Allocation concealment? | Unclear risk | Not reported |
| Blinding? | Unclear risk | Unlikely |
| Incomplete outcome data addressed? | Unclear risk | All participants contributed data for safety outcomes but for other outcomes there was a 13% lost to follow up with no details reported |
| Free of selective reporting? | Unclear risk | No prior published protocol identified |
| Free of other bias? | Unclear risk | Groups appeared balanced at baseline but funding by medical equipment company |
| Methods | Randomisation: computer generated random numbers in a 2:1 ratio. | |
| Participants | 322 women with mean age 41 years recruited from 5 centres in the USA, 2 centres in Canada and 1 centre in the UK (academic medical centres and private medical practices). | |
| Interventions | (1) Microwave ablation All women had prior investigations with ultrasound, endometrial biopsy and pap smear All women had pre treatment with GnRHa for 1 month Duration: 12 months | |
| Outcomes | Primary: | |
| Notes | Women were stratified into 2 groups: <40 years and >/=40 years | |
| Risk of bias | ||
| Bias | Authors' judgement | Support for judgement |
| Adequate sequence generation? | Low risk | Computer generated random numbers |
| Allocation concealment? | Unclear risk | Not reported |
| Blinding? | Unclear risk | Not reported |
| Incomplete outcome data addressed? | Low risk | True intention to treat analysis for primary outcomes; dropouts regarded as failures |
| Free of selective reporting? | Unclear risk | No prior published protocol identified |
| Free of other bias? | Unclear risk | Authors were either employees, consultants/speakers for or owned stock in a medical equipment company that produced one of the interventions |
| Methods | Randomisation: Allocation computerised using sealed individual envelopes. | |
| Participants | 276 women aged from 30 to 49 years recruited from 8 centres (7 in the USA, 1 in Australia). | |
| Interventions | All participants were initially treated with 2 weeks of oral contraceptive pills and their randomised treatment followed immediately after withdrawal bleeding. | |
| Outcomes | PBAC scores post Rx | |
| Notes | ||
| Risk of bias | ||
| Bias | Authors' judgement | Support for judgement |
| Adequate sequence generation? | Low risk | Computerised random number sequence |
| Allocation concealment? | Low risk | Sealed individual envelopes |
| Blinding? | High risk | Unlikely |
| Incomplete outcome data addressed? | Unclear risk | 42/276 (15%) participants lost at assessment of outcomes at 12 months follow up ‐ no reasons given. For assessment of operative outcomes 21/276 participants lost. |
| Free of selective reporting? | Unclear risk | No prior protocol identified |
| Free of other bias? | Unclear risk | Funding by medical equipment company that produces one of the interventions and some of the authors received stocks in the company |
| Methods | Randomisation: In blocks of 12 stratified by site with a 2:1 ratio, | |
| Participants | 276 women aged 30 ‐ 50 years recruited from 9 private practice and university centres in the USA. | |
| Interventions | All participants had endometrial biopsy and cervical cytology to exclude pathology and endometrial preparation (single injection of depot leuprolide acetate 7.5 mg on day 21 of cycle) and a pregnancy test. | |
| Outcomes | Reduction in menstrual diary blood loss scores; success of treatment (PBAC score <75); amenorrhoea rates; quality of life scores; adverse events; need for further surgery; operative complications; need for analgesia. | |
| Notes | ||
| Risk of bias | ||
| Bias | Authors' judgement | Support for judgement |
| Adequate sequence generation? | Low risk | Block randomisation stratified by site |
| Allocation concealment? | Unclear risk | Not reported |
| Blinding? | High risk | Unlikely |
| Incomplete outcome data addressed? | Unclear risk | 26/276 (9%) lost at 12 months ‐ unbalanced between groups and no reasons given. Authors claimed intention to treat analyses but not for all randomised participants. Dropouts regarded as failures. |
| Free of selective reporting? | Unclear risk | No prior published protocol identified |
| Free of other bias? | Unclear risk | Groups appeared balanced at baseline but funding provided by medical equipment company that produced one of the interventions |
| Methods | Randomisation: sealed envelopes stratified for age at a ratio of 2:1. | |
| Participants | 279 women aged 30 ‐ 50 years (mean EC 41.2(5.1) & RBE 41.1(4.8)) recruited from university and private medical centres in the USA. | |
| Interventions | (1) Endometrial Cryoablation (n=193) | |
| Outcomes | Menstrual diaries 1 cycle before and 12 months after; PBAC, bleeding, pain, mood, PMS; QOL ‐ Dartmouth COOP assessment questionnaire, anaesthesia, adverse outcomes, satisfaction; those randomised to cryoablation had significantly worse menorrhagia. | |
| Notes | ||
| Risk of bias | ||
| Bias | Authors' judgement | Support for judgement |
| Adequate sequence generation? | Unclear risk | Method not reported |
| Allocation concealment? | Unclear risk | Sealed envelopes but no other details of how allocation concealed |
| Blinding? | High risk | Unlikely |
| Incomplete outcome data addressed? | Unclear risk | 51/279 (18%) dropouts for outcomes measured at 12 months ‐ no reasons given or details on distribution per group |
| Free of selective reporting? | Unclear risk | No prior published protocol identified |
| Free of other bias? | Unclear risk | Participants receiving cryoablation had higher PBAC scores at baseline. Authors consultants for the medical equipment company that provided funding for cryoablation |
| Methods | Randomisation: random permutated blocks predetermined by computer generated random number tables (blocks of four sequentially numbered envelopes). | |
| Participants | 72 women aged 29 ‐ 51 years (mean cav 41.4, mean laser 41.1) recruited from a minimal access gynae surgery unit in a district general hospital. | |
| Interventions | (1) Cavatern thermal balloon endometrial ablation (n=37) | |
| Outcomes | Primary:amenorrhoea rate then effect on menstrual status; questionnaire assessing menstrual symptoms, QOL, sexual activity; procedure satisfaction & acceptability‐ included questionnaire EQ‐51, SF‐12, SAQ; VAS; pain VAS; operative details & morbidity | |
| Notes | ||
| Risk of bias | ||
| Bias | Authors' judgement | Support for judgement |
| Adequate sequence generation? | Low risk | Random permutated blocks predetermined by computer generated random number tables (blocks of four sequentially numbered envelopes) |
| Allocation concealment? | Low risk | Sequentially numbered envelopes |
| Blinding? | Low risk | Participants, nursing staff, GP and assessor of outcomes |
| Incomplete outcome data addressed? | Low risk | 1 participant excluded after randomisation because she didn't meet the inclusion criteria; 4 other participants lost by 12 months ‐ unlikely to affect assessment of outcomes |
| Free of selective reporting? | Unclear risk | No prior published protocol identified |
| Free of other bias? | Unclear risk | Groups appeared balanced at baseline except for cavity length but difference unlikely to be clinically significant. A medical equipment company provided one of the interventions. |
| Methods | Randomisation: method not stated and allocation concealment not reported. | |
| Participants | 38 women initially recruited for trial, mean age 42 years, from tertiary referral centre at University Department, Monash University. | |
| Interventions | All participants had pelvic examination and transvaginal ultrasonography. Those randomised also had preoperative treatment with 10 mg MPA 3 times/day for 3 months to thin the endometrium. | |
| Outcomes | Reduction in MBL; duration of surgery; post operative complications and requirement for analgesia; need for further surgery; amenorrhoea rate. | |
| Notes | ||
| Risk of bias | ||
| Bias | Authors' judgement | Support for judgement |
| Adequate sequence generation? | Unclear risk | Method not stated |
| Allocation concealment? | Unclear risk | Not reported |
| Blinding? | High risk | Unlikely |
| Incomplete outcome data addressed? | Low risk | No dropouts reported but very small study |
| Free of selective reporting? | Unclear risk | No prior published protocol identified |
| Free of other bias? | Low risk | No evidence of other biases. Source of funding not reported and groups appeared balanced at baseline |
| Methods | Randomisation: random numbers table in a 1:1 allocation ratio. | |
| Participants | 275 women aged 29 to 50 years recruited from 12 investigative centres in USA and 2 in Canada. | |
| Interventions | Rx 1: Rollerball ablation | |
| Outcomes | Satisfaction rate | |
| Notes | ||
| Risk of bias | ||
| Bias | Authors' judgement | Support for judgement |
| Adequate sequence generation? | Low risk | Random numbers table |
| Allocation concealment? | Unclear risk | Not reported |
| Blinding? | Unclear risk | Unlikely |
| Incomplete outcome data addressed? | Low risk | 20/275 (7%) withdrew prior to surgery. 239/275 (87%) provided data at 12 months follow up. Authors compared characteristics of original randomised group with the group that provided 6 and 12 month data and found no differences. Reasons not provided for loss to follow up. |
| Free of selective reporting? | Unclear risk | No prior published protocol identified |
| Free of other bias? | Unclear risk | Funding provided by medical equipment company |
| Methods | Randomisation: order in which seen in the clinic Single centre study, parallel group, with unclear blinding (except for histopathologist who assessed outcomes not extracted for this review) Number of women randomised: n=48 Number of women analysed: n=45 (reasons not given for dropouts) No power calculation for sample size and intention to treat analysis not reported Source of funding: Akdeniz University | |
| Participants | 48 women with average age 48yrs and 47 yrs recruited from hospital clinic in Turkey Inclusion criteria: women with heavy menstrual bleeding in the absence of physical abnormality Exclusion criteria: intrauterine disease diagnosed at hysteroscopy (polyps, myomata, adenomyosis) | |
| Interventions | Rx 1: Rollerball Rx 2: TCRE Duration: not reported | |
| Outcomes | Duration of surgery Menstrual blood loss | |
| Notes | Quasi‐randomised trial | |
| Risk of bias | ||
| Bias | Authors' judgement | Support for judgement |
| Adequate sequence generation? | High risk | Participants randomised in order at which seen in the clinic ‐ this has the potential for significant bias |
| Allocation concealment? | High risk | Not reported but very likely allocation known to investigators |
| Blinding? | High risk | Unlikely |
| Incomplete outcome data addressed? | Low risk | 3 dropouts ‐ unlikely to affect calculation of estimates |
| Free of selective reporting? | Unclear risk | No prior published protocol identified |
| Free of other bias? | Low risk | No evidence of other significant bias ‐ groups appeared balanced at baseline and funding not reported |
| Methods | Randomisation: Computer generated randomisation sequence. | |
| Participants | 82 women with mean age 43 yrs recruited from University of Naples Obs and Gyn Department (Italy). | |
| Interventions | (1) Cavaterm balloon ablation | |
| Outcomes | Primary: satisfaction rate at 3 months, 1 yr and 2 yrs. | |
| Notes | ||
| Risk of bias | ||
| Bias | Authors' judgement | Support for judgement |
| Adequate sequence generation? | Low risk | Computer generated |
| Allocation concealment? | Unclear risk | Not reported |
| Blinding? | High risk | Unlikely |
| Incomplete outcome data addressed? | Unclear risk | Assessment of some outcomes such as requirement for further surgery and satisfaction included all randomised participants. 8.5% had dropped out for assessment of year 1 outcomes; 17% had dropped out for assessment of year 2 outcomes. No reasons given. |
| Free of selective reporting? | Unclear risk | No prior published protocol identified |
| Free of other bias? | Unclear risk | Groups appeared balanced at baseline; funding by medical equipment company |
| Methods | Randomisation: Computer generated list. | |
| Participants | 116 women with age range 36 to 48 years (mean, 41‐42) recruited from university clinic in Italy. | |
| Interventions | (1) ELITT (endometrial laser intrauterine thermal therapy) | |
| Outcomes | Primary: | |
| Notes | ||
| Risk of bias | ||
| Bias | Authors' judgement | Support for judgement |
| Adequate sequence generation? | Low risk | Computer generated |
| Allocation concealment? | Unclear risk | Not reported |
| Blinding? | High risk | Unlikely |
| Incomplete outcome data addressed? | Low risk | 5/116 (4%) dropped out and no reasons given, but proportion was balanced between randomised groups |
| Free of selective reporting? | Unclear risk | No prior published protocol identified |
| Free of other bias? | Low risk | Groups appeared balanced at baseline but characteristics only reported for 96% of those randomised (minimal dropout). No source of funding reported. No evidence of significant other bias. |
| Methods | Randomisation: Method not stated. | |
| Participants | 20 women aged 35 to 52 recruited. | |
| Interventions | All women were pre‐treated with 2 injections (4 weeks apart) of leuprorelin acetate depot. Treatment followed 2 weeks after the last injection. | |
| Outcomes | Satisfaction rate | |
| Notes | Paper in German language. Author contacted for clarification but no reply received. | |
| Risk of bias | ||
| Bias | Authors' judgement | Support for judgement |
| Adequate sequence generation? | Unclear risk | Not reported |
| Allocation concealment? | Unclear risk | Not reported |
| Blinding? | High risk | Unlikely |
| Incomplete outcome data addressed? | Low risk | No dropouts reported but very small study |
| Free of selective reporting? | Unclear risk | No prior published protocol identified |
| Free of other bias? | Low risk | Groups appear balanced at baseline. No source of funding reported. No evidence of other significant bias |
| Methods | Randomisation: computer generated, numbered opaque sealed envelopes. | |
| Participants | 96 women aged 40 ‐ 49 years (mean TBA 43.6, mean RBA 44.3) recruited from the Teaching Dept of University Medical Centre. | |
| Interventions | (1) Rollerball Ablation (n=48) | |
| Outcomes | Operating time; intraoperative complications; post op pain; eumenorrhea & PBAC = 75 / satisfaction / hysterectomy | |
| Notes | ||
| Risk of bias | ||
| Bias | Authors' judgement | Support for judgement |
| Adequate sequence generation? | Low risk | Computer generated |
| Allocation concealment? | Low risk | Numbered opaque sealed envelopes |
| Blinding? | High risk | Unlikely |
| Incomplete outcome data addressed? | Low risk | 3/96 (3%) lost prior to surgery but no further loss to follow up ‐ unlikely to affect the assessment of estimates |
| Free of selective reporting? | Unclear risk | No prior published protocol identified |
| Free of other bias? | Unclear risk | No source of funding identified. Groups appeared balanced at baseline but denominators for some outcomes in the publication did not correspond to the numbers of participants allocated to treatment |
| Methods | Randomisation: allocated to treatment at random by blind envelope. | |
| Participants | 139 women with unreported ages recruited from a teaching hospital, in the Netherlands. | |
| Interventions | (1) RBE Hysteroscopic Rollerball Electrocoagulation (n=62) | |
| Outcomes | Technical safety aspects; reduction in menstrual bleeding; not much outcome data ‐ menstrual bleeding data not reported in this paper | |
| Notes | ||
| Risk of bias | ||
| Bias | Authors' judgement | Support for judgement |
| Adequate sequence generation? | Unclear risk | Method not reported |
| Allocation concealment? | Unclear risk | Not reported |
| Blinding? | High risk | Unlikely |
| Incomplete outcome data addressed? | Low risk | No dropouts reported |
| Free of selective reporting? | Unclear risk | No prior published protocol identified |
| Free of other bias? | Unclear risk | Groups appeared balanced at baseline but only for age and cavity length; other characteristics not reported. No source of funding identified. Numbers in the randomised groups differed substantially. |
| Methods | R: Computer generated randomisation sequence using serially numbered opaque sealed envelopes kept by an independent source. | |
| Participants | 91 women with mean age 46 years recruited from outpatient clinic in Milan, Italy. | |
| Interventions | All participants had complete clinical examination, transvaginal ultrasonography, diagnostic hysteroscopy and endometrial biopsy prior to treatment. They also had preoperative treatment with depot GnRH agonist triptorelin for 2 months. | |
| Outcomes | Amount of absorption of distension fluid | |
| Notes | ||
| Risk of bias | ||
| Bias | Authors' judgement | Support for judgement |
| Adequate sequence generation? | Low risk | Computer generated |
| Allocation concealment? | Low risk | Serially numbered opaque sealed envelopes kept secure in another location |
| Blinding? | High risk | Open study |
| Incomplete outcome data addressed? | Low risk | Immediate postoperative outcomes included all randomised participants; for outcomes assessed at 1 year, one woman was lost to follow up and did not contribute data to the PBAC |
| Free of selective reporting? | Unclear risk | No prior published protocol identified |
| Free of other bias? | Unclear risk | Groups were balanced at baseline but a medical equipment company provided funding |
Characteristics of excluded studies [ordered by study ID]
| Study | Reason for exclusion |
| Was excluded as it compared two types of balloon ablation, Menotreat and Cavaterm. |
Characteristics of studies awaiting assessment [ordered by study ID]
| Methods | RCT |
| Participants | |
| Interventions | |
| Outcomes | |
| Notes |
| Methods | Not clear whether randomised |
| Participants | No details provided |
| Interventions | 1) Thermablate EAS uterine balloon therapy, 2) transcervical resection of the endometrium (TCRE) |
| Outcomes | Complications, menstrual blood loss, pain scores, dysmenorrhoea |
| Notes |
| Methods | Not clear whether randomised |
| Participants | Participants had dysfunctional uterine bleeding |
| Interventions | 1) rollerball ablation, 2) TCRE |
| Outcomes | Complications, menstrual blood loss |
| Notes |
| Methods | RCT |
| Participants | |
| Interventions | |
| Outcomes | |
| Notes |
| Methods | RCT |
| Participants | |
| Interventions | |
| Outcomes | |
| Notes |
| Methods | RCT |
| Participants | |
| Interventions | |
| Outcomes | |
| Notes |
Data and analyses
| Outcome or subgroup title | No. of studies | No. of participants | Statistical method | Effect size | ||||||||||||
| 1 Amenorrhoea rate Show forest plot | 2 | Odds Ratio (M‐H, Fixed, 95% CI) | Subtotals only | |||||||||||||
| Analysis 1.1  Comparison 1 LASER ABLATION (1st G) versus TCRE (1st G), Outcome 1 Amenorrhoea rate. | ||||||||||||||||
| 1.1 At 6 months | 2 | 348 | Odds Ratio (M‐H, Fixed, 95% CI) | 0.97 [0.58, 1.61] | ||||||||||||
| 1.2 At 12 months | 1 | 306 | Odds Ratio (M‐H, Fixed, 95% CI) | 1.07 [0.63, 1.83] | ||||||||||||
| 2 Amenorrhoea/hypomenorrhoea rate Show forest plot | 1 | Odds Ratio (M‐H, Fixed, 95% CI) | Subtotals only | |||||||||||||
| Analysis 1.2  Comparison 1 LASER ABLATION (1st G) versus TCRE (1st G), Outcome 2 Amenorrhoea/hypomenorrhoea rate. | ||||||||||||||||
| 2.1 At 6 months | 1 | 326 | Odds Ratio (M‐H, Fixed, 95% CI) | 0.78 [0.41, 1.48] | ||||||||||||
| 2.2 At 12 months | 1 | 306 | Odds Ratio (M‐H, Fixed, 95% CI) | 1.21 [0.74, 1.98] | ||||||||||||
| 3 MBL at 6 months (descriptive data) Show forest plot | Other data | No numeric data | ||||||||||||||
| Analysis 1.3
Comparison 1 LASER ABLATION (1st G) versus TCRE (1st G), Outcome 3 MBL at 6 months (descriptive data). | ||||||||||||||||
| 4 Participant satisfaction at 12 months (very/moderately) Show forest plot | 1 | 321 | Odds Ratio (M‐H, Fixed, 95% CI) | 0.88 [0.43, 1.82] | ||||||||||||
| Analysis 1.4  Comparison 1 LASER ABLATION (1st G) versus TCRE (1st G), Outcome 4 Participant satisfaction at 12 months (very/moderately). | ||||||||||||||||
| 5 Duration of operation (mins) Show forest plot | 2 | 386 | Mean Difference (IV, Fixed, 95% CI) | 9.15 [7.21, 11.09] | ||||||||||||
| Analysis 1.5  Comparison 1 LASER ABLATION (1st G) versus TCRE (1st G), Outcome 5 Duration of operation (mins). | ||||||||||||||||
| 6 Operative difficulties (%) Show forest plot | 1 | Odds Ratio (M‐H, Fixed, 95% CI) | Subtotals only | |||||||||||||
| Analysis 1.6  Comparison 1 LASER ABLATION (1st G) versus TCRE (1st G), Outcome 6 Operative difficulties (%). | ||||||||||||||||
| 6.1 Procedure abandoned | 1 | 366 | Odds Ratio (M‐H, Fixed, 95% CI) | 1.5 [0.60, 3.76] | ||||||||||||
| 6.2 Failed instrumentation | 1 | 366 | Odds Ratio (M‐H, Fixed, 95% CI) | 0.19 [0.01, 4.06] | ||||||||||||
| 6.3 Equipment failure | 1 | 366 | Odds Ratio (M‐H, Fixed, 95% CI) | 6.00 [1.73, 20.86] | ||||||||||||
| 6.4 Immediate hysterectomy | 1 | 366 | Odds Ratio (M‐H, Fixed, 95% CI) | 0.32 [0.01, 8.01] | ||||||||||||
| 7 Good general health (proportion of women) Show forest plot | 1 | 321 | Odds Ratio (M‐H, Fixed, 95% CI) | 1.30 [0.65, 2.58] | ||||||||||||
| Analysis 1.7  Comparison 1 LASER ABLATION (1st G) versus TCRE (1st G), Outcome 7 Good general health (proportion of women). | ||||||||||||||||
| 8 Improvement in symptoms (proportion of women) Show forest plot | 1 | 321 | Odds Ratio (M‐H, Fixed, 95% CI) | 1.08 [0.68, 1.71] | ||||||||||||
| Analysis 1.8  Comparison 1 LASER ABLATION (1st G) versus TCRE (1st G), Outcome 8 Improvement in symptoms (proportion of women). | ||||||||||||||||
| 9 Improvement in dysmenorrhea Show forest plot | 1 | Odds Ratio (M‐H, Fixed, 95% CI) | Subtotals only | |||||||||||||
| Analysis 1.9  Comparison 1 LASER ABLATION (1st G) versus TCRE (1st G), Outcome 9 Improvement in dysmenorrhea. | ||||||||||||||||
| 9.1 At 6 months follow up | 1 | 253 | Odds Ratio (M‐H, Fixed, 95% CI) | 1.72 [0.99, 2.97] | ||||||||||||
| 9.2 At 12 months follow up | 1 | 218 | Odds Ratio (M‐H, Fixed, 95% CI) | 1.01 [0.53, 1.92] | ||||||||||||
| 10 Complication rate (proportion of women) Show forest plot | 2 | Odds Ratio (M‐H, Fixed, 95% CI) | Subtotals only | |||||||||||||
| Analysis 1.10  Comparison 1 LASER ABLATION (1st G) versus TCRE (1st G), Outcome 10 Complication rate (proportion of women). | ||||||||||||||||
| 10.1 Perforation | 1 | 366 | Odds Ratio (M‐H, Fixed, 95% CI) | 0.14 [0.01, 2.68] | ||||||||||||
| 10.2 Burns | 1 | 366 | Odds Ratio (M‐H, Fixed, 95% CI) | 4.95 [0.24, 103.73] | ||||||||||||
| 10.3 Bowel obstruction | 1 | 366 | Odds Ratio (M‐H, Fixed, 95% CI) | 2.95 [0.12, 72.92] | ||||||||||||
| 10.4 Urinary tract infection | 1 | 366 | Odds Ratio (M‐H, Fixed, 95% CI) | 1.98 [0.36, 10.93] | ||||||||||||
| 10.5 Pelvic sepsis | 1 | 366 | Odds Ratio (M‐H, Fixed, 95% CI) | 0.81 [0.24, 2.70] | ||||||||||||
| 10.6 Haematometra | 1 | 366 | Odds Ratio (M‐H, Fixed, 95% CI) | 0.19 [0.01, 4.06] | ||||||||||||
| 10.7 Glycine toxicity | 1 | 22 | Odds Ratio (M‐H, Fixed, 95% CI) | 5.0 [0.21, 117.21] | ||||||||||||
| 10.8 Fluid overload (>1.5L) | 1 | 366 | Odds Ratio (M‐H, Fixed, 95% CI) | 5.24 [1.49, 18.41] | ||||||||||||
| 10.9 Uterine tamponade | 1 | 366 | Odds Ratio (M‐H, Fixed, 95% CI) | 1.15 [0.38, 3.48] | ||||||||||||
| 11 Requirement for further surgical treatment (within 12 mths) Show forest plot | 2 | 388 | Odds Ratio (M‐H, Fixed, 95% CI) | 0.81 [0.48, 1.36] | ||||||||||||
| Analysis 1.11  Comparison 1 LASER ABLATION (1st G) versus TCRE (1st G), Outcome 11 Requirement for further surgical treatment (within 12 mths). | ||||||||||||||||
| Outcome or subgroup title | No. of studies | No. of participants | Statistical method | Effect size | ||||||||||||
| 1 Amenorrhoea rate at 12 months follow up Show forest plot | 1 | 91 | Odds Ratio (M‐H, Fixed, 95% CI) | 0.62 [0.27, 1.44] | ||||||||||||
| Analysis 2.1  Comparison 2 VAPORISING ELECTRODE ABLATION (1st G) versus TCRE (1st G), Outcome 1 Amenorrhoea rate at 12 months follow up. | ||||||||||||||||
| 2 Amenorrhea/hypomenorrhoea rate at 12 months follow up Show forest plot | 1 | 91 | Odds Ratio (M‐H, Fixed, 95% CI) | 0.95 [0.35, 2.62] | ||||||||||||
| Analysis 2.2  Comparison 2 VAPORISING ELECTRODE ABLATION (1st G) versus TCRE (1st G), Outcome 2 Amenorrhea/hypomenorrhoea rate at 12 months follow up. | ||||||||||||||||
| 3 PBAC score at 12 mths Show forest plot | Other data | No numeric data | ||||||||||||||
| Analysis 2.3
Comparison 2 VAPORISING ELECTRODE ABLATION (1st G) versus TCRE (1st G), Outcome 3 PBAC score at 12 mths. | ||||||||||||||||
| 4 Satisfaction rate at 12 mths (very/moderately) Show forest plot | 1 | 91 | Odds Ratio (M‐H, Fixed, 95% CI) | 1.65 [0.26, 10.35] | ||||||||||||
| Analysis 2.4  Comparison 2 VAPORISING ELECTRODE ABLATION (1st G) versus TCRE (1st G), Outcome 4 Satisfaction rate at 12 mths (very/moderately). | ||||||||||||||||
| 5 Duration of operation (mins) Show forest plot | 1 | 91 | Mean Difference (IV, Fixed, 95% CI) | ‐1.50 [‐2.65, ‐0.35] | ||||||||||||
| Analysis 2.5  Comparison 2 VAPORISING ELECTRODE ABLATION (1st G) versus TCRE (1st G), Outcome 5 Duration of operation (mins). | ||||||||||||||||
| 6 Operative difficulties Show forest plot | 1 | 91 | Odds Ratio (M‐H, Fixed, 95% CI) | 0.22 [0.07, 0.75] | ||||||||||||
| Analysis 2.6  Comparison 2 VAPORISING ELECTRODE ABLATION (1st G) versus TCRE (1st G), Outcome 6 Operative difficulties. | ||||||||||||||||
| 6.1 Difficulty with surgery (moderate or severe) | 1 | 91 | Odds Ratio (M‐H, Fixed, 95% CI) | 0.22 [0.07, 0.75] | ||||||||||||
| 7 Degree of fluid deficit (ml) Show forest plot | 1 | 91 | Mean Difference (IV, Fixed, 95% CI) | ‐258.0 [‐342.05, ‐173.95] | ||||||||||||
| Analysis 2.7  Comparison 2 VAPORISING ELECTRODE ABLATION (1st G) versus TCRE (1st G), Outcome 7 Degree of fluid deficit (ml). | ||||||||||||||||
| Outcome or subgroup title | No. of studies | No. of participants | Statistical method | Effect size | ||||||||||||
| 1 Duration of operation (mins) Show forest plot | 1 | 45 | Mean Difference (IV, Fixed, 95% CI) | ‐1.10 [‐2.92, 0.72] | ||||||||||||
| Analysis 3.1  Comparison 3 ROLLERBALL (1st G) versus TCRE (1st G), Outcome 1 Duration of operation (mins). | ||||||||||||||||
| 2 Duration of operation (descriptive data) Show forest plot | Other data | No numeric data | ||||||||||||||
| Analysis 3.2
Comparison 3 ROLLERBALL (1st G) versus TCRE (1st G), Outcome 2 Duration of operation (descriptive data). | ||||||||||||||||
| 3 Complication rate Show forest plot | 1 | Odds Ratio (M‐H, Fixed, 95% CI) | Subtotals only | |||||||||||||
| Analysis 3.3  Comparison 3 ROLLERBALL (1st G) versus TCRE (1st G), Outcome 3 Complication rate. | ||||||||||||||||
| 3.1 Fluid deficit | 1 | 120 | Odds Ratio (M‐H, Fixed, 95% CI) | 0.32 [0.01, 7.94] | ||||||||||||
| 3.2 Perforation | 1 | 120 | Odds Ratio (M‐H, Fixed, 95% CI) | 0.32 [0.01, 7.94] | ||||||||||||
| 4 Requirement for further surgery (hyst or ablation) Show forest plot | 1 | Odds Ratio (M‐H, Fixed, 95% CI) | Subtotals only | |||||||||||||
| Analysis 3.4  Comparison 3 ROLLERBALL (1st G) versus TCRE (1st G), Outcome 4 Requirement for further surgery (hyst or ablation). | ||||||||||||||||
| 4.1 At 2 yrs follow up | 1 | 120 | Odds Ratio (M‐H, Fixed, 95% CI) | 1.05 [0.45, 2.42] | ||||||||||||
| 4.2 2 to 5 yrs follow up | 1 | 120 | Odds Ratio (M‐H, Fixed, 95% CI) | 1.31 [0.60, 2.87] | ||||||||||||
| 4.3 More than 5 years | 1 | 120 | Odds Ratio (M‐H, Fixed, 95% CI) | 1.63 [0.75, 3.52] | ||||||||||||
| 5 Requirement for further surgery rate (hyst only) Show forest plot | 1 | Odds Ratio (M‐H, Fixed, 95% CI) | Subtotals only | |||||||||||||
| Analysis 3.5  Comparison 3 ROLLERBALL (1st G) versus TCRE (1st G), Outcome 5 Requirement for further surgery rate (hyst only). | ||||||||||||||||
| 5.1 At 2 yrs follow up | 1 | 120 | Odds Ratio (M‐H, Fixed, 95% CI) | 1.5 [0.40, 5.61] | ||||||||||||
| 5.2 2 to 5 yrs follow up | 1 | 120 | Odds Ratio (M‐H, Fixed, 95% CI) | 1.25 [0.46, 3.42] | ||||||||||||
| 5.3 More than 5 years follow up | 1 | 120 | Odds Ratio (M‐H, Fixed, 95% CI) | 1.42 [0.59, 3.42] | ||||||||||||
| Outcome or subgroup title | No. of studies | No. of participants | Statistical method | Effect size |
| 1 Amenorrhoea rate Show forest plot | 1 | Odds Ratio (M‐H, Fixed, 95% CI) | Subtotals only | |
| Analysis 4.1  Comparison 4 THERMAL LASER (2nd G) versus TCRE (1st G), Outcome 1 Amenorrhoea rate. | ||||
| 1.1 At 1 year follow up | 1 | 111 | Odds Ratio (M‐H, Fixed, 95% CI) | 4.88 [2.17, 11.00] |
| 1.2 2 to 5 years follow up | 1 | 111 | Odds Ratio (M‐H, Fixed, 95% CI) | 4.64 [2.04, 10.51] |
| 2 Satisfaction rate Show forest plot | 1 | Odds Ratio (M‐H, Fixed, 95% CI) | Subtotals only | |
| Analysis 4.2  Comparison 4 THERMAL LASER (2nd G) versus TCRE (1st G), Outcome 2 Satisfaction rate. | ||||
| 2.1 At one year follow up | 1 | 111 | Odds Ratio (M‐H, Fixed, 95% CI) | 1.77 [0.40, 7.78] |
| 2.2 2 to 5 years follow up | 1 | 111 | Odds Ratio (M‐H, Fixed, 95% CI) | 1.3 [0.33, 5.12] |
| 3 Duration of operation Show forest plot | 1 | 111 | Mean Difference (IV, Fixed, 95% CI) | ‐9.30 [‐11.36, ‐7.24] |
| Analysis 4.3  Comparison 4 THERMAL LASER (2nd G) versus TCRE (1st G), Outcome 3 Duration of operation. | ||||
| 4 Pain score at 12 hrs after surgery (VAS: 1‐10) Show forest plot | 1 | 111 | Mean Difference (IV, Fixed, 95% CI) | 0.70 [0.02, 1.38] |
| Analysis 4.4  Comparison 4 THERMAL LASER (2nd G) versus TCRE (1st G), Outcome 4 Pain score at 12 hrs after surgery (VAS: 1‐10). | ||||
| 5 Intraoperative complication rate Show forest plot | 1 | Odds Ratio (M‐H, Fixed, 95% CI) | Subtotals only | |
| Analysis 4.5  Comparison 4 THERMAL LASER (2nd G) versus TCRE (1st G), Outcome 5 Intraoperative complication rate. | ||||
| 5.1 Perforation | 1 | 111 | Odds Ratio (M‐H, Fixed, 95% CI) | 0.0 [0.0, 0.0] |
| 5.2 UTI | 1 | 111 | Odds Ratio (M‐H, Fixed, 95% CI) | 0.48 [0.04, 5.47] |
| 6 Requirement for further surgery rate (hyst only) Show forest plot | 1 | 111 | Odds Ratio (M‐H, Fixed, 95% CI) | 0.57 [0.13, 2.49] |
| Analysis 4.6  Comparison 4 THERMAL LASER (2nd G) versus TCRE (1st G), Outcome 6 Requirement for further surgery rate (hyst only). | ||||
| 6.1 2 to 5 years follow up | 1 | 111 | Odds Ratio (M‐H, Fixed, 95% CI) | 0.57 [0.13, 2.49] |
| Outcome or subgroup title | No. of studies | No. of participants | Statistical method | Effect size |
| 1 Amenorrhoea rate Show forest plot | 1 | Odds Ratio (M‐H, Fixed, 95% CI) | Subtotals only | |
| Analysis 5.1  Comparison 5 HYDROTHERMAL ABLATION (2nd G) versus ROLLERBALL (1st G), Outcome 1 Amenorrhoea rate. | ||||
| 1.1 At 1 year follow up | 1 | 250 | Odds Ratio (M‐H, Fixed, 95% CI) | 0.65 [0.38, 1.11] |
| 1.2 At 2 years follow up | 1 | 225 | Odds Ratio (M‐H, Fixed, 95% CI) | 1.02 [0.58, 1.78] |
| 1.3 2 to 5 years follow up | 1 | 203 | Odds Ratio (M‐H, Fixed, 95% CI) | 1.36 [0.76, 2.45] |
| 2 PBAC </= 75 Show forest plot | 1 | 250 | Odds Ratio (M‐H, Fixed, 95% CI) | 0.72 [0.37, 1.41] |
| Analysis 5.2  Comparison 5 HYDROTHERMAL ABLATION (2nd G) versus ROLLERBALL (1st G), Outcome 2 PBAC </= 75. | ||||
| 2.1 At 1 year follow up | 1 | 250 | Odds Ratio (M‐H, Fixed, 95% CI) | 0.72 [0.37, 1.41] |
| 2.2 2 to 5 years follow up | 0 | 0 | Odds Ratio (M‐H, Fixed, 95% CI) | 0.0 [0.0, 0.0] |
| 3 Proportion with "normal" bleeding (PBAC </= 100) Show forest plot | 1 | Odds Ratio (M‐H, Fixed, 95% CI) | Subtotals only | |
| Analysis 5.3  Comparison 5 HYDROTHERMAL ABLATION (2nd G) versus ROLLERBALL (1st G), Outcome 3 Proportion with "normal" bleeding (PBAC </= 100). | ||||
| 3.1 At 1 year follow up | 1 | 250 | Odds Ratio (M‐H, Fixed, 95% CI) | 0.77 [0.37, 1.60] |
| 3.2 At 2 years follow up | 1 | 225 | Odds Ratio (M‐H, Fixed, 95% CI) | 1.02 [0.37, 2.84] |
| 3.3 2 to 5 years follow up | 1 | 203 | Odds Ratio (M‐H, Fixed, 95% CI) | 1.54 [0.51, 4.62] |
| 4 Satisfaction rate Show forest plot | 1 | 203 | Odds Ratio (M‐H, Fixed, 95% CI) | 1.33 [0.22, 8.18] |
| Analysis 5.4  Comparison 5 HYDROTHERMAL ABLATION (2nd G) versus ROLLERBALL (1st G), Outcome 4 Satisfaction rate. | ||||
| 4.1 2 to 5 years follow up | 1 | 203 | Odds Ratio (M‐H, Fixed, 95% CI) | 1.33 [0.22, 8.18] |
| 5 Proportion having local anaesthesia (%) Show forest plot | 1 | 269 | Odds Ratio (M‐H, Fixed, 95% CI) | 2.85 [1.59, 5.13] |
| Analysis 5.5  Comparison 5 HYDROTHERMAL ABLATION (2nd G) versus ROLLERBALL (1st G), Outcome 5 Proportion having local anaesthesia (%). | ||||
| 6 Intraoperative complication rate Show forest plot | 1 | Odds Ratio (M‐H, Fixed, 95% CI) | Subtotals only | |
| Analysis 5.6  Comparison 5 HYDROTHERMAL ABLATION (2nd G) versus ROLLERBALL (1st G), Outcome 6 Intraoperative complication rate. | ||||
| 6.1 Cervical lacerations | 1 | 269 | Odds Ratio (M‐H, Fixed, 95% CI) | 0.09 [0.00, 1.91] |
| 6.2 Endometritis | 1 | 269 | Odds Ratio (M‐H, Fixed, 95% CI) | 0.92 [0.08, 10.32] |
| 6.3 Urinary tract infection | 1 | 269 | Odds Ratio (M‐H, Fixed, 95% CI) | 1.16 [0.22, 6.10] |
| 6.4 Hematometra | 1 | 269 | Odds Ratio (M‐H, Fixed, 95% CI) | 0.18 [0.03, 0.93] |
| 6.5 First degree burn | 1 | 269 | Odds Ratio (M‐H, Fixed, 95% CI) | 2.34 [0.11, 49.32] |
| 7 Postoperative complication rate Show forest plot | 1 | Odds Ratio (M‐H, Fixed, 95% CI) | Subtotals only | |
| Analysis 5.7  Comparison 5 HYDROTHERMAL ABLATION (2nd G) versus ROLLERBALL (1st G), Outcome 7 Postoperative complication rate. | ||||
| 7.1 Abdominal pain (at 2 weeks) | 1 | 269 | Odds Ratio (M‐H, Fixed, 95% CI) | 1.85 [1.09, 3.12] |
| 7.2 Uterine cramping | 1 | 269 | Odds Ratio (M‐H, Fixed, 95% CI) | 1.17 [0.65, 2.11] |
| 7.3 Nausea or vomiting | 1 | 269 | Odds Ratio (M‐H, Fixed, 95% CI) | 3.66 [1.49, 9.00] |
| 8 Requirement for further surgery (any surgery) Show forest plot | 1 | Odds Ratio (M‐H, Fixed, 95% CI) | Subtotals only | |
| Analysis 5.8  Comparison 5 HYDROTHERMAL ABLATION (2nd G) versus ROLLERBALL (1st G), Outcome 8 Requirement for further surgery (any surgery). | ||||
| 8.1 At 1 year follow up | 1 | 269 | Odds Ratio (M‐H, Fixed, 95% CI) | 2.34 [0.11, 49.32] |
| 8.2 2 to 5 years follow up | 1 | 262 | Odds Ratio (M‐H, Fixed, 95% CI) | 1.30 [0.55, 3.06] |
| 9 Requirement for further surgery rate (hyst only) Show forest plot | 1 | 262 | Odds Ratio (M‐H, Fixed, 95% CI) | 1.59 [0.56, 4.50] |
| Analysis 5.9  Comparison 5 HYDROTHERMAL ABLATION (2nd G) versus ROLLERBALL (1st G), Outcome 9 Requirement for further surgery rate (hyst only). | ||||
| 9.1 At 1 year follow up | 0 | 0 | Odds Ratio (M‐H, Fixed, 95% CI) | 0.0 [0.0, 0.0] |
| 9.2 2 to 5 years follow up | 1 | 262 | Odds Ratio (M‐H, Fixed, 95% CI) | 1.59 [0.56, 4.50] |
| Outcome or subgroup title | No. of studies | No. of participants | Statistical method | Effect size |
| 1 Amenorrhoea rate Show forest plot | 1 | 228 | Odds Ratio (M‐H, Fixed, 95% CI) | 0.30 [0.17, 0.55] |
| Analysis 6.1  Comparison 6 CRYOABLATION (2nd G) versus ROLLERBALL (1st G), Outcome 1 Amenorrhoea rate. | ||||
| 1.1 At 1 year follow up | 1 | 228 | Odds Ratio (M‐H, Fixed, 95% CI) | 0.30 [0.17, 0.55] |
| 2 Satisfaction rate Show forest plot | 1 | Odds Ratio (M‐H, Fixed, 95% CI) | Subtotals only | |
| Analysis 6.2  Comparison 6 CRYOABLATION (2nd G) versus ROLLERBALL (1st G), Outcome 2 Satisfaction rate. | ||||
| 2.1 At 1 year follow up | 1 | 279 | Odds Ratio (M‐H, Fixed, 95% CI) | 1.68 [0.76, 3.69] |
| 2.2 At 2 years follow up | 1 | 137 | Odds Ratio (M‐H, Fixed, 95% CI) | 1.41 [0.43, 4.61] |
| 3 Proportion having local anaesthesia (%) Show forest plot | 1 | 279 | Odds Ratio (M‐H, Fixed, 95% CI) | 13.19 [5.79, 30.04] |
| Analysis 6.3  Comparison 6 CRYOABLATION (2nd G) versus ROLLERBALL (1st G), Outcome 3 Proportion having local anaesthesia (%). | ||||
| 4 Intraoperative complication rate Show forest plot | 1 | Odds Ratio (M‐H, Fixed, 95% CI) | Subtotals only | |
| Analysis 6.4  Comparison 6 CRYOABLATION (2nd G) versus ROLLERBALL (1st G), Outcome 4 Intraoperative complication rate. | ||||
| 4.1 Perforation | 1 | 279 | Odds Ratio (M‐H, Fixed, 95% CI) | 0.15 [0.01, 3.65] |
| 4.2 Vaginal bleeding | 1 | 279 | Odds Ratio (M‐H, Fixed, 95% CI) | 1.35 [0.05, 33.43] |
| 4.3 Abdominal cramping | 1 | 279 | Odds Ratio (M‐H, Fixed, 95% CI) | 2.26 [0.11, 47.54] |
| 4.4 UTI | 1 | 279 | Odds Ratio (M‐H, Fixed, 95% CI) | 0.15 [0.01, 3.65] |
| 4.5 Severe pelvic pain | 1 | 279 | Odds Ratio (M‐H, Fixed, 95% CI) | 0.15 [0.01, 3.65] |
| 5 Requirement for further surgery (any surgery) Show forest plot | 1 | 279 | Odds Ratio (M‐H, Fixed, 95% CI) | 1.00 [0.42, 2.40] |
| Analysis 6.5  Comparison 6 CRYOABLATION (2nd G) versus ROLLERBALL (1st G), Outcome 5 Requirement for further surgery (any surgery). | ||||
| 5.1 At 2 years follow up | 1 | 279 | Odds Ratio (M‐H, Fixed, 95% CI) | 1.00 [0.42, 2.40] |
| 6 Requirement for further surgery rate (hyst only) Show forest plot | 1 | 279 | Odds Ratio (M‐H, Fixed, 95% CI) | 0.82 [0.31, 2.12] |
| Analysis 6.6  Comparison 6 CRYOABLATION (2nd G) versus ROLLERBALL (1st G), Outcome 6 Requirement for further surgery rate (hyst only). | ||||
| 6.1 At 2 years follow up | 1 | 279 | Odds Ratio (M‐H, Fixed, 95% CI) | 0.82 [0.31, 2.12] |
| Outcome or subgroup title | No. of studies | No. of participants | Statistical method | Effect size | ||||||||||||||||||||||||
| 1 Amenorrhea rate at 1 yr follow up Show forest plot | 2 | 470 | Odds Ratio (M‐H, Fixed, 95% CI) | 1.03 [0.70, 1.52] | ||||||||||||||||||||||||
| Analysis 7.1  Comparison 7 ELECTRODE ABLATION (2nd G) versus TCRE + ROLLERBALL (1st G), Outcome 1 Amenorrhea rate at 1 yr follow up. | ||||||||||||||||||||||||||||
| 1.1 Balloon system | 1 | 234 | Odds Ratio (M‐H, Fixed, 95% CI) | 0.85 [0.49, 1.46] | ||||||||||||||||||||||||
| 1.2 Mesh system | 1 | 236 | Odds Ratio (M‐H, Fixed, 95% CI) | 1.27 [0.73, 2.20] | ||||||||||||||||||||||||
| 2 Proportion with successful Rx (PBAC<75) Show forest plot | 2 | 470 | Odds Ratio (M‐H, Fixed, 95% CI) | 1.50 [0.90, 2.53] | ||||||||||||||||||||||||
| Analysis 7.2  Comparison 7 ELECTRODE ABLATION (2nd G) versus TCRE + ROLLERBALL (1st G), Outcome 2 Proportion with successful Rx (PBAC<75). | ||||||||||||||||||||||||||||
| 2.1 Balloon system | 1 | 234 | Odds Ratio (M‐H, Fixed, 95% CI) | 1.35 [0.66, 2.78] | ||||||||||||||||||||||||
| 2.2 Mesh system | 1 | 236 | Odds Ratio (M‐H, Fixed, 95% CI) | 1.69 [0.80, 3.56] | ||||||||||||||||||||||||
| 3 PBAC score 12 months after treatment Show forest plot | Other data | No numeric data | ||||||||||||||||||||||||||
| Analysis 7.3
Comparison 7 ELECTRODE ABLATION (2nd G) versus TCRE + ROLLERBALL (1st G), Outcome 3 PBAC score 12 months after treatment. | ||||||||||||||||||||||||||||
| 3.1 Balloon system | Other data | No numeric data | ||||||||||||||||||||||||||
| 3.2 Mesh system | Other data | No numeric data | ||||||||||||||||||||||||||
| 4 Proportion satisfied with treatment at 1 year Show forest plot | 1 | 236 | Odds Ratio (M‐H, Fixed, 95% CI) | 0.84 [0.28, 2.52] | ||||||||||||||||||||||||
| Analysis 7.4  Comparison 7 ELECTRODE ABLATION (2nd G) versus TCRE + ROLLERBALL (1st G), Outcome 4 Proportion satisfied with treatment at 1 year. | ||||||||||||||||||||||||||||
| 4.1 Balloon system | 0 | 0 | Odds Ratio (M‐H, Fixed, 95% CI) | 0.0 [0.0, 0.0] | ||||||||||||||||||||||||
| 4.2 Mesh system | 1 | 236 | Odds Ratio (M‐H, Fixed, 95% CI) | 0.84 [0.28, 2.52] | ||||||||||||||||||||||||
| 5 Duration of operation (mins) Show forest plot | 2 | 520 | Mean Difference (IV, Fixed, 95% CI) | ‐18.70 [‐20.66, ‐16.75] | ||||||||||||||||||||||||
| Analysis 7.5  Comparison 7 ELECTRODE ABLATION (2nd G) versus TCRE + ROLLERBALL (1st G), Outcome 5 Duration of operation (mins). | ||||||||||||||||||||||||||||
| 5.1 Balloon system | 1 | 255 | Mean Difference (IV, Fixed, 95% CI) | ‐16.20 [‐19.55, ‐12.85] | ||||||||||||||||||||||||
| 5.2 Mesh system | 1 | 265 | Mean Difference (IV, Fixed, 95% CI) | ‐20.0 [‐22.41, ‐17.59] | ||||||||||||||||||||||||
| 6 Proportion having local anaesthesia (%) Show forest plot | 2 | 520 | Odds Ratio (M‐H, Fixed, 95% CI) | 15.92 [10.12, 25.06] | ||||||||||||||||||||||||
| Analysis 7.6  Comparison 7 ELECTRODE ABLATION (2nd G) versus TCRE + ROLLERBALL (1st G), Outcome 6 Proportion having local anaesthesia (%). | ||||||||||||||||||||||||||||
| 6.1 Balloon system | 1 | 255 | Odds Ratio (M‐H, Fixed, 95% CI) | 20.53 [10.73, 39.26] | ||||||||||||||||||||||||
| 6.2 Mesh system | 1 | 265 | Odds Ratio (M‐H, Fixed, 95% CI) | 12.60 [6.67, 23.78] | ||||||||||||||||||||||||
| 7 Intraoperative complication rate Show forest plot | 2 | Odds Ratio (M‐H, Fixed, 95% CI) | Subtotals only | |||||||||||||||||||||||||
| Analysis 7.7  Comparison 7 ELECTRODE ABLATION (2nd G) versus TCRE + ROLLERBALL (1st G), Outcome 7 Intraoperative complication rate. | ||||||||||||||||||||||||||||
| 7.1 Perforation | 2 | 532 | Odds Ratio (M‐H, Fixed, 95% CI) | 0.13 [0.02, 1.06] | ||||||||||||||||||||||||
| 7.2 Bradycardia | 1 | 265 | Odds Ratio (M‐H, Fixed, 95% CI) | 1.56 [0.06, 38.58] | ||||||||||||||||||||||||
| 7.3 Cervical tear/stenosis | 2 | 532 | Odds Ratio (M‐H, Fixed, 95% CI) | 0.11 [0.01, 0.89] | ||||||||||||||||||||||||
| 7.4 Fluid overload | 1 | 267 | Odds Ratio (M‐H, Fixed, 95% CI) | 0.28 [0.01, 7.00] | ||||||||||||||||||||||||
| 7.5 Procedure abandoned | 1 | 267 | Odds Ratio (M‐H, Fixed, 95% CI) | 2.58 [0.10, 63.95] | ||||||||||||||||||||||||
| 8 Postoperative complication rate Show forest plot | 2 | Odds Ratio (M‐H, Fixed, 95% CI) | Subtotals only | |||||||||||||||||||||||||
| Analysis 7.8  Comparison 7 ELECTRODE ABLATION (2nd G) versus TCRE + ROLLERBALL (1st G), Outcome 8 Postoperative complication rate. | ||||||||||||||||||||||||||||
| 8.1 Fever | 1 | 267 | Odds Ratio (M‐H, Fixed, 95% CI) | 0.85 [0.05, 13.78] | ||||||||||||||||||||||||
| 8.2 Nausea/vomiting or severe pelvic pain | 2 | 532 | Odds Ratio (M‐H, Fixed, 95% CI) | 1.10 [0.35, 3.46] | ||||||||||||||||||||||||
| 8.3 UTI | 2 | 532 | Odds Ratio (M‐H, Fixed, 95% CI) | 1.05 [0.37, 3.02] | ||||||||||||||||||||||||
| 8.4 Hematometra | 2 | 532 | Odds Ratio (M‐H, Fixed, 95% CI) | 0.42 [0.08, 2.22] | ||||||||||||||||||||||||
| 8.5 Myometritis | 1 | 267 | Odds Ratio (M‐H, Fixed, 95% CI) | 0.28 [0.01, 7.00] | ||||||||||||||||||||||||
| 8.6 Urinary incontinence | 1 | 267 | Odds Ratio (M‐H, Fixed, 95% CI) | 0.28 [0.01, 7.00] | ||||||||||||||||||||||||
| 8.7 PID | 1 | 265 | Odds Ratio (M‐H, Fixed, 95% CI) | 1.03 [0.09, 11.50] | ||||||||||||||||||||||||
| 8.8 Haemorrhage | 1 | 265 | Odds Ratio (M‐H, Fixed, 95% CI) | 0.51 [0.03, 8.27] | ||||||||||||||||||||||||
| 8.9 Pelvic abscess | 1 | 265 | Odds Ratio (M‐H, Fixed, 95% CI) | 0.17 [0.01, 4.22] | ||||||||||||||||||||||||
| 8.10 Endometritis | 1 | 265 | Odds Ratio (M‐H, Fixed, 95% CI) | 0.34 [0.05, 2.04] | ||||||||||||||||||||||||
| 9 Requirement for further surgery at 2 years (hysterectomy) Show forest plot | 1 | 255 | Odds Ratio (M‐H, Fixed, 95% CI) | 0.50 [0.16, 1.53] | ||||||||||||||||||||||||
| Analysis 7.9  Comparison 7 ELECTRODE ABLATION (2nd G) versus TCRE + ROLLERBALL (1st G), Outcome 9 Requirement for further surgery at 2 years (hysterectomy). | ||||||||||||||||||||||||||||
| 9.1 Balloon system | 1 | 255 | Odds Ratio (M‐H, Fixed, 95% CI) | 0.50 [0.16, 1.53] | ||||||||||||||||||||||||
| 9.2 Mesh system | 0 | 0 | Odds Ratio (M‐H, Fixed, 95% CI) | 0.0 [0.0, 0.0] | ||||||||||||||||||||||||
| Outcome or subgroup title | No. of studies | No. of participants | Statistical method | Effect size | ||||||||||||||||||||||||||||||||||||||||||||||||||||||||||||||||||||||||
| 1 Amenorrhea rate Show forest plot | 2 | Odds Ratio (M‐H, Fixed, 95% CI) | Subtotals only | |||||||||||||||||||||||||||||||||||||||||||||||||||||||||||||||||||||||||
| Analysis 8.1  Comparison 8 MICROWAVE ABLATION (2nd G) versus TCRE + RB(1st G), Outcome 1 Amenorrhea rate. | ||||||||||||||||||||||||||||||||||||||||||||||||||||||||||||||||||||||||||||
| 1.1 At 1 year follow up | 2 | 562 | Odds Ratio (M‐H, Fixed, 95% CI) | 1.24 [0.88, 1.75] | ||||||||||||||||||||||||||||||||||||||||||||||||||||||||||||||||||||||||
| 1.2 At 2 years follow up | 1 | 249 | Odds Ratio (M‐H, Fixed, 95% CI) | 1.30 [0.79, 2.14] | ||||||||||||||||||||||||||||||||||||||||||||||||||||||||||||||||||||||||
| 1.3 At 2 to 5 years follow up | 1 | 236 | Odds Ratio (M‐H, Fixed, 95% CI) | 0.82 [0.47, 1.40] | ||||||||||||||||||||||||||||||||||||||||||||||||||||||||||||||||||||||||
| 2 Success of treatment (PBAC<75) Show forest plot | 1 | 322 | Odds Ratio (M‐H, Fixed, 95% CI) | 1.35 [0.71, 2.57] | ||||||||||||||||||||||||||||||||||||||||||||||||||||||||||||||||||||||||
| Analysis 8.2  Comparison 8 MICROWAVE ABLATION (2nd G) versus TCRE + RB(1st G), Outcome 2 Success of treatment (PBAC<75). | ||||||||||||||||||||||||||||||||||||||||||||||||||||||||||||||||||||||||||||
| 2.1 At 1 year follow up | 1 | 322 | Odds Ratio (M‐H, Fixed, 95% CI) | 1.35 [0.71, 2.57] | ||||||||||||||||||||||||||||||||||||||||||||||||||||||||||||||||||||||||
| 3 Satisfaction rate Show forest plot | 2 | Odds Ratio (M‐H, Fixed, 95% CI) | Subtotals only | |||||||||||||||||||||||||||||||||||||||||||||||||||||||||||||||||||||||||
| Analysis 8.3  Comparison 8 MICROWAVE ABLATION (2nd G) versus TCRE + RB(1st G), Outcome 3 Satisfaction rate. | ||||||||||||||||||||||||||||||||||||||||||||||||||||||||||||||||||||||||||||
| 3.1 At 1 year follow up | 2 | 533 | Odds Ratio (M‐H, Fixed, 95% CI) | 1.06 [0.60, 1.88] | ||||||||||||||||||||||||||||||||||||||||||||||||||||||||||||||||||||||||
| 3.2 At 2 years follow up | 1 | 249 | Odds Ratio (M‐H, Fixed, 95% CI) | 1.90 [1.07, 3.37] | ||||||||||||||||||||||||||||||||||||||||||||||||||||||||||||||||||||||||
| 3.3 At 2 to 5 years follow up | 1 | 236 | Odds Ratio (M‐H, Fixed, 95% CI) | 2.37 [1.22, 4.60] | ||||||||||||||||||||||||||||||||||||||||||||||||||||||||||||||||||||||||
| 4 Duration of operation (mins) Show forest plot | Other data | No numeric data | ||||||||||||||||||||||||||||||||||||||||||||||||||||||||||||||||||||||||||
| Analysis 8.4
Comparison 8 MICROWAVE ABLATION (2nd G) versus TCRE + RB(1st G), Outcome 4 Duration of operation (mins). | ||||||||||||||||||||||||||||||||||||||||||||||||||||||||||||||||||||||||||||
| 5 Operative difficulties Show forest plot | 1 | Odds Ratio (M‐H, Fixed, 95% CI) | Subtotals only | |||||||||||||||||||||||||||||||||||||||||||||||||||||||||||||||||||||||||
| Analysis 8.5  Comparison 8 MICROWAVE ABLATION (2nd G) versus TCRE + RB(1st G), Outcome 5 Operative difficulties. | ||||||||||||||||||||||||||||||||||||||||||||||||||||||||||||||||||||||||||||
| 5.1 Equipment failure | 1 | 263 | Odds Ratio (M‐H, Fixed, 95% CI) | 4.07 [1.11, 14.95] | ||||||||||||||||||||||||||||||||||||||||||||||||||||||||||||||||||||||||
| 5.2 Procedure abandoned | 1 | 263 | Odds Ratio (M‐H, Fixed, 95% CI) | 1.04 [0.29, 3.68] | ||||||||||||||||||||||||||||||||||||||||||||||||||||||||||||||||||||||||
| 6 Proportion having local anaesthesia Show forest plot | 1 | 315 | Odds Ratio (M‐H, Fixed, 95% CI) | 4.41 [2.58, 7.55] | ||||||||||||||||||||||||||||||||||||||||||||||||||||||||||||||||||||||||
| Analysis 8.6  Comparison 8 MICROWAVE ABLATION (2nd G) versus TCRE + RB(1st G), Outcome 6 Proportion having local anaesthesia. | ||||||||||||||||||||||||||||||||||||||||||||||||||||||||||||||||||||||||||||
| 7 Duration of hospital stay (hours) Show forest plot | Other data | No numeric data | ||||||||||||||||||||||||||||||||||||||||||||||||||||||||||||||||||||||||||
| Analysis 8.7
Comparison 8 MICROWAVE ABLATION (2nd G) versus TCRE + RB(1st G), Outcome 7 Duration of hospital stay (hours). | ||||||||||||||||||||||||||||||||||||||||||||||||||||||||||||||||||||||||||||
| 8 Inability to work (proportion of women) Show forest plot | 1 | 240 | Odds Ratio (M‐H, Fixed, 95% CI) | 0.52 [0.15, 1.77] | ||||||||||||||||||||||||||||||||||||||||||||||||||||||||||||||||||||||||
| Analysis 8.8  Comparison 8 MICROWAVE ABLATION (2nd G) versus TCRE + RB(1st G), Outcome 8 Inability to work (proportion of women). | ||||||||||||||||||||||||||||||||||||||||||||||||||||||||||||||||||||||||||||
| 9 Change in SF36 score after treatment Show forest plot | Other data | No numeric data | ||||||||||||||||||||||||||||||||||||||||||||||||||||||||||||||||||||||||||
| Analysis 8.9
Comparison 8 MICROWAVE ABLATION (2nd G) versus TCRE + RB(1st G), Outcome 9 Change in SF36 score after treatment. | ||||||||||||||||||||||||||||||||||||||||||||||||||||||||||||||||||||||||||||
| 9.1 Physical functioning | Other data | No numeric data | ||||||||||||||||||||||||||||||||||||||||||||||||||||||||||||||||||||||||||
| 9.2 Social functioning | Other data | No numeric data | ||||||||||||||||||||||||||||||||||||||||||||||||||||||||||||||||||||||||||
| 9.3 Physical role | Other data | No numeric data | ||||||||||||||||||||||||||||||||||||||||||||||||||||||||||||||||||||||||||
| 9.4 Emotional role | Other data | No numeric data | ||||||||||||||||||||||||||||||||||||||||||||||||||||||||||||||||||||||||||
| 9.5 Mental health | Other data | No numeric data | ||||||||||||||||||||||||||||||||||||||||||||||||||||||||||||||||||||||||||
| 9.6 Energy/fatigue | Other data | No numeric data | ||||||||||||||||||||||||||||||||||||||||||||||||||||||||||||||||||||||||||
| 9.7 Pain | Other data | No numeric data | ||||||||||||||||||||||||||||||||||||||||||||||||||||||||||||||||||||||||||
| 9.8 General health | Other data | No numeric data | ||||||||||||||||||||||||||||||||||||||||||||||||||||||||||||||||||||||||||
| 10 Improvement in symptoms Show forest plot | 1 | Odds Ratio (M‐H, Fixed, 95% CI) | Subtotals only | |||||||||||||||||||||||||||||||||||||||||||||||||||||||||||||||||||||||||
| Analysis 8.10  Comparison 8 MICROWAVE ABLATION (2nd G) versus TCRE + RB(1st G), Outcome 10 Improvement in symptoms. | ||||||||||||||||||||||||||||||||||||||||||||||||||||||||||||||||||||||||||||
| 10.1 At 1 year follow up | 1 | 240 | Odds Ratio (M‐H, Fixed, 95% CI) | 1.16 [0.64, 2.13] | ||||||||||||||||||||||||||||||||||||||||||||||||||||||||||||||||||||||||
| 10.2 At 2 to 5 years follow up | 1 | 236 | Odds Ratio (M‐H, Fixed, 95% CI) | 1.65 [0.88, 3.06] | ||||||||||||||||||||||||||||||||||||||||||||||||||||||||||||||||||||||||
| 11 Improvement in dysmenorrhoea Show forest plot | 2 | Odds Ratio (M‐H, Fixed, 95% CI) | Subtotals only | |||||||||||||||||||||||||||||||||||||||||||||||||||||||||||||||||||||||||
| Analysis 8.11  Comparison 8 MICROWAVE ABLATION (2nd G) versus TCRE + RB(1st G), Outcome 11 Improvement in dysmenorrhoea. | ||||||||||||||||||||||||||||||||||||||||||||||||||||||||||||||||||||||||||||
| 11.1 At 1 year follow up | 2 | 533 | Odds Ratio (M‐H, Fixed, 95% CI) | 0.94 [0.63, 1.40] | ||||||||||||||||||||||||||||||||||||||||||||||||||||||||||||||||||||||||
| 11.2 At 2 years follow up | 1 | 249 | Odds Ratio (M‐H, Fixed, 95% CI) | 1.29 [0.69, 2.40] | ||||||||||||||||||||||||||||||||||||||||||||||||||||||||||||||||||||||||
| 12 Postoperative analgesia rate Show forest plot | 1 | 263 | Odds Ratio (M‐H, Fixed, 95% CI) | 0.82 [0.48, 1.40] | ||||||||||||||||||||||||||||||||||||||||||||||||||||||||||||||||||||||||
| Analysis 8.12  Comparison 8 MICROWAVE ABLATION (2nd G) versus TCRE + RB(1st G), Outcome 12 Postoperative analgesia rate. | ||||||||||||||||||||||||||||||||||||||||||||||||||||||||||||||||||||||||||||
| 13 Intraoperative complication rate Show forest plot | 2 | Odds Ratio (M‐H, Fixed, 95% CI) | Subtotals only | |||||||||||||||||||||||||||||||||||||||||||||||||||||||||||||||||||||||||
| Analysis 8.13  Comparison 8 MICROWAVE ABLATION (2nd G) versus TCRE + RB(1st G), Outcome 13 Intraoperative complication rate. | ||||||||||||||||||||||||||||||||||||||||||||||||||||||||||||||||||||||||||||
| 13.1 Perforation | 2 | 585 | Odds Ratio (M‐H, Fixed, 95% CI) | 1.64 [0.23, 11.89] | ||||||||||||||||||||||||||||||||||||||||||||||||||||||||||||||||||||||||
| 13.2 Haemorrhage | 1 | 263 | Odds Ratio (M‐H, Fixed, 95% CI) | 0.09 [0.00, 1.66] | ||||||||||||||||||||||||||||||||||||||||||||||||||||||||||||||||||||||||
| 13.3 Cervical laceration | 1 | 322 | Odds Ratio (M‐H, Fixed, 95% CI) | 0.49 [0.07, 3.55] | ||||||||||||||||||||||||||||||||||||||||||||||||||||||||||||||||||||||||
| 13.4 Cervical stenosis | 1 | 322 | Odds Ratio (M‐H, Fixed, 95% CI) | 1.50 [0.06, 37.22] | ||||||||||||||||||||||||||||||||||||||||||||||||||||||||||||||||||||||||
| 14 Postoperative complication rate (wihin 24 hours) Show forest plot | 1 | Odds Ratio (M‐H, Fixed, 95% CI) | Subtotals only | |||||||||||||||||||||||||||||||||||||||||||||||||||||||||||||||||||||||||
| Analysis 8.14  Comparison 8 MICROWAVE ABLATION (2nd G) versus TCRE + RB(1st G), Outcome 14 Postoperative complication rate (wihin 24 hours). | ||||||||||||||||||||||||||||||||||||||||||||||||||||||||||||||||||||||||||||
| 14.1 Chills | 1 | 322 | Odds Ratio (M‐H, Fixed, 95% CI) | 1.38 [0.56, 3.40] | ||||||||||||||||||||||||||||||||||||||||||||||||||||||||||||||||||||||||
| 14.2 Bloating | 1 | 322 | Odds Ratio (M‐H, Fixed, 95% CI) | 0.82 [0.35, 1.93] | ||||||||||||||||||||||||||||||||||||||||||||||||||||||||||||||||||||||||
| 14.3 Dysuria | 1 | 322 | Odds Ratio (M‐H, Fixed, 95% CI) | 0.75 [0.34, 1.66] | ||||||||||||||||||||||||||||||||||||||||||||||||||||||||||||||||||||||||
| 14.4 Fever | 1 | 322 | Odds Ratio (M‐H, Fixed, 95% CI) | 2.52 [0.12, 52.90] | ||||||||||||||||||||||||||||||||||||||||||||||||||||||||||||||||||||||||
| 14.5 Headache | 1 | 322 | Odds Ratio (M‐H, Fixed, 95% CI) | 0.74 [0.20, 2.68] | ||||||||||||||||||||||||||||||||||||||||||||||||||||||||||||||||||||||||
| 14.6 Nausea | 1 | 322 | Odds Ratio (M‐H, Fixed, 95% CI) | 1.46 [0.80, 2.66] | ||||||||||||||||||||||||||||||||||||||||||||||||||||||||||||||||||||||||
| 14.7 Vomiting | 1 | 322 | Odds Ratio (M‐H, Fixed, 95% CI) | 4.01 [1.37, 11.74] | ||||||||||||||||||||||||||||||||||||||||||||||||||||||||||||||||||||||||
| 14.8 UTI | 1 | 322 | Odds Ratio (M‐H, Fixed, 95% CI) | 0.50 [0.03, 8.00] | ||||||||||||||||||||||||||||||||||||||||||||||||||||||||||||||||||||||||
| 14.9 Vaginal infection | 1 | 322 | Odds Ratio (M‐H, Fixed, 95% CI) | 1.50 [0.06, 37.22] | ||||||||||||||||||||||||||||||||||||||||||||||||||||||||||||||||||||||||
| 14.10 Uterine cramping | 1 | 322 | Odds Ratio (M‐H, Fixed, 95% CI) | 1.74 [1.07, 2.83] | ||||||||||||||||||||||||||||||||||||||||||||||||||||||||||||||||||||||||
| 14.11 Abdominal tenderness | 1 | 322 | Odds Ratio (M‐H, Fixed, 95% CI) | 0.59 [0.24, 1.46] | ||||||||||||||||||||||||||||||||||||||||||||||||||||||||||||||||||||||||
| 14.12 Endometritis | 1 | 322 | Odds Ratio (M‐H, Fixed, 95% CI) | 6.67 [0.37, 119.53] | ||||||||||||||||||||||||||||||||||||||||||||||||||||||||||||||||||||||||
| 15 Requirement for further surgery (any surgery) Show forest plot | 1 | Odds Ratio (M‐H, Fixed, 95% CI) | Subtotals only | |||||||||||||||||||||||||||||||||||||||||||||||||||||||||||||||||||||||||
| Analysis 8.15  Comparison 8 MICROWAVE ABLATION (2nd G) versus TCRE + RB(1st G), Outcome 15 Requirement for further surgery (any surgery). | ||||||||||||||||||||||||||||||||||||||||||||||||||||||||||||||||||||||||||||
| 15.1 At 1 year follow up | 1 | 240 | Odds Ratio (M‐H, Fixed, 95% CI) | 0.81 [0.34, 1.92] | ||||||||||||||||||||||||||||||||||||||||||||||||||||||||||||||||||||||||
| 15.2 At 2 years follow up | 1 | 249 | Odds Ratio (M‐H, Fixed, 95% CI) | 0.97 [0.49, 1.90] | ||||||||||||||||||||||||||||||||||||||||||||||||||||||||||||||||||||||||
| 15.3 At 2 to 5 years follow up | 1 | 263 | Odds Ratio (M‐H, Fixed, 95% CI) | 0.80 [0.46, 1.39] | ||||||||||||||||||||||||||||||||||||||||||||||||||||||||||||||||||||||||
| 16 Requirement for further surgery rate (hyst only) Show forest plot | 2 | Odds Ratio (M‐H, Fixed, 95% CI) | Subtotals only | |||||||||||||||||||||||||||||||||||||||||||||||||||||||||||||||||||||||||
| Analysis 8.16  Comparison 8 MICROWAVE ABLATION (2nd G) versus TCRE + RB(1st G), Outcome 16 Requirement for further surgery rate (hyst only). | ||||||||||||||||||||||||||||||||||||||||||||||||||||||||||||||||||||||||||||
| 16.1 At 1 year follow up | 2 | 562 | Odds Ratio (M‐H, Fixed, 95% CI) | 0.75 [0.32, 1.78] | ||||||||||||||||||||||||||||||||||||||||||||||||||||||||||||||||||||||||
| 16.2 At 2 years follow up | 1 | 249 | Odds Ratio (M‐H, Fixed, 95% CI) | 0.94 [0.45, 1.98] | ||||||||||||||||||||||||||||||||||||||||||||||||||||||||||||||||||||||||
| 16.3 At 2 to 5 years follow up | 1 | 263 | Odds Ratio (M‐H, Fixed, 95% CI) | 0.56 [0.30, 1.04] | ||||||||||||||||||||||||||||||||||||||||||||||||||||||||||||||||||||||||
| Outcome or subgroup title | No. of studies | No. of participants | Statistical method | Effect size | ||||||||||||||||||||||||||||||||
| 1 Amenorrhea rate Show forest plot | 3 | Odds Ratio (M‐H, Fixed, 95% CI) | Subtotals only | |||||||||||||||||||||||||||||||||
| Analysis 9.1  Comparison 9 BALLOON ENDOMETRIAL ABLATION (2nd G) versus ROLLERBALL ENDOMETRIAL ABLATION (1st G), Outcome 1 Amenorrhea rate. | ||||||||||||||||||||||||||||||||||||
| 1.1 At 1 year follow up | 3 | 352 | Odds Ratio (M‐H, Fixed, 95% CI) | 0.56 [0.33, 0.96] | ||||||||||||||||||||||||||||||||
| 1.2 At 2 years follow up | 1 | 227 | Odds Ratio (M‐H, Fixed, 95% CI) | 0.54 [0.27, 1.08] | ||||||||||||||||||||||||||||||||
| 1.3 At 2 to 5 years follow up | 1 | 122 | Odds Ratio (M‐H, Fixed, 95% CI) | 0.61 [0.27, 1.36] | ||||||||||||||||||||||||||||||||
| 2 Amenorrhoea/eumenorrhoea rate Show forest plot | 2 | Odds Ratio (M‐H, Fixed, 95% CI) | Subtotals only | |||||||||||||||||||||||||||||||||
| Analysis 9.2  Comparison 9 BALLOON ENDOMETRIAL ABLATION (2nd G) versus ROLLERBALL ENDOMETRIAL ABLATION (1st G), Outcome 2 Amenorrhoea/eumenorrhoea rate. | ||||||||||||||||||||||||||||||||||||
| 2.1 At 1 year follow up | 2 | 259 | Odds Ratio (M‐H, Fixed, 95% CI) | 0.75 [0.38, 1.46] | ||||||||||||||||||||||||||||||||
| 2.2 At 2 years follow up | 1 | 227 | Odds Ratio (M‐H, Fixed, 95% CI) | 0.88 [0.37, 2.10] | ||||||||||||||||||||||||||||||||
| 2.3 At 2 to 5 years follow up | 1 | 122 | Odds Ratio (M‐H, Fixed, 95% CI) | 0.66 [0.11, 4.07] | ||||||||||||||||||||||||||||||||
| 3 PBAC score after treatment Show forest plot | Other data | No numeric data | ||||||||||||||||||||||||||||||||||
| Analysis 9.3
Comparison 9 BALLOON ENDOMETRIAL ABLATION (2nd G) versus ROLLERBALL ENDOMETRIAL ABLATION (1st G), Outcome 3 PBAC score after treatment. | ||||||||||||||||||||||||||||||||||||
| 3.1 At 1 year follow up | Other data | No numeric data | ||||||||||||||||||||||||||||||||||
| 3.2 At 2 years follow up | Other data | No numeric data | ||||||||||||||||||||||||||||||||||
| 4 Success of treatment (lighter periods and no further surgery) Show forest plot | 1 | Odds Ratio (M‐H, Fixed, 95% CI) | Subtotals only | |||||||||||||||||||||||||||||||||
| Analysis 9.4  Comparison 9 BALLOON ENDOMETRIAL ABLATION (2nd G) versus ROLLERBALL ENDOMETRIAL ABLATION (1st G), Outcome 4 Success of treatment (lighter periods and no further surgery). | ||||||||||||||||||||||||||||||||||||
| 4.1 At 2 to 5 years follow up | 1 | 170 | Odds Ratio (M‐H, Fixed, 95% CI) | 0.95 [0.49, 1.81] | ||||||||||||||||||||||||||||||||
| 5 Success of treatment (PBAC<75) Show forest plot | 1 | 93 | Odds Ratio (M‐H, Fixed, 95% CI) | 0.81 [0.31, 2.15] | ||||||||||||||||||||||||||||||||
| Analysis 9.5  Comparison 9 BALLOON ENDOMETRIAL ABLATION (2nd G) versus ROLLERBALL ENDOMETRIAL ABLATION (1st G), Outcome 5 Success of treatment (PBAC<75). | ||||||||||||||||||||||||||||||||||||
| 5.1 At 1 year follow up | 1 | 93 | Odds Ratio (M‐H, Fixed, 95% CI) | 0.81 [0.31, 2.15] | ||||||||||||||||||||||||||||||||
| 6 Success of treatment (menstrual score <185) Show forest plot | 1 | Odds Ratio (M‐H, Fixed, 95% CI) | Subtotals only | |||||||||||||||||||||||||||||||||
| Analysis 9.6  Comparison 9 BALLOON ENDOMETRIAL ABLATION (2nd G) versus ROLLERBALL ENDOMETRIAL ABLATION (1st G), Outcome 6 Success of treatment (menstrual score <185). | ||||||||||||||||||||||||||||||||||||
| 6.1 At 1 year follow up | 1 | 129 | Odds Ratio (M‐H, Fixed, 95% CI) | 1.01 [0.43, 2.36] | ||||||||||||||||||||||||||||||||
| 6.2 At 2 years follow up | 1 | 121 | Odds Ratio (M‐H, Fixed, 95% CI) | 1.05 [0.45, 2.46] | ||||||||||||||||||||||||||||||||
| 7 Satisfaction rate Show forest plot | 4 | Odds Ratio (M‐H, Fixed, 95% CI) | Subtotals only | |||||||||||||||||||||||||||||||||
| Analysis 9.7  Comparison 9 BALLOON ENDOMETRIAL ABLATION (2nd G) versus ROLLERBALL ENDOMETRIAL ABLATION (1st G), Outcome 7 Satisfaction rate. | ||||||||||||||||||||||||||||||||||||
| 7.1 At 1 year follow up | 3 | 352 | Odds Ratio (M‐H, Fixed, 95% CI) | 0.94 [0.44, 1.99] | ||||||||||||||||||||||||||||||||
| 7.2 At 2 years follow up | 2 | 348 | Odds Ratio (M‐H, Fixed, 95% CI) | 1.12 [0.64, 1.98] | ||||||||||||||||||||||||||||||||
| 7.3 At 2 to 5 years follow up | 1 | 122 | Odds Ratio (M‐H, Fixed, 95% CI) | 0.10 [0.01, 1.97] | ||||||||||||||||||||||||||||||||
| 8 Duration of operation (mins) Show forest plot | 3 | 471 | Mean Difference (IV, Fixed, 95% CI) | ‐20.87 [‐22.47, ‐19.28] | ||||||||||||||||||||||||||||||||
| Analysis 9.8  Comparison 9 BALLOON ENDOMETRIAL ABLATION (2nd G) versus ROLLERBALL ENDOMETRIAL ABLATION (1st G), Outcome 8 Duration of operation (mins). | ||||||||||||||||||||||||||||||||||||
| 9 Operative difficulties Show forest plot | 1 | 139 | Odds Ratio (M‐H, Fixed, 95% CI) | 1.06 [0.43, 2.60] | ||||||||||||||||||||||||||||||||
| Analysis 9.9  Comparison 9 BALLOON ENDOMETRIAL ABLATION (2nd G) versus ROLLERBALL ENDOMETRIAL ABLATION (1st G), Outcome 9 Operative difficulties. | ||||||||||||||||||||||||||||||||||||
| 9.1 Technical complication rate | 1 | 139 | Odds Ratio (M‐H, Fixed, 95% CI) | 1.06 [0.43, 2.60] | ||||||||||||||||||||||||||||||||
| 10 Inability to work (proportion of women) Show forest plot | 1 | Odds Ratio (M‐H, Fixed, 95% CI) | Subtotals only | |||||||||||||||||||||||||||||||||
| Analysis 9.10  Comparison 9 BALLOON ENDOMETRIAL ABLATION (2nd G) versus ROLLERBALL ENDOMETRIAL ABLATION (1st G), Outcome 10 Inability to work (proportion of women). | ||||||||||||||||||||||||||||||||||||
| 10.1 At 1 year follow up | 1 | 239 | Odds Ratio (M‐H, Fixed, 95% CI) | 1.54 [0.36, 6.60] | ||||||||||||||||||||||||||||||||
| 10.2 At 2 years follow up | 1 | 227 | Odds Ratio (M‐H, Fixed, 95% CI) | 0.28 [0.03, 2.74] | ||||||||||||||||||||||||||||||||
| 10.3 At 2 to 5 years follow up | 1 | 210 | Odds Ratio (M‐H, Fixed, 95% CI) | 0.87 [0.24, 3.10] | ||||||||||||||||||||||||||||||||
| 11 Improvement in dysmenorrhea at 12 months Show forest plot | 1 | 239 | Odds Ratio (M‐H, Fixed, 95% CI) | 0.77 [0.44, 1.37] | ||||||||||||||||||||||||||||||||
| Analysis 9.11  Comparison 9 BALLOON ENDOMETRIAL ABLATION (2nd G) versus ROLLERBALL ENDOMETRIAL ABLATION (1st G), Outcome 11 Improvement in dysmenorrhea at 12 months. | ||||||||||||||||||||||||||||||||||||
| 12 Improvement in premenstrual symptoms (from moderate/severe) Show forest plot | 1 | Odds Ratio (M‐H, Fixed, 95% CI) | Subtotals only | |||||||||||||||||||||||||||||||||
| Analysis 9.12  Comparison 9 BALLOON ENDOMETRIAL ABLATION (2nd G) versus ROLLERBALL ENDOMETRIAL ABLATION (1st G), Outcome 12 Improvement in premenstrual symptoms (from moderate/severe). | ||||||||||||||||||||||||||||||||||||
| 12.1 At 1 year follow up | 1 | 185 | Odds Ratio (M‐H, Fixed, 95% CI) | 0.85 [0.47, 1.53] | ||||||||||||||||||||||||||||||||
| 12.2 At 2 years follow up | 1 | 177 | Odds Ratio (M‐H, Fixed, 95% CI) | 1.08 [0.59, 1.99] | ||||||||||||||||||||||||||||||||
| 12.3 At 2 to 5 years follow up | 1 | 166 | Odds Ratio (M‐H, Fixed, 95% CI) | 0.97 [0.52, 1.79] | ||||||||||||||||||||||||||||||||
| 13 Complication rate (proportion of women) Show forest plot | 3 | Odds Ratio (M‐H, Fixed, 95% CI) | Subtotals only | |||||||||||||||||||||||||||||||||
| Analysis 9.13  Comparison 9 BALLOON ENDOMETRIAL ABLATION (2nd G) versus ROLLERBALL ENDOMETRIAL ABLATION (1st G), Outcome 13 Complication rate (proportion of women). | ||||||||||||||||||||||||||||||||||||
| 13.1 Fluid overload | 2 | 332 | Odds Ratio (M‐H, Fixed, 95% CI) | 0.19 [0.02, 1.66] | ||||||||||||||||||||||||||||||||
| 13.2 Perforation | 2 | 378 | Odds Ratio (M‐H, Fixed, 95% CI) | 0.17 [0.02, 1.42] | ||||||||||||||||||||||||||||||||
| 13.3 Cervical lacerations | 3 | 471 | Odds Ratio (M‐H, Fixed, 95% CI) | 0.20 [0.03, 1.20] | ||||||||||||||||||||||||||||||||
| 13.4 Endometritis | 2 | 332 | Odds Ratio (M‐H, Fixed, 95% CI) | 2.50 [0.47, 13.13] | ||||||||||||||||||||||||||||||||
| 13.5 UTI | 1 | 239 | Odds Ratio (M‐H, Fixed, 95% CI) | 2.76 [0.11, 68.41] | ||||||||||||||||||||||||||||||||
| 13.6 Hematometra | 2 | 332 | Odds Ratio (M‐H, Fixed, 95% CI) | 0.42 [0.06, 2.91] | ||||||||||||||||||||||||||||||||
| 13.7 Hydrosalpinx | 1 | 239 | Odds Ratio (M‐H, Fixed, 95% CI) | 0.30 [0.01, 7.47] | ||||||||||||||||||||||||||||||||
| 13.8 Bleeding | 1 | 93 | Odds Ratio (M‐H, Fixed, 95% CI) | 0.20 [0.01, 4.38] | ||||||||||||||||||||||||||||||||
| 13.9 Pain | 1 | 139 | Odds Ratio (M‐H, Fixed, 95% CI) | 5.87 [0.30, 115.87] | ||||||||||||||||||||||||||||||||
| 13.10 Nausea | 1 | 139 | Odds Ratio (M‐H, Fixed, 95% CI) | 0.26 [0.01, 6.61] | ||||||||||||||||||||||||||||||||
| 13.11 Infection | 1 | 139 | Odds Ratio (M‐H, Fixed, 95% CI) | 0.26 [0.01, 6.61] | ||||||||||||||||||||||||||||||||
| 14 Requirement for further surgery (any surgery) Show forest plot | 3 | Odds Ratio (M‐H, Fixed, 95% CI) | Subtotals only | |||||||||||||||||||||||||||||||||
| Analysis 9.14  Comparison 9 BALLOON ENDOMETRIAL ABLATION (2nd G) versus ROLLERBALL ENDOMETRIAL ABLATION (1st G), Outcome 14 Requirement for further surgery (any surgery). | ||||||||||||||||||||||||||||||||||||
| 14.1 At 1 year follow up | 2 | 332 | Odds Ratio (M‐H, Fixed, 95% CI) | 0.85 [0.28, 2.62] | ||||||||||||||||||||||||||||||||
| 14.2 At 2 years follow up | 2 | 392 | Odds Ratio (M‐H, Fixed, 95% CI) | 0.64 [0.31, 1.31] | ||||||||||||||||||||||||||||||||
| 14.3 At 2 to 5 years follow up | 1 | 122 | Odds Ratio (M‐H, Fixed, 95% CI) | 1.0 [0.48, 2.07] | ||||||||||||||||||||||||||||||||
| 15 Requirement for further surgery (hyst only) Show forest plot | 2 | Odds Ratio (M‐H, Fixed, 95% CI) | Subtotals only | |||||||||||||||||||||||||||||||||
| Analysis 9.15  Comparison 9 BALLOON ENDOMETRIAL ABLATION (2nd G) versus ROLLERBALL ENDOMETRIAL ABLATION (1st G), Outcome 15 Requirement for further surgery (hyst only). | ||||||||||||||||||||||||||||||||||||
| 15.1 At 1 year follow up | 0 | 0 | Odds Ratio (M‐H, Fixed, 95% CI) | 0.0 [0.0, 0.0] | ||||||||||||||||||||||||||||||||
| 15.2 At 2 years follow up | 1 | 137 | Odds Ratio (M‐H, Fixed, 95% CI) | 1.04 [0.34, 3.19] | ||||||||||||||||||||||||||||||||
| 15.3 At 2 to 5 years follow up | 1 | 122 | Odds Ratio (M‐H, Fixed, 95% CI) | 1.0 [0.47, 2.11] | ||||||||||||||||||||||||||||||||
| Outcome or subgroup title | No. of studies | No. of participants | Statistical method | Effect size | ||||||||||||||||||||||||
| 1 Amenorrhoea rate Show forest plot | 1 | Odds Ratio (M‐H, Fixed, 95% CI) | Subtotals only | |||||||||||||||||||||||||
| Analysis 10.1  Comparison 10 BALLOON (2nd G) versus LASER (1st G), Outcome 1 Amenorrhoea rate. | ||||||||||||||||||||||||||||
| 1.1 At 6 months follow up | 1 | 70 | Odds Ratio (M‐H, Fixed, 95% CI) | 1.19 [0.45, 3.14] | ||||||||||||||||||||||||
| 1.2 At 12 months follow up | 1 | 67 | Odds Ratio (M‐H, Fixed, 95% CI) | 0.64 [0.23, 1.77] | ||||||||||||||||||||||||
| 2 PBAC score after treatment Show forest plot | Other data | No numeric data | ||||||||||||||||||||||||||
| Analysis 10.2
Comparison 10 BALLOON (2nd G) versus LASER (1st G), Outcome 2 PBAC score after treatment. | ||||||||||||||||||||||||||||
| 2.1 At 6 months follow up | Other data | No numeric data | ||||||||||||||||||||||||||
| 3 Satisfaction rate Show forest plot | 1 | Odds Ratio (M‐H, Fixed, 95% CI) | Subtotals only | |||||||||||||||||||||||||
| Analysis 10.3  Comparison 10 BALLOON (2nd G) versus LASER (1st G), Outcome 3 Satisfaction rate. | ||||||||||||||||||||||||||||
| 3.1 At 6 months follow up | 1 | 69 | Odds Ratio (M‐H, Fixed, 95% CI) | 1.81 [0.28, 11.58] | ||||||||||||||||||||||||
| 3.2 At 12 months follow up | 1 | 57 | Odds Ratio (M‐H, Fixed, 95% CI) | 0.54 [0.05, 6.30] | ||||||||||||||||||||||||
| 4 Operative difficulties Show forest plot | 1 | 70 | Odds Ratio (M‐H, Fixed, 95% CI) | 4.72 [0.22, 101.93] | ||||||||||||||||||||||||
| Analysis 10.4  Comparison 10 BALLOON (2nd G) versus LASER (1st G), Outcome 4 Operative difficulties. | ||||||||||||||||||||||||||||
| 4.1 Failure of equipment | 1 | 70 | Odds Ratio (M‐H, Fixed, 95% CI) | 4.72 [0.22, 101.93] | ||||||||||||||||||||||||
| 5 Euroquol 5D Show forest plot | 1 | Mean Difference (IV, Fixed, 95% CI) | Subtotals only | |||||||||||||||||||||||||
| Analysis 10.5  Comparison 10 BALLOON (2nd G) versus LASER (1st G), Outcome 5 Euroquol 5D. | ||||||||||||||||||||||||||||
| 5.1 At 6 months follow up | 1 | 70 | Mean Difference (IV, Fixed, 95% CI) | 0.01 [‐0.11, 0.13] | ||||||||||||||||||||||||
| 5.2 At 12 months follow up | 1 | 67 | Mean Difference (IV, Fixed, 95% CI) | ‐0.01 [‐0.13, 0.11] | ||||||||||||||||||||||||
| 6 Euroquol 5D VAS Show forest plot | 1 | Mean Difference (IV, Fixed, 95% CI) | Subtotals only | |||||||||||||||||||||||||
| Analysis 10.6  Comparison 10 BALLOON (2nd G) versus LASER (1st G), Outcome 6 Euroquol 5D VAS. | ||||||||||||||||||||||||||||
| 6.1 At 6 months follow up | 1 | 70 | Mean Difference (IV, Fixed, 95% CI) | 1.20 [‐5.95, 8.35] | ||||||||||||||||||||||||
| 6.2 At 12 months follow up | 1 | 67 | Mean Difference (IV, Fixed, 95% CI) | 10.10 [2.43, 17.77] | ||||||||||||||||||||||||
| 7 SF12 Physical Scale Show forest plot | 1 | Mean Difference (IV, Fixed, 95% CI) | Subtotals only | |||||||||||||||||||||||||
| Analysis 10.7  Comparison 10 BALLOON (2nd G) versus LASER (1st G), Outcome 7 SF12 Physical Scale. | ||||||||||||||||||||||||||||
| 7.1 At 6 months follow up | 1 | 70 | Mean Difference (IV, Fixed, 95% CI) | 1.70 [‐2.18, 5.58] | ||||||||||||||||||||||||
| 7.2 At 12 months follow up | 1 | 67 | Mean Difference (IV, Fixed, 95% CI) | ‐0.20 [‐3.89, 3.49] | ||||||||||||||||||||||||
| 8 SF12 Mental Scale Show forest plot | 1 | Mean Difference (IV, Fixed, 95% CI) | Subtotals only | |||||||||||||||||||||||||
| Analysis 10.8  Comparison 10 BALLOON (2nd G) versus LASER (1st G), Outcome 8 SF12 Mental Scale. | ||||||||||||||||||||||||||||
| 8.1 At 6 months follow up | 1 | 70 | Mean Difference (IV, Fixed, 95% CI) | 3.40 [‐0.42, 7.22] | ||||||||||||||||||||||||
| 8.2 At 12 months follow up | 1 | 67 | Mean Difference (IV, Fixed, 95% CI) | 2.10 [‐2.04, 6.24] | ||||||||||||||||||||||||
| 9 SAQ pleasure scale Show forest plot | 1 | Mean Difference (IV, Fixed, 95% CI) | Subtotals only | |||||||||||||||||||||||||
| Analysis 10.9  Comparison 10 BALLOON (2nd G) versus LASER (1st G), Outcome 9 SAQ pleasure scale. | ||||||||||||||||||||||||||||
| 9.1 At 6 months follow up | 1 | 70 | Mean Difference (IV, Fixed, 95% CI) | 0.5 [‐1.30, 2.30] | ||||||||||||||||||||||||
| 9.2 At 12 months follow up | 1 | 67 | Mean Difference (IV, Fixed, 95% CI) | ‐0.60 [‐2.68, 1.48] | ||||||||||||||||||||||||
| 10 SAQ habit scale Show forest plot | 1 | Mean Difference (IV, Fixed, 95% CI) | Subtotals only | |||||||||||||||||||||||||
| Analysis 10.10  Comparison 10 BALLOON (2nd G) versus LASER (1st G), Outcome 10 SAQ habit scale. | ||||||||||||||||||||||||||||
| 10.1 At 6 months follow up | 1 | 70 | Mean Difference (IV, Fixed, 95% CI) | ‐0.16 [‐0.42, 0.10] | ||||||||||||||||||||||||
| 10.2 At 12 months follow up | 1 | 67 | Mean Difference (IV, Fixed, 95% CI) | ‐0.09 [‐0.27, 0.09] | ||||||||||||||||||||||||
| 11 SAQ discomfort scale Show forest plot | 1 | Mean Difference (IV, Fixed, 95% CI) | Subtotals only | |||||||||||||||||||||||||
| Analysis 10.11  Comparison 10 BALLOON (2nd G) versus LASER (1st G), Outcome 11 SAQ discomfort scale. | ||||||||||||||||||||||||||||
| 11.1 At 6 months follow up | 1 | 70 | Mean Difference (IV, Fixed, 95% CI) | ‐0.14 [‐0.98, 0.70] | ||||||||||||||||||||||||
| 11.2 At 12 months follow up | 1 | 67 | Mean Difference (IV, Fixed, 95% CI) | 0.10 [‐0.67, 0.87] | ||||||||||||||||||||||||
| 12 PMS (visual analogue) Show forest plot | Other data | No numeric data | ||||||||||||||||||||||||||
| Analysis 10.12
Comparison 10 BALLOON (2nd G) versus LASER (1st G), Outcome 12 PMS (visual analogue). | ||||||||||||||||||||||||||||
| 12.1 At 6 months follow up | Other data | No numeric data | ||||||||||||||||||||||||||
| 12.2 At 12 months follow up | Other data | No numeric data | ||||||||||||||||||||||||||
| 13 Dysmenorrhoea (visual analogue) Show forest plot | Other data | No numeric data | ||||||||||||||||||||||||||
| Analysis 10.13
Comparison 10 BALLOON (2nd G) versus LASER (1st G), Outcome 13 Dysmenorrhoea (visual analogue). | ||||||||||||||||||||||||||||
| 13.1 At 6 months follow up | Other data | No numeric data | ||||||||||||||||||||||||||
| 13.2 At 12 months follow up | Other data | No numeric data | ||||||||||||||||||||||||||
| 14 Pain score Show forest plot | 1 | 70 | Mean Difference (IV, Fixed, 95% CI) | 32.7 [23.72, 41.68] | ||||||||||||||||||||||||
| Analysis 10.14  Comparison 10 BALLOON (2nd G) versus LASER (1st G), Outcome 14 Pain score. | ||||||||||||||||||||||||||||
| 15 Requirement for further surgery Show forest plot | 1 | Odds Ratio (M‐H, Fixed, 95% CI) | Subtotals only | |||||||||||||||||||||||||
| Analysis 10.15  Comparison 10 BALLOON (2nd G) versus LASER (1st G), Outcome 15 Requirement for further surgery. | ||||||||||||||||||||||||||||
| 15.1 At 6 months follow up | 0 | 0 | Odds Ratio (M‐H, Fixed, 95% CI) | 0.0 [0.0, 0.0] | ||||||||||||||||||||||||
| 15.2 At 12 months follow up | 1 | 67 | Odds Ratio (M‐H, Fixed, 95% CI) | 0.75 [0.18, 3.06] | ||||||||||||||||||||||||
| Outcome or subgroup title | No. of studies | No. of participants | Statistical method | Effect size | ||||||||||||
| 1 Amenorrhoea rate Show forest plot | 1 | Odds Ratio (M‐H, Fixed, 95% CI) | Subtotals only | |||||||||||||
| Analysis 11.1  Comparison 11 BALLOON (2nd G) versus TCRE (1st G), Outcome 1 Amenorrhoea rate. | ||||||||||||||||
| 1.1 At 6 months follow up | 1 | 49 | Odds Ratio (M‐H, Fixed, 95% CI) | 0.94 [0.23, 3.88] | ||||||||||||
| 1.2 At 12 months follow up | 1 | 45 | Odds Ratio (M‐H, Fixed, 95% CI) | 1.33 [0.36, 4.88] | ||||||||||||
| 2 Satisfaction rate Show forest plot | 2 | Odds Ratio (M‐H, Fixed, 95% CI) | Subtotals only | |||||||||||||
| Analysis 11.2  Comparison 11 BALLOON (2nd G) versus TCRE (1st G), Outcome 2 Satisfaction rate. | ||||||||||||||||
| 2.1 At 6 months follow up | 1 | 50 | Odds Ratio (M‐H, Fixed, 95% CI) | 4.69 [0.18, 121.10] | ||||||||||||
| 2.2 At 12 months follow up | 2 | 122 | Odds Ratio (M‐H, Fixed, 95% CI) | 2.38 [0.57, 9.99] | ||||||||||||
| 2.3 At 2 years follow up | 1 | 68 | Odds Ratio (M‐H, Fixed, 95% CI) | 7.17 [1.44, 35.85] | ||||||||||||
| 3 Duration of operation (mins) Show forest plot | 1 | 82 | Mean Difference (IV, Fixed, 95% CI) | ‐13.0 [‐15.20, ‐10.80] | ||||||||||||
| Analysis 11.3  Comparison 11 BALLOON (2nd G) versus TCRE (1st G), Outcome 3 Duration of operation (mins). | ||||||||||||||||
| 4 Duration of operation (mins) Show forest plot | Other data | No numeric data | ||||||||||||||
| Analysis 11.4
Comparison 11 BALLOON (2nd G) versus TCRE (1st G), Outcome 4 Duration of operation (mins). | ||||||||||||||||
| 5 Operative difficulties Show forest plot | 1 | 51 | Odds Ratio (M‐H, Fixed, 95% CI) | 8.51 [0.44, 162.89] | ||||||||||||
| Analysis 11.5  Comparison 11 BALLOON (2nd G) versus TCRE (1st G), Outcome 5 Operative difficulties. | ||||||||||||||||
| 5.1 Equipment failure | 1 | 51 | Odds Ratio (M‐H, Fixed, 95% CI) | 8.51 [0.44, 162.89] | ||||||||||||
| 6 Hospital stay (days) Show forest plot | 1 | 82 | Mean Difference (IV, Fixed, 95% CI) | ‐0.30 [‐0.52, ‐0.08] | ||||||||||||
| Analysis 11.6  Comparison 11 BALLOON (2nd G) versus TCRE (1st G), Outcome 6 Hospital stay (days). | ||||||||||||||||
| 7 Duration of hospital stay (hours) Show forest plot | Other data | No numeric data | ||||||||||||||
| Analysis 11.7
Comparison 11 BALLOON (2nd G) versus TCRE (1st G), Outcome 7 Duration of hospital stay (hours). | ||||||||||||||||
| 8 Return to normal activities (days) Show forest plot | 1 | 82 | Mean Difference (IV, Fixed, 95% CI) | ‐2.10 [‐3.38, ‐0.82] | ||||||||||||
| Analysis 11.8  Comparison 11 BALLOON (2nd G) versus TCRE (1st G), Outcome 8 Return to normal activities (days). | ||||||||||||||||
| 9 Return to normal activities (days) Show forest plot | Other data | No numeric data | ||||||||||||||
| Analysis 11.9
Comparison 11 BALLOON (2nd G) versus TCRE (1st G), Outcome 9 Return to normal activities (days). | ||||||||||||||||
| 10 Intraoperative complications (continuous data) Show forest plot | 1 | 82 | Mean Difference (IV, Fixed, 95% CI) | ‐81.8 [‐93.33, ‐70.27] | ||||||||||||
| Analysis 11.10  Comparison 11 BALLOON (2nd G) versus TCRE (1st G), Outcome 10 Intraoperative complications (continuous data). | ||||||||||||||||
| 10.1 Blood loss | 1 | 82 | Mean Difference (IV, Fixed, 95% CI) | ‐81.8 [‐93.33, ‐70.27] | ||||||||||||
| 11 Intraoperative complications (dichotomous data) Show forest plot | 1 | Odds Ratio (M‐H, Fixed, 95% CI) | Subtotals only | |||||||||||||
| Analysis 11.11  Comparison 11 BALLOON (2nd G) versus TCRE (1st G), Outcome 11 Intraoperative complications (dichotomous data). | ||||||||||||||||
| 11.1 Fluid overload | 1 | 82 | Odds Ratio (M‐H, Fixed, 95% CI) | 0.08 [0.00, 1.57] | ||||||||||||
| 11.2 Cervical tear | 1 | 82 | Odds Ratio (M‐H, Fixed, 95% CI) | 0.34 [0.01, 8.63] | ||||||||||||
| 11.3 Conversion to hysterectomy | 1 | 88 | Odds Ratio (M‐H, Fixed, 95% CI) | 0.23 [0.01, 4.92] | ||||||||||||
| 12 Postoperative pain (continuous data) Show forest plot | 1 | 82 | Mean Difference (IV, Fixed, 95% CI) | ‐0.60 [‐0.88, ‐0.32] | ||||||||||||
| Analysis 11.12  Comparison 11 BALLOON (2nd G) versus TCRE (1st G), Outcome 12 Postoperative pain (continuous data). | ||||||||||||||||
| 13 Postoperative pain (descriptive data) Show forest plot | Other data | No numeric data | ||||||||||||||
| Analysis 11.13
Comparison 11 BALLOON (2nd G) versus TCRE (1st G), Outcome 13 Postoperative pain (descriptive data). | ||||||||||||||||
| 14 Postoperative complications Show forest plot | 1 | Odds Ratio (M‐H, Fixed, 95% CI) | Subtotals only | |||||||||||||
| Analysis 11.14  Comparison 11 BALLOON (2nd G) versus TCRE (1st G), Outcome 14 Postoperative complications. | ||||||||||||||||
| 14.1 Fever | 1 | 82 | Odds Ratio (M‐H, Fixed, 95% CI) | 0.51 [0.04, 5.89] | ||||||||||||
| 14.2 Urinary infection or retention | 1 | 82 | Odds Ratio (M‐H, Fixed, 95% CI) | 0.34 [0.01, 8.63] | ||||||||||||
| 14.3 Hemorrhage | 1 | 82 | Odds Ratio (M‐H, Fixed, 95% CI) | 1.36 [0.34, 5.46] | ||||||||||||
| 14.4 Blood transfusion | 1 | 82 | Odds Ratio (M‐H, Fixed, 95% CI) | 5.52 [0.26, 118.61] | ||||||||||||
| 15 Requirement for further surgery Show forest plot | 1 | Odds Ratio (M‐H, Fixed, 95% CI) | Subtotals only | |||||||||||||
| Analysis 11.15  Comparison 11 BALLOON (2nd G) versus TCRE (1st G), Outcome 15 Requirement for further surgery. | ||||||||||||||||
| 15.1 At 12 months follow up | 1 | 75 | Odds Ratio (M‐H, Fixed, 95% CI) | 0.49 [0.08, 2.83] | ||||||||||||
| 15.2 At 2 years follow up | 1 | 68 | Odds Ratio (M‐H, Fixed, 95% CI) | 0.34 [0.06, 1.89] | ||||||||||||
| 16 Requirement for further surgery (hyst only) Show forest plot | 1 | 45 | Odds Ratio (M‐H, Fixed, 95% CI) | 0.11 [0.00, 2.41] | ||||||||||||
| Analysis 11.16  Comparison 11 BALLOON (2nd G) versus TCRE (1st G), Outcome 16 Requirement for further surgery (hyst only). | ||||||||||||||||
| 16.1 At 12 months follow up | 1 | 45 | Odds Ratio (M‐H, Fixed, 95% CI) | 0.11 [0.00, 2.41] | ||||||||||||
| Outcome or subgroup title | No. of studies | No. of participants | Statistical method | Effect size | ||||||||||||||||
| 1 Amenorrhoea rate Show forest plot | 2 | Odds Ratio (M‐H, Fixed, 95% CI) | Subtotals only | |||||||||||||||||
| Analysis 12.1  Comparison 12 BIPOLAR RF (2nd G) versus BALLOON ABLATION (2nd G), Outcome 1 Amenorrhoea rate. | ||||||||||||||||||||
| 1.1 At 6 months follow up | 2 | 179 | Odds Ratio (M‐H, Fixed, 95% CI) | 6.97 [2.79, 17.47] | ||||||||||||||||
| 1.2 At 12 months follow up | 2 | 180 | Odds Ratio (M‐H, Fixed, 95% CI) | 7.84 [2.92, 21.00] | ||||||||||||||||
| 1.3 At 2 to 5 years follow up | 1 | 120 | Odds Ratio (M‐H, Fixed, 95% CI) | 2.09 [0.93, 4.69] | ||||||||||||||||
| 2 PBAC score after treatment Show forest plot | Other data | No numeric data | ||||||||||||||||||
| Analysis 12.2
Comparison 12 BIPOLAR RF (2nd G) versus BALLOON ABLATION (2nd G), Outcome 2 PBAC score after treatment. | ||||||||||||||||||||
| 2.1 At 12 months follow up | Other data | No numeric data | ||||||||||||||||||
| 3 Satisfaction rate Show forest plot | 2 | Odds Ratio (M‐H, Fixed, 95% CI) | Subtotals only | |||||||||||||||||
| Analysis 12.3  Comparison 12 BIPOLAR RF (2nd G) versus BALLOON ABLATION (2nd G), Outcome 3 Satisfaction rate. | ||||||||||||||||||||
| 3.1 At 6 months follow up | 2 | 181 | Odds Ratio (M‐H, Fixed, 95% CI) | 1.65 [0.72, 3.78] | ||||||||||||||||
| 3.2 At 12 months follow up | 2 | 181 | Odds Ratio (M‐H, Fixed, 95% CI) | 2.18 [0.88, 5.36] | ||||||||||||||||
| 4 Duration of operation Show forest plot | Other data | No numeric data | ||||||||||||||||||
| Analysis 12.4
Comparison 12 BIPOLAR RF (2nd G) versus BALLOON ABLATION (2nd G), Outcome 4 Duration of operation. | ||||||||||||||||||||
| 5 Operative difficulties Show forest plot | 1 | 55 | Odds Ratio (M‐H, Fixed, 95% CI) | 0.71 [0.11, 4.65] | ||||||||||||||||
| Analysis 12.5  Comparison 12 BIPOLAR RF (2nd G) versus BALLOON ABLATION (2nd G), Outcome 5 Operative difficulties. | ||||||||||||||||||||
| 5.1 Technical complication rate | 1 | 55 | Odds Ratio (M‐H, Fixed, 95% CI) | 0.71 [0.11, 4.65] | ||||||||||||||||
| 6 SF12 physical score Show forest plot | 1 | 55 | Mean Difference (IV, Fixed, 95% CI) | 1.60 [‐4.27, 7.47] | ||||||||||||||||
| Analysis 12.6  Comparison 12 BIPOLAR RF (2nd G) versus BALLOON ABLATION (2nd G), Outcome 6 SF12 physical score. | ||||||||||||||||||||
| 6.1 At 12 months follow up | 1 | 55 | Mean Difference (IV, Fixed, 95% CI) | 1.60 [‐4.27, 7.47] | ||||||||||||||||
| 7 SF12 mental score Show forest plot | 1 | 55 | Mean Difference (IV, Fixed, 95% CI) | 7.5 [‐0.52, 15.52] | ||||||||||||||||
| Analysis 12.7  Comparison 12 BIPOLAR RF (2nd G) versus BALLOON ABLATION (2nd G), Outcome 7 SF12 mental score. | ||||||||||||||||||||
| 7.1 At 12 months follow up | 1 | 55 | Mean Difference (IV, Fixed, 95% CI) | 7.5 [‐0.52, 15.52] | ||||||||||||||||
| 8 SF‐36 Physical function score Show forest plot | 1 | Mean Difference (IV, Fixed, 95% CI) | Subtotals only | |||||||||||||||||
| Analysis 12.8  Comparison 12 BIPOLAR RF (2nd G) versus BALLOON ABLATION (2nd G), Outcome 8 SF‐36 Physical function score. | ||||||||||||||||||||
| 8.1 At 6 months follow up | 1 | 90 | Mean Difference (IV, Fixed, 95% CI) | 2.0 [‐6.55, 10.55] | ||||||||||||||||
| 8.2 At 12 months follow up | 1 | 78 | Mean Difference (IV, Fixed, 95% CI) | 3.0 [‐6.44, 12.44] | ||||||||||||||||
| 8.3 At 2 to 5 years follow up | 1 | 98 | Mean Difference (IV, Fixed, 95% CI) | 2.0 [‐8.26, 12.26] | ||||||||||||||||
| 9 SF‐36 Role physical Show forest plot | 1 | Mean Difference (IV, Fixed, 95% CI) | Subtotals only | |||||||||||||||||
| Analysis 12.9  Comparison 12 BIPOLAR RF (2nd G) versus BALLOON ABLATION (2nd G), Outcome 9 SF‐36 Role physical. | ||||||||||||||||||||
| 9.1 At 6 months follow up | 1 | 90 | Mean Difference (IV, Fixed, 95% CI) | 5.0 [‐7.67, 17.67] | ||||||||||||||||
| 9.2 At 12 months follow up | 1 | 78 | Mean Difference (IV, Fixed, 95% CI) | 5.0 [‐6.96, 16.96] | ||||||||||||||||
| 9.3 At 2 to 5 years follow up | 1 | 98 | Mean Difference (IV, Fixed, 95% CI) | 8.0 [‐2.66, 18.66] | ||||||||||||||||
| 10 SF‐36 Role emotional Show forest plot | 1 | Mean Difference (IV, Fixed, 95% CI) | Subtotals only | |||||||||||||||||
| Analysis 12.10  Comparison 12 BIPOLAR RF (2nd G) versus BALLOON ABLATION (2nd G), Outcome 10 SF‐36 Role emotional. | ||||||||||||||||||||
| 10.1 At 6 months follow up | 1 | 90 | Mean Difference (IV, Fixed, 95% CI) | ‐6.0 [‐18.64, 6.64] | ||||||||||||||||
| 10.2 At 12 months follow up | 1 | 78 | Mean Difference (IV, Fixed, 95% CI) | 4.0 [‐1.92, 9.92] | ||||||||||||||||
| 10.3 At 2 to 5 years follow up | 1 | 98 | Mean Difference (IV, Fixed, 95% CI) | ‐9.0 [‐14.45, ‐3.55] | ||||||||||||||||
| 11 SF‐36 Social functioning Show forest plot | 1 | Mean Difference (IV, Fixed, 95% CI) | Subtotals only | |||||||||||||||||
| Analysis 12.11  Comparison 12 BIPOLAR RF (2nd G) versus BALLOON ABLATION (2nd G), Outcome 11 SF‐36 Social functioning. | ||||||||||||||||||||
| 11.1 At 6 months follow up | 1 | 90 | Mean Difference (IV, Fixed, 95% CI) | ‐1.0 [‐9.98, 7.98] | ||||||||||||||||
| 11.2 At 12 months follow up | 1 | 78 | Mean Difference (IV, Fixed, 95% CI) | 3.0 [‐6.17, 12.17] | ||||||||||||||||
| 11.3 At 2 to 5 years follow up | 1 | 98 | Mean Difference (IV, Fixed, 95% CI) | 4.0 [‐5.60, 13.60] | ||||||||||||||||
| 12 SF‐36 Mental health Show forest plot | 1 | Mean Difference (IV, Fixed, 95% CI) | Subtotals only | |||||||||||||||||
| Analysis 12.12  Comparison 12 BIPOLAR RF (2nd G) versus BALLOON ABLATION (2nd G), Outcome 12 SF‐36 Mental health. | ||||||||||||||||||||
| 12.1 At 6 months follow up | 1 | 90 | Mean Difference (IV, Fixed, 95% CI) | ‐3.0 [‐10.84, 4.84] | ||||||||||||||||
| 12.2 At 12 months follow up | 1 | 78 | Mean Difference (IV, Fixed, 95% CI) | 0.0 [‐8.03, 8.03] | ||||||||||||||||
| 12.3 At 2 to 5 years follow up | 1 | 98 | Mean Difference (IV, Fixed, 95% CI) | ‐5.0 [‐11.39, 1.39] | ||||||||||||||||
| 13 SF‐36 Energy/vitality Show forest plot | 1 | Mean Difference (IV, Fixed, 95% CI) | Subtotals only | |||||||||||||||||
| Analysis 12.13  Comparison 12 BIPOLAR RF (2nd G) versus BALLOON ABLATION (2nd G), Outcome 13 SF‐36 Energy/vitality. | ||||||||||||||||||||
| 13.1 At 6 months follow up | 1 | 90 | Mean Difference (IV, Fixed, 95% CI) | ‐6.0 [‐13.54, 1.54] | ||||||||||||||||
| 13.2 At 12 months follow up | 1 | 78 | Mean Difference (IV, Fixed, 95% CI) | 9.0 [‐0.44, 18.44] | ||||||||||||||||
| 13.3 At 2 to 5 years follow up | 1 | 98 | Mean Difference (IV, Fixed, 95% CI) | ‐3.0 [‐10.39, 4.39] | ||||||||||||||||
| 14 SF‐36 Pain Show forest plot | 1 | Mean Difference (IV, Fixed, 95% CI) | Subtotals only | |||||||||||||||||
| Analysis 12.14  Comparison 12 BIPOLAR RF (2nd G) versus BALLOON ABLATION (2nd G), Outcome 14 SF‐36 Pain. | ||||||||||||||||||||
| 14.1 At 6 months follow up | 1 | 90 | Mean Difference (IV, Fixed, 95% CI) | 2.0 [‐6.00, 12.00] | ||||||||||||||||
| 14.2 At 12 months follow up | 1 | 78 | Mean Difference (IV, Fixed, 95% CI) | ‐1.0 [‐12.61, 10.61] | ||||||||||||||||
| 14.3 At 2 to 5 years follow up | 1 | 98 | Mean Difference (IV, Fixed, 95% CI) | ‐5.0 [‐14.79, 4.79] | ||||||||||||||||
| 15 SF‐36 General health Show forest plot | 1 | Mean Difference (IV, Fixed, 95% CI) | Subtotals only | |||||||||||||||||
| Analysis 12.15  Comparison 12 BIPOLAR RF (2nd G) versus BALLOON ABLATION (2nd G), Outcome 15 SF‐36 General health. | ||||||||||||||||||||
| 15.1 At 6 months follow up | 1 | 90 | Mean Difference (IV, Fixed, 95% CI) | ‐5.0 [‐13.30, 3.30] | ||||||||||||||||
| 15.2 At 12 months follow up | 1 | 78 | Mean Difference (IV, Fixed, 95% CI) | 6.0 [‐4.10, 16.10] | ||||||||||||||||
| 15.3 At 2 to 5 years follow up | 1 | 98 | Mean Difference (IV, Fixed, 95% CI) | 6.0 [‐5.72, 17.72] | ||||||||||||||||
| 16 RSCL Physical symptoms Show forest plot | 1 | Mean Difference (IV, Fixed, 95% CI) | Subtotals only | |||||||||||||||||
| Analysis 12.16  Comparison 12 BIPOLAR RF (2nd G) versus BALLOON ABLATION (2nd G), Outcome 16 RSCL Physical symptoms. | ||||||||||||||||||||
| 16.1 At 6 months follow up | 1 | 90 | Mean Difference (IV, Fixed, 95% CI) | 1.0 [‐3.94, 5.94] | ||||||||||||||||
| 16.2 At 12 months follow up | 1 | 78 | Mean Difference (IV, Fixed, 95% CI) | ‐4.0 [‐8.56, 0.56] | ||||||||||||||||
| 17 RSCL Psychological distress Show forest plot | 1 | Mean Difference (IV, Fixed, 95% CI) | Subtotals only | |||||||||||||||||
| Analysis 12.17  Comparison 12 BIPOLAR RF (2nd G) versus BALLOON ABLATION (2nd G), Outcome 17 RSCL Psychological distress. | ||||||||||||||||||||
| 17.1 At 6 months follow up | 1 | 90 | Mean Difference (IV, Fixed, 95% CI) | ‐1.0 [‐10.14, 8.14] | ||||||||||||||||
| 17.2 At 12 months follow up | 1 | 78 | Mean Difference (IV, Fixed, 95% CI) | ‐1.0 [‐7.92, 5.92] | ||||||||||||||||
| 18 RSCL Activity level Show forest plot | 1 | Mean Difference (IV, Fixed, 95% CI) | Subtotals only | |||||||||||||||||
| Analysis 12.18  Comparison 12 BIPOLAR RF (2nd G) versus BALLOON ABLATION (2nd G), Outcome 18 RSCL Activity level. | ||||||||||||||||||||
| 18.1 At 6 months follow up | 1 | 90 | Mean Difference (IV, Fixed, 95% CI) | ‐1.0 [‐3.35, 1.35] | ||||||||||||||||
| 18.2 At 12 months follow up | 1 | 78 | Mean Difference (IV, Fixed, 95% CI) | ‐2.0 [‐4.32, 0.32] | ||||||||||||||||
| 19 RSCL Overall quality of life Show forest plot | 1 | Mean Difference (IV, Fixed, 95% CI) | Subtotals only | |||||||||||||||||
| Analysis 12.19  Comparison 12 BIPOLAR RF (2nd G) versus BALLOON ABLATION (2nd G), Outcome 19 RSCL Overall quality of life. | ||||||||||||||||||||
| 19.1 At 6 months follow up | 1 | 90 | Mean Difference (IV, Fixed, 95% CI) | ‐2.0 [‐12.29, 8.29] | ||||||||||||||||
| 19.2 At 12 months follow up | 1 | 78 | Mean Difference (IV, Fixed, 95% CI) | ‐9.0 [‐18.77, 0.77] | ||||||||||||||||
| 20 SDS Depression Show forest plot | 1 | Mean Difference (IV, Fixed, 95% CI) | Subtotals only | |||||||||||||||||
| Analysis 12.20  Comparison 12 BIPOLAR RF (2nd G) versus BALLOON ABLATION (2nd G), Outcome 20 SDS Depression. | ||||||||||||||||||||
| 20.1 At 6 months follow up | 1 | 90 | Mean Difference (IV, Fixed, 95% CI) | 2.0 [‐1.55, 5.55] | ||||||||||||||||
| 20.2 At 12 months follow up | 1 | 78 | Mean Difference (IV, Fixed, 95% CI) | ‐1.0 [‐5.24, 3.24] | ||||||||||||||||
| 21 Dysmenorrhoea rate Show forest plot | 1 | Odds Ratio (M‐H, Fixed, 95% CI) | Subtotals only | |||||||||||||||||
| Analysis 12.21  Comparison 12 BIPOLAR RF (2nd G) versus BALLOON ABLATION (2nd G), Outcome 21 Dysmenorrhoea rate. | ||||||||||||||||||||
| 21.1 At 6 months follow up | 1 | 126 | Odds Ratio (M‐H, Fixed, 95% CI) | 0.66 [0.21, 2.03] | ||||||||||||||||
| 21.2 At 12 months follow up | 1 | 126 | Odds Ratio (M‐H, Fixed, 95% CI) | 0.48 [0.15, 1.59] | ||||||||||||||||
| 21.3 At 2 to 5 years follow up | 1 | 97 | Odds Ratio (M‐H, Fixed, 95% CI) | 0.54 [0.18, 1.60] | ||||||||||||||||
| 22 Dysmenorrhoea rate (VAS score) Show forest plot | Other data | No numeric data | ||||||||||||||||||
| Analysis 12.22
Comparison 12 BIPOLAR RF (2nd G) versus BALLOON ABLATION (2nd G), Outcome 22 Dysmenorrhoea rate (VAS score). | ||||||||||||||||||||
| 22.1 At 12 months follow up | Other data | No numeric data | ||||||||||||||||||
| 23 PMS rate (VAS score) Show forest plot | Other data | No numeric data | ||||||||||||||||||
| Analysis 12.23
Comparison 12 BIPOLAR RF (2nd G) versus BALLOON ABLATION (2nd G), Outcome 23 PMS rate (VAS score). | ||||||||||||||||||||
| 23.1 At 12 months follow up | Other data | No numeric data | ||||||||||||||||||
| 24 Requirement for further surgery (ablation or hyst) Show forest plot | 2 | Odds Ratio (M‐H, Fixed, 95% CI) | Subtotals only | |||||||||||||||||
| Analysis 12.24  Comparison 12 BIPOLAR RF (2nd G) versus BALLOON ABLATION (2nd G), Outcome 24 Requirement for further surgery (ablation or hyst). | ||||||||||||||||||||
| 24.1 At 6 months follow up | 1 | 53 | Odds Ratio (M‐H, Fixed, 95% CI) | 0.0 [0.0, 0.0] | ||||||||||||||||
| 24.2 At 12 months follow up | 1 | 54 | Odds Ratio (M‐H, Fixed, 95% CI) | 7.22 [0.38, 135.96] | ||||||||||||||||
| 24.3 At 2 to 5 years follow up | 1 | 120 | Odds Ratio (M‐H, Fixed, 95% CI) | 0.69 [0.23, 2.09] | ||||||||||||||||
| 25 Requirement for further surgery (hyst only) Show forest plot | 1 | Odds Ratio (M‐H, Fixed, 95% CI) | Subtotals only | |||||||||||||||||
| Analysis 12.25  Comparison 12 BIPOLAR RF (2nd G) versus BALLOON ABLATION (2nd G), Outcome 25 Requirement for further surgery (hyst only). | ||||||||||||||||||||
| 25.1 At 12 months follow up | 1 | 126 | Odds Ratio (M‐H, Fixed, 95% CI) | 0.49 [0.12, 2.08] | ||||||||||||||||
| 25.2 At 2 to 5 years follow up | 1 | 120 | Odds Ratio (M‐H, Fixed, 95% CI) | 0.75 [0.23, 2.45] | ||||||||||||||||
| Outcome or subgroup title | No. of studies | No. of participants | Statistical method | Effect size |
| 1 Amenorrhoea rate Show forest plot | 12 | Odds Ratio (M‐H, Random, 95% CI) | Subtotals only | |
| Analysis 13.1  Comparison 13 Overall analyses: SECOND GENERATION ENDOMETRIAL ABLATION VS FIRST GENERATION ENDOMETRIAL ABLATION, Outcome 1 Amenorrhoea rate. | ||||
| 1.1 At 6 months follow up | 1 | 49 | Odds Ratio (M‐H, Random, 95% CI) | 3.00 [0.72, 12.53] |
| 1.2 At 1 year follow up | 12 | 2085 | Odds Ratio (M‐H, Random, 95% CI) | 0.92 [0.62, 1.37] |
| 1.3 At 2 years follow up | 3 | 701 | Odds Ratio (M‐H, Random, 95% CI) | 0.94 [0.58, 1.51] |
| 1.4 At 2 to 5 years follow up | 4 | 672 | Odds Ratio (M‐H, Random, 95% CI) | 1.30 [0.61, 2.79] |
| 2 Satisfaction rate Show forest plot | 13 | Odds Ratio (M‐H, Random, 95% CI) | Subtotals only | |
| Analysis 13.2  Comparison 13 Overall analyses: SECOND GENERATION ENDOMETRIAL ABLATION VS FIRST GENERATION ENDOMETRIAL ABLATION, Outcome 2 Satisfaction rate. | ||||
| 2.1 At 6 months follow up | 1 | 50 | Odds Ratio (M‐H, Random, 95% CI) | 4.69 [0.18, 121.10] |
| 2.2 At 1 year follow up | 11 | 1690 | Odds Ratio (M‐H, Random, 95% CI) | 1.20 [0.85, 1.70] |
| 2.3 At 2 years follow up | 5 | 802 | Odds Ratio (M‐H, Random, 95% CI) | 1.60 [1.00, 2.56] |
| 2.4 At 2 to 5 years follow up | 4 | 672 | Odds Ratio (M‐H, Random, 95% CI) | 1.43 [0.59, 3.46] |
| 3 Operative difficulties Show forest plot | 5 | Odds Ratio (M‐H, Random, 95% CI) | Subtotals only | |
| Analysis 13.3  Comparison 13 Overall analyses: SECOND GENERATION ENDOMETRIAL ABLATION VS FIRST GENERATION ENDOMETRIAL ABLATION, Outcome 3 Operative difficulties. | ||||
| 3.1 Equipment failure | 3 | 384 | Odds Ratio (M‐H, Random, 95% CI) | 4.61 [1.52, 13.97] |
| 3.2 Procedure abandoned | 3 | 629 | Odds Ratio (M‐H, Random, 95% CI) | 1.19 [0.37, 3.85] |
| 4 Duration of operation (mins) Show forest plot | 9 | 1762 | Mean Difference (IV, Random, 95% CI) | ‐14.86 [‐19.68, ‐10.05] |
| Analysis 13.4  Comparison 13 Overall analyses: SECOND GENERATION ENDOMETRIAL ABLATION VS FIRST GENERATION ENDOMETRIAL ABLATION, Outcome 4 Duration of operation (mins). | ||||
| 5 Proportion having local anaesthesia (%) Show forest plot | 6 | 1434 | Odds Ratio (M‐H, Random, 95% CI) | 6.40 [2.99, 13.68] |
| Analysis 13.5  Comparison 13 Overall analyses: SECOND GENERATION ENDOMETRIAL ABLATION VS FIRST GENERATION ENDOMETRIAL ABLATION, Outcome 5 Proportion having local anaesthesia (%). | ||||
| 6 Inability to work Show forest plot | 2 | 479 | Odds Ratio (M‐H, Random, 95% CI) | 0.83 [0.29, 2.40] |
| Analysis 13.6  Comparison 13 Overall analyses: SECOND GENERATION ENDOMETRIAL ABLATION VS FIRST GENERATION ENDOMETRIAL ABLATION, Outcome 6 Inability to work. | ||||
| 7 Operative or postoperative complication rate Show forest plot | 11 | Odds Ratio (M‐H, Random, 95% CI) | Subtotals only | |
| Analysis 13.7  Comparison 13 Overall analyses: SECOND GENERATION ENDOMETRIAL ABLATION VS FIRST GENERATION ENDOMETRIAL ABLATION, Outcome 7 Operative or postoperative complication rate. | ||||
| 7.1 Fluid overload | 4 | 681 | Odds Ratio (M‐H, Random, 95% CI) | 0.17 [0.04, 0.77] |
| 7.2 Perforation | 8 | 1885 | Odds Ratio (M‐H, Random, 95% CI) | 0.32 [0.10, 1.00] |
| 7.3 Cervical lacerations | 8 | 1676 | Odds Ratio (M‐H, Random, 95% CI) | 0.22 [0.08, 0.60] |
| 7.4 Endometritis | 5 | 1188 | Odds Ratio (M‐H, Random, 95% CI) | 1.26 [0.44, 3.60] |
| 7.5 UTI | 8 | 1834 | Odds Ratio (M‐H, Random, 95% CI) | 0.88 [0.43, 1.83] |
| 7.6 Hematometra | 5 | 1133 | Odds Ratio (M‐H, Random, 95% CI) | 0.31 [0.11, 0.85] |
| 7.7 Hydrosalpinx | 1 | 239 | Odds Ratio (M‐H, Random, 95% CI) | 0.30 [0.01, 7.47] |
| 7.8 Haemorrhage | 5 | 982 | Odds Ratio (M‐H, Random, 95% CI) | 0.69 [0.25, 1.92] |
| 7.9 Muscle fasciculation | 1 | 267 | Odds Ratio (M‐H, Random, 95% CI) | 2.58 [0.10, 63.95] |
| 7.10 Fever | 3 | 671 | Odds Ratio (M‐H, Random, 95% CI) | 0.92 [0.19, 4.44] |
| 7.11 Nausea/vomiting | 4 | 997 | Odds Ratio (M‐H, Random, 95% CI) | 2.44 [1.55, 3.85] |
| 7.12 Myometritis | 1 | 267 | Odds Ratio (M‐H, Random, 95% CI) | 0.28 [0.01, 7.00] |
| 7.13 Pelvic inflammatory disease | 1 | 265 | Odds Ratio (M‐H, Random, 95% CI) | 1.03 [0.09, 11.50] |
| 7.14 Pelvic abscess | 1 | 265 | Odds Ratio (M‐H, Random, 95% CI) | 0.17 [0.01, 4.22] |
| 7.15 Cervical stenosis | 1 | 322 | Odds Ratio (M‐H, Random, 95% CI) | 1.50 [0.06, 37.22] |
| 7.16 Uterine cramping | 2 | 601 | Odds Ratio (M‐H, Random, 95% CI) | 1.75 [1.08, 2.83] |
| 7.17 Severe pelvic pain | 3 | 683 | Odds Ratio (M‐H, Random, 95% CI) | 0.86 [0.18, 4.14] |
| 7.18 External burns | 1 | 269 | Odds Ratio (M‐H, Random, 95% CI) | 2.34 [0.11, 49.32] |
| 7.19 Blood transfusion | 1 | 82 | Odds Ratio (M‐H, Random, 95% CI) | 5.52 [0.26, 118.61] |
| 8 Requirement for any additional surgery Show forest plot | 9 | Odds Ratio (M‐H, Random, 95% CI) | Subtotals only | |
| Analysis 13.8  Comparison 13 Overall analyses: SECOND GENERATION ENDOMETRIAL ABLATION VS FIRST GENERATION ENDOMETRIAL ABLATION, Outcome 8 Requirement for any additional surgery. | ||||
| 8.1 In 1 year follow up | 7 | 1028 | Odds Ratio (M‐H, Random, 95% CI) | 0.74 [0.42, 1.31] |
| 8.2 In 2 years follow up | 5 | 988 | Odds Ratio (M‐H, Random, 95% CI) | 0.80 [0.48, 1.34] |
| 8.3 In 2 to 5 years follow up | 3 | 647 | Odds Ratio (M‐H, Random, 95% CI) | 0.94 [0.64, 1.39] |
| 9 Requirement for further surgery (hyst only) Show forest plot | 9 | Odds Ratio (M‐H, Random, 95% CI) | Subtotals only | |
| Analysis 13.9  Comparison 13 Overall analyses: SECOND GENERATION ENDOMETRIAL ABLATION VS FIRST GENERATION ENDOMETRIAL ABLATION, Outcome 9 Requirement for further surgery (hyst only). | ||||
| 9.1 At 1 year follow up | 4 | 772 | Odds Ratio (M‐H, Random, 95% CI) | 0.70 [0.35, 1.42] |
| 9.2 At 2 years follow up | 4 | 920 | Odds Ratio (M‐H, Random, 95% CI) | 0.85 [0.49, 1.46] |
| 9.3 At 2 to 5 years follow up | 4 | 758 | Odds Ratio (M‐H, Random, 95% CI) | 0.81 [0.51, 1.28] |
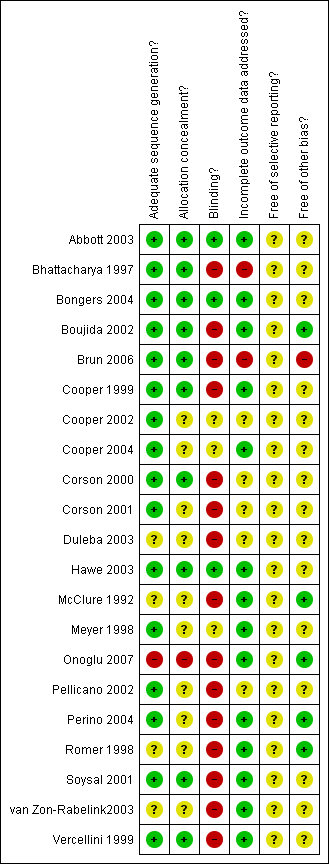
Methodological quality summary: review authors' judgements about each methodological quality item for each included study.

Comparison 1 LASER ABLATION (1st G) versus TCRE (1st G), Outcome 1 Amenorrhoea rate.
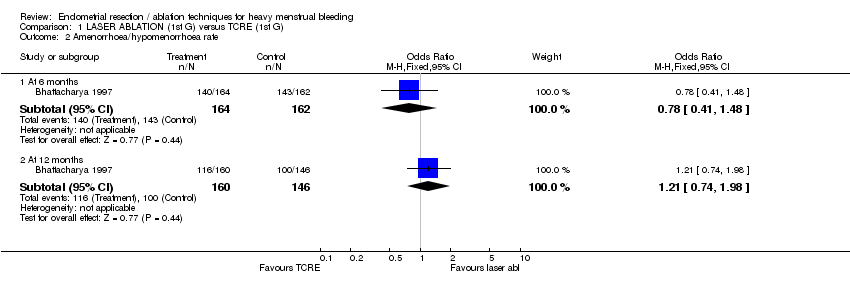
Comparison 1 LASER ABLATION (1st G) versus TCRE (1st G), Outcome 2 Amenorrhoea/hypomenorrhoea rate.
| Study | Laser ablation | TCRE + RB | Results |
| McClure 1992 | N=12 | N=10 | Mann Whitney test. |
Comparison 1 LASER ABLATION (1st G) versus TCRE (1st G), Outcome 3 MBL at 6 months (descriptive data).
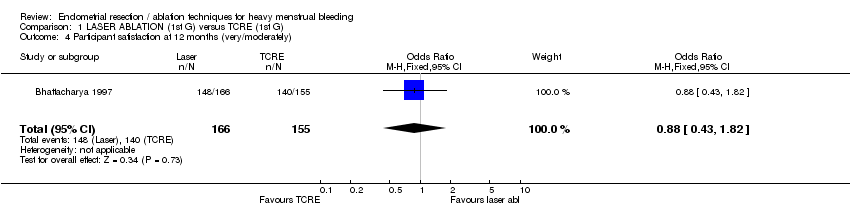
Comparison 1 LASER ABLATION (1st G) versus TCRE (1st G), Outcome 4 Participant satisfaction at 12 months (very/moderately).

Comparison 1 LASER ABLATION (1st G) versus TCRE (1st G), Outcome 5 Duration of operation (mins).
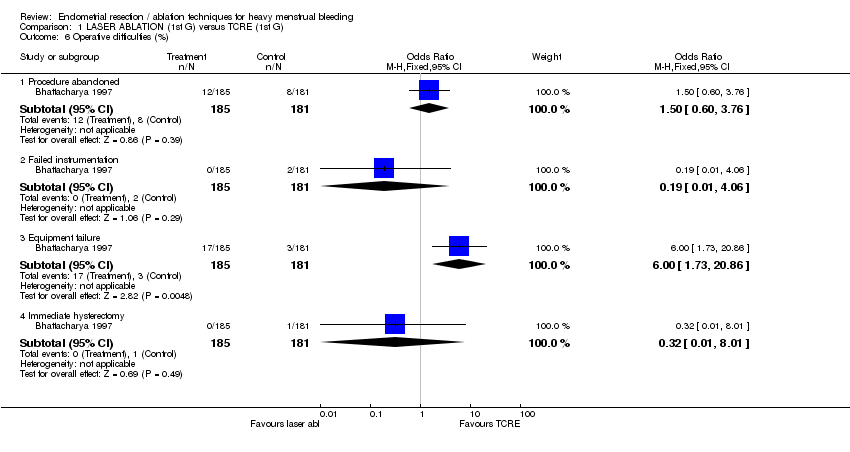
Comparison 1 LASER ABLATION (1st G) versus TCRE (1st G), Outcome 6 Operative difficulties (%).
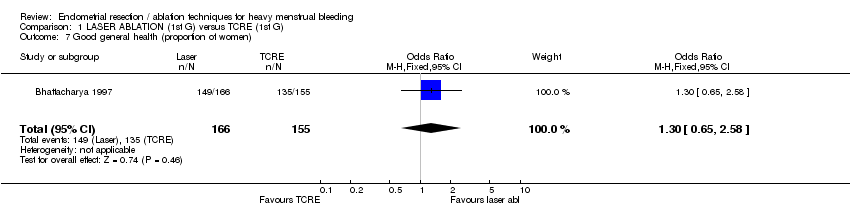
Comparison 1 LASER ABLATION (1st G) versus TCRE (1st G), Outcome 7 Good general health (proportion of women).
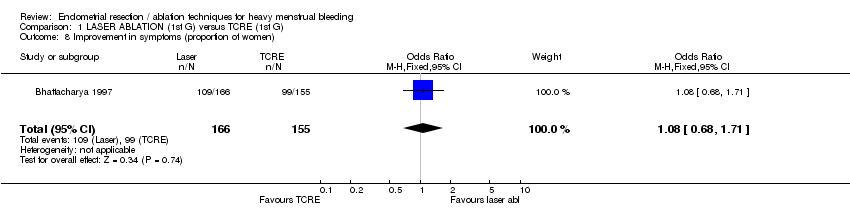
Comparison 1 LASER ABLATION (1st G) versus TCRE (1st G), Outcome 8 Improvement in symptoms (proportion of women).

Comparison 1 LASER ABLATION (1st G) versus TCRE (1st G), Outcome 9 Improvement in dysmenorrhea.
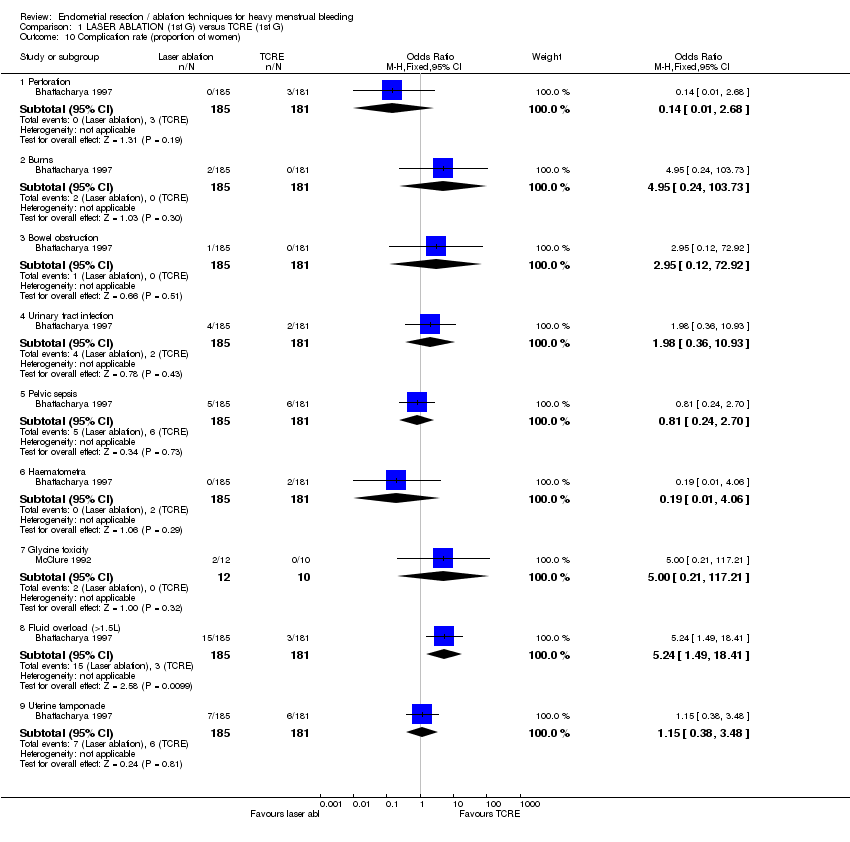
Comparison 1 LASER ABLATION (1st G) versus TCRE (1st G), Outcome 10 Complication rate (proportion of women).

Comparison 1 LASER ABLATION (1st G) versus TCRE (1st G), Outcome 11 Requirement for further surgical treatment (within 12 mths).

Comparison 2 VAPORISING ELECTRODE ABLATION (1st G) versus TCRE (1st G), Outcome 1 Amenorrhoea rate at 12 months follow up.
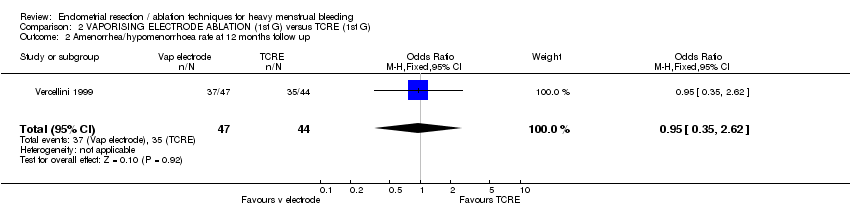
Comparison 2 VAPORISING ELECTRODE ABLATION (1st G) versus TCRE (1st G), Outcome 2 Amenorrhea/hypomenorrhoea rate at 12 months follow up.
| Study | Vaporising electrode | TCRE | Results |
| Vercellini 1999 | N=47 | N=44 | Unpaired t test. |
Comparison 2 VAPORISING ELECTRODE ABLATION (1st G) versus TCRE (1st G), Outcome 3 PBAC score at 12 mths.

Comparison 2 VAPORISING ELECTRODE ABLATION (1st G) versus TCRE (1st G), Outcome 4 Satisfaction rate at 12 mths (very/moderately).
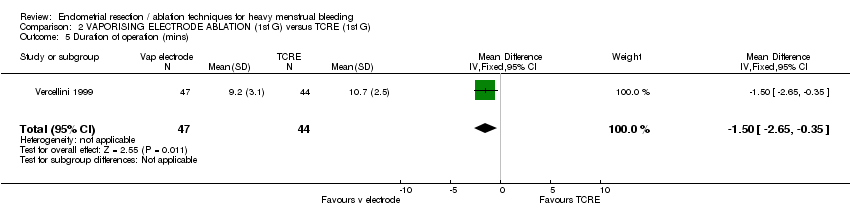
Comparison 2 VAPORISING ELECTRODE ABLATION (1st G) versus TCRE (1st G), Outcome 5 Duration of operation (mins).

Comparison 2 VAPORISING ELECTRODE ABLATION (1st G) versus TCRE (1st G), Outcome 6 Operative difficulties.

Comparison 2 VAPORISING ELECTRODE ABLATION (1st G) versus TCRE (1st G), Outcome 7 Degree of fluid deficit (ml).

Comparison 3 ROLLERBALL (1st G) versus TCRE (1st G), Outcome 1 Duration of operation (mins).
| Study | Rollerball | TCRE | Comment |
| Boujida 2002 | N=61 | N=59 | Mann Whitney test: P<0.05 |
Comparison 3 ROLLERBALL (1st G) versus TCRE (1st G), Outcome 2 Duration of operation (descriptive data).

Comparison 3 ROLLERBALL (1st G) versus TCRE (1st G), Outcome 3 Complication rate.
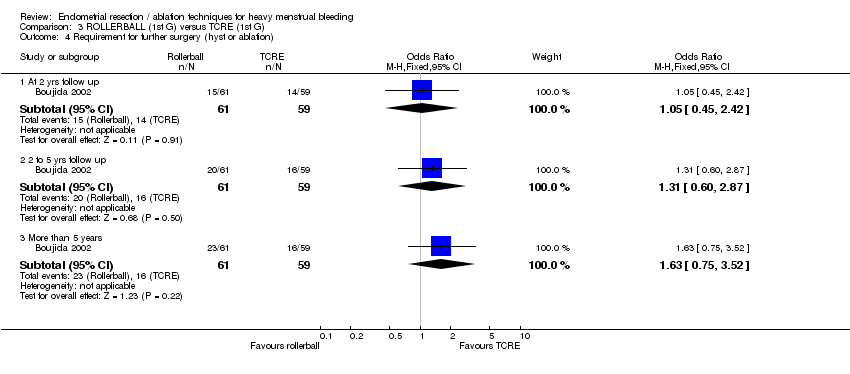
Comparison 3 ROLLERBALL (1st G) versus TCRE (1st G), Outcome 4 Requirement for further surgery (hyst or ablation).

Comparison 3 ROLLERBALL (1st G) versus TCRE (1st G), Outcome 5 Requirement for further surgery rate (hyst only).
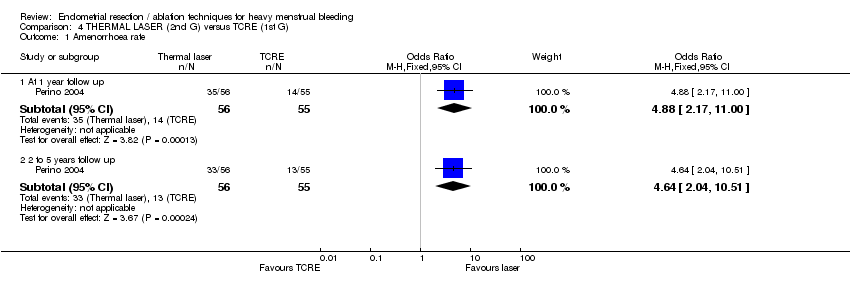
Comparison 4 THERMAL LASER (2nd G) versus TCRE (1st G), Outcome 1 Amenorrhoea rate.

Comparison 4 THERMAL LASER (2nd G) versus TCRE (1st G), Outcome 2 Satisfaction rate.

Comparison 4 THERMAL LASER (2nd G) versus TCRE (1st G), Outcome 3 Duration of operation.
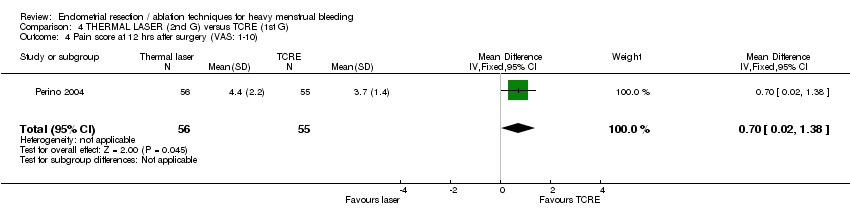
Comparison 4 THERMAL LASER (2nd G) versus TCRE (1st G), Outcome 4 Pain score at 12 hrs after surgery (VAS: 1‐10).

Comparison 4 THERMAL LASER (2nd G) versus TCRE (1st G), Outcome 5 Intraoperative complication rate.

Comparison 4 THERMAL LASER (2nd G) versus TCRE (1st G), Outcome 6 Requirement for further surgery rate (hyst only).

Comparison 5 HYDROTHERMAL ABLATION (2nd G) versus ROLLERBALL (1st G), Outcome 1 Amenorrhoea rate.
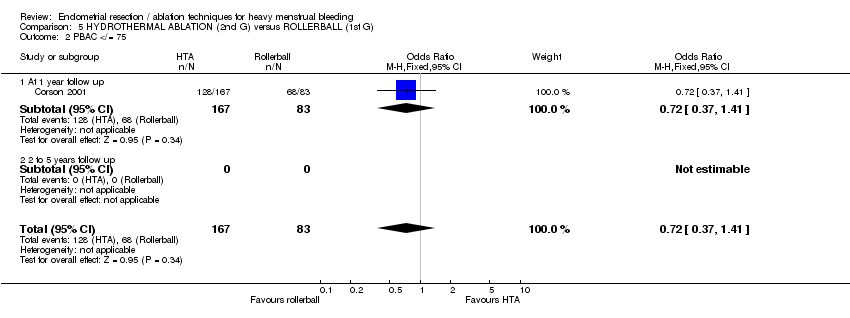
Comparison 5 HYDROTHERMAL ABLATION (2nd G) versus ROLLERBALL (1st G), Outcome 2 PBAC </= 75.

Comparison 5 HYDROTHERMAL ABLATION (2nd G) versus ROLLERBALL (1st G), Outcome 3 Proportion with "normal" bleeding (PBAC </= 100).

Comparison 5 HYDROTHERMAL ABLATION (2nd G) versus ROLLERBALL (1st G), Outcome 4 Satisfaction rate.
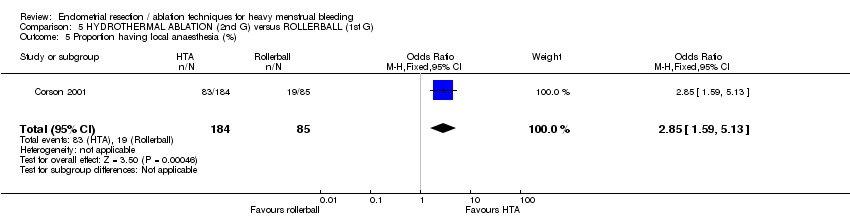
Comparison 5 HYDROTHERMAL ABLATION (2nd G) versus ROLLERBALL (1st G), Outcome 5 Proportion having local anaesthesia (%).

Comparison 5 HYDROTHERMAL ABLATION (2nd G) versus ROLLERBALL (1st G), Outcome 6 Intraoperative complication rate.

Comparison 5 HYDROTHERMAL ABLATION (2nd G) versus ROLLERBALL (1st G), Outcome 7 Postoperative complication rate.

Comparison 5 HYDROTHERMAL ABLATION (2nd G) versus ROLLERBALL (1st G), Outcome 8 Requirement for further surgery (any surgery).

Comparison 5 HYDROTHERMAL ABLATION (2nd G) versus ROLLERBALL (1st G), Outcome 9 Requirement for further surgery rate (hyst only).

Comparison 6 CRYOABLATION (2nd G) versus ROLLERBALL (1st G), Outcome 1 Amenorrhoea rate.
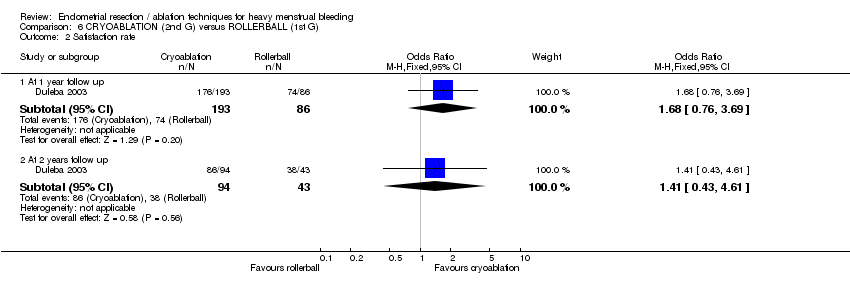
Comparison 6 CRYOABLATION (2nd G) versus ROLLERBALL (1st G), Outcome 2 Satisfaction rate.

Comparison 6 CRYOABLATION (2nd G) versus ROLLERBALL (1st G), Outcome 3 Proportion having local anaesthesia (%).

Comparison 6 CRYOABLATION (2nd G) versus ROLLERBALL (1st G), Outcome 4 Intraoperative complication rate.

Comparison 6 CRYOABLATION (2nd G) versus ROLLERBALL (1st G), Outcome 5 Requirement for further surgery (any surgery).

Comparison 6 CRYOABLATION (2nd G) versus ROLLERBALL (1st G), Outcome 6 Requirement for further surgery rate (hyst only).

Comparison 7 ELECTRODE ABLATION (2nd G) versus TCRE + ROLLERBALL (1st G), Outcome 1 Amenorrhea rate at 1 yr follow up.
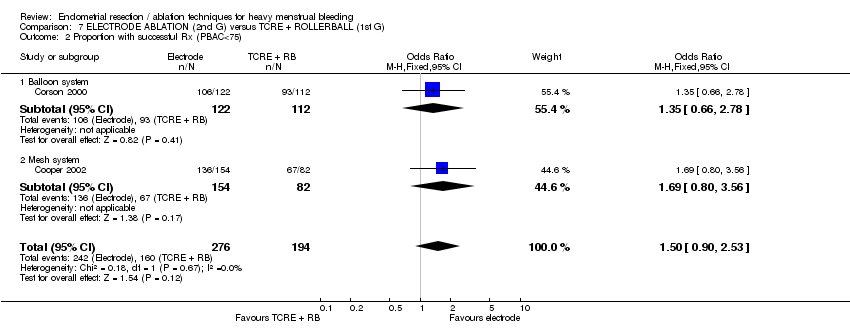
Comparison 7 ELECTRODE ABLATION (2nd G) versus TCRE + ROLLERBALL (1st G), Outcome 2 Proportion with successful Rx (PBAC<75).
| Study | Electrode system | TCRE + RB | Stat test for diff |
| Balloon system | |||
| Corson 2000 | N=122 | N=112 | Not significantly different |
| Mesh system | |||
| Cooper 2002 | N=154 | N=82 | No reported difference |
Comparison 7 ELECTRODE ABLATION (2nd G) versus TCRE + ROLLERBALL (1st G), Outcome 3 PBAC score 12 months after treatment.
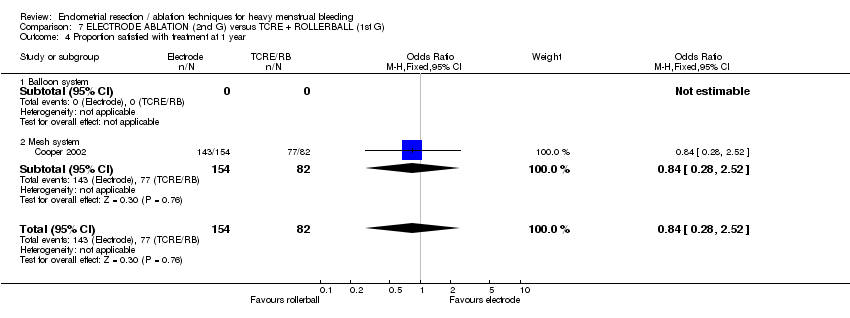
Comparison 7 ELECTRODE ABLATION (2nd G) versus TCRE + ROLLERBALL (1st G), Outcome 4 Proportion satisfied with treatment at 1 year.

Comparison 7 ELECTRODE ABLATION (2nd G) versus TCRE + ROLLERBALL (1st G), Outcome 5 Duration of operation (mins).

Comparison 7 ELECTRODE ABLATION (2nd G) versus TCRE + ROLLERBALL (1st G), Outcome 6 Proportion having local anaesthesia (%).
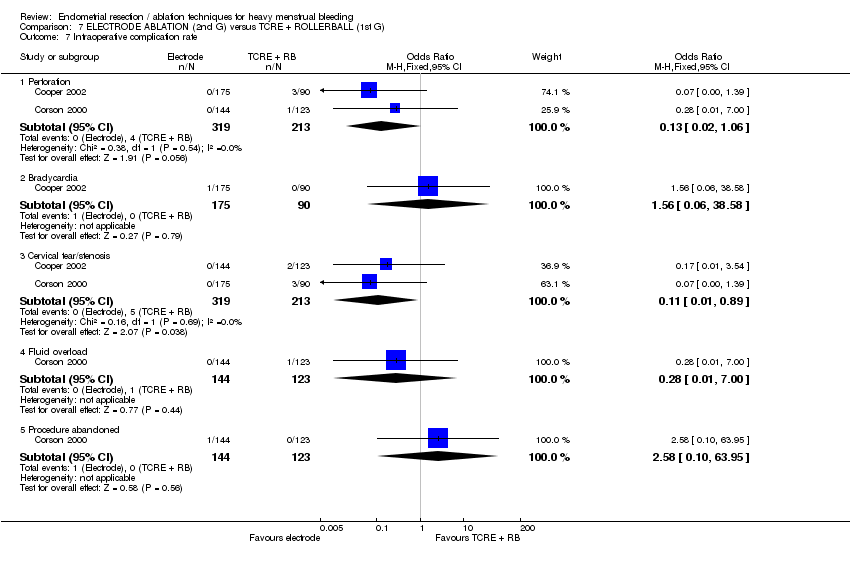
Comparison 7 ELECTRODE ABLATION (2nd G) versus TCRE + ROLLERBALL (1st G), Outcome 7 Intraoperative complication rate.
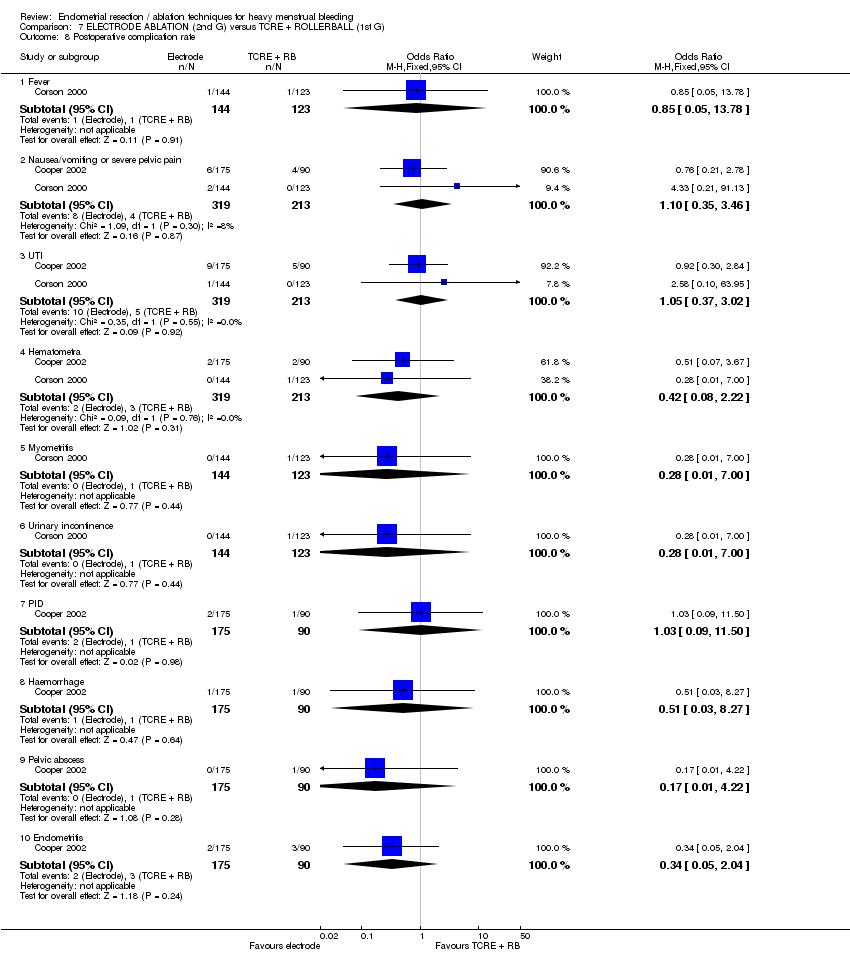
Comparison 7 ELECTRODE ABLATION (2nd G) versus TCRE + ROLLERBALL (1st G), Outcome 8 Postoperative complication rate.
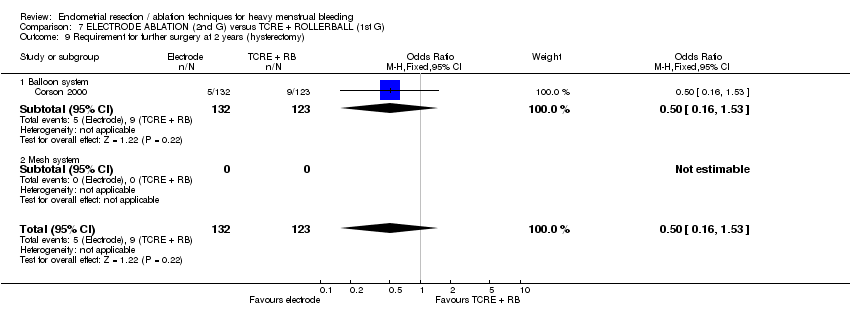
Comparison 7 ELECTRODE ABLATION (2nd G) versus TCRE + ROLLERBALL (1st G), Outcome 9 Requirement for further surgery at 2 years (hysterectomy).

Comparison 8 MICROWAVE ABLATION (2nd G) versus TCRE + RB(1st G), Outcome 1 Amenorrhea rate.
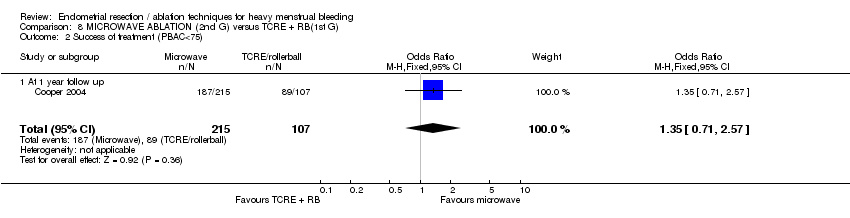
Comparison 8 MICROWAVE ABLATION (2nd G) versus TCRE + RB(1st G), Outcome 2 Success of treatment (PBAC<75).

Comparison 8 MICROWAVE ABLATION (2nd G) versus TCRE + RB(1st G), Outcome 3 Satisfaction rate.
| Study | Microwave | TCRE | Results |
| Cooper 1999 | N=129 | N=134 | Mann Whitney U test |
Comparison 8 MICROWAVE ABLATION (2nd G) versus TCRE + RB(1st G), Outcome 4 Duration of operation (mins).

Comparison 8 MICROWAVE ABLATION (2nd G) versus TCRE + RB(1st G), Outcome 5 Operative difficulties.
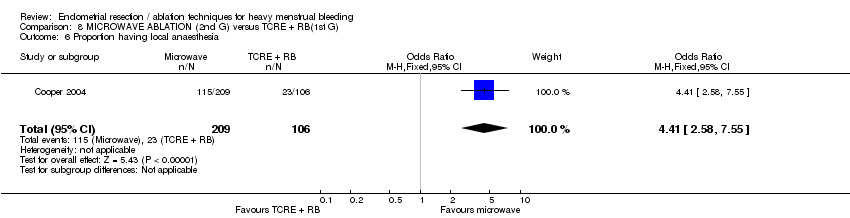
Comparison 8 MICROWAVE ABLATION (2nd G) versus TCRE + RB(1st G), Outcome 6 Proportion having local anaesthesia.
| Study | Microwave | TCRE | Results |
| Cooper 1999 | N=129 | N=134 | Mann Whitney U test |
Comparison 8 MICROWAVE ABLATION (2nd G) versus TCRE + RB(1st G), Outcome 7 Duration of hospital stay (hours).
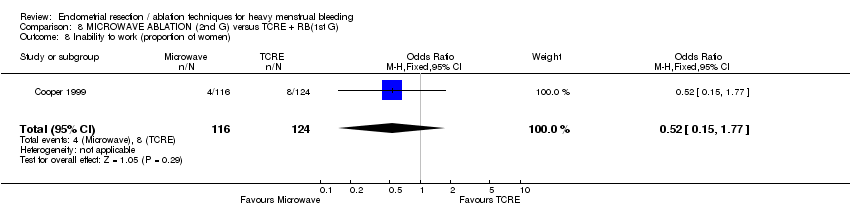
Comparison 8 MICROWAVE ABLATION (2nd G) versus TCRE + RB(1st G), Outcome 8 Inability to work (proportion of women).
| Study | MEA | TCRE | Results |
| Physical functioning | |||
| Cooper 1999 | AT 1 YEAR: | AT 1 YEAR: | AT 1 YEAR: |
| Social functioning | |||
| Cooper 1999 | AT 1 YEAR: | N=124 | AT 1 YEAR: |
| Physical role | |||
| Cooper 1999 | AT 1 YEAR: | AT 1 YEAR: | AT 1 YEAR: |
| Emotional role | |||
| Cooper 1999 | AT ONE YEAR: | AT 1 YEAR: | AT 1 YEAR: |
| Mental health | |||
| Cooper 1999 | AT 1 YEAR: | AT 1 YEAR: | AT 1 YEAR: |
| Energy/fatigue | |||
| Cooper 1999 | AT 1 YEAR: | AT 1 YEAR: | AT 1 YEAR: |
| Pain | |||
| Cooper 1999 | AT 1 YEAR: | AT 1 YEAR: | AT 1 YEAR: |
| General health | |||
| Cooper 1999 | AT 1 YEAR: | AT 1 YEAR: | AT 1 YEAR: |
Comparison 8 MICROWAVE ABLATION (2nd G) versus TCRE + RB(1st G), Outcome 9 Change in SF36 score after treatment.
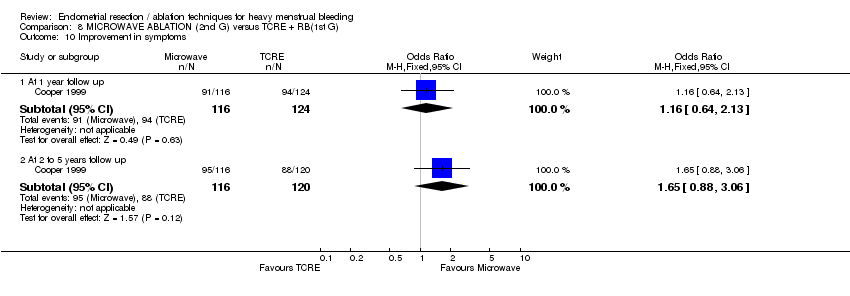
Comparison 8 MICROWAVE ABLATION (2nd G) versus TCRE + RB(1st G), Outcome 10 Improvement in symptoms.

Comparison 8 MICROWAVE ABLATION (2nd G) versus TCRE + RB(1st G), Outcome 11 Improvement in dysmenorrhoea.

Comparison 8 MICROWAVE ABLATION (2nd G) versus TCRE + RB(1st G), Outcome 12 Postoperative analgesia rate.
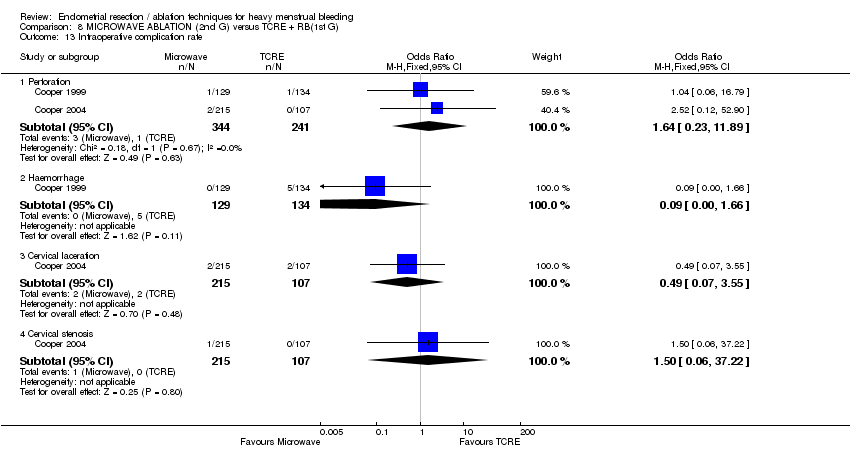
Comparison 8 MICROWAVE ABLATION (2nd G) versus TCRE + RB(1st G), Outcome 13 Intraoperative complication rate.

Comparison 8 MICROWAVE ABLATION (2nd G) versus TCRE + RB(1st G), Outcome 14 Postoperative complication rate (wihin 24 hours).
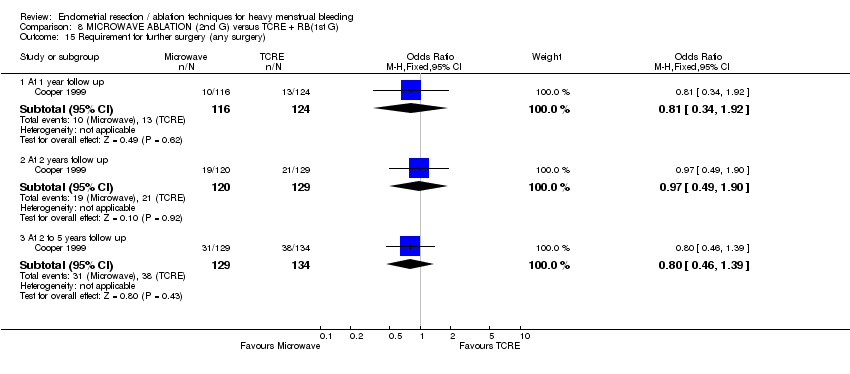
Comparison 8 MICROWAVE ABLATION (2nd G) versus TCRE + RB(1st G), Outcome 15 Requirement for further surgery (any surgery).

Comparison 8 MICROWAVE ABLATION (2nd G) versus TCRE + RB(1st G), Outcome 16 Requirement for further surgery rate (hyst only).

Comparison 9 BALLOON ENDOMETRIAL ABLATION (2nd G) versus ROLLERBALL ENDOMETRIAL ABLATION (1st G), Outcome 1 Amenorrhea rate.
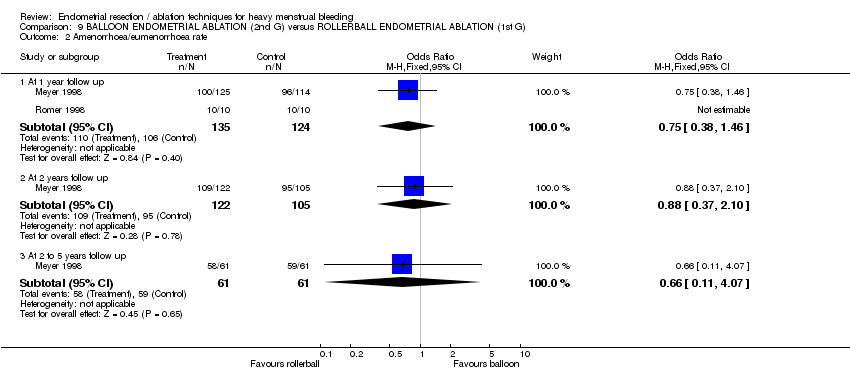
Comparison 9 BALLOON ENDOMETRIAL ABLATION (2nd G) versus ROLLERBALL ENDOMETRIAL ABLATION (1st G), Outcome 2 Amenorrhoea/eumenorrhoea rate.
| Study | Balloon | Rollerball | Results |
| At 1 year follow up | |||
| Meyer 1998 | N=125 | N=114 | No statistical test performed of these outcomes |
| Soysal 2001 | N=41 | N=44 | Significance not reported |
| van Zon‐Rabelink2003 | N=74 | N=55 | Wilcoxon test: |
| At 2 years follow up | |||
| van Zon‐Rabelink2003 | N=66 | N=55 | Wilcoxon test: P=0.01 |
Comparison 9 BALLOON ENDOMETRIAL ABLATION (2nd G) versus ROLLERBALL ENDOMETRIAL ABLATION (1st G), Outcome 3 PBAC score after treatment.
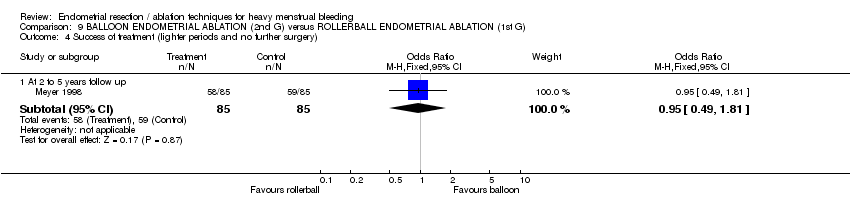
Comparison 9 BALLOON ENDOMETRIAL ABLATION (2nd G) versus ROLLERBALL ENDOMETRIAL ABLATION (1st G), Outcome 4 Success of treatment (lighter periods and no further surgery).

Comparison 9 BALLOON ENDOMETRIAL ABLATION (2nd G) versus ROLLERBALL ENDOMETRIAL ABLATION (1st G), Outcome 5 Success of treatment (PBAC<75).
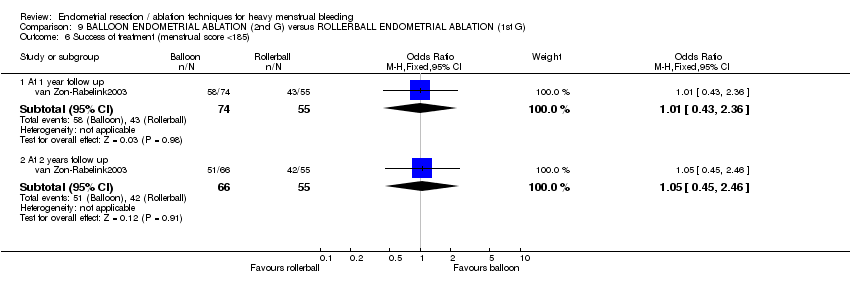
Comparison 9 BALLOON ENDOMETRIAL ABLATION (2nd G) versus ROLLERBALL ENDOMETRIAL ABLATION (1st G), Outcome 6 Success of treatment (menstrual score <185).

Comparison 9 BALLOON ENDOMETRIAL ABLATION (2nd G) versus ROLLERBALL ENDOMETRIAL ABLATION (1st G), Outcome 7 Satisfaction rate.

Comparison 9 BALLOON ENDOMETRIAL ABLATION (2nd G) versus ROLLERBALL ENDOMETRIAL ABLATION (1st G), Outcome 8 Duration of operation (mins).

Comparison 9 BALLOON ENDOMETRIAL ABLATION (2nd G) versus ROLLERBALL ENDOMETRIAL ABLATION (1st G), Outcome 9 Operative difficulties.
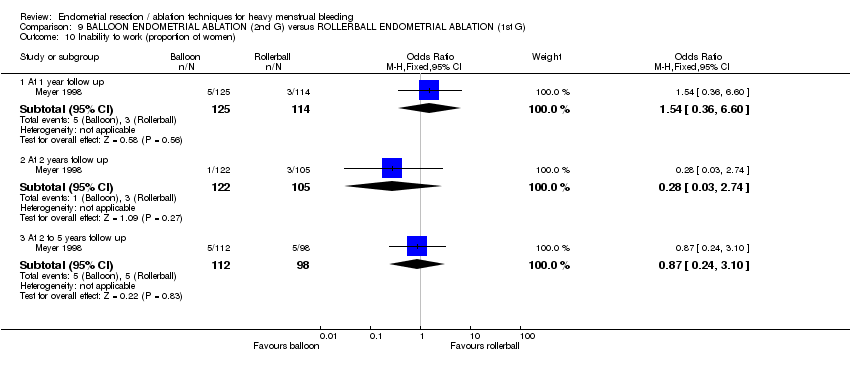
Comparison 9 BALLOON ENDOMETRIAL ABLATION (2nd G) versus ROLLERBALL ENDOMETRIAL ABLATION (1st G), Outcome 10 Inability to work (proportion of women).

Comparison 9 BALLOON ENDOMETRIAL ABLATION (2nd G) versus ROLLERBALL ENDOMETRIAL ABLATION (1st G), Outcome 11 Improvement in dysmenorrhea at 12 months.
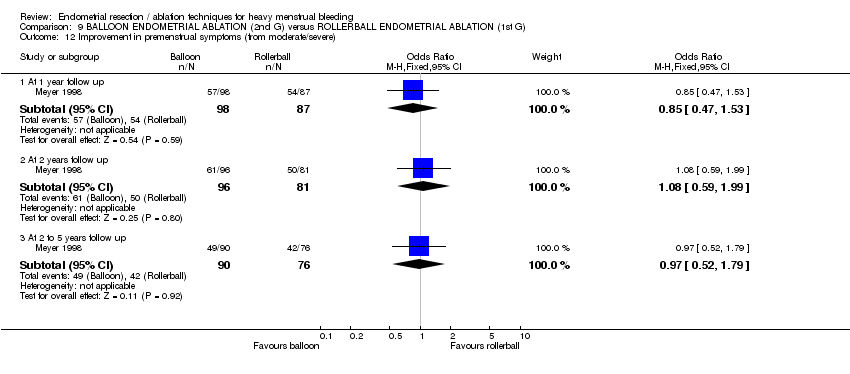
Comparison 9 BALLOON ENDOMETRIAL ABLATION (2nd G) versus ROLLERBALL ENDOMETRIAL ABLATION (1st G), Outcome 12 Improvement in premenstrual symptoms (from moderate/severe).

Comparison 9 BALLOON ENDOMETRIAL ABLATION (2nd G) versus ROLLERBALL ENDOMETRIAL ABLATION (1st G), Outcome 13 Complication rate (proportion of women).

Comparison 9 BALLOON ENDOMETRIAL ABLATION (2nd G) versus ROLLERBALL ENDOMETRIAL ABLATION (1st G), Outcome 14 Requirement for further surgery (any surgery).
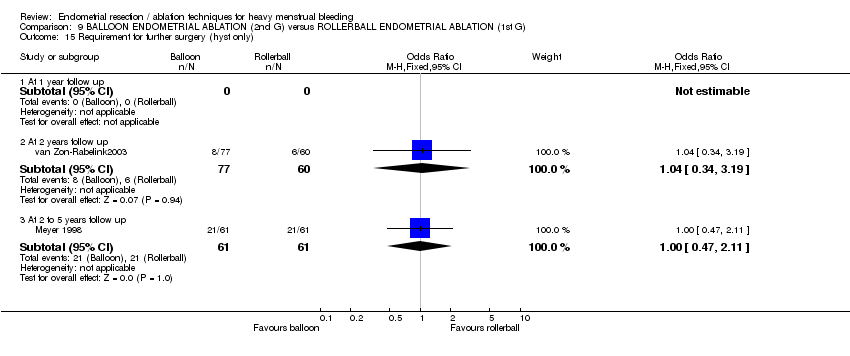
Comparison 9 BALLOON ENDOMETRIAL ABLATION (2nd G) versus ROLLERBALL ENDOMETRIAL ABLATION (1st G), Outcome 15 Requirement for further surgery (hyst only).
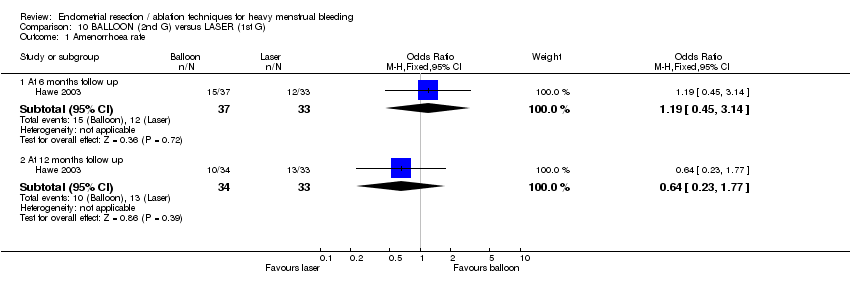
Comparison 10 BALLOON (2nd G) versus LASER (1st G), Outcome 1 Amenorrhoea rate.
| Study | Balloon | Laser | Statistical test |
| At 6 months follow up | |||
| Hawe 2003 | N=37 | N=33 | Significance not reported |
Comparison 10 BALLOON (2nd G) versus LASER (1st G), Outcome 2 PBAC score after treatment.
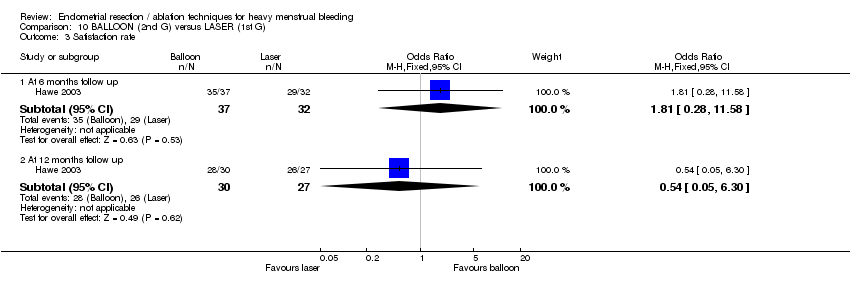
Comparison 10 BALLOON (2nd G) versus LASER (1st G), Outcome 3 Satisfaction rate.
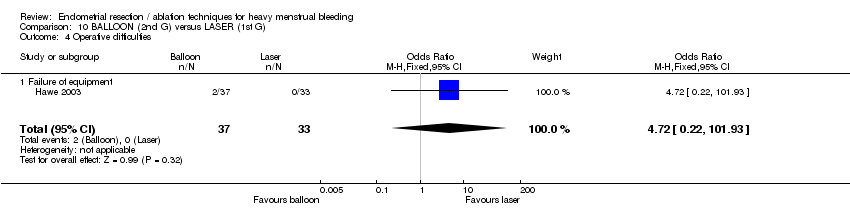
Comparison 10 BALLOON (2nd G) versus LASER (1st G), Outcome 4 Operative difficulties.

Comparison 10 BALLOON (2nd G) versus LASER (1st G), Outcome 5 Euroquol 5D.
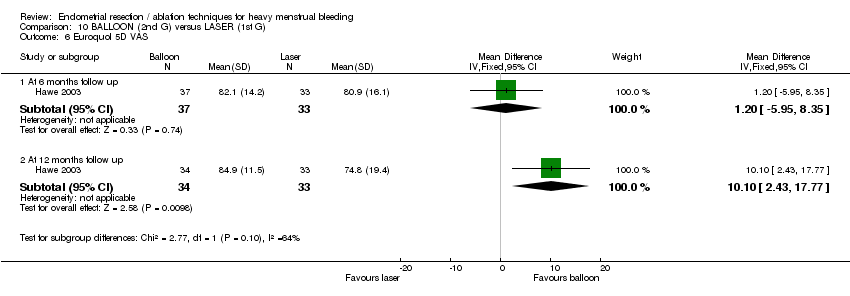
Comparison 10 BALLOON (2nd G) versus LASER (1st G), Outcome 6 Euroquol 5D VAS.

Comparison 10 BALLOON (2nd G) versus LASER (1st G), Outcome 7 SF12 Physical Scale.

Comparison 10 BALLOON (2nd G) versus LASER (1st G), Outcome 8 SF12 Mental Scale.

Comparison 10 BALLOON (2nd G) versus LASER (1st G), Outcome 9 SAQ pleasure scale.

Comparison 10 BALLOON (2nd G) versus LASER (1st G), Outcome 10 SAQ habit scale.
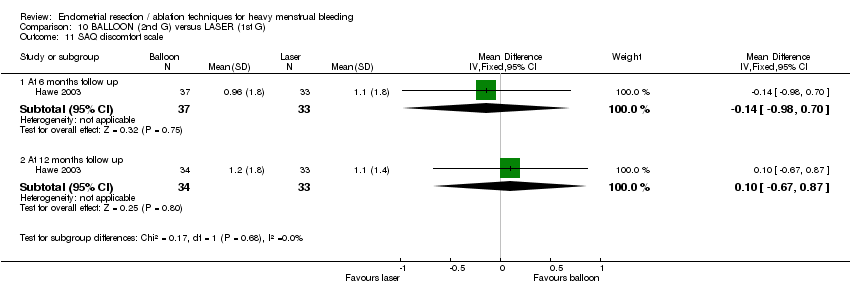
Comparison 10 BALLOON (2nd G) versus LASER (1st G), Outcome 11 SAQ discomfort scale.
| Study | Balloon | Laser | Statistical test |
| At 6 months follow up | |||
| Hawe 2003 | N=37 | N=33 | Not reported |
| At 12 months follow up | |||
| Hawe 2003 | N=34 | N=33 | Not reported |
Comparison 10 BALLOON (2nd G) versus LASER (1st G), Outcome 12 PMS (visual analogue).
| Study | Balloon | Laser | Statistical test |
| At 6 months follow up | |||
| Hawe 2003 | N=37 | N=33 | Not reported |
| At 12 months follow up | |||
| Hawe 2003 | N=34 | N=33 | Not reported |
Comparison 10 BALLOON (2nd G) versus LASER (1st G), Outcome 13 Dysmenorrhoea (visual analogue).

Comparison 10 BALLOON (2nd G) versus LASER (1st G), Outcome 14 Pain score.
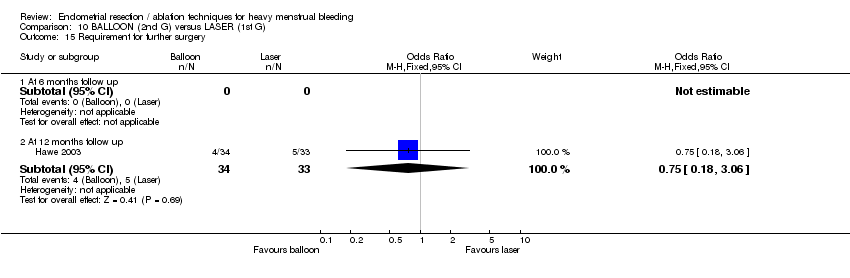
Comparison 10 BALLOON (2nd G) versus LASER (1st G), Outcome 15 Requirement for further surgery.

Comparison 11 BALLOON (2nd G) versus TCRE (1st G), Outcome 1 Amenorrhoea rate.

Comparison 11 BALLOON (2nd G) versus TCRE (1st G), Outcome 2 Satisfaction rate.

Comparison 11 BALLOON (2nd G) versus TCRE (1st G), Outcome 3 Duration of operation (mins).
| Study | Cavaterm balloon | TCRE | Comments |
| Brun 2006 | n=31 Median (range): 48 (24‐150) | n=20 Median (range): 45 (23‐105) | No statistical test reported ‐ unlikely to be a difference |
Comparison 11 BALLOON (2nd G) versus TCRE (1st G), Outcome 4 Duration of operation (mins).

Comparison 11 BALLOON (2nd G) versus TCRE (1st G), Outcome 5 Operative difficulties.

Comparison 11 BALLOON (2nd G) versus TCRE (1st G), Outcome 6 Hospital stay (days).
| Study | Cavaterm balloon | TCRE | Comments |
| Brun 2006 | n=31 Median (range): 21 (0‐36) | n=20 Median (range): 30 (6‐72) | Mann Whitney rank sum test P=0.012 |
Comparison 11 BALLOON (2nd G) versus TCRE (1st G), Outcome 7 Duration of hospital stay (hours).
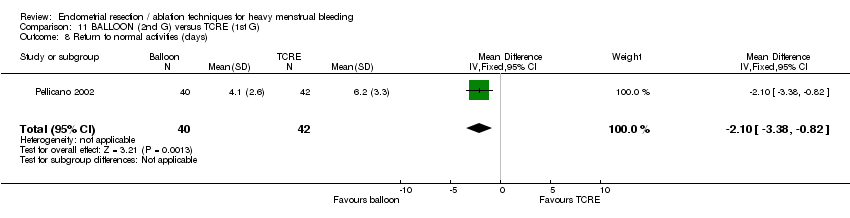
Comparison 11 BALLOON (2nd G) versus TCRE (1st G), Outcome 8 Return to normal activities (days).
| Study | Cavaterm balloon | TCRE | Comments |
| Brun 2006 | n=31 Median (range): 4 (1‐20) | n=20 Median (range): 2 (1‐30) | Mann Whitney rank test ‐ not significantly different |
Comparison 11 BALLOON (2nd G) versus TCRE (1st G), Outcome 9 Return to normal activities (days).

Comparison 11 BALLOON (2nd G) versus TCRE (1st G), Outcome 10 Intraoperative complications (continuous data).
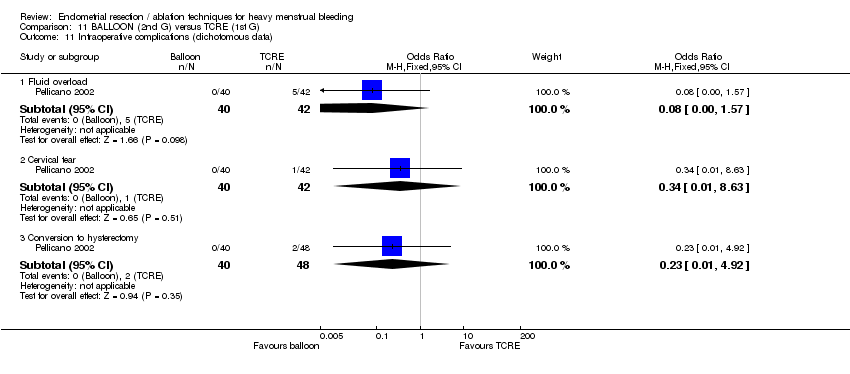
Comparison 11 BALLOON (2nd G) versus TCRE (1st G), Outcome 11 Intraoperative complications (dichotomous data).

Comparison 11 BALLOON (2nd G) versus TCRE (1st G), Outcome 12 Postoperative pain (continuous data).
| Study | Cavaterm balloon | TCRE | Comments |
| Brun 2006 | n=31 Pain score (VAS scale 0‐100): median (range): 45 (1‐100) | n=20 Pain score (VAS scale 0‐100): median (range): 10 (0‐90) | Mann Whitney rank sum test: P=0.012 |
Comparison 11 BALLOON (2nd G) versus TCRE (1st G), Outcome 13 Postoperative pain (descriptive data).
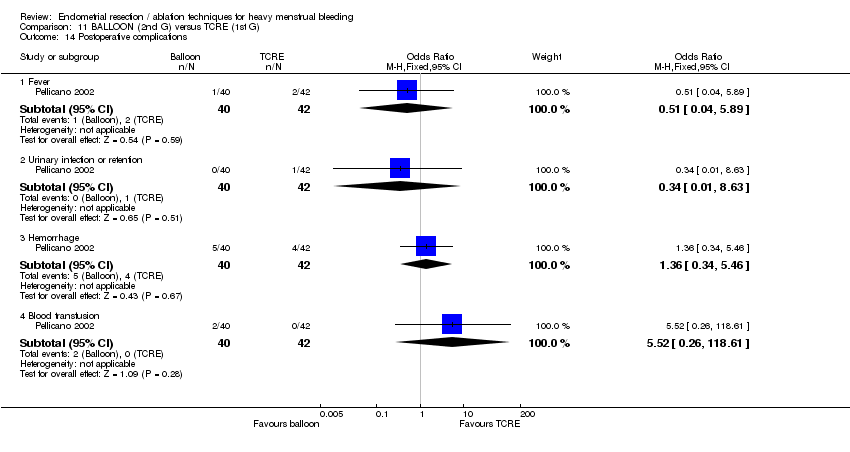
Comparison 11 BALLOON (2nd G) versus TCRE (1st G), Outcome 14 Postoperative complications.

Comparison 11 BALLOON (2nd G) versus TCRE (1st G), Outcome 15 Requirement for further surgery.
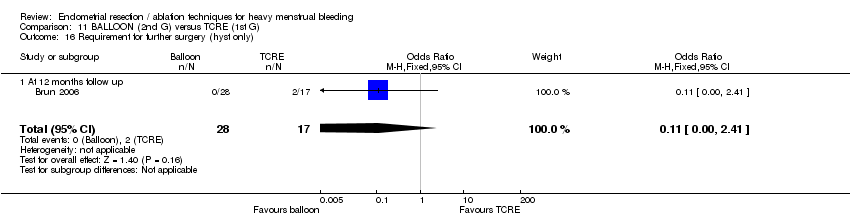
Comparison 11 BALLOON (2nd G) versus TCRE (1st G), Outcome 16 Requirement for further surgery (hyst only).

Comparison 12 BIPOLAR RF (2nd G) versus BALLOON ABLATION (2nd G), Outcome 1 Amenorrhoea rate.
| Study | Electrode | Balloon | Statistical test |
| At 12 months follow up | |||
| Abbott 2003 | N=37 | N=18 | Mann Whitney |
Comparison 12 BIPOLAR RF (2nd G) versus BALLOON ABLATION (2nd G), Outcome 2 PBAC score after treatment.
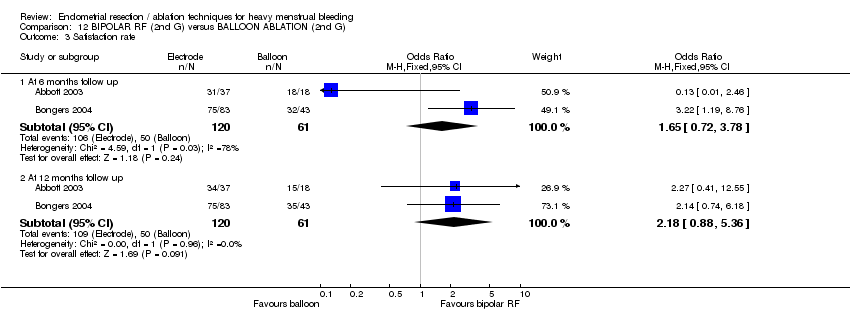
Comparison 12 BIPOLAR RF (2nd G) versus BALLOON ABLATION (2nd G), Outcome 3 Satisfaction rate.
| Study | Electrode | Balloon | Statistical test |
| Abbott 2003 | N=37 | N=18 | t test |
| Bongers 2004 | N=82 | N=43 | Not reported |
Comparison 12 BIPOLAR RF (2nd G) versus BALLOON ABLATION (2nd G), Outcome 4 Duration of operation.
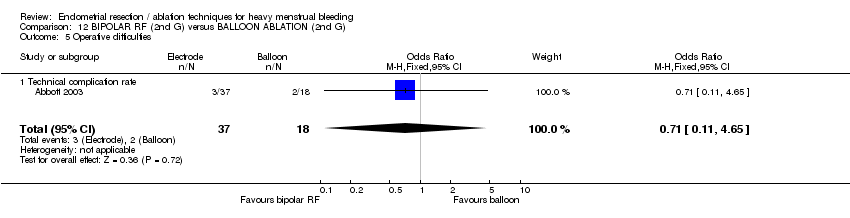
Comparison 12 BIPOLAR RF (2nd G) versus BALLOON ABLATION (2nd G), Outcome 5 Operative difficulties.

Comparison 12 BIPOLAR RF (2nd G) versus BALLOON ABLATION (2nd G), Outcome 6 SF12 physical score.

Comparison 12 BIPOLAR RF (2nd G) versus BALLOON ABLATION (2nd G), Outcome 7 SF12 mental score.
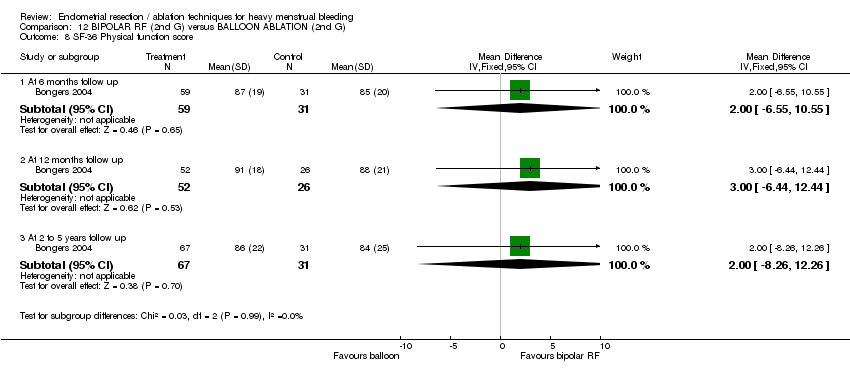
Comparison 12 BIPOLAR RF (2nd G) versus BALLOON ABLATION (2nd G), Outcome 8 SF‐36 Physical function score.

Comparison 12 BIPOLAR RF (2nd G) versus BALLOON ABLATION (2nd G), Outcome 9 SF‐36 Role physical.
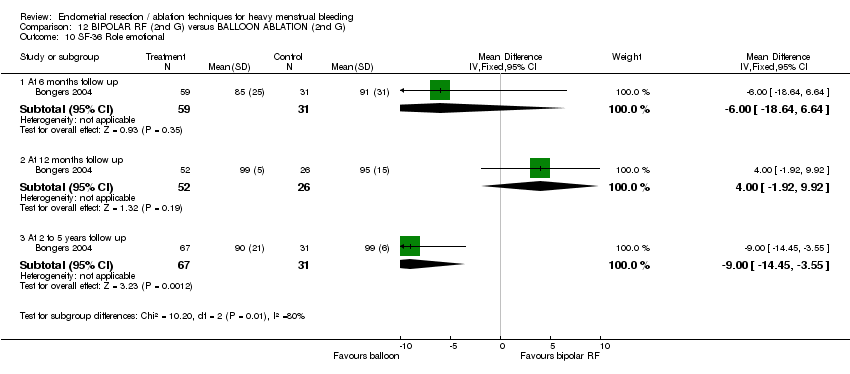
Comparison 12 BIPOLAR RF (2nd G) versus BALLOON ABLATION (2nd G), Outcome 10 SF‐36 Role emotional.

Comparison 12 BIPOLAR RF (2nd G) versus BALLOON ABLATION (2nd G), Outcome 11 SF‐36 Social functioning.
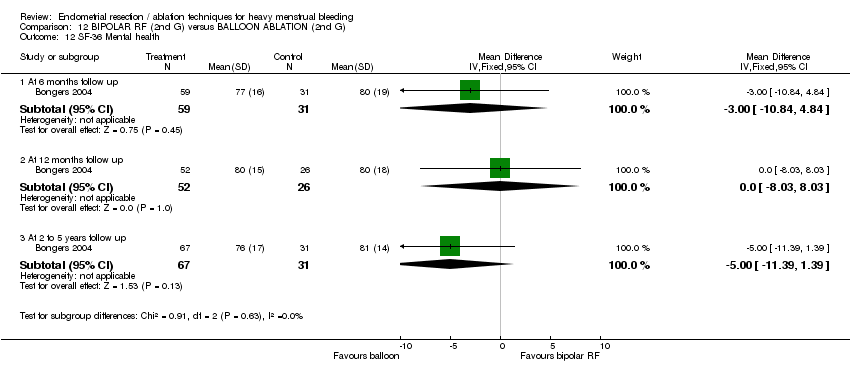
Comparison 12 BIPOLAR RF (2nd G) versus BALLOON ABLATION (2nd G), Outcome 12 SF‐36 Mental health.

Comparison 12 BIPOLAR RF (2nd G) versus BALLOON ABLATION (2nd G), Outcome 13 SF‐36 Energy/vitality.

Comparison 12 BIPOLAR RF (2nd G) versus BALLOON ABLATION (2nd G), Outcome 14 SF‐36 Pain.

Comparison 12 BIPOLAR RF (2nd G) versus BALLOON ABLATION (2nd G), Outcome 15 SF‐36 General health.

Comparison 12 BIPOLAR RF (2nd G) versus BALLOON ABLATION (2nd G), Outcome 16 RSCL Physical symptoms.

Comparison 12 BIPOLAR RF (2nd G) versus BALLOON ABLATION (2nd G), Outcome 17 RSCL Psychological distress.
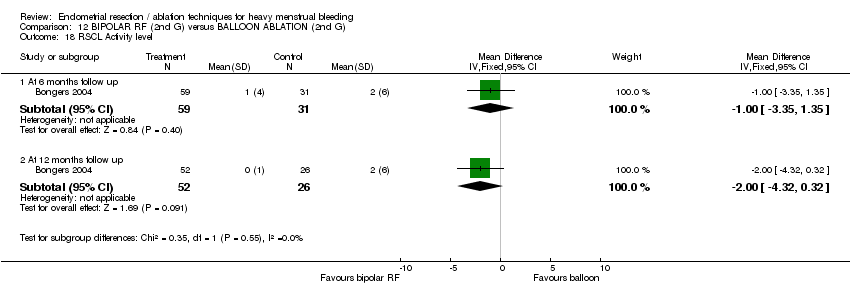
Comparison 12 BIPOLAR RF (2nd G) versus BALLOON ABLATION (2nd G), Outcome 18 RSCL Activity level.
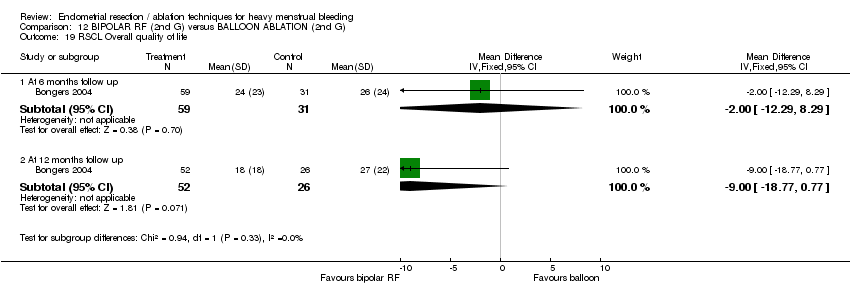
Comparison 12 BIPOLAR RF (2nd G) versus BALLOON ABLATION (2nd G), Outcome 19 RSCL Overall quality of life.

Comparison 12 BIPOLAR RF (2nd G) versus BALLOON ABLATION (2nd G), Outcome 20 SDS Depression.
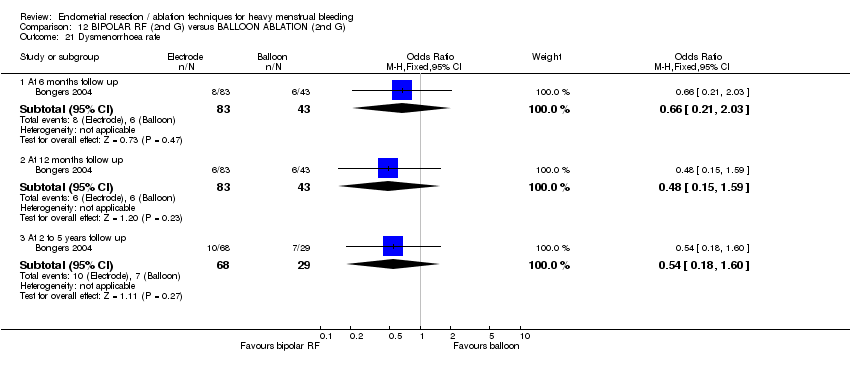
Comparison 12 BIPOLAR RF (2nd G) versus BALLOON ABLATION (2nd G), Outcome 21 Dysmenorrhoea rate.
| Study | Electrode | Balloon | Statistical test |
| At 12 months follow up | |||
| Abbott 2003 | N=37 | N=18 | Mann Whitney |
Comparison 12 BIPOLAR RF (2nd G) versus BALLOON ABLATION (2nd G), Outcome 22 Dysmenorrhoea rate (VAS score).
| Study | Electrode | Balloon | Statistical test |
| At 12 months follow up | |||
| Abbott 2003 | N=37 | N=18 | Mann Whitney |
Comparison 12 BIPOLAR RF (2nd G) versus BALLOON ABLATION (2nd G), Outcome 23 PMS rate (VAS score).

Comparison 12 BIPOLAR RF (2nd G) versus BALLOON ABLATION (2nd G), Outcome 24 Requirement for further surgery (ablation or hyst).

Comparison 12 BIPOLAR RF (2nd G) versus BALLOON ABLATION (2nd G), Outcome 25 Requirement for further surgery (hyst only).
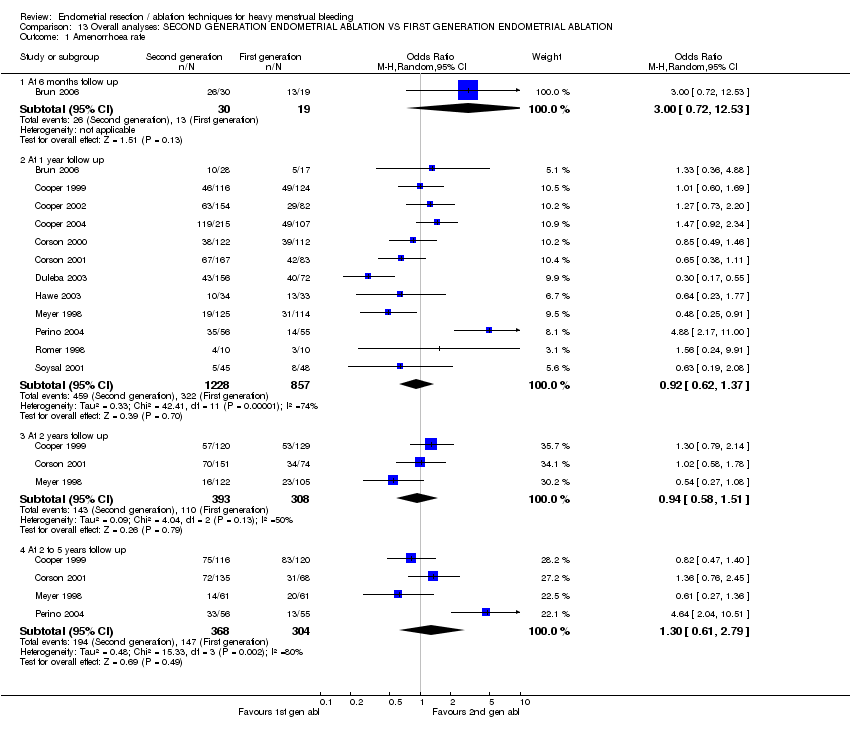
Comparison 13 Overall analyses: SECOND GENERATION ENDOMETRIAL ABLATION VS FIRST GENERATION ENDOMETRIAL ABLATION, Outcome 1 Amenorrhoea rate.
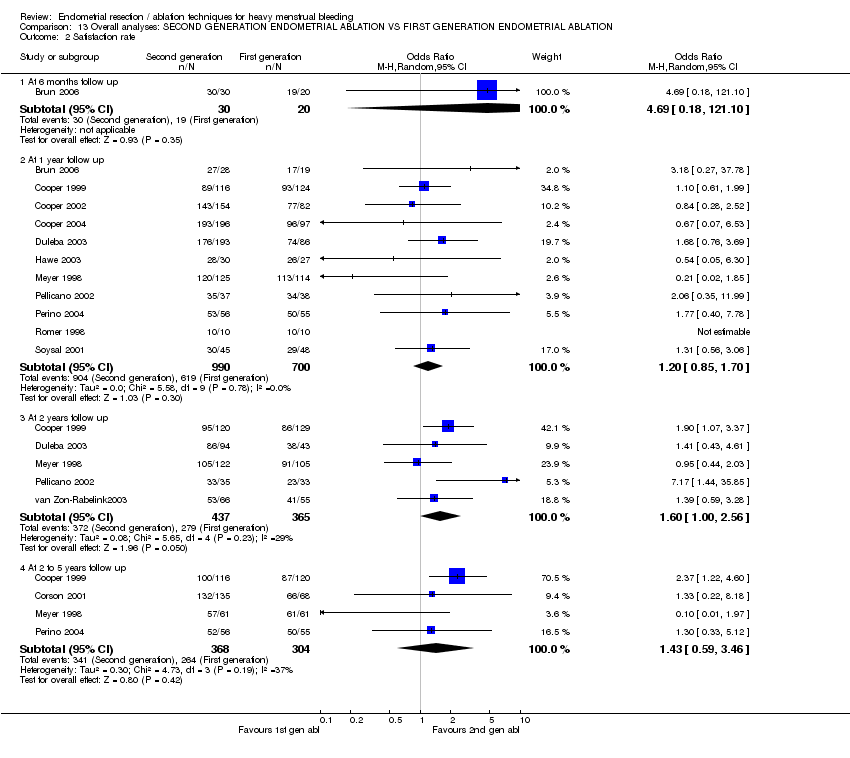
Comparison 13 Overall analyses: SECOND GENERATION ENDOMETRIAL ABLATION VS FIRST GENERATION ENDOMETRIAL ABLATION, Outcome 2 Satisfaction rate.
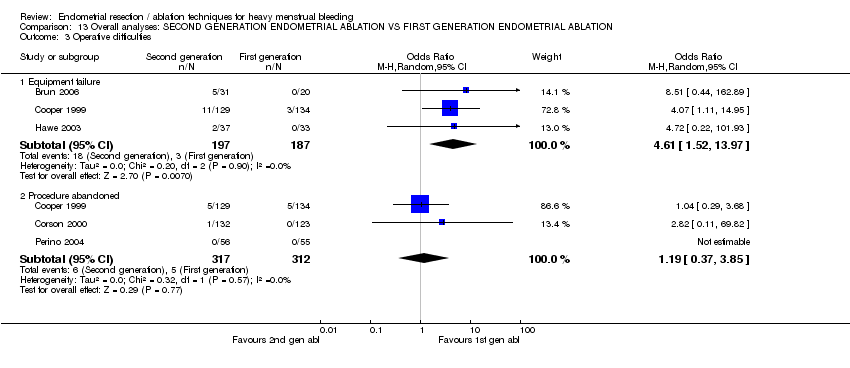
Comparison 13 Overall analyses: SECOND GENERATION ENDOMETRIAL ABLATION VS FIRST GENERATION ENDOMETRIAL ABLATION, Outcome 3 Operative difficulties.

Comparison 13 Overall analyses: SECOND GENERATION ENDOMETRIAL ABLATION VS FIRST GENERATION ENDOMETRIAL ABLATION, Outcome 4 Duration of operation (mins).

Comparison 13 Overall analyses: SECOND GENERATION ENDOMETRIAL ABLATION VS FIRST GENERATION ENDOMETRIAL ABLATION, Outcome 5 Proportion having local anaesthesia (%).

Comparison 13 Overall analyses: SECOND GENERATION ENDOMETRIAL ABLATION VS FIRST GENERATION ENDOMETRIAL ABLATION, Outcome 6 Inability to work.

Comparison 13 Overall analyses: SECOND GENERATION ENDOMETRIAL ABLATION VS FIRST GENERATION ENDOMETRIAL ABLATION, Outcome 7 Operative or postoperative complication rate.
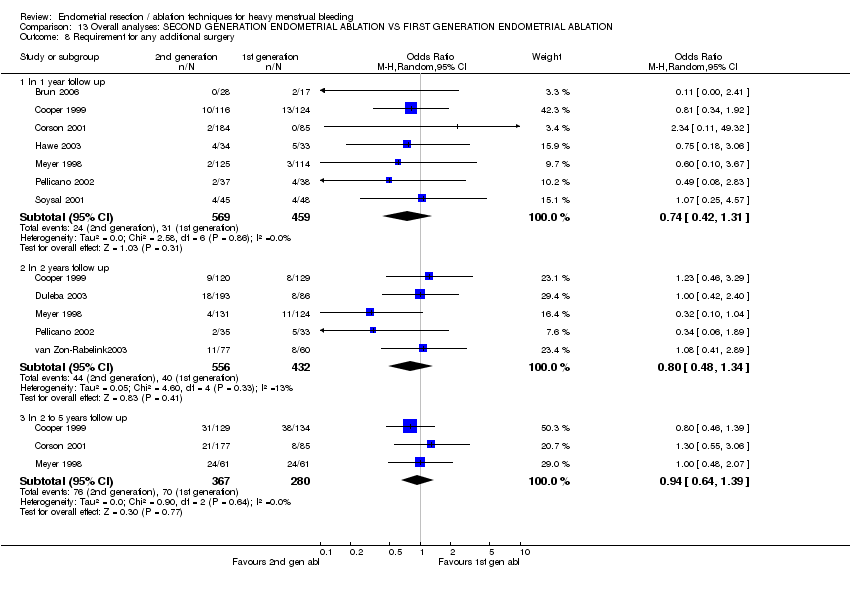
Comparison 13 Overall analyses: SECOND GENERATION ENDOMETRIAL ABLATION VS FIRST GENERATION ENDOMETRIAL ABLATION, Outcome 8 Requirement for any additional surgery.

Comparison 13 Overall analyses: SECOND GENERATION ENDOMETRIAL ABLATION VS FIRST GENERATION ENDOMETRIAL ABLATION, Outcome 9 Requirement for further surgery (hyst only).
| Study ID | Randomisation | Concealment | Blinding | Follow up | ITT | Power calculation | Prognostic balance |
| Adequate (2:1 ratio) | Adequate | Double | 100% at 6 months and 83% at 12 months in the balloon group. 95% at 6 months and 97% at 12 months in the electrode group | Yes ‐ but did not include loss to follow up | Yes | Yes | |
| Adequate | Adequate | No | 98% received treatment. 89% were followed up at 6 months and 86% were followed up at 12 months | Yes ‐ but did not include loss to follow up | Yes | Yes, but imbalances between groups recruited at different times | |
| Adequate | Adequate | Double | 99% of women received treatments. There was no loss to follow up | Yes | Yes | Mostly, except there were more women with a retroverted uterus in the bipolar group (16%) than in the balloon group (9%) | |
| Alternation | Not clear | No | 91% were followed up at 2 years and 94% were followed up at 5 years | No (except for re intervention rate) | Yes | Yes | |
| Adequate | Adequate | No | 91% were followed up at 1 year | Yes ‐ but did not include women lost to follow up | Yes | Yes | |
| Adequate (2:1 ratio) | Not clear | No | 89% were followed up at 1 year (for efficacy), 100% for safety | Yes ‐ only for safety | Yes | Yes | |
| Adequate | Not clear | No | 98% received treatment. 90% were considered "evaluable" but ITT analysis also performed | Yes | Yes | Yes | |
| Adequate | Adequate | No | 97% received treatment. 85% followed up at 12 months | No | Yes | Yes | |
| Adequate (2:1 ratio) | Not clear | No | 97% received treatment. 91% followed up at 12 months | Yes ‐ also per protocol analysis | Yes | Yes | |
| Not clear | Not clear | No | 82% were followed up at 12 months | No | Yes | No ‐ cryoablation group had higher PBAC scores at baseline | |
| Adequate | Adequate | Double | 1 woman excluded prior to surgery. 93% were followed up to 1 year | Yes ‐ but did not include lost to follow up | Yes | Yes ‐ except uterine cavity length significantly shorter in balloon group | |
| Not clear | Not clear | No | 100% were followed up for MBL; 91% for duration of surgery | Yes | No | Yes | |
| Adequate | Adequate | No | 93% received treatment. 87% were followed up to 12 months | No | Yes | Yes | |
| Adequate | Not clear | No | 100% received treatment. 83% followed up to 2 years. | No | Not reported | Yes | |
| Adequate | Adequate | No | 96% of randomised group were analysed. Not clear how many were lost to follow up during the study | No | Yes | Yes | |
| Not clear | Not clear | No | 100% analysed | Not reported | No | Yes | |
| Adequate | Adequate | No | 97% of sample were treated and analysed | No | Not reported | Yes | |
| van Zon‐Rabelink 2003 | Adequate | Not clear | No | 99% of sample were treated and analysed. | Yes | Yes | Yes |
| Adequate | Adequate | No | No women were lost to follow up | Yes | Yes | Yes |
| Outcome | No. of participants | Control group risk | Odds ratio | Change in events | Quality of evidence | Comments |
| Duration of surgery | 1762 (9 trials) | nil | nil | ‐14.9 mins (‐19.7 to ‐10.1) | Very strong evidence of heterogeneity (I square = 97%) | |
| Use of local anaesthesia | 1383 (5 trials) | 19.2% | 8.3 (3.9 to 17.5) | ‐ | Strong evidence of heterogeneity (I square = 85.6%) | |
| Equipment failure rate | 333 (2 trials) | 2% | 4.2 (1.3 to 13.8) | ‐ | ||
| Fluid overload (%) | 681 (4 trials) | 3% | 0.13 (0.04 to 0.45) | ‐ | ||
| Perforation (%) | 1885 (8 trials) | 1.3% | 0.21 (0.07 to 0.65) | ‐ | ||
| Cervical lacerations (%) | 1676 (8 trials) | 2.2% | 0.12 (0.05 to 0.33) | ‐ | ||
| Hematometra (%) | 1133 (5 trials) | 2.4% | 0.25 (0.09 to 0.71) | ‐ | ||
| Nausea/vomiting (%) | 997 (4 trials) | 7.7% | 2.3 (1.5 to 3.4) | ‐ | ||
| Cramping (%) | 601 (2 trials) | 33.2% | 1.8 (1.1 to 2.9) | ‐ | ||
| Likelihood of additional surgery | 983 (6 trials) | 6.6% | 0.81 (0.5 to 1.4) | ‐ | This outcome was measured after 1 year follow up. No significant difference was found between groups. Similar results were found after 2, 3 and 5 yrs follow up. |
| Outcome or subgroup title | No. of studies | No. of participants | Statistical method | Effect size |
| 1 Amenorrhoea rate Show forest plot | 2 | Odds Ratio (M‐H, Fixed, 95% CI) | Subtotals only | |
| 1.1 At 6 months | 2 | 348 | Odds Ratio (M‐H, Fixed, 95% CI) | 0.97 [0.58, 1.61] |
| 1.2 At 12 months | 1 | 306 | Odds Ratio (M‐H, Fixed, 95% CI) | 1.07 [0.63, 1.83] |
| 2 Amenorrhoea/hypomenorrhoea rate Show forest plot | 1 | Odds Ratio (M‐H, Fixed, 95% CI) | Subtotals only | |
| 2.1 At 6 months | 1 | 326 | Odds Ratio (M‐H, Fixed, 95% CI) | 0.78 [0.41, 1.48] |
| 2.2 At 12 months | 1 | 306 | Odds Ratio (M‐H, Fixed, 95% CI) | 1.21 [0.74, 1.98] |
| 3 MBL at 6 months (descriptive data) Show forest plot | Other data | No numeric data | ||
| 4 Participant satisfaction at 12 months (very/moderately) Show forest plot | 1 | 321 | Odds Ratio (M‐H, Fixed, 95% CI) | 0.88 [0.43, 1.82] |
| 5 Duration of operation (mins) Show forest plot | 2 | 386 | Mean Difference (IV, Fixed, 95% CI) | 9.15 [7.21, 11.09] |
| 6 Operative difficulties (%) Show forest plot | 1 | Odds Ratio (M‐H, Fixed, 95% CI) | Subtotals only | |
| 6.1 Procedure abandoned | 1 | 366 | Odds Ratio (M‐H, Fixed, 95% CI) | 1.5 [0.60, 3.76] |
| 6.2 Failed instrumentation | 1 | 366 | Odds Ratio (M‐H, Fixed, 95% CI) | 0.19 [0.01, 4.06] |
| 6.3 Equipment failure | 1 | 366 | Odds Ratio (M‐H, Fixed, 95% CI) | 6.00 [1.73, 20.86] |
| 6.4 Immediate hysterectomy | 1 | 366 | Odds Ratio (M‐H, Fixed, 95% CI) | 0.32 [0.01, 8.01] |
| 7 Good general health (proportion of women) Show forest plot | 1 | 321 | Odds Ratio (M‐H, Fixed, 95% CI) | 1.30 [0.65, 2.58] |
| 8 Improvement in symptoms (proportion of women) Show forest plot | 1 | 321 | Odds Ratio (M‐H, Fixed, 95% CI) | 1.08 [0.68, 1.71] |
| 9 Improvement in dysmenorrhea Show forest plot | 1 | Odds Ratio (M‐H, Fixed, 95% CI) | Subtotals only | |
| 9.1 At 6 months follow up | 1 | 253 | Odds Ratio (M‐H, Fixed, 95% CI) | 1.72 [0.99, 2.97] |
| 9.2 At 12 months follow up | 1 | 218 | Odds Ratio (M‐H, Fixed, 95% CI) | 1.01 [0.53, 1.92] |
| 10 Complication rate (proportion of women) Show forest plot | 2 | Odds Ratio (M‐H, Fixed, 95% CI) | Subtotals only | |
| 10.1 Perforation | 1 | 366 | Odds Ratio (M‐H, Fixed, 95% CI) | 0.14 [0.01, 2.68] |
| 10.2 Burns | 1 | 366 | Odds Ratio (M‐H, Fixed, 95% CI) | 4.95 [0.24, 103.73] |
| 10.3 Bowel obstruction | 1 | 366 | Odds Ratio (M‐H, Fixed, 95% CI) | 2.95 [0.12, 72.92] |
| 10.4 Urinary tract infection | 1 | 366 | Odds Ratio (M‐H, Fixed, 95% CI) | 1.98 [0.36, 10.93] |
| 10.5 Pelvic sepsis | 1 | 366 | Odds Ratio (M‐H, Fixed, 95% CI) | 0.81 [0.24, 2.70] |
| 10.6 Haematometra | 1 | 366 | Odds Ratio (M‐H, Fixed, 95% CI) | 0.19 [0.01, 4.06] |
| 10.7 Glycine toxicity | 1 | 22 | Odds Ratio (M‐H, Fixed, 95% CI) | 5.0 [0.21, 117.21] |
| 10.8 Fluid overload (>1.5L) | 1 | 366 | Odds Ratio (M‐H, Fixed, 95% CI) | 5.24 [1.49, 18.41] |
| 10.9 Uterine tamponade | 1 | 366 | Odds Ratio (M‐H, Fixed, 95% CI) | 1.15 [0.38, 3.48] |
| 11 Requirement for further surgical treatment (within 12 mths) Show forest plot | 2 | 388 | Odds Ratio (M‐H, Fixed, 95% CI) | 0.81 [0.48, 1.36] |
| Outcome or subgroup title | No. of studies | No. of participants | Statistical method | Effect size |
| 1 Amenorrhoea rate at 12 months follow up Show forest plot | 1 | 91 | Odds Ratio (M‐H, Fixed, 95% CI) | 0.62 [0.27, 1.44] |
| 2 Amenorrhea/hypomenorrhoea rate at 12 months follow up Show forest plot | 1 | 91 | Odds Ratio (M‐H, Fixed, 95% CI) | 0.95 [0.35, 2.62] |
| 3 PBAC score at 12 mths Show forest plot | Other data | No numeric data | ||
| 4 Satisfaction rate at 12 mths (very/moderately) Show forest plot | 1 | 91 | Odds Ratio (M‐H, Fixed, 95% CI) | 1.65 [0.26, 10.35] |
| 5 Duration of operation (mins) Show forest plot | 1 | 91 | Mean Difference (IV, Fixed, 95% CI) | ‐1.50 [‐2.65, ‐0.35] |
| 6 Operative difficulties Show forest plot | 1 | 91 | Odds Ratio (M‐H, Fixed, 95% CI) | 0.22 [0.07, 0.75] |
| 6.1 Difficulty with surgery (moderate or severe) | 1 | 91 | Odds Ratio (M‐H, Fixed, 95% CI) | 0.22 [0.07, 0.75] |
| 7 Degree of fluid deficit (ml) Show forest plot | 1 | 91 | Mean Difference (IV, Fixed, 95% CI) | ‐258.0 [‐342.05, ‐173.95] |
| Outcome or subgroup title | No. of studies | No. of participants | Statistical method | Effect size |
| 1 Duration of operation (mins) Show forest plot | 1 | 45 | Mean Difference (IV, Fixed, 95% CI) | ‐1.10 [‐2.92, 0.72] |
| 2 Duration of operation (descriptive data) Show forest plot | Other data | No numeric data | ||
| 3 Complication rate Show forest plot | 1 | Odds Ratio (M‐H, Fixed, 95% CI) | Subtotals only | |
| 3.1 Fluid deficit | 1 | 120 | Odds Ratio (M‐H, Fixed, 95% CI) | 0.32 [0.01, 7.94] |
| 3.2 Perforation | 1 | 120 | Odds Ratio (M‐H, Fixed, 95% CI) | 0.32 [0.01, 7.94] |
| 4 Requirement for further surgery (hyst or ablation) Show forest plot | 1 | Odds Ratio (M‐H, Fixed, 95% CI) | Subtotals only | |
| 4.1 At 2 yrs follow up | 1 | 120 | Odds Ratio (M‐H, Fixed, 95% CI) | 1.05 [0.45, 2.42] |
| 4.2 2 to 5 yrs follow up | 1 | 120 | Odds Ratio (M‐H, Fixed, 95% CI) | 1.31 [0.60, 2.87] |
| 4.3 More than 5 years | 1 | 120 | Odds Ratio (M‐H, Fixed, 95% CI) | 1.63 [0.75, 3.52] |
| 5 Requirement for further surgery rate (hyst only) Show forest plot | 1 | Odds Ratio (M‐H, Fixed, 95% CI) | Subtotals only | |
| 5.1 At 2 yrs follow up | 1 | 120 | Odds Ratio (M‐H, Fixed, 95% CI) | 1.5 [0.40, 5.61] |
| 5.2 2 to 5 yrs follow up | 1 | 120 | Odds Ratio (M‐H, Fixed, 95% CI) | 1.25 [0.46, 3.42] |
| 5.3 More than 5 years follow up | 1 | 120 | Odds Ratio (M‐H, Fixed, 95% CI) | 1.42 [0.59, 3.42] |
| Outcome or subgroup title | No. of studies | No. of participants | Statistical method | Effect size |
| 1 Amenorrhoea rate Show forest plot | 1 | Odds Ratio (M‐H, Fixed, 95% CI) | Subtotals only | |
| 1.1 At 1 year follow up | 1 | 111 | Odds Ratio (M‐H, Fixed, 95% CI) | 4.88 [2.17, 11.00] |
| 1.2 2 to 5 years follow up | 1 | 111 | Odds Ratio (M‐H, Fixed, 95% CI) | 4.64 [2.04, 10.51] |
| 2 Satisfaction rate Show forest plot | 1 | Odds Ratio (M‐H, Fixed, 95% CI) | Subtotals only | |
| 2.1 At one year follow up | 1 | 111 | Odds Ratio (M‐H, Fixed, 95% CI) | 1.77 [0.40, 7.78] |
| 2.2 2 to 5 years follow up | 1 | 111 | Odds Ratio (M‐H, Fixed, 95% CI) | 1.3 [0.33, 5.12] |
| 3 Duration of operation Show forest plot | 1 | 111 | Mean Difference (IV, Fixed, 95% CI) | ‐9.30 [‐11.36, ‐7.24] |
| 4 Pain score at 12 hrs after surgery (VAS: 1‐10) Show forest plot | 1 | 111 | Mean Difference (IV, Fixed, 95% CI) | 0.70 [0.02, 1.38] |
| 5 Intraoperative complication rate Show forest plot | 1 | Odds Ratio (M‐H, Fixed, 95% CI) | Subtotals only | |
| 5.1 Perforation | 1 | 111 | Odds Ratio (M‐H, Fixed, 95% CI) | 0.0 [0.0, 0.0] |
| 5.2 UTI | 1 | 111 | Odds Ratio (M‐H, Fixed, 95% CI) | 0.48 [0.04, 5.47] |
| 6 Requirement for further surgery rate (hyst only) Show forest plot | 1 | 111 | Odds Ratio (M‐H, Fixed, 95% CI) | 0.57 [0.13, 2.49] |
| 6.1 2 to 5 years follow up | 1 | 111 | Odds Ratio (M‐H, Fixed, 95% CI) | 0.57 [0.13, 2.49] |
| Outcome or subgroup title | No. of studies | No. of participants | Statistical method | Effect size |
| 1 Amenorrhoea rate Show forest plot | 1 | Odds Ratio (M‐H, Fixed, 95% CI) | Subtotals only | |
| 1.1 At 1 year follow up | 1 | 250 | Odds Ratio (M‐H, Fixed, 95% CI) | 0.65 [0.38, 1.11] |
| 1.2 At 2 years follow up | 1 | 225 | Odds Ratio (M‐H, Fixed, 95% CI) | 1.02 [0.58, 1.78] |
| 1.3 2 to 5 years follow up | 1 | 203 | Odds Ratio (M‐H, Fixed, 95% CI) | 1.36 [0.76, 2.45] |
| 2 PBAC </= 75 Show forest plot | 1 | 250 | Odds Ratio (M‐H, Fixed, 95% CI) | 0.72 [0.37, 1.41] |
| 2.1 At 1 year follow up | 1 | 250 | Odds Ratio (M‐H, Fixed, 95% CI) | 0.72 [0.37, 1.41] |
| 2.2 2 to 5 years follow up | 0 | 0 | Odds Ratio (M‐H, Fixed, 95% CI) | 0.0 [0.0, 0.0] |
| 3 Proportion with "normal" bleeding (PBAC </= 100) Show forest plot | 1 | Odds Ratio (M‐H, Fixed, 95% CI) | Subtotals only | |
| 3.1 At 1 year follow up | 1 | 250 | Odds Ratio (M‐H, Fixed, 95% CI) | 0.77 [0.37, 1.60] |
| 3.2 At 2 years follow up | 1 | 225 | Odds Ratio (M‐H, Fixed, 95% CI) | 1.02 [0.37, 2.84] |
| 3.3 2 to 5 years follow up | 1 | 203 | Odds Ratio (M‐H, Fixed, 95% CI) | 1.54 [0.51, 4.62] |
| 4 Satisfaction rate Show forest plot | 1 | 203 | Odds Ratio (M‐H, Fixed, 95% CI) | 1.33 [0.22, 8.18] |
| 4.1 2 to 5 years follow up | 1 | 203 | Odds Ratio (M‐H, Fixed, 95% CI) | 1.33 [0.22, 8.18] |
| 5 Proportion having local anaesthesia (%) Show forest plot | 1 | 269 | Odds Ratio (M‐H, Fixed, 95% CI) | 2.85 [1.59, 5.13] |
| 6 Intraoperative complication rate Show forest plot | 1 | Odds Ratio (M‐H, Fixed, 95% CI) | Subtotals only | |
| 6.1 Cervical lacerations | 1 | 269 | Odds Ratio (M‐H, Fixed, 95% CI) | 0.09 [0.00, 1.91] |
| 6.2 Endometritis | 1 | 269 | Odds Ratio (M‐H, Fixed, 95% CI) | 0.92 [0.08, 10.32] |
| 6.3 Urinary tract infection | 1 | 269 | Odds Ratio (M‐H, Fixed, 95% CI) | 1.16 [0.22, 6.10] |
| 6.4 Hematometra | 1 | 269 | Odds Ratio (M‐H, Fixed, 95% CI) | 0.18 [0.03, 0.93] |
| 6.5 First degree burn | 1 | 269 | Odds Ratio (M‐H, Fixed, 95% CI) | 2.34 [0.11, 49.32] |
| 7 Postoperative complication rate Show forest plot | 1 | Odds Ratio (M‐H, Fixed, 95% CI) | Subtotals only | |
| 7.1 Abdominal pain (at 2 weeks) | 1 | 269 | Odds Ratio (M‐H, Fixed, 95% CI) | 1.85 [1.09, 3.12] |
| 7.2 Uterine cramping | 1 | 269 | Odds Ratio (M‐H, Fixed, 95% CI) | 1.17 [0.65, 2.11] |
| 7.3 Nausea or vomiting | 1 | 269 | Odds Ratio (M‐H, Fixed, 95% CI) | 3.66 [1.49, 9.00] |
| 8 Requirement for further surgery (any surgery) Show forest plot | 1 | Odds Ratio (M‐H, Fixed, 95% CI) | Subtotals only | |
| 8.1 At 1 year follow up | 1 | 269 | Odds Ratio (M‐H, Fixed, 95% CI) | 2.34 [0.11, 49.32] |
| 8.2 2 to 5 years follow up | 1 | 262 | Odds Ratio (M‐H, Fixed, 95% CI) | 1.30 [0.55, 3.06] |
| 9 Requirement for further surgery rate (hyst only) Show forest plot | 1 | 262 | Odds Ratio (M‐H, Fixed, 95% CI) | 1.59 [0.56, 4.50] |
| 9.1 At 1 year follow up | 0 | 0 | Odds Ratio (M‐H, Fixed, 95% CI) | 0.0 [0.0, 0.0] |
| 9.2 2 to 5 years follow up | 1 | 262 | Odds Ratio (M‐H, Fixed, 95% CI) | 1.59 [0.56, 4.50] |
| Outcome or subgroup title | No. of studies | No. of participants | Statistical method | Effect size |
| 1 Amenorrhoea rate Show forest plot | 1 | 228 | Odds Ratio (M‐H, Fixed, 95% CI) | 0.30 [0.17, 0.55] |
| 1.1 At 1 year follow up | 1 | 228 | Odds Ratio (M‐H, Fixed, 95% CI) | 0.30 [0.17, 0.55] |
| 2 Satisfaction rate Show forest plot | 1 | Odds Ratio (M‐H, Fixed, 95% CI) | Subtotals only | |
| 2.1 At 1 year follow up | 1 | 279 | Odds Ratio (M‐H, Fixed, 95% CI) | 1.68 [0.76, 3.69] |
| 2.2 At 2 years follow up | 1 | 137 | Odds Ratio (M‐H, Fixed, 95% CI) | 1.41 [0.43, 4.61] |
| 3 Proportion having local anaesthesia (%) Show forest plot | 1 | 279 | Odds Ratio (M‐H, Fixed, 95% CI) | 13.19 [5.79, 30.04] |
| 4 Intraoperative complication rate Show forest plot | 1 | Odds Ratio (M‐H, Fixed, 95% CI) | Subtotals only | |
| 4.1 Perforation | 1 | 279 | Odds Ratio (M‐H, Fixed, 95% CI) | 0.15 [0.01, 3.65] |
| 4.2 Vaginal bleeding | 1 | 279 | Odds Ratio (M‐H, Fixed, 95% CI) | 1.35 [0.05, 33.43] |
| 4.3 Abdominal cramping | 1 | 279 | Odds Ratio (M‐H, Fixed, 95% CI) | 2.26 [0.11, 47.54] |
| 4.4 UTI | 1 | 279 | Odds Ratio (M‐H, Fixed, 95% CI) | 0.15 [0.01, 3.65] |
| 4.5 Severe pelvic pain | 1 | 279 | Odds Ratio (M‐H, Fixed, 95% CI) | 0.15 [0.01, 3.65] |
| 5 Requirement for further surgery (any surgery) Show forest plot | 1 | 279 | Odds Ratio (M‐H, Fixed, 95% CI) | 1.00 [0.42, 2.40] |
| 5.1 At 2 years follow up | 1 | 279 | Odds Ratio (M‐H, Fixed, 95% CI) | 1.00 [0.42, 2.40] |
| 6 Requirement for further surgery rate (hyst only) Show forest plot | 1 | 279 | Odds Ratio (M‐H, Fixed, 95% CI) | 0.82 [0.31, 2.12] |
| 6.1 At 2 years follow up | 1 | 279 | Odds Ratio (M‐H, Fixed, 95% CI) | 0.82 [0.31, 2.12] |
| Outcome or subgroup title | No. of studies | No. of participants | Statistical method | Effect size |
| 1 Amenorrhea rate at 1 yr follow up Show forest plot | 2 | 470 | Odds Ratio (M‐H, Fixed, 95% CI) | 1.03 [0.70, 1.52] |
| 1.1 Balloon system | 1 | 234 | Odds Ratio (M‐H, Fixed, 95% CI) | 0.85 [0.49, 1.46] |
| 1.2 Mesh system | 1 | 236 | Odds Ratio (M‐H, Fixed, 95% CI) | 1.27 [0.73, 2.20] |
| 2 Proportion with successful Rx (PBAC<75) Show forest plot | 2 | 470 | Odds Ratio (M‐H, Fixed, 95% CI) | 1.50 [0.90, 2.53] |
| 2.1 Balloon system | 1 | 234 | Odds Ratio (M‐H, Fixed, 95% CI) | 1.35 [0.66, 2.78] |
| 2.2 Mesh system | 1 | 236 | Odds Ratio (M‐H, Fixed, 95% CI) | 1.69 [0.80, 3.56] |
| 3 PBAC score 12 months after treatment Show forest plot | Other data | No numeric data | ||
| 3.1 Balloon system | Other data | No numeric data | ||
| 3.2 Mesh system | Other data | No numeric data | ||
| 4 Proportion satisfied with treatment at 1 year Show forest plot | 1 | 236 | Odds Ratio (M‐H, Fixed, 95% CI) | 0.84 [0.28, 2.52] |
| 4.1 Balloon system | 0 | 0 | Odds Ratio (M‐H, Fixed, 95% CI) | 0.0 [0.0, 0.0] |
| 4.2 Mesh system | 1 | 236 | Odds Ratio (M‐H, Fixed, 95% CI) | 0.84 [0.28, 2.52] |
| 5 Duration of operation (mins) Show forest plot | 2 | 520 | Mean Difference (IV, Fixed, 95% CI) | ‐18.70 [‐20.66, ‐16.75] |
| 5.1 Balloon system | 1 | 255 | Mean Difference (IV, Fixed, 95% CI) | ‐16.20 [‐19.55, ‐12.85] |
| 5.2 Mesh system | 1 | 265 | Mean Difference (IV, Fixed, 95% CI) | ‐20.0 [‐22.41, ‐17.59] |
| 6 Proportion having local anaesthesia (%) Show forest plot | 2 | 520 | Odds Ratio (M‐H, Fixed, 95% CI) | 15.92 [10.12, 25.06] |
| 6.1 Balloon system | 1 | 255 | Odds Ratio (M‐H, Fixed, 95% CI) | 20.53 [10.73, 39.26] |
| 6.2 Mesh system | 1 | 265 | Odds Ratio (M‐H, Fixed, 95% CI) | 12.60 [6.67, 23.78] |
| 7 Intraoperative complication rate Show forest plot | 2 | Odds Ratio (M‐H, Fixed, 95% CI) | Subtotals only | |
| 7.1 Perforation | 2 | 532 | Odds Ratio (M‐H, Fixed, 95% CI) | 0.13 [0.02, 1.06] |
| 7.2 Bradycardia | 1 | 265 | Odds Ratio (M‐H, Fixed, 95% CI) | 1.56 [0.06, 38.58] |
| 7.3 Cervical tear/stenosis | 2 | 532 | Odds Ratio (M‐H, Fixed, 95% CI) | 0.11 [0.01, 0.89] |
| 7.4 Fluid overload | 1 | 267 | Odds Ratio (M‐H, Fixed, 95% CI) | 0.28 [0.01, 7.00] |
| 7.5 Procedure abandoned | 1 | 267 | Odds Ratio (M‐H, Fixed, 95% CI) | 2.58 [0.10, 63.95] |
| 8 Postoperative complication rate Show forest plot | 2 | Odds Ratio (M‐H, Fixed, 95% CI) | Subtotals only | |
| 8.1 Fever | 1 | 267 | Odds Ratio (M‐H, Fixed, 95% CI) | 0.85 [0.05, 13.78] |
| 8.2 Nausea/vomiting or severe pelvic pain | 2 | 532 | Odds Ratio (M‐H, Fixed, 95% CI) | 1.10 [0.35, 3.46] |
| 8.3 UTI | 2 | 532 | Odds Ratio (M‐H, Fixed, 95% CI) | 1.05 [0.37, 3.02] |
| 8.4 Hematometra | 2 | 532 | Odds Ratio (M‐H, Fixed, 95% CI) | 0.42 [0.08, 2.22] |
| 8.5 Myometritis | 1 | 267 | Odds Ratio (M‐H, Fixed, 95% CI) | 0.28 [0.01, 7.00] |
| 8.6 Urinary incontinence | 1 | 267 | Odds Ratio (M‐H, Fixed, 95% CI) | 0.28 [0.01, 7.00] |
| 8.7 PID | 1 | 265 | Odds Ratio (M‐H, Fixed, 95% CI) | 1.03 [0.09, 11.50] |
| 8.8 Haemorrhage | 1 | 265 | Odds Ratio (M‐H, Fixed, 95% CI) | 0.51 [0.03, 8.27] |
| 8.9 Pelvic abscess | 1 | 265 | Odds Ratio (M‐H, Fixed, 95% CI) | 0.17 [0.01, 4.22] |
| 8.10 Endometritis | 1 | 265 | Odds Ratio (M‐H, Fixed, 95% CI) | 0.34 [0.05, 2.04] |
| 9 Requirement for further surgery at 2 years (hysterectomy) Show forest plot | 1 | 255 | Odds Ratio (M‐H, Fixed, 95% CI) | 0.50 [0.16, 1.53] |
| 9.1 Balloon system | 1 | 255 | Odds Ratio (M‐H, Fixed, 95% CI) | 0.50 [0.16, 1.53] |
| 9.2 Mesh system | 0 | 0 | Odds Ratio (M‐H, Fixed, 95% CI) | 0.0 [0.0, 0.0] |
| Outcome or subgroup title | No. of studies | No. of participants | Statistical method | Effect size |
| 1 Amenorrhea rate Show forest plot | 2 | Odds Ratio (M‐H, Fixed, 95% CI) | Subtotals only | |
| 1.1 At 1 year follow up | 2 | 562 | Odds Ratio (M‐H, Fixed, 95% CI) | 1.24 [0.88, 1.75] |
| 1.2 At 2 years follow up | 1 | 249 | Odds Ratio (M‐H, Fixed, 95% CI) | 1.30 [0.79, 2.14] |
| 1.3 At 2 to 5 years follow up | 1 | 236 | Odds Ratio (M‐H, Fixed, 95% CI) | 0.82 [0.47, 1.40] |
| 2 Success of treatment (PBAC<75) Show forest plot | 1 | 322 | Odds Ratio (M‐H, Fixed, 95% CI) | 1.35 [0.71, 2.57] |
| 2.1 At 1 year follow up | 1 | 322 | Odds Ratio (M‐H, Fixed, 95% CI) | 1.35 [0.71, 2.57] |
| 3 Satisfaction rate Show forest plot | 2 | Odds Ratio (M‐H, Fixed, 95% CI) | Subtotals only | |
| 3.1 At 1 year follow up | 2 | 533 | Odds Ratio (M‐H, Fixed, 95% CI) | 1.06 [0.60, 1.88] |
| 3.2 At 2 years follow up | 1 | 249 | Odds Ratio (M‐H, Fixed, 95% CI) | 1.90 [1.07, 3.37] |
| 3.3 At 2 to 5 years follow up | 1 | 236 | Odds Ratio (M‐H, Fixed, 95% CI) | 2.37 [1.22, 4.60] |
| 4 Duration of operation (mins) Show forest plot | Other data | No numeric data | ||
| 5 Operative difficulties Show forest plot | 1 | Odds Ratio (M‐H, Fixed, 95% CI) | Subtotals only | |
| 5.1 Equipment failure | 1 | 263 | Odds Ratio (M‐H, Fixed, 95% CI) | 4.07 [1.11, 14.95] |
| 5.2 Procedure abandoned | 1 | 263 | Odds Ratio (M‐H, Fixed, 95% CI) | 1.04 [0.29, 3.68] |
| 6 Proportion having local anaesthesia Show forest plot | 1 | 315 | Odds Ratio (M‐H, Fixed, 95% CI) | 4.41 [2.58, 7.55] |
| 7 Duration of hospital stay (hours) Show forest plot | Other data | No numeric data | ||
| 8 Inability to work (proportion of women) Show forest plot | 1 | 240 | Odds Ratio (M‐H, Fixed, 95% CI) | 0.52 [0.15, 1.77] |
| 9 Change in SF36 score after treatment Show forest plot | Other data | No numeric data | ||
| 9.1 Physical functioning | Other data | No numeric data | ||
| 9.2 Social functioning | Other data | No numeric data | ||
| 9.3 Physical role | Other data | No numeric data | ||
| 9.4 Emotional role | Other data | No numeric data | ||
| 9.5 Mental health | Other data | No numeric data | ||
| 9.6 Energy/fatigue | Other data | No numeric data | ||
| 9.7 Pain | Other data | No numeric data | ||
| 9.8 General health | Other data | No numeric data | ||
| 10 Improvement in symptoms Show forest plot | 1 | Odds Ratio (M‐H, Fixed, 95% CI) | Subtotals only | |
| 10.1 At 1 year follow up | 1 | 240 | Odds Ratio (M‐H, Fixed, 95% CI) | 1.16 [0.64, 2.13] |
| 10.2 At 2 to 5 years follow up | 1 | 236 | Odds Ratio (M‐H, Fixed, 95% CI) | 1.65 [0.88, 3.06] |
| 11 Improvement in dysmenorrhoea Show forest plot | 2 | Odds Ratio (M‐H, Fixed, 95% CI) | Subtotals only | |
| 11.1 At 1 year follow up | 2 | 533 | Odds Ratio (M‐H, Fixed, 95% CI) | 0.94 [0.63, 1.40] |
| 11.2 At 2 years follow up | 1 | 249 | Odds Ratio (M‐H, Fixed, 95% CI) | 1.29 [0.69, 2.40] |
| 12 Postoperative analgesia rate Show forest plot | 1 | 263 | Odds Ratio (M‐H, Fixed, 95% CI) | 0.82 [0.48, 1.40] |
| 13 Intraoperative complication rate Show forest plot | 2 | Odds Ratio (M‐H, Fixed, 95% CI) | Subtotals only | |
| 13.1 Perforation | 2 | 585 | Odds Ratio (M‐H, Fixed, 95% CI) | 1.64 [0.23, 11.89] |
| 13.2 Haemorrhage | 1 | 263 | Odds Ratio (M‐H, Fixed, 95% CI) | 0.09 [0.00, 1.66] |
| 13.3 Cervical laceration | 1 | 322 | Odds Ratio (M‐H, Fixed, 95% CI) | 0.49 [0.07, 3.55] |
| 13.4 Cervical stenosis | 1 | 322 | Odds Ratio (M‐H, Fixed, 95% CI) | 1.50 [0.06, 37.22] |
| 14 Postoperative complication rate (wihin 24 hours) Show forest plot | 1 | Odds Ratio (M‐H, Fixed, 95% CI) | Subtotals only | |
| 14.1 Chills | 1 | 322 | Odds Ratio (M‐H, Fixed, 95% CI) | 1.38 [0.56, 3.40] |
| 14.2 Bloating | 1 | 322 | Odds Ratio (M‐H, Fixed, 95% CI) | 0.82 [0.35, 1.93] |
| 14.3 Dysuria | 1 | 322 | Odds Ratio (M‐H, Fixed, 95% CI) | 0.75 [0.34, 1.66] |
| 14.4 Fever | 1 | 322 | Odds Ratio (M‐H, Fixed, 95% CI) | 2.52 [0.12, 52.90] |
| 14.5 Headache | 1 | 322 | Odds Ratio (M‐H, Fixed, 95% CI) | 0.74 [0.20, 2.68] |
| 14.6 Nausea | 1 | 322 | Odds Ratio (M‐H, Fixed, 95% CI) | 1.46 [0.80, 2.66] |
| 14.7 Vomiting | 1 | 322 | Odds Ratio (M‐H, Fixed, 95% CI) | 4.01 [1.37, 11.74] |
| 14.8 UTI | 1 | 322 | Odds Ratio (M‐H, Fixed, 95% CI) | 0.50 [0.03, 8.00] |
| 14.9 Vaginal infection | 1 | 322 | Odds Ratio (M‐H, Fixed, 95% CI) | 1.50 [0.06, 37.22] |
| 14.10 Uterine cramping | 1 | 322 | Odds Ratio (M‐H, Fixed, 95% CI) | 1.74 [1.07, 2.83] |
| 14.11 Abdominal tenderness | 1 | 322 | Odds Ratio (M‐H, Fixed, 95% CI) | 0.59 [0.24, 1.46] |
| 14.12 Endometritis | 1 | 322 | Odds Ratio (M‐H, Fixed, 95% CI) | 6.67 [0.37, 119.53] |
| 15 Requirement for further surgery (any surgery) Show forest plot | 1 | Odds Ratio (M‐H, Fixed, 95% CI) | Subtotals only | |
| 15.1 At 1 year follow up | 1 | 240 | Odds Ratio (M‐H, Fixed, 95% CI) | 0.81 [0.34, 1.92] |
| 15.2 At 2 years follow up | 1 | 249 | Odds Ratio (M‐H, Fixed, 95% CI) | 0.97 [0.49, 1.90] |
| 15.3 At 2 to 5 years follow up | 1 | 263 | Odds Ratio (M‐H, Fixed, 95% CI) | 0.80 [0.46, 1.39] |
| 16 Requirement for further surgery rate (hyst only) Show forest plot | 2 | Odds Ratio (M‐H, Fixed, 95% CI) | Subtotals only | |
| 16.1 At 1 year follow up | 2 | 562 | Odds Ratio (M‐H, Fixed, 95% CI) | 0.75 [0.32, 1.78] |
| 16.2 At 2 years follow up | 1 | 249 | Odds Ratio (M‐H, Fixed, 95% CI) | 0.94 [0.45, 1.98] |
| 16.3 At 2 to 5 years follow up | 1 | 263 | Odds Ratio (M‐H, Fixed, 95% CI) | 0.56 [0.30, 1.04] |
| Outcome or subgroup title | No. of studies | No. of participants | Statistical method | Effect size |
| 1 Amenorrhea rate Show forest plot | 3 | Odds Ratio (M‐H, Fixed, 95% CI) | Subtotals only | |
| 1.1 At 1 year follow up | 3 | 352 | Odds Ratio (M‐H, Fixed, 95% CI) | 0.56 [0.33, 0.96] |
| 1.2 At 2 years follow up | 1 | 227 | Odds Ratio (M‐H, Fixed, 95% CI) | 0.54 [0.27, 1.08] |
| 1.3 At 2 to 5 years follow up | 1 | 122 | Odds Ratio (M‐H, Fixed, 95% CI) | 0.61 [0.27, 1.36] |
| 2 Amenorrhoea/eumenorrhoea rate Show forest plot | 2 | Odds Ratio (M‐H, Fixed, 95% CI) | Subtotals only | |
| 2.1 At 1 year follow up | 2 | 259 | Odds Ratio (M‐H, Fixed, 95% CI) | 0.75 [0.38, 1.46] |
| 2.2 At 2 years follow up | 1 | 227 | Odds Ratio (M‐H, Fixed, 95% CI) | 0.88 [0.37, 2.10] |
| 2.3 At 2 to 5 years follow up | 1 | 122 | Odds Ratio (M‐H, Fixed, 95% CI) | 0.66 [0.11, 4.07] |
| 3 PBAC score after treatment Show forest plot | Other data | No numeric data | ||
| 3.1 At 1 year follow up | Other data | No numeric data | ||
| 3.2 At 2 years follow up | Other data | No numeric data | ||
| 4 Success of treatment (lighter periods and no further surgery) Show forest plot | 1 | Odds Ratio (M‐H, Fixed, 95% CI) | Subtotals only | |
| 4.1 At 2 to 5 years follow up | 1 | 170 | Odds Ratio (M‐H, Fixed, 95% CI) | 0.95 [0.49, 1.81] |
| 5 Success of treatment (PBAC<75) Show forest plot | 1 | 93 | Odds Ratio (M‐H, Fixed, 95% CI) | 0.81 [0.31, 2.15] |
| 5.1 At 1 year follow up | 1 | 93 | Odds Ratio (M‐H, Fixed, 95% CI) | 0.81 [0.31, 2.15] |
| 6 Success of treatment (menstrual score <185) Show forest plot | 1 | Odds Ratio (M‐H, Fixed, 95% CI) | Subtotals only | |
| 6.1 At 1 year follow up | 1 | 129 | Odds Ratio (M‐H, Fixed, 95% CI) | 1.01 [0.43, 2.36] |
| 6.2 At 2 years follow up | 1 | 121 | Odds Ratio (M‐H, Fixed, 95% CI) | 1.05 [0.45, 2.46] |
| 7 Satisfaction rate Show forest plot | 4 | Odds Ratio (M‐H, Fixed, 95% CI) | Subtotals only | |
| 7.1 At 1 year follow up | 3 | 352 | Odds Ratio (M‐H, Fixed, 95% CI) | 0.94 [0.44, 1.99] |
| 7.2 At 2 years follow up | 2 | 348 | Odds Ratio (M‐H, Fixed, 95% CI) | 1.12 [0.64, 1.98] |
| 7.3 At 2 to 5 years follow up | 1 | 122 | Odds Ratio (M‐H, Fixed, 95% CI) | 0.10 [0.01, 1.97] |
| 8 Duration of operation (mins) Show forest plot | 3 | 471 | Mean Difference (IV, Fixed, 95% CI) | ‐20.87 [‐22.47, ‐19.28] |
| 9 Operative difficulties Show forest plot | 1 | 139 | Odds Ratio (M‐H, Fixed, 95% CI) | 1.06 [0.43, 2.60] |
| 9.1 Technical complication rate | 1 | 139 | Odds Ratio (M‐H, Fixed, 95% CI) | 1.06 [0.43, 2.60] |
| 10 Inability to work (proportion of women) Show forest plot | 1 | Odds Ratio (M‐H, Fixed, 95% CI) | Subtotals only | |
| 10.1 At 1 year follow up | 1 | 239 | Odds Ratio (M‐H, Fixed, 95% CI) | 1.54 [0.36, 6.60] |
| 10.2 At 2 years follow up | 1 | 227 | Odds Ratio (M‐H, Fixed, 95% CI) | 0.28 [0.03, 2.74] |
| 10.3 At 2 to 5 years follow up | 1 | 210 | Odds Ratio (M‐H, Fixed, 95% CI) | 0.87 [0.24, 3.10] |
| 11 Improvement in dysmenorrhea at 12 months Show forest plot | 1 | 239 | Odds Ratio (M‐H, Fixed, 95% CI) | 0.77 [0.44, 1.37] |
| 12 Improvement in premenstrual symptoms (from moderate/severe) Show forest plot | 1 | Odds Ratio (M‐H, Fixed, 95% CI) | Subtotals only | |
| 12.1 At 1 year follow up | 1 | 185 | Odds Ratio (M‐H, Fixed, 95% CI) | 0.85 [0.47, 1.53] |
| 12.2 At 2 years follow up | 1 | 177 | Odds Ratio (M‐H, Fixed, 95% CI) | 1.08 [0.59, 1.99] |
| 12.3 At 2 to 5 years follow up | 1 | 166 | Odds Ratio (M‐H, Fixed, 95% CI) | 0.97 [0.52, 1.79] |
| 13 Complication rate (proportion of women) Show forest plot | 3 | Odds Ratio (M‐H, Fixed, 95% CI) | Subtotals only | |
| 13.1 Fluid overload | 2 | 332 | Odds Ratio (M‐H, Fixed, 95% CI) | 0.19 [0.02, 1.66] |
| 13.2 Perforation | 2 | 378 | Odds Ratio (M‐H, Fixed, 95% CI) | 0.17 [0.02, 1.42] |
| 13.3 Cervical lacerations | 3 | 471 | Odds Ratio (M‐H, Fixed, 95% CI) | 0.20 [0.03, 1.20] |
| 13.4 Endometritis | 2 | 332 | Odds Ratio (M‐H, Fixed, 95% CI) | 2.50 [0.47, 13.13] |
| 13.5 UTI | 1 | 239 | Odds Ratio (M‐H, Fixed, 95% CI) | 2.76 [0.11, 68.41] |
| 13.6 Hematometra | 2 | 332 | Odds Ratio (M‐H, Fixed, 95% CI) | 0.42 [0.06, 2.91] |
| 13.7 Hydrosalpinx | 1 | 239 | Odds Ratio (M‐H, Fixed, 95% CI) | 0.30 [0.01, 7.47] |
| 13.8 Bleeding | 1 | 93 | Odds Ratio (M‐H, Fixed, 95% CI) | 0.20 [0.01, 4.38] |
| 13.9 Pain | 1 | 139 | Odds Ratio (M‐H, Fixed, 95% CI) | 5.87 [0.30, 115.87] |
| 13.10 Nausea | 1 | 139 | Odds Ratio (M‐H, Fixed, 95% CI) | 0.26 [0.01, 6.61] |
| 13.11 Infection | 1 | 139 | Odds Ratio (M‐H, Fixed, 95% CI) | 0.26 [0.01, 6.61] |
| 14 Requirement for further surgery (any surgery) Show forest plot | 3 | Odds Ratio (M‐H, Fixed, 95% CI) | Subtotals only | |
| 14.1 At 1 year follow up | 2 | 332 | Odds Ratio (M‐H, Fixed, 95% CI) | 0.85 [0.28, 2.62] |
| 14.2 At 2 years follow up | 2 | 392 | Odds Ratio (M‐H, Fixed, 95% CI) | 0.64 [0.31, 1.31] |
| 14.3 At 2 to 5 years follow up | 1 | 122 | Odds Ratio (M‐H, Fixed, 95% CI) | 1.0 [0.48, 2.07] |
| 15 Requirement for further surgery (hyst only) Show forest plot | 2 | Odds Ratio (M‐H, Fixed, 95% CI) | Subtotals only | |
| 15.1 At 1 year follow up | 0 | 0 | Odds Ratio (M‐H, Fixed, 95% CI) | 0.0 [0.0, 0.0] |
| 15.2 At 2 years follow up | 1 | 137 | Odds Ratio (M‐H, Fixed, 95% CI) | 1.04 [0.34, 3.19] |
| 15.3 At 2 to 5 years follow up | 1 | 122 | Odds Ratio (M‐H, Fixed, 95% CI) | 1.0 [0.47, 2.11] |
| Outcome or subgroup title | No. of studies | No. of participants | Statistical method | Effect size |
| 1 Amenorrhoea rate Show forest plot | 1 | Odds Ratio (M‐H, Fixed, 95% CI) | Subtotals only | |
| 1.1 At 6 months follow up | 1 | 70 | Odds Ratio (M‐H, Fixed, 95% CI) | 1.19 [0.45, 3.14] |
| 1.2 At 12 months follow up | 1 | 67 | Odds Ratio (M‐H, Fixed, 95% CI) | 0.64 [0.23, 1.77] |
| 2 PBAC score after treatment Show forest plot | Other data | No numeric data | ||
| 2.1 At 6 months follow up | Other data | No numeric data | ||
| 3 Satisfaction rate Show forest plot | 1 | Odds Ratio (M‐H, Fixed, 95% CI) | Subtotals only | |
| 3.1 At 6 months follow up | 1 | 69 | Odds Ratio (M‐H, Fixed, 95% CI) | 1.81 [0.28, 11.58] |
| 3.2 At 12 months follow up | 1 | 57 | Odds Ratio (M‐H, Fixed, 95% CI) | 0.54 [0.05, 6.30] |
| 4 Operative difficulties Show forest plot | 1 | 70 | Odds Ratio (M‐H, Fixed, 95% CI) | 4.72 [0.22, 101.93] |
| 4.1 Failure of equipment | 1 | 70 | Odds Ratio (M‐H, Fixed, 95% CI) | 4.72 [0.22, 101.93] |
| 5 Euroquol 5D Show forest plot | 1 | Mean Difference (IV, Fixed, 95% CI) | Subtotals only | |
| 5.1 At 6 months follow up | 1 | 70 | Mean Difference (IV, Fixed, 95% CI) | 0.01 [‐0.11, 0.13] |
| 5.2 At 12 months follow up | 1 | 67 | Mean Difference (IV, Fixed, 95% CI) | ‐0.01 [‐0.13, 0.11] |
| 6 Euroquol 5D VAS Show forest plot | 1 | Mean Difference (IV, Fixed, 95% CI) | Subtotals only | |
| 6.1 At 6 months follow up | 1 | 70 | Mean Difference (IV, Fixed, 95% CI) | 1.20 [‐5.95, 8.35] |
| 6.2 At 12 months follow up | 1 | 67 | Mean Difference (IV, Fixed, 95% CI) | 10.10 [2.43, 17.77] |
| 7 SF12 Physical Scale Show forest plot | 1 | Mean Difference (IV, Fixed, 95% CI) | Subtotals only | |
| 7.1 At 6 months follow up | 1 | 70 | Mean Difference (IV, Fixed, 95% CI) | 1.70 [‐2.18, 5.58] |
| 7.2 At 12 months follow up | 1 | 67 | Mean Difference (IV, Fixed, 95% CI) | ‐0.20 [‐3.89, 3.49] |
| 8 SF12 Mental Scale Show forest plot | 1 | Mean Difference (IV, Fixed, 95% CI) | Subtotals only | |
| 8.1 At 6 months follow up | 1 | 70 | Mean Difference (IV, Fixed, 95% CI) | 3.40 [‐0.42, 7.22] |
| 8.2 At 12 months follow up | 1 | 67 | Mean Difference (IV, Fixed, 95% CI) | 2.10 [‐2.04, 6.24] |
| 9 SAQ pleasure scale Show forest plot | 1 | Mean Difference (IV, Fixed, 95% CI) | Subtotals only | |
| 9.1 At 6 months follow up | 1 | 70 | Mean Difference (IV, Fixed, 95% CI) | 0.5 [‐1.30, 2.30] |
| 9.2 At 12 months follow up | 1 | 67 | Mean Difference (IV, Fixed, 95% CI) | ‐0.60 [‐2.68, 1.48] |
| 10 SAQ habit scale Show forest plot | 1 | Mean Difference (IV, Fixed, 95% CI) | Subtotals only | |
| 10.1 At 6 months follow up | 1 | 70 | Mean Difference (IV, Fixed, 95% CI) | ‐0.16 [‐0.42, 0.10] |
| 10.2 At 12 months follow up | 1 | 67 | Mean Difference (IV, Fixed, 95% CI) | ‐0.09 [‐0.27, 0.09] |
| 11 SAQ discomfort scale Show forest plot | 1 | Mean Difference (IV, Fixed, 95% CI) | Subtotals only | |
| 11.1 At 6 months follow up | 1 | 70 | Mean Difference (IV, Fixed, 95% CI) | ‐0.14 [‐0.98, 0.70] |
| 11.2 At 12 months follow up | 1 | 67 | Mean Difference (IV, Fixed, 95% CI) | 0.10 [‐0.67, 0.87] |
| 12 PMS (visual analogue) Show forest plot | Other data | No numeric data | ||
| 12.1 At 6 months follow up | Other data | No numeric data | ||
| 12.2 At 12 months follow up | Other data | No numeric data | ||
| 13 Dysmenorrhoea (visual analogue) Show forest plot | Other data | No numeric data | ||
| 13.1 At 6 months follow up | Other data | No numeric data | ||
| 13.2 At 12 months follow up | Other data | No numeric data | ||
| 14 Pain score Show forest plot | 1 | 70 | Mean Difference (IV, Fixed, 95% CI) | 32.7 [23.72, 41.68] |
| 15 Requirement for further surgery Show forest plot | 1 | Odds Ratio (M‐H, Fixed, 95% CI) | Subtotals only | |
| 15.1 At 6 months follow up | 0 | 0 | Odds Ratio (M‐H, Fixed, 95% CI) | 0.0 [0.0, 0.0] |
| 15.2 At 12 months follow up | 1 | 67 | Odds Ratio (M‐H, Fixed, 95% CI) | 0.75 [0.18, 3.06] |
| Outcome or subgroup title | No. of studies | No. of participants | Statistical method | Effect size |
| 1 Amenorrhoea rate Show forest plot | 1 | Odds Ratio (M‐H, Fixed, 95% CI) | Subtotals only | |
| 1.1 At 6 months follow up | 1 | 49 | Odds Ratio (M‐H, Fixed, 95% CI) | 0.94 [0.23, 3.88] |
| 1.2 At 12 months follow up | 1 | 45 | Odds Ratio (M‐H, Fixed, 95% CI) | 1.33 [0.36, 4.88] |
| 2 Satisfaction rate Show forest plot | 2 | Odds Ratio (M‐H, Fixed, 95% CI) | Subtotals only | |
| 2.1 At 6 months follow up | 1 | 50 | Odds Ratio (M‐H, Fixed, 95% CI) | 4.69 [0.18, 121.10] |
| 2.2 At 12 months follow up | 2 | 122 | Odds Ratio (M‐H, Fixed, 95% CI) | 2.38 [0.57, 9.99] |
| 2.3 At 2 years follow up | 1 | 68 | Odds Ratio (M‐H, Fixed, 95% CI) | 7.17 [1.44, 35.85] |
| 3 Duration of operation (mins) Show forest plot | 1 | 82 | Mean Difference (IV, Fixed, 95% CI) | ‐13.0 [‐15.20, ‐10.80] |
| 4 Duration of operation (mins) Show forest plot | Other data | No numeric data | ||
| 5 Operative difficulties Show forest plot | 1 | 51 | Odds Ratio (M‐H, Fixed, 95% CI) | 8.51 [0.44, 162.89] |
| 5.1 Equipment failure | 1 | 51 | Odds Ratio (M‐H, Fixed, 95% CI) | 8.51 [0.44, 162.89] |
| 6 Hospital stay (days) Show forest plot | 1 | 82 | Mean Difference (IV, Fixed, 95% CI) | ‐0.30 [‐0.52, ‐0.08] |
| 7 Duration of hospital stay (hours) Show forest plot | Other data | No numeric data | ||
| 8 Return to normal activities (days) Show forest plot | 1 | 82 | Mean Difference (IV, Fixed, 95% CI) | ‐2.10 [‐3.38, ‐0.82] |
| 9 Return to normal activities (days) Show forest plot | Other data | No numeric data | ||
| 10 Intraoperative complications (continuous data) Show forest plot | 1 | 82 | Mean Difference (IV, Fixed, 95% CI) | ‐81.8 [‐93.33, ‐70.27] |
| 10.1 Blood loss | 1 | 82 | Mean Difference (IV, Fixed, 95% CI) | ‐81.8 [‐93.33, ‐70.27] |
| 11 Intraoperative complications (dichotomous data) Show forest plot | 1 | Odds Ratio (M‐H, Fixed, 95% CI) | Subtotals only | |
| 11.1 Fluid overload | 1 | 82 | Odds Ratio (M‐H, Fixed, 95% CI) | 0.08 [0.00, 1.57] |
| 11.2 Cervical tear | 1 | 82 | Odds Ratio (M‐H, Fixed, 95% CI) | 0.34 [0.01, 8.63] |
| 11.3 Conversion to hysterectomy | 1 | 88 | Odds Ratio (M‐H, Fixed, 95% CI) | 0.23 [0.01, 4.92] |
| 12 Postoperative pain (continuous data) Show forest plot | 1 | 82 | Mean Difference (IV, Fixed, 95% CI) | ‐0.60 [‐0.88, ‐0.32] |
| 13 Postoperative pain (descriptive data) Show forest plot | Other data | No numeric data | ||
| 14 Postoperative complications Show forest plot | 1 | Odds Ratio (M‐H, Fixed, 95% CI) | Subtotals only | |
| 14.1 Fever | 1 | 82 | Odds Ratio (M‐H, Fixed, 95% CI) | 0.51 [0.04, 5.89] |
| 14.2 Urinary infection or retention | 1 | 82 | Odds Ratio (M‐H, Fixed, 95% CI) | 0.34 [0.01, 8.63] |
| 14.3 Hemorrhage | 1 | 82 | Odds Ratio (M‐H, Fixed, 95% CI) | 1.36 [0.34, 5.46] |
| 14.4 Blood transfusion | 1 | 82 | Odds Ratio (M‐H, Fixed, 95% CI) | 5.52 [0.26, 118.61] |
| 15 Requirement for further surgery Show forest plot | 1 | Odds Ratio (M‐H, Fixed, 95% CI) | Subtotals only | |
| 15.1 At 12 months follow up | 1 | 75 | Odds Ratio (M‐H, Fixed, 95% CI) | 0.49 [0.08, 2.83] |
| 15.2 At 2 years follow up | 1 | 68 | Odds Ratio (M‐H, Fixed, 95% CI) | 0.34 [0.06, 1.89] |
| 16 Requirement for further surgery (hyst only) Show forest plot | 1 | 45 | Odds Ratio (M‐H, Fixed, 95% CI) | 0.11 [0.00, 2.41] |
| 16.1 At 12 months follow up | 1 | 45 | Odds Ratio (M‐H, Fixed, 95% CI) | 0.11 [0.00, 2.41] |
| Outcome or subgroup title | No. of studies | No. of participants | Statistical method | Effect size |
| 1 Amenorrhoea rate Show forest plot | 2 | Odds Ratio (M‐H, Fixed, 95% CI) | Subtotals only | |
| 1.1 At 6 months follow up | 2 | 179 | Odds Ratio (M‐H, Fixed, 95% CI) | 6.97 [2.79, 17.47] |
| 1.2 At 12 months follow up | 2 | 180 | Odds Ratio (M‐H, Fixed, 95% CI) | 7.84 [2.92, 21.00] |
| 1.3 At 2 to 5 years follow up | 1 | 120 | Odds Ratio (M‐H, Fixed, 95% CI) | 2.09 [0.93, 4.69] |
| 2 PBAC score after treatment Show forest plot | Other data | No numeric data | ||
| 2.1 At 12 months follow up | Other data | No numeric data | ||
| 3 Satisfaction rate Show forest plot | 2 | Odds Ratio (M‐H, Fixed, 95% CI) | Subtotals only | |
| 3.1 At 6 months follow up | 2 | 181 | Odds Ratio (M‐H, Fixed, 95% CI) | 1.65 [0.72, 3.78] |
| 3.2 At 12 months follow up | 2 | 181 | Odds Ratio (M‐H, Fixed, 95% CI) | 2.18 [0.88, 5.36] |
| 4 Duration of operation Show forest plot | Other data | No numeric data | ||
| 5 Operative difficulties Show forest plot | 1 | 55 | Odds Ratio (M‐H, Fixed, 95% CI) | 0.71 [0.11, 4.65] |
| 5.1 Technical complication rate | 1 | 55 | Odds Ratio (M‐H, Fixed, 95% CI) | 0.71 [0.11, 4.65] |
| 6 SF12 physical score Show forest plot | 1 | 55 | Mean Difference (IV, Fixed, 95% CI) | 1.60 [‐4.27, 7.47] |
| 6.1 At 12 months follow up | 1 | 55 | Mean Difference (IV, Fixed, 95% CI) | 1.60 [‐4.27, 7.47] |
| 7 SF12 mental score Show forest plot | 1 | 55 | Mean Difference (IV, Fixed, 95% CI) | 7.5 [‐0.52, 15.52] |
| 7.1 At 12 months follow up | 1 | 55 | Mean Difference (IV, Fixed, 95% CI) | 7.5 [‐0.52, 15.52] |
| 8 SF‐36 Physical function score Show forest plot | 1 | Mean Difference (IV, Fixed, 95% CI) | Subtotals only | |
| 8.1 At 6 months follow up | 1 | 90 | Mean Difference (IV, Fixed, 95% CI) | 2.0 [‐6.55, 10.55] |
| 8.2 At 12 months follow up | 1 | 78 | Mean Difference (IV, Fixed, 95% CI) | 3.0 [‐6.44, 12.44] |
| 8.3 At 2 to 5 years follow up | 1 | 98 | Mean Difference (IV, Fixed, 95% CI) | 2.0 [‐8.26, 12.26] |
| 9 SF‐36 Role physical Show forest plot | 1 | Mean Difference (IV, Fixed, 95% CI) | Subtotals only | |
| 9.1 At 6 months follow up | 1 | 90 | Mean Difference (IV, Fixed, 95% CI) | 5.0 [‐7.67, 17.67] |
| 9.2 At 12 months follow up | 1 | 78 | Mean Difference (IV, Fixed, 95% CI) | 5.0 [‐6.96, 16.96] |
| 9.3 At 2 to 5 years follow up | 1 | 98 | Mean Difference (IV, Fixed, 95% CI) | 8.0 [‐2.66, 18.66] |
| 10 SF‐36 Role emotional Show forest plot | 1 | Mean Difference (IV, Fixed, 95% CI) | Subtotals only | |
| 10.1 At 6 months follow up | 1 | 90 | Mean Difference (IV, Fixed, 95% CI) | ‐6.0 [‐18.64, 6.64] |
| 10.2 At 12 months follow up | 1 | 78 | Mean Difference (IV, Fixed, 95% CI) | 4.0 [‐1.92, 9.92] |
| 10.3 At 2 to 5 years follow up | 1 | 98 | Mean Difference (IV, Fixed, 95% CI) | ‐9.0 [‐14.45, ‐3.55] |
| 11 SF‐36 Social functioning Show forest plot | 1 | Mean Difference (IV, Fixed, 95% CI) | Subtotals only | |
| 11.1 At 6 months follow up | 1 | 90 | Mean Difference (IV, Fixed, 95% CI) | ‐1.0 [‐9.98, 7.98] |
| 11.2 At 12 months follow up | 1 | 78 | Mean Difference (IV, Fixed, 95% CI) | 3.0 [‐6.17, 12.17] |
| 11.3 At 2 to 5 years follow up | 1 | 98 | Mean Difference (IV, Fixed, 95% CI) | 4.0 [‐5.60, 13.60] |
| 12 SF‐36 Mental health Show forest plot | 1 | Mean Difference (IV, Fixed, 95% CI) | Subtotals only | |
| 12.1 At 6 months follow up | 1 | 90 | Mean Difference (IV, Fixed, 95% CI) | ‐3.0 [‐10.84, 4.84] |
| 12.2 At 12 months follow up | 1 | 78 | Mean Difference (IV, Fixed, 95% CI) | 0.0 [‐8.03, 8.03] |
| 12.3 At 2 to 5 years follow up | 1 | 98 | Mean Difference (IV, Fixed, 95% CI) | ‐5.0 [‐11.39, 1.39] |
| 13 SF‐36 Energy/vitality Show forest plot | 1 | Mean Difference (IV, Fixed, 95% CI) | Subtotals only | |
| 13.1 At 6 months follow up | 1 | 90 | Mean Difference (IV, Fixed, 95% CI) | ‐6.0 [‐13.54, 1.54] |
| 13.2 At 12 months follow up | 1 | 78 | Mean Difference (IV, Fixed, 95% CI) | 9.0 [‐0.44, 18.44] |
| 13.3 At 2 to 5 years follow up | 1 | 98 | Mean Difference (IV, Fixed, 95% CI) | ‐3.0 [‐10.39, 4.39] |
| 14 SF‐36 Pain Show forest plot | 1 | Mean Difference (IV, Fixed, 95% CI) | Subtotals only | |
| 14.1 At 6 months follow up | 1 | 90 | Mean Difference (IV, Fixed, 95% CI) | 2.0 [‐6.00, 12.00] |
| 14.2 At 12 months follow up | 1 | 78 | Mean Difference (IV, Fixed, 95% CI) | ‐1.0 [‐12.61, 10.61] |
| 14.3 At 2 to 5 years follow up | 1 | 98 | Mean Difference (IV, Fixed, 95% CI) | ‐5.0 [‐14.79, 4.79] |
| 15 SF‐36 General health Show forest plot | 1 | Mean Difference (IV, Fixed, 95% CI) | Subtotals only | |
| 15.1 At 6 months follow up | 1 | 90 | Mean Difference (IV, Fixed, 95% CI) | ‐5.0 [‐13.30, 3.30] |
| 15.2 At 12 months follow up | 1 | 78 | Mean Difference (IV, Fixed, 95% CI) | 6.0 [‐4.10, 16.10] |
| 15.3 At 2 to 5 years follow up | 1 | 98 | Mean Difference (IV, Fixed, 95% CI) | 6.0 [‐5.72, 17.72] |
| 16 RSCL Physical symptoms Show forest plot | 1 | Mean Difference (IV, Fixed, 95% CI) | Subtotals only | |
| 16.1 At 6 months follow up | 1 | 90 | Mean Difference (IV, Fixed, 95% CI) | 1.0 [‐3.94, 5.94] |
| 16.2 At 12 months follow up | 1 | 78 | Mean Difference (IV, Fixed, 95% CI) | ‐4.0 [‐8.56, 0.56] |
| 17 RSCL Psychological distress Show forest plot | 1 | Mean Difference (IV, Fixed, 95% CI) | Subtotals only | |
| 17.1 At 6 months follow up | 1 | 90 | Mean Difference (IV, Fixed, 95% CI) | ‐1.0 [‐10.14, 8.14] |
| 17.2 At 12 months follow up | 1 | 78 | Mean Difference (IV, Fixed, 95% CI) | ‐1.0 [‐7.92, 5.92] |
| 18 RSCL Activity level Show forest plot | 1 | Mean Difference (IV, Fixed, 95% CI) | Subtotals only | |
| 18.1 At 6 months follow up | 1 | 90 | Mean Difference (IV, Fixed, 95% CI) | ‐1.0 [‐3.35, 1.35] |
| 18.2 At 12 months follow up | 1 | 78 | Mean Difference (IV, Fixed, 95% CI) | ‐2.0 [‐4.32, 0.32] |
| 19 RSCL Overall quality of life Show forest plot | 1 | Mean Difference (IV, Fixed, 95% CI) | Subtotals only | |
| 19.1 At 6 months follow up | 1 | 90 | Mean Difference (IV, Fixed, 95% CI) | ‐2.0 [‐12.29, 8.29] |
| 19.2 At 12 months follow up | 1 | 78 | Mean Difference (IV, Fixed, 95% CI) | ‐9.0 [‐18.77, 0.77] |
| 20 SDS Depression Show forest plot | 1 | Mean Difference (IV, Fixed, 95% CI) | Subtotals only | |
| 20.1 At 6 months follow up | 1 | 90 | Mean Difference (IV, Fixed, 95% CI) | 2.0 [‐1.55, 5.55] |
| 20.2 At 12 months follow up | 1 | 78 | Mean Difference (IV, Fixed, 95% CI) | ‐1.0 [‐5.24, 3.24] |
| 21 Dysmenorrhoea rate Show forest plot | 1 | Odds Ratio (M‐H, Fixed, 95% CI) | Subtotals only | |
| 21.1 At 6 months follow up | 1 | 126 | Odds Ratio (M‐H, Fixed, 95% CI) | 0.66 [0.21, 2.03] |
| 21.2 At 12 months follow up | 1 | 126 | Odds Ratio (M‐H, Fixed, 95% CI) | 0.48 [0.15, 1.59] |
| 21.3 At 2 to 5 years follow up | 1 | 97 | Odds Ratio (M‐H, Fixed, 95% CI) | 0.54 [0.18, 1.60] |
| 22 Dysmenorrhoea rate (VAS score) Show forest plot | Other data | No numeric data | ||
| 22.1 At 12 months follow up | Other data | No numeric data | ||
| 23 PMS rate (VAS score) Show forest plot | Other data | No numeric data | ||
| 23.1 At 12 months follow up | Other data | No numeric data | ||
| 24 Requirement for further surgery (ablation or hyst) Show forest plot | 2 | Odds Ratio (M‐H, Fixed, 95% CI) | Subtotals only | |
| 24.1 At 6 months follow up | 1 | 53 | Odds Ratio (M‐H, Fixed, 95% CI) | 0.0 [0.0, 0.0] |
| 24.2 At 12 months follow up | 1 | 54 | Odds Ratio (M‐H, Fixed, 95% CI) | 7.22 [0.38, 135.96] |
| 24.3 At 2 to 5 years follow up | 1 | 120 | Odds Ratio (M‐H, Fixed, 95% CI) | 0.69 [0.23, 2.09] |
| 25 Requirement for further surgery (hyst only) Show forest plot | 1 | Odds Ratio (M‐H, Fixed, 95% CI) | Subtotals only | |
| 25.1 At 12 months follow up | 1 | 126 | Odds Ratio (M‐H, Fixed, 95% CI) | 0.49 [0.12, 2.08] |
| 25.2 At 2 to 5 years follow up | 1 | 120 | Odds Ratio (M‐H, Fixed, 95% CI) | 0.75 [0.23, 2.45] |
| Outcome or subgroup title | No. of studies | No. of participants | Statistical method | Effect size |
| 1 Amenorrhoea rate Show forest plot | 12 | Odds Ratio (M‐H, Random, 95% CI) | Subtotals only | |
| 1.1 At 6 months follow up | 1 | 49 | Odds Ratio (M‐H, Random, 95% CI) | 3.00 [0.72, 12.53] |
| 1.2 At 1 year follow up | 12 | 2085 | Odds Ratio (M‐H, Random, 95% CI) | 0.92 [0.62, 1.37] |
| 1.3 At 2 years follow up | 3 | 701 | Odds Ratio (M‐H, Random, 95% CI) | 0.94 [0.58, 1.51] |
| 1.4 At 2 to 5 years follow up | 4 | 672 | Odds Ratio (M‐H, Random, 95% CI) | 1.30 [0.61, 2.79] |
| 2 Satisfaction rate Show forest plot | 13 | Odds Ratio (M‐H, Random, 95% CI) | Subtotals only | |
| 2.1 At 6 months follow up | 1 | 50 | Odds Ratio (M‐H, Random, 95% CI) | 4.69 [0.18, 121.10] |
| 2.2 At 1 year follow up | 11 | 1690 | Odds Ratio (M‐H, Random, 95% CI) | 1.20 [0.85, 1.70] |
| 2.3 At 2 years follow up | 5 | 802 | Odds Ratio (M‐H, Random, 95% CI) | 1.60 [1.00, 2.56] |
| 2.4 At 2 to 5 years follow up | 4 | 672 | Odds Ratio (M‐H, Random, 95% CI) | 1.43 [0.59, 3.46] |
| 3 Operative difficulties Show forest plot | 5 | Odds Ratio (M‐H, Random, 95% CI) | Subtotals only | |
| 3.1 Equipment failure | 3 | 384 | Odds Ratio (M‐H, Random, 95% CI) | 4.61 [1.52, 13.97] |
| 3.2 Procedure abandoned | 3 | 629 | Odds Ratio (M‐H, Random, 95% CI) | 1.19 [0.37, 3.85] |
| 4 Duration of operation (mins) Show forest plot | 9 | 1762 | Mean Difference (IV, Random, 95% CI) | ‐14.86 [‐19.68, ‐10.05] |
| 5 Proportion having local anaesthesia (%) Show forest plot | 6 | 1434 | Odds Ratio (M‐H, Random, 95% CI) | 6.40 [2.99, 13.68] |
| 6 Inability to work Show forest plot | 2 | 479 | Odds Ratio (M‐H, Random, 95% CI) | 0.83 [0.29, 2.40] |
| 7 Operative or postoperative complication rate Show forest plot | 11 | Odds Ratio (M‐H, Random, 95% CI) | Subtotals only | |
| 7.1 Fluid overload | 4 | 681 | Odds Ratio (M‐H, Random, 95% CI) | 0.17 [0.04, 0.77] |
| 7.2 Perforation | 8 | 1885 | Odds Ratio (M‐H, Random, 95% CI) | 0.32 [0.10, 1.00] |
| 7.3 Cervical lacerations | 8 | 1676 | Odds Ratio (M‐H, Random, 95% CI) | 0.22 [0.08, 0.60] |
| 7.4 Endometritis | 5 | 1188 | Odds Ratio (M‐H, Random, 95% CI) | 1.26 [0.44, 3.60] |
| 7.5 UTI | 8 | 1834 | Odds Ratio (M‐H, Random, 95% CI) | 0.88 [0.43, 1.83] |
| 7.6 Hematometra | 5 | 1133 | Odds Ratio (M‐H, Random, 95% CI) | 0.31 [0.11, 0.85] |
| 7.7 Hydrosalpinx | 1 | 239 | Odds Ratio (M‐H, Random, 95% CI) | 0.30 [0.01, 7.47] |
| 7.8 Haemorrhage | 5 | 982 | Odds Ratio (M‐H, Random, 95% CI) | 0.69 [0.25, 1.92] |
| 7.9 Muscle fasciculation | 1 | 267 | Odds Ratio (M‐H, Random, 95% CI) | 2.58 [0.10, 63.95] |
| 7.10 Fever | 3 | 671 | Odds Ratio (M‐H, Random, 95% CI) | 0.92 [0.19, 4.44] |
| 7.11 Nausea/vomiting | 4 | 997 | Odds Ratio (M‐H, Random, 95% CI) | 2.44 [1.55, 3.85] |
| 7.12 Myometritis | 1 | 267 | Odds Ratio (M‐H, Random, 95% CI) | 0.28 [0.01, 7.00] |
| 7.13 Pelvic inflammatory disease | 1 | 265 | Odds Ratio (M‐H, Random, 95% CI) | 1.03 [0.09, 11.50] |
| 7.14 Pelvic abscess | 1 | 265 | Odds Ratio (M‐H, Random, 95% CI) | 0.17 [0.01, 4.22] |
| 7.15 Cervical stenosis | 1 | 322 | Odds Ratio (M‐H, Random, 95% CI) | 1.50 [0.06, 37.22] |
| 7.16 Uterine cramping | 2 | 601 | Odds Ratio (M‐H, Random, 95% CI) | 1.75 [1.08, 2.83] |
| 7.17 Severe pelvic pain | 3 | 683 | Odds Ratio (M‐H, Random, 95% CI) | 0.86 [0.18, 4.14] |
| 7.18 External burns | 1 | 269 | Odds Ratio (M‐H, Random, 95% CI) | 2.34 [0.11, 49.32] |
| 7.19 Blood transfusion | 1 | 82 | Odds Ratio (M‐H, Random, 95% CI) | 5.52 [0.26, 118.61] |
| 8 Requirement for any additional surgery Show forest plot | 9 | Odds Ratio (M‐H, Random, 95% CI) | Subtotals only | |
| 8.1 In 1 year follow up | 7 | 1028 | Odds Ratio (M‐H, Random, 95% CI) | 0.74 [0.42, 1.31] |
| 8.2 In 2 years follow up | 5 | 988 | Odds Ratio (M‐H, Random, 95% CI) | 0.80 [0.48, 1.34] |
| 8.3 In 2 to 5 years follow up | 3 | 647 | Odds Ratio (M‐H, Random, 95% CI) | 0.94 [0.64, 1.39] |
| 9 Requirement for further surgery (hyst only) Show forest plot | 9 | Odds Ratio (M‐H, Random, 95% CI) | Subtotals only | |
| 9.1 At 1 year follow up | 4 | 772 | Odds Ratio (M‐H, Random, 95% CI) | 0.70 [0.35, 1.42] |
| 9.2 At 2 years follow up | 4 | 920 | Odds Ratio (M‐H, Random, 95% CI) | 0.85 [0.49, 1.46] |
| 9.3 At 2 to 5 years follow up | 4 | 758 | Odds Ratio (M‐H, Random, 95% CI) | 0.81 [0.51, 1.28] |