Técnicas de resección y ablación del endometrio para el sangrado menstrual abundante
Resumen
Antecedentes
La menorragia es un problema de salud significativo en las mujeres premenopáusicas que puede reducir la calidad de vida y puede causar problemas sociales y físicos como la anemia por déficit de hierro. El tratamiento de primera línea ha consistido tradicionalmente en tratamiento médico (hormonal y no hormonal), pero no siempre tiene éxito en la reducción del sangrado menstrual a niveles aceptables. La histerectomía es un tratamiento definitivo, pero es más costoso y conlleva algunos riesgos. La ablación del endometrio puede ser una alternativa a la histerectomía que preserva el útero. Se han desarrollado muchas técnicas para la "ablación" (eliminación) del revestimiento endometrial. Las técnicas de primera generación requieren la visualización del útero con un histeroscopio durante el procedimiento; aunque es seguro, requiere habilidades técnicas específicas. Se han desarrollado nuevas técnicas para la ablación del endometrio (técnicas de segunda y tercera generación) que son más rápidas que los enfoques anteriores porque no requieren visualización histeroscópica durante el procedimiento.
Objetivos
Comparar la efectividad, seguridad y aceptabilidad de las técnicas de destrucción endometrial para el sangrado menstrual abundante (SMA) en mujeres premenopáusicas.
Métodos de búsqueda
Se hicieron búsquedas en el registro especializado de ensayos controlados del Grupo Cochrane de Ginecología y Fertilidad (Cochrane Gynaecology and Fertility Group), Registro Cochrane Central de Ensayos Controlados (Cochrane Central Register of Controlled Trials) (CENTRAL), MEDLINE, Embase, CINAHL y en PsycINFO (desde su creación hasta mayo de 2018). También se realizaron búsquedas en los registros de ensayos, en otras fuentes de literatura inédita o gris y en las listas de referencia de los estudios encontrados, y se establecieron contactos con expertos en la materia y con empresas farmacéuticas que fabrican dispositivos de ablación.
Criterios de selección
Fueron elegibles los ensayos controlados aleatorizados (ECA) que comparaban diferentes técnicas de ablación o resección del endometrio para mujeres que informaban de un SMA sin patología uterina conocida, con excepción de los fibromas fuera de la cavidad uterina y menores de 3 centímetros. Los resultados incluyeron mejoras en el SMA y en la calidad de vida, la satisfacción de los pacientes, los resultados de las operaciones, las complicaciones y la necesidad de nuevas cirugías, incluida la histerectomía.
Obtención y análisis de los datos
Dos autores de la revisión, de forma independiente, seleccionaron los ensayos para inclusión, evaluaron los ensayos en cuanto al riesgo de sesgo y extrajeron los datos. Se estableció contacto con los autores de los estudios para obtener aclaraciones sobre los métodos o datos adicionales. Sólo se evaluaron los eventos adversos si se midieron por separado en los ensayos incluidos. Se realizaron comparaciones con técnicas individuales así como una comparación general de los métodos de ablación de primera y segunda generación.
Resultados principales
En esta actualización se incluyeron 28 estudios (4287 mujeres) con tamaños de muestra que oscilaban entre 20 y 372. La mayoría de los estudios tenían un bajo riesgo de sesgo para la aleatorización, el desgaste y la información selectiva. Menos de la mitad de estos estudios tenían una adecuada ocultación de la asignación, y la mayoría no eran ciegos. Mediante el uso de GRADE, se determinó que la calidad de la evidencia varió de moderada a muy baja. Se disminuyó el nivel de evidencia por el riesgo de sesgo, la imprecisión y la inconsistencia.
La comparación general de las técnicas de segunda generación versus las de primera generación (es decir, el criterio de referencia de ablación histeroscópica) no reveló evidencia de diferencias en la amenorrea al año y a los dos a cinco años de seguimiento (cociente de riesgos (CR) 0,99; intervalo de confianza (IC) del 95%: 0,78 a 1,27; 12 estudios; 2145 mujeres; I² = 77%; y CR 1,16; IC del 95%: 0,78 a 1.72; 672 mujeres; 4 estudios; I² = 80%; evidencia de muy baja calidad) y mostró una mejoría subjetiva al año de seguimiento según Gráfico pictórico de evaluación de pérdidas sanguíneas (Pictorial Blood Assessment Chart; PBAC) (< 75 o una mejoría aceptable) CR 1,03, IC del 95%: 0,98 a 1,09; 5 estudios; 1282 mujeres; I² = 0%; y CR 1,12, IC del 95%: 0,97 a 1,28; 236 mujeres; 1 estudio; evidencia de baja calidad). Los resultados de los estudios no mostraron diferencias en la satisfacción de los pacientes entre las técnicas de segunda y primera generación al año de seguimiento (CR 1,01; IC del 95%: 0,98 a 1,04; 11 estudios; 1.750 mujeres; I² = 36%; evidencia de baja calidad) ni a los dos a cinco años de seguimiento (CR 1,02; IC del 95%: 0,93 a 1,13; 672 mujeres; 4 estudios; I² = 81%).
En comparación con las técnicas de primera generación, las técnicas de ablación endometrial de segunda generación se asociaron con tiempos de operación más cortos (diferencia de medias (DM) ‐13,52 minutos, IC del 95%: ‐16,90 a ‐10,13; 9 estudios; 1.822 mujeres; evidencia de baja calidad) y con mayor frecuencia se realizaron bajo anestesia local en lugar de general (RR 2,8, IC del 95%: 1,8 a 4,4; 6 estudios; 1.434 mujeres; evidencia de baja calidad).
No se sabe si las tasas de perforación difieren entre las técnicas de segunda y primera generación (CR 0,32; IC del 95%: 0,10 a 1,01; 1885 mujeres; 8 estudios; I² = 0%).
Los ensayos informaron de poca o ninguna diferencia entre las técnicas de segunda y primera generación en cuanto a la necesidad de cirugía adicional (ablación o histerectomía) al año de seguimiento (CR 0,72; IC del 95%: 0,41 a 1,26; 6 estudios: 935 mujeres, evidencia de baja calidad). A los 5 años, los resultados mostraron probablemente poca o ninguna diferencia entre los grupos en cuanto a la necesidad de histerectomía (RR 0,85, IC del 95%: 0,59 a 1,22; 4 estudios; 758 mujeres; evidencia de calidad moderada).
Conclusiones de los autores
Los enfoques de la ablación del endometrio han evolucionado desde las técnicas de primera generación hasta los nuevos enfoques de segunda y tercera generación. Las pruebas actuales indican que, en comparación con las técnicas de primera generación (ablación endometrial con láser, resección transcervical del endometrio, ablación endometrial con electrodo de bola rodante), los métodos de segunda generación (ablación endometrial con balón térmico, ablación endometrial con microondas, ablación hidrotérmica, ablación endometrial con radiofrecuencia bipolar, crioterapia endometrial) son de eficacia equivalente para el sangrado menstrual abundante, con tasas comparables de amenorrea y mejora en el PBAC. Las técnicas de segunda generación se asocian con tiempos de operación más cortos y se realizan con mayor frecuencia bajo anestesia local en lugar de general. No se sabe si las tasas de perforación difieren entre las técnicas de segunda y primera generación. La evidencia fue insuficiente para demostrar qué enfoques de segunda generación fueron superiores a los demás y para revelar la eficacia y la seguridad de los enfoques de tercera generación frente a las técnicas de primera y segunda generación.
PICO
Resumen en términos sencillos
¿Son más eficaces y seguros los nuevos métodos para destruir el revestimiento del útero (ablación endometrial) que los métodos establecidos?
Pregunta de la revisión
Esta revisión comparó la efectividad, la seguridad, la aceptabilidad y las tasas de complicaciones de los métodos de primera, segunda y tercera generación disponibles para destruir el endometrio (revestimiento del útero) para el tratamiento del sangrado menstrual abundante (períodos abundantes) en mujeres premenopáusicas.
Antecedentes
La medicación y la histerectomía (cirugía para extirpar el útero) solían ser las principales opciones de tratamiento para el sangrado menstrual abundante. Ambas son opciones efectivas y seguras, pero los nuevos tratamientos disponibles se centran en la eliminación del revestimiento del útero (endometrio) del que procede la hemorragia. Estos procedimientos implican la extirpación del endometrio (resección) o la destrucción del mismo con energía térmica (calor) de un láser, instrumentos eléctricos u otros dispositivos (ablación). Estos tratamientos pueden detener o reducir el sangrado menstrual.
Características de los estudios
Esta revisión identificó 28 ensayos controlados con asignación aleatoria que implicaban a 4287 mujeres. La mayoría de las pacientes sabían qué tratamiento recibían, lo que podría haber influido en sus valoraciones sobre la pérdida de sangre menstrual y la satisfacción. Entre los estudios variaron otros aspectos relacionados con la calidad. La evidencia está actualizada hasta mayo de 2018. Diecinueve de los 28 ensayos reconocieron que recibieron financiación, suministros de equipo o asistencia técnica de la industria farmacéutica y de los fabricantes del equipo.
Resultados clave
La evidencia de calidad moderada a muy baja sugiere que los enfoques de primera y segunda generación fueron igualmente eficaces en el tratamiento del sangrado menstrual abundante (SMA). Los nuevos enfoques de tratamiento (de segunda generación) fueron más seguros en lo que respecta a la tasa de sobrecarga de líquidos, las laceraciones cervicales y el hematoma, con tasas similares de perforación uterina. Los nuevos enfoques (ablación de segunda generación) fueron más rápidos y tuvieron más probabilidades de que se realizaran bajo anestesia local (en lugar de general) en comparación con los enfoques de primera generación. La mayoría de las mujeres de ambos grupos estaban satisfechas con los resultados de la intervención. No se dispone de evidencia suficiente para mostrar qué enfoques de segunda generación son superiores a los demás, y no se dispone de información sobre los enfoques de tercera generación para realizar comparaciones.
Calidad de la evidencia
La calidad de la evidencia varió de moderada a muy baja. Pocos estudios fueron ciegos, los datos fueron limitados y la heterogeneidad fue sustancial para algunos resultados, lo que llevó a una disminución de la calidad de la evidencia.
Authors' conclusions
Summary of findings
| Overall analyses: second‐generation endometrial ablation compared to first‐generation endometrial ablation for heavy menstrual bleeding | |||||||
| Patient or population: heavy menstrual bleeding | |||||||
| Outcomes | Anticipated absolute effects* (95% CI) | Relative effect | No. of participants | Certainty of the evidence | Comments | ||
| Risk with first‐generation endometrial ablation | Risk with overall analyses: second‐generation endometrial ablation | ||||||
| Bleeding | Amenorrhoea at 1 year follow‐up | 394 per 1000 | 390 per 1000 | RR 0.99 | 2145 | ⊕⊝⊝⊝ | |
| PBAC < 75 or acceptable improvement at 12 months' follow‐up | 809 per 1000 | 833 per 1000 | RR 1.03 | 1282 | ⊕⊕⊝⊝ | ||
| Amenorrhoea at 2 to 5 years' follow‐up | 484 per 1000 | 561 per 1000 | RR 1.16 | 672 | ⊕⊝⊝⊝ | ||
| PBAC < 75 or acceptable improvement at 5 years' follow‐up | 537 per 1000 | 580 per 1000 | RR 1.08 | 263 | ⊕⊕⊝⊝ | ||
| Satisfaction rate | At 1 year follow‐up | 898 per 1000 | 907 per 1000 | RR 1.01 | 1750 | ⊕⊕⊝⊝ | |
| At 2 to 5 years' follow‐up | 868 per 1000 | 886 per 1000 | RR 1.02 | 672 | ⊕⊝⊝⊝ | ||
| Duration of operation (minutes) | Mean duration of operation (minutes) was 27 | MD 13.52 lower | ‐ | 1822 | ⊕⊝⊝⊝ | ||
| Proportion given local anaesthesia (%) | 208 per 1000 | 578 per 1000 | RR 2.78 | 1434 | ⊕⊝⊝⊝ | ||
| Complication rate ‐ perforation | 13 per 1000 | 4 per 1000 | RR 0.32 | 1885 | ⊕⊕⊝⊝ | ||
| Requirement for additional surgery | At 1 year follow‐up (ablation or hysterectomy) | 66 per 1000 | 47 per 1000 | RR 0.72 | 935 | ⊕⊕⊝⊝ | |
| At 2 to 5 years' follow‐up (hysterectomy) | 191 per 1000 | 162 per 1000 | RR 0.85 | 758 | ⊕⊕⊕⊝ | ||
| *The risk in the intervention group (and its 95% confidence interval) is based on the assumed risk in the comparison group and the relative effect of the intervention (and its 95% CI). | |||||||
| GRADE Working Group grades of evidence. | |||||||
| aEight studies provided insufficient details for a judgement about allocation concealment; downgraded one level. bHeterogeneity was high at I² > 75%; downgraded two levels. cThe funnel plot suggested asymmetry; downgraded one level. dOnly two studies provided sufficient details for a judgement about allocation concealment; no blinding of participants/researchers or outcome assessors; downgraded one level. eNo blinding of participants/researchers or outcome assessors; downgraded one level. fThree studies provided insufficient details for a judgement about allocation concealment; only one study provided adequate data on blinding of participants/researchers and outcome assessors; downgraded two levels. gEvidence of imprecision based on one study with n < 300; downgraded one level. hOnly one study provided adequate data on blinding of participants/researchers and outcome assessors; downgraded one level. iOnly one study provided sufficient details for a judgement about allocation concealment; downgraded one level. jThe confidence interval has a very wide range (1.76 to 4.40); downgraded one level. kThe number of events is very low and the confidence interval is wide; downgraded one level. lThe number of events is very low; downgraded one level. | |||||||
Background
Description of the condition
Heavy menstrual bleeding (HMB), or menorrhagia, is a significant cause of ill health among women of reproductive age and can substantially impair their quality of life (NICE 2018).
Heavy menstrual bleeding has been classically defined as blood loss greater than or equal to 80 mL per menstrual cycle (Hallberg 1966). However, it is the woman's perception of her own menstrual loss that is the key determinant in her referral and subsequent treatment. According to the International Federation of Gynaecology and Obstetrics (FIGO), HMB is "an excessive menstrual blood loss that interferes with the woman's physical, emotional, social, and material quality of life, and can occur alone or in combination with other symptoms such as headache, fatigue, or dysmenorrhea" (Munro 2012). One in 20 women in the UK between 30 and 49 years of age consult their general practitioner (GP) each year with HMB (Grant 2000). According to a recent European survey, 27% of women over 18 years of age reported HMB in the previous 12‐month period (Fraser 2015). In New Zealand, for example, it is estimated that 1 in 50 GP consultations for women younger than 50 years are the result of HMB (NZ HMB Guideline 1998). In most cases, no pathology (abnormality) is found to explain the HMB (NICE 2018). Causes of HMB usually remain unknown, which limits the development of new non‐surgical therapies.
Surgical treatment for HMB often follows failed or ineffective medical therapy, although it is also used as first‐line therapy. Hysterectomy has traditionally been regarded as the definitive surgical treatment for HMB, but in spite of a 100% success rate (complete cessation of menstruation) and high levels of satisfaction (Middleton 2010), hysterectomy is a major surgical procedure with significant physical complications and social and economic costs. Almost half of the hysterectomies performed worldwide were carried out to treat women with HMB (Maresh 2002). However, many women prefer less invasive surgical treatment, even when they are made aware that the success of that treatment cannot be assured (Nagele 1998). A US review including 1169 women reported that 13.4% of those undergoing an endometrial ablation had a subsequent hysterectomy (mean follow‐up 39 months; standard deviation (SD) 19 months). The same study reported that the rate of hysterectomy was correlated with the age at which ablation was performed; in women younger than 36 at the time of ablation, the rate of hysterectomy was 21%, and among those 46 years of age or older at the time of ablation, the rate was 11% (Shavell 2012). A Scottish review of 14,078 women with endometrial ablation reported that 20% had a subsequent hysterectomy, and most of these procedures were performed within the first two years after ablation (Cooper 2011).
Description of the intervention
Endometrial destruction techniques, which aim to destroy or remove endometrial tissue, have become increasingly popular as less invasive alternatives over the past two decades; as a result, the number of hysterectomies in the UK declined by 64% between 1995 and 2002 (Reid 2005). The first effective ablation of the endometrium under hysteroscopic vision for treatment of HMB was performed via laser photo‐vaporisation (Goldrath 1981). Rollerball ablation with simple and cheap electrosurgical equipment rather than expensive lasers was performed a few years later (Lin 1988; Vaincaillie 1989). A method to excise rather than ablate the endometrium with an unmodified resectoscope (an instrument used for resection (excision)) was also developed and yielded good results (DeCherney 1983; DeCherney 1987). Transcervical resection of the endometrium (TCRE) is a technique that is often used in conjunction with rollerball ablation. These methods of ablation, also termed 'first‐generation methods', were the most commonly used and were widely regarded as the gold standard for endometrial ablation (Cooper 2000). All require direct visualisation by a hysteroscope (an instrument used to examine the uterine cavity), which may confer the additional advantage of diagnosis of polyps. Endometrial destruction techniques in use in the UK by 1995 included electrocautery ‐ either loop or rollerball (80%) ‐ laser (18%), and radiofrequency ‐ a procedure for which electromagnetic energy (2%) is used (RCOG 1995).
The expectation was that these first‐generation ablation methods would become an alternative to hysterectomy, but at least initially, the total number of operations for HMB increased (Bridgman 2000). More recent figures in the UK suggest that the rate of surgery for menorrhagia (based on data from 2004 to 2006) is 143 procedures per 100,000 premenopausal women (Cromwell 2009), of which approximately 60% are endometrial ablations. In a long‐term follow‐up (up to 25 years) study in the UK, only 25% of women with endometrial resection or ablation underwent a subsequent hysterectomy, and 75% of these surgeries were performed during the first 5 years of follow‐up (Kalampokas 2017), suggesting that endometrial ablation may have a role in limiting the number of hysterectomies. However, this may also reflect progression through menopause for many of these women.
Drawbacks of these first‐generation ablation techniques include the expertise needed and patient morbidity. A prospective national audit of hysteroscopic endometrial ablation and resection (10,686 cases) in England and Wales between 1993 and 1994 assessed the incidence of complications and reported a total complication rate of 4.4% (Overton 1997). Complications are thought to be avoidable with good surgical technique and adequate training. However, hysteroscopic endometrial ablation requires an operating room environment, a surgeon with specific technical skills, and use of general or regional anaesthesia.
Subsequently, second‐ and third‐generation non‐hysteroscopic techniques were developed; these are considered easier to perform and equally effective and safe (Madhu 2009), with lower complication rates,of around 1% for one second generation technique (bipolar) (Athanatos 2015; Laberge 2016). First‐generation ‐ commonly referred to as hysteroscopic ‐ techniques require hysteroscopic visualisation of the uterine cavity during the procedure. Examples in this group include endometrial laser ablation (ELA), transcervical resection of the endometrium (TCRE), and rollerball endometrial ablation. Second‐ and third‐generation approaches ‐ frequently referred to as non‐hysteroscopic techniques ‐ do not require direct visualisation of the uterine cavity during the procedure. Examples of second‐generation techniques include thermal balloon endometrial ablation (Cavaterm®, Thermachoice®), microwave endometrial ablation (MEA®, Microsulis®), hydrothermal ablation (Hydro ThermAblator®), bipolar radiofrequency endometrial ablation (Novasure®, Minerva®), and endometrial cryotherapy (Cerene®, Her Option®). An example of a third‐generation technique is Thermachoice III®. All of these second‐ and third‐generation techniques, with the exception of hydrothermal ablation and endometrial laser intrauterine thermal therapy, involve performing surgery without direct visualisation through a hysteroscope. They can be performed in outpatient settings and include cryoablation (Pitroff 1993), hot saline solution irrigation (Baggish 1995), diode laser hyperthermy (heating) (Donnez 1996), microwave ablation (Sharp 1995), a heated balloon system (Singer 1994), and photodynamic therapy (intrauterine light delivery) (Fehr 1995). Economic modelling suggests that second‐generation techniques may be more cost‐effective than first‐generation methods (Garside 2004). Third‐generation approaches have replaced the latex for silicone on the balloon and involve active fluid circulation, which enables the total endometrial surface to receive equal heat distribution (Cash 2012).
How the intervention might work
Endometrial destruction involves the removal of endometrial tissue. The endometrium can regenerate, and clinical improvement is predicated on removing the basal layer of the endometrium to prevent endometrial regrowth. The basal glands are believed to be the primary foci for endometrial regrowth. The endometrium can be removed under direct hysteroscopic view either by excision with an electrosurgical loop (one possible advantage of resection is that it yields a biopsy sample) or by ablation in which thermal energy of sufficient power is applied to its surface to produce necrosis (cell death) of the full thickness of the endometrium.
Why it is important to do this review
A wide range of techniques are available for ablating and destroying the endometrium to reduce HMB, and it is not clear which approaches offer the best options in terms of effectiveness and safety. The aim of this review is to assess the efficacy, safety, and acceptability of all methods, both by comparing individual techniques pairwise and by making overall comparisons between first‐ and second‐generation techniques. Other Cochrane reviews have compared endometrial ablation versus hysterectomy, and endometrial ablation versus medical therapies, for HMB (Lethaby 2009; Marjoribanks 2010).
Objectives
To compare the effectiveness, safety, and acceptability of endometrial destruction techniques to reduce heavy menstrual bleeding (HMB) in premenopausal women.
Methods
Criteria for considering studies for this review
Types of studies
We sought to include all randomised controlled trials (RCTs) comparing techniques for ablation or resection of the endometrium for treatment of HMB.
Types of participants
Source of recruitment
-
Primary care, family planning, or specialist clinics
Inclusion criteria
-
Women of reproductive years with regular heavy periods measured objectively or subjectively
Exclusion criteria
-
Postmenopausal bleeding (longer than 1 year from the last period)
-
Irregular menstruation and intermenstrual bleeding
-
Pathological causes of HMB (e.g. uterine cancer)
-
Iatrogenic causes of HMB (e.g. intrauterine coil devices)
Types of interventions
We included studies that compared endometrial resection and ablation techniques (TCRE, laser ablation, rollerball ablation, saline irrigation, microwave ablation, radiofrequency ablation, heated balloon, photodynamic therapy, cryoablation, and any other endometrial destruction techniques) against each other or grouped in the broad categories of first‐ or second‐generation techniques performed to reduce HMB.
Types of outcome measures
Assessment of most of the following outcomes was related to duration of follow‐up after the initial surgical procedure. Given that the aim of endometrial resection and ablation therapies is to induce permanent resolution of heavy menstrual bleeding, long‐term follow up of these treatments is needed to enable informed decision‐making between surgical options. Thus, for the following outcomes, evaluation at different time points is considered important for assessing effects over time: 6 months, 12 months, 2 years, 2 to 5 years, and longer than 5 years. When trials measured outcomes at two different follow‐up times within categories (e.g. at 3 years and at 5 years), they recorded longer follow‐up time only within the category of 2 to 5 years.
Primary outcomes
Menstrual bleeding
-
An objective measurement of menstrual blood loss (measured by the modified alkaline haematin method ‐ modified by Newton 1977 from the original technique of Hallberg 1964)
-
A semi‐objective or subjective assessment of improvement in menstrual blood loss (measured by the Pictorial Blood Assessment Chart (PBAC) as in Higham 1990, or by women's perception of improvement)
Rate of satisfaction
-
Assessment of satisfaction in terms of the outcome of the procedure (this outcome was moved from a secondary outcome to a primary outcome in the 2009 update)
Secondary outcomes
Operative outcomes
-
Duration of surgery (in minutes)
-
Operative difficulties (such as difficulty of surgery, technical complications, abandoning the procedure)
-
Proportion given local rather than general anaesthesia
Recovery
-
Length of hospital stay
-
Time or ability to return to normal activities or work
Quality of life
-
Women's perceived change in quality of life, when recorded in a reproducible and validated format
-
Improvement in menstrual symptoms such as premenstrual syndrome (PMS) and dysmenorrhoea
Adverse effects
-
Complication rate, frequency of specific adverse events both before and after discharge from hospital, divided into minor and major complications
-
Major complications
-
Perforation
-
Endometritis
-
Myometritis
-
Cervical laceration/tear or stenosis
-
Pelvic sepsis
-
Pelvic abscess
-
Pelvic inflammatory disease
-
Haematometra
-
Uterine tamponade
-
Blood transfusion
-
Glycine toxicity
-
Fluid overload
-
Fluid deficit
-
Bowel obstruction
-
Urinary incontinence
-
-
Minor complications
-
Skin rash and burning sensation
-
Headache
-
Nausea, vomiting, or severe pelvic pain
-
Weakness or fatigue during the first 24 hours
-
Backache during the first 24 hours
-
Bradycardia
-
Fever
-
Chills
-
Bloating
-
Abdominal tenderness
-
Dysuria
-
Urinary tract infection (UTI)
-
Hydrosalpinx
-
Spotting during the first 24 hours
-
Vaginal bleeding
-
Abdominal cramping
-
Infection (leucorrhoea)
-
First‐degree burn
-
-
-
Requirement for further surgery for menstrual symptoms (by duration of follow‐up)
-
Mortality as a direct result of surgery
Search methods for identification of studies
Electronic searches
The information specialist from the Cochrane Gynaecology and Fertility Group, Marian Showell, searched the following databases for the 2018 update.
-
Cochrane Gynaecology and Fertility (CGFG) Specialised Register (PROCITE platform); searched 22 May 2018 (Appendix 1).
-
Cochrane Central Register of Controlled Trials (CENTRAL), Cochrane Register of Studies Online (CRSO) (Web platform); searched 22 May 2018 (Appendix 2).
-
MEDLINE (OVID platform); searched from 1946 to 22 May 2018 (Appendix 3).
-
Embase (OVID platform); searched from 1980 to 22 May 2018 (Appendix 4).
-
PsycINFO (OVID platform); searched from 1806 to 22 May 2018 (Appendix 5).
-
Cumulative Index to Nursing and Allied Health Literature (CINAHL) (EBSCO platform); searched from 1961 to 22 May 2018 (Appendix 6).
For the 2018 update, MB searched other electronic sources up to May 2018.
-
Trial registries for ongoing and registered trials: ClinicalTrials.gov, a service of the US National Institutes of Health (http://www.clinicaltrials.gov), and the World Health Organization International Trials Registry Platform search portal (http://www.who.int/trialsearch/Default.aspx).
-
The Cochrane Library (http://www.cochrane.org/index.htm) for Database of Abstracts of Reviews of Effects (DARE; reference lists from non‐Cochrane reviews on similar topics).
-
OpenGrey for unpublished literature from Europe (http://www.opengrey.eu/).
-
Latin American Caribbean Health Sciences Literature (LILACS) database: a source of trials from the Portuguese and Spanish‐speaking world (http://bvsalud.org/portal/?lang=en ‐ choose ‘LILACS’ in the ‘all sources’ dropdown box).
-
PubMed and Google for recent trials that have not yet been indexed in the major databases.
Searching other resources
We handsearched the reference lists of articles retrieved by the search.
Some of the newer second‐generation techniques are undergoing development and rigorous testing. For previous updates, we contacted expert researchers in the field and companies that manufacture the newer devices to try to locate ongoing trials and unpublished data. We contacted two experts in the field to ask about ongoing research on endometrial ablation techniques: Dr. David Parkin (Aberdeen Royal Infirmary, UK) and Dr. Jed Hawe (South Cleveland Hospital, UK). We identified descriptions of several ongoing trials but we found insufficient details for review authors to initiate contact with study authors.
Data collection and analysis
We conducted data collection and analysis in accordance with the Cochrane Handbook for Systematic Reviews of Interventions (Higgins 2011).
Selection of studies
For the 2018 update, four review authors screened available abstracts (AL, MG, JB, MB). When the screened abstract presented a potentially eligible RCT, we obtained and inspected the full article to assess its relevance to this review based on the criteria for inclusion. We clarified uncertainty over eligibility through discussion between AL, MG, and JB or MB. We resolved disagreements as to study eligibility by consensus and found it was not necessary to involve another review author to arbitrate over selection.
Data extraction and management
Data extraction
Two of three review authors (MB, JB or MG) independently extracted study data using forms designed according to Cochrane guidelines. We collected the following details.
Trial characteristics
-
Method of randomisation
-
Presence or absence of blinding to treatment allocation
-
Quality of allocation concealment
-
Numbers of women randomised, excluded, and lost to follow‐up
-
Whether an intention‐to‐treat analysis was done
-
Whether a power calculation was done
-
Duration, timing, and location of the study
-
Source of funding
Characteristics of study participants
-
Age and any other recorded characteristics of women in the study
-
Other inclusion criteria
-
Exclusion criteria
Interventions used
-
Type of endometrial destruction technique performed
Outcomes
-
Methods used to measure menstrual blood loss
-
Methods used to evaluate participant satisfaction, change in quality of life, and menstrual symptoms
Assessment of risk of bias in included studies
For the 2018 update. three independent review authors (MG, MB, and JB) assessed the risk of bias of each study using the 'Risk of bias' tool developed by Cochrane (Higgins 2011).
We assessed the following domains.
-
Sequence generation (whether the allocation sequence was adequately generated, e.g. random numbers table, computer random numbers generator, coin tossing, throwing of dice).
-
Allocation concealment (whether the allocation was adequately concealed, e.g. sequentially numbered containers of identical appearance, central allocation, sequentially numbered opaque and sealed envelopes).
-
Blinding of participants, personnel, and outcome assessors (whether knowledge of the allocated intervention was adequately prevented during the study, e.g. by ensuring blinding of participants and key personnel; when there was no knowledge of blinding to the intervention, it was not likely to influence outcomes).
-
Incomplete outcome data (whether incomplete outcome data were adequately addressed, e.g. missing data balanced in numbers across intervention groups, proportion of missing outcomes insufficient to affect estimates, reasons for missing data unlikely to be related to outcomes).
-
Selective outcome reporting (whether reports of the study were free of suggestion of selective outcome reporting, e.g. previous publication of a study protocol, other evidence that the study contains all prespecified outcomes).
-
Other sources of bias (whether the study was apparently free of other problems that could put it at high risk of bias, e.g. baseline imbalance, bias related to study design, early termination of study).
We scored these domains as:
-
criterion met (i.e. low risk of bias);
-
unclear whether criterion met (i.e. uncertain risk of bias); or
-
criterion not met (i.e. high risk of bias).
Measures of treatment effect
Two review authors (MB, JB or MG) extracted data to enable calculation of risk ratios (RRs) for dichotomous data and mean differences (MDs) for continuous data, together with 95% confidence intervals (CIs). Some outcomes such as satisfaction with treatment were measured by ordinal data. We dichotomised these data to represent satisfaction with surgery (highly satisfied and satisfied combined) versus no satisfaction (doubtful or dissatisfied) by collapsing categories. We inspected continuous data for evidence of skew, when possible, according to guidance provided in the Cochrane Handbook for Systematic Reviews of Interventions, by calculating the observed mean minus the lowest (or highest) possible value divided by the standard deviation.
Unit of analysis issues
The unit of analysis and randomisation was women in all studies. Researchers individually randomised participants to groups and collected and analysed a single measurement for each outcome from each participant.
Dealing with missing data
We sought additional information on trial methods and trial results from the corresponding authors of some trials that appeared to meet eligibility criteria. We did this when aspects of methods were unclear or when data were provided in a form unsuitable for meta‐analysis. Authors of the following trials provided extra information: Abbott 2003; Athanatos 2015; Laberge 2016. Gynecare (pharmaceutical company) provided funding for Boujida 2002,Meyer 1998,Perino 2004, and van Zon‐Rabelink 2003. One of the study authors provided additional information for Penninx 2010 for a previous update of this review.
Assessment of heterogeneity
We analysed differences between studies in terms of methodological factors and variations between participants, interventions, and outcomes to determine whether it was appropriate to combine the studies in meta‐analysis. If studies were sufficiently homogeneous to consider pooling, we examined statistical heterogeneity between the results of different studies by inspecting scatter in data points on the graphs and the overlap in confidence intervals and, more formally, by checking the results of Chi² tests (with P < 0.1 considered evidence of significant heterogeneity) and the I² statistic. The I² statistic is a measure of consistency between trials in a meta‐analysis (Higgins 2011). As a general rule, I² values up to 25% provide evidence of low heterogeneity, values from 25% to 50% moderate heterogeneity, and 75% or above substantial heterogeneity.
Assessment of reporting biases
We undertook a comprehensive search, along with careful inspection of search results, to identify duplicates to reduce the risk of reporting bias. We also searched trial registers to ensure that all conducted trials were followed to locate publications. If we identified sufficient trials, we planned to investigate publication bias by preparing funnel plots of study results.
Data synthesis
When we found evidence of skewed data in the measurement of outcomes (e.g. summary trial results expressed as median and range), we did not pool the data for these outcomes in the meta‐analysis but included them in table format.
Before synthesis, we examined data for skew using the rough rule suggested in the Cochrane Handbook for Systematic Reviews of Interventions (Higgins 2011). In addition, we noted whether summary trial results were expressed as medians together with ranges, or if data were analysed via non‐parametric methods, or both, which is also suggestive of skew. When we found no evidence of major skew in the data and no evidence of clinical heterogeneity (from inspection of trial characteristics), we pooled the outcomes statistically in a meta‐analysis using RevMan software. When data could not be pooled because of skew, we included the outcome data in table format.
We combined risk ratios (RRs) and 95% confidence intervals (CIs) for meta‐analysis using the Peto‐modified Mantel‐Haenszel method. For some dichotomous outcomes (e.g. the proportion of participants requiring further surgery), a higher proportion represented a negative consequence of that treatment, and for other outcomes (e.g. the proportion with improvement in menstrual blood loss), we considered a higher proportion as a benefit of treatment. This discrepancy in categorising of outcomes should be noted when summary graphs for the meta‐analysis are viewed for assessment of benefits as opposed to harms of treatment. Thus, for some dichotomous outcomes, treatment benefit is displayed as RRs and CIs to the left of the centre line, and for others, treatment benefit is displayed to the right of the centre line. We have clearly labelled the forest plot for each outcome for clarification.
We combined mean differences (MDs) and 95% CIs for meta‐analysis using the inverse variance method. For all continuous outcomes in this review, a high value represents a negative consequence of treatment, for example, duration of surgery, amount of fluid deficit (difference between input and output fluid during surgery), and PBAC score for menstrual blood loss. Thus, in evaluation of the summary graphs, means and CIs to the left are considered a benefit of the experimental or comparative treatment.
We used a fixed‐effect model to calculate summary effect measures. When we noted substantial statistical heterogeneity, we compared results from the fixed‐effect model against those from the random‐effects model to determine whether results were altered substantially by choice of model. A priori we expected that two of the outcomes ‐ duration of surgery and proportion ‐ would require local instead of general anaesthesia and would yield heterogeneous results regardless of comparison. For these comparisons, we used a random‐effects model. For all overall comparisons of first‐generation versus second‐generation methods, we used a random‐effects model because of expected clinical heterogeneity between trials.
Subgroup analysis and investigation of heterogeneity
We planned subgroup analyses for different times of follow‐up after surgery, in particular, for rates of amenorrhoea, satisfaction, and the requirement for additional surgery. We collected these outcomes at 6 months; at 1, 2, and 2 to 5 years; and longer than 5 years after surgery.
Sensitivity analysis
A priori we intended to perform sensitivity analysis to test the robustness of pooled results in the meta‐analysis based on:
-
trials with good methods (evidence of adequate allocation concealment and intention‐to‐treat analysis) versus all included trials;
-
trials with and without power calculations for sample size;
-
trials with participants who had confirmed objective HMB loss (more than 80 mL per cycle) versus all included trials; and
-
trials with participants who had initially failed medical treatment for HMB versus all included trials.
For most comparisons, we identified an insufficient number of studies for inclusion to perform any of these sensitivity analyses.
Overall quality of the body of evidence
We generated a 'Summary of findings' table for the overall outcome of first‐generation versus second‐generation ablation techniques using GRADEpro software. We used the outcomes of bleeding and satisfaction up to 5 years' follow‐up, duration of operation, proportion given local anaesthesia, complication rate from perforation, and requirement for additional surgery at 12 months' and up to 5 years' follow‐up. This table evaluates the overall quality of the body of evidence for each of the main review outcomes using GRADE criteria (study limitations (i.e. risk of bias), consistency of effect, imprecision, indirectness, and publication bias). We have documented judgements about evidence quality (high, moderate, low, or very low) and have incorporated them into reporting of results for each outcome.
Results
Description of studies
Results of the search
2005 update: Review authors excluded one study that compared two types of balloon ablation ‐ Menotreat and Cavaterm. A total of 19 studies, some of which provided several different publications describing longer‐term follow‐up or different outcomes, met the inclusion criteria of the review for this update.
2009 update: Two new trials (21 RCTs overall) were eligible for the 2009 update (Brun 2006; Onoglu 2007). Two studies provided additional follow‐up for previously included trials (Bongers 2004; Boujida 2002).
2013 update: Review authors included in the 2013 update four new trials (25 RCTs overall), one of which provided two publications (Clark 2011; Penninx 2010; Sambrook 2009; Thabet 2010). We have now excluded one study awaiting assessment since the 2009 update because it was not randomised (Feng 2006).
2018 update: Review authors determined that five additional trials were eligible for inclusion in the 2018 update and obtained the full texts of these papers (when available) for closer inspection. Review authors included four new trials in the 2018 update (Athanatos 2015: Ghazizadeh 2014; Laberge 2016: Penninx 2016), and we categorised one study as awaiting classification (Feng 2014). We added new data for previously included studies (Bongers 2004; Penninx 2010). One study that was ongoing in the previous update did not start recruitment (Cooper 2012); that study was stopped because of lack of funding and was moved to the excluded studies. We reviewed one trial that was previously included but excluded it at this update because it did not match our inclusion criteria (Soysal 2001).
Thus, a total of 28 trials (4287 women), with sample sizes ranging from 20 to 372, were eligible for this review. Full details of these studies can be found in the Characteristics of included studies table. We excluded a total of nine studies, and three are currently awaiting classification (see Characteristics of excluded studies). We identified one ongoing study (NCT02642926). We have presented details of the screening and selection process in Figure 1.
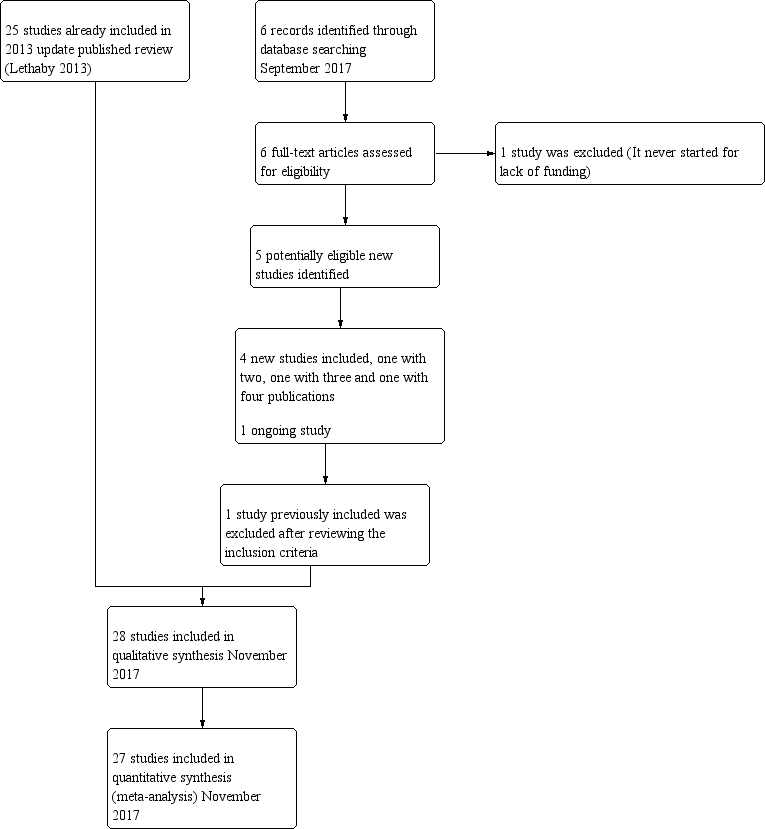
Study flow diagram.
Included studies
Study design and setting
All of the trials followed a parallel‐group design.
Twenty of the trials were single‐centre studies, one each from Germany (Romer 1998), Australia (McClure 1992), Egypt (Thabet 2010), Denmark (Boujida 2002), Greece (Athanatos 2015), Turkey (Onoglu 2007), and Iran (Ghazizadeh 2014); four from the Netherlands (Bongers 2004; Penninx 2010; Penninx 2016; van Zon‐Rabelink 2003); three from Italy (Pellicano 2002; Perino 2004: Vercellini 1999); and six from the UK (Abbott 2003; Bhattacharya 1997; Clark 2011; Cooper 1999; Hawe 2003; Sambrook 2009). We identified eight multi‐centre trials, two based in Canada, USA, and Mexico (Cooper 2002;Laberge 2016); one in USA‐Canada and UK (Cooper 2004); one in USA‐Australia (Corson 2000), one in USA‐Canada (Meyer 1998), and two in the USA (Corson 2001; Duleba 2003), and with three having additional centres in Canada, UK, or Australia; one multi‐centre trial had six centres, all based in France (Brun 2006).
Few of these studies used strict intention‐to‐treat (ITT) analyses or specified methods to deal with missing data. Twelve trials did not report an ITT analysis. Seven claimed that ITT analysis was performed but over time a percentage of participants were lost to follow‐up, so the claim of ITT was misleading. However, ITT analysis was usually performed in these studies when researchers assessed outcomes such as complication rates. Four trials performed true ITT analyses, and one had no reported dropouts. One other trial did not report ITT analysis and replaced dropouts with new cases.
Seventeen trials reported their recruiting time frame. One was recruited between 1989 and 1991 (McClure 1992), 12 between 1995 and 2002 (Abbott 2003; Bongers 2004; Brun 2006; Cooper 1999; Cooper 2004; Corson 2000; Hawe 2003; Meyer 1998; Pellicano 2002; Perino 2004; Thabet 2010; Vercellini 1999), and four between 2004 and 2010 (Athanatos 2015; Clark 2011; Penninx 2010; Sambrook 2009).
Participants
The 28 included studies included 4287 premenopausal participants, most within the age range 30 to 50 years. All of these studies recruited women from secondary or tertiary referral centres or clinics who described HMB.
The presence of fibroids was an exclusion criterion in 15 studies. All trials required that the uterine cavity be normal in size with no uterine pathology, except one (Laberge 2016), which excluded polyps larger than 2 cm. One trial excluded only submucous fibroids (Brun 2006), and another excluded both submucous fibroids and fibroids outside the the uterine cavity and greater than 3 cm (Clark 2011). One trial screened 637 women with self‐assessed HMB, but after applying exclusion criteria, enrolled and randomised less than half (n = 276) (Corson 2000). Almost half of the excluded women had uterine pathology in the form of fibroids or polyps.
Eighteen studies required women to have completed their families (Abbott 2003; Athanatos 2015; Bongers 2004; Boujida 2002; Brun 2006; Cooper 1999; Cooper 2002; Cooper 2004; Corson 2000; Corson 2001; Duleba 2003; Hawe 2003; Laberge 2016; Meyer 1998; Penninx 2010; Penninx 2016; Sambrook 2009; Vercellini 1999), and 14 studies included women who previously had not tolerated or had received ineffective medical therapy for their heavy bleeding (Athanatos 2015; Brun 2006; Clark 2011; Cooper 2002; Cooper 2004; Corson 2000; Corson 2001; Duleba 2003; Ghazizadeh 2014; Meyer 1998; Pellicano 2002; Perino 2004; Romer 1998; van Zon‐Rabelink 2003). Fourteen studies objectively confirmed the women's report of excessive bleeding by requiring them to record their blood loss (Abbott 2003; Athanatos 2015; Bongers 2004; Brun 2006; Cooper 2002; Cooper 2004; Corson 2000; Duleba 2003; Hawe 2003; McClure 1992; Meyer 1998; Penninx 2010; Penninx 2016; van Zon‐Rabelink 2003; Vercellini 1999). This occurred before surgery and before trial entry. Nine studies required women to have PBAC measurements of 150 or greater before entry (Abbott 2003; Athanatos 2015; Bongers 2004; Cooper 2002; Corson 2000; Duleba 2003; Meyer 1998; Penninx 2010; Penninx 2016), three required women to have PBAC measurements of 100 or greater before entry (Brun 2006; Hawe 2003; Vercellini 1999), and two required a blood loss score greater than 185 (Cooper 2004; van Zon‐Rabelink 2003). Two studies used the alkaline haematin method (Hallberg 1964): one included women if their blood loss exceeded 70 mL per cycle (McClure 1992), and the other used more than 160 mL per cycle as an inclusion criterion (Laberge 2016). All but one study reported comparable demographic characteristics between comparison groups at baseline (Brun 2006). In Brun 2006, women undergoing balloon ablation had significantly heavier blood loss than those undergoing TCRE at baseline (menstrual blood loss chart 400 vs 266; P = 0.002).
Interventions
Most of the included studies reported some kind of pretreatment before surgery (particularly first‐generation techniques). In 13 trials, participants had been given preoperative gonadotropin‐releasing hormone (GnRH) analogues to prepare and thin the endometrium before surgery (Athanatos 2015; Bhattacharya 1997; Cooper 1999; Cooper 2004; Corson 2001; Duleba 2003; Hawe 2003; Onoglu 2007; Pellicano 2002; Perino 2004; Romer 1998; van Zon‐Rabelink 2003; Vercellini 1999), although one of these studies provided pretreatment only to the TCRE group ‐ not to the balloon group (Pellicano 2002). Studies also provided preoperative treatment with progestogens for 3 months (McClure 1992), and for 2 weeks (Sambrook 2009). One study required 2 weeks of oral contraceptive therapy before surgery to ensure that women were scheduled at a similar time in their cycle (Corson 2000). Another study performed a loop resection of the endometrium before ablation only for the roller ball group ‐ not for the bipolar group (Laberge 2016). Three other trials used non‐steroidal anti‐inflammatory drugs (NSAIDs) to prevent uterine cramping (Clark 2011; Meyer 1998; Penninx 2016). The remaining nine trials provided no preoperative therapy (Abbott 2003; Bongers 2004; Boujida 2002; Brun 2006; Cooper 2002; Ghazizadeh 2014; Meyer 1998; Penninx 2010; Thabet 2010).
Five trials compared first‐generation ablation methods.
-
Two compared laser ablation versus TCRE (one using an argon laser, the other a neodymium yttrium aluminium garnet (Nd:YAG) laser) (Bhattacharya 1997;McClure 1992).
-
One compared a vaporising electrode procedure versus TCRE (Vercellini 1999).
-
Two compared rollerball versus TCRE (Boujida 2002; Onoglu 2007).
All TCRE comparison groups also underwent rollerball ablation to treat the uterine cornua (a horn‐like area within the uterus) and fundus (body of the uterus). It was claimed that the vaporising electrode (unlike rollerball) could be used to treat submucous fibroids.
Fifteen trials compared second‐generation methods versus first‐generation methods.
-
Three compared balloon ablation (three with Thermachoice, one with Cavaterm) versus rollerball (Meyer 1998; Romer 1998; van Zon‐Rabelink 2003).
-
One compared the Vesta system versus rollerball (Corson 2000).
-
Two compared microwave ablation versus TCRE and rollerball (Cooper 1999; Cooper 2004).
-
One compared heated saline (Hydro ThermAblator) versus rollerball (Corson 2001).
-
One compared cryoablation versus rollerball (Duleba 2003).
-
One compared laser versus TCRE (Perino 2004).
-
Two compared electrode ablation versus TCRE plus rollerball (Corson 2000; Cooper 2002).
-
One compared balloon (Cavaterm) versus laser (Nd:YAG) (Hawe 2003).
-
Two compared balloon (Cavaterm) versus TCRE plus rollerball (Brun 2006; Pellicano 2002).
-
One compared bipolar (Minerva) versus rollerball (Laberge 2016).
Seven trials compared second‐generation techniques.
-
Four compared bipolar electrode ablation (Novasure) versus balloon (Abbott 2003;Bongers 2004;Clark 2011;Penninx 2016).
-
One compared bipolar radiofrequency versus hydrothermal ablation (Penninx 2010).
-
One compared bipolar electrode ablation (Novasure) versus microwave (Athanatos 2015).
-
One compared microwave versus balloon ablation (Sambrook 2009).
All first‐generation techniques (laser, rollerball, vaporising electrode, and transcervical resection), which use the hysteroscope, were then combined and compared with all second‐generation techniques (balloon, microwave, Vesta system, cryoablation, thermal laser, bipolar electrode ablation, and hydrothermal ablation), which are blind techniques. An additional trial compared overcurettage versus ablative curettage (Thabet 2010).
Outcomes
Bleeding
Researchers measured bleeding as an outcome in 25 of the 28 trials (Abbott 2003; Athanatos 2015; Bhattacharya 1997; Bongers 2004; Brun 2006; Clark 2011; Cooper 1999; Cooper 2002; Cooper 2004; Corson 2000; Corson 2001; Duleba 2003; Ghazizadeh 2014; Hawe 2003; Laberge 2016; McClure 1992; Meyer 1998; Penninx 2010; Penninx 2016; Perino 2004; Romer 1998; Sambrook 2009; Thabet 2010; van Zon‐Rabelink 2003; Vercellini 1999). The most common way to describe bleeding was to report amenorrhoea. Twenty‐two trials reported amenorrhoea (Abbott 2003; Athanatos 2015; Bhattacharya 1997; Bongers 2004; Brun 2006; Clark 2011; Cooper 1999; Cooper 2002; Cooper 2004; Corson 2000; Duleba 2003; Hawe 2003; Laberge 2016; McClure 1992; Meyer 1998; Penninx 2010; Penninx 2016; Perino 2004; Romer 1998; Sambrook 2009; Thabet 2010; Vercellini 1999). One reported PBAC < 100 (Corson 2001), and five reported PBAC < 75 (Cooper 1999; Cooper 2002; Cooper 2004; Corson 2000; Corson 2001).
Rate of satisfaction
Investigators in 19 of the 28 trials reported the rate of satisfaction with the procedure (Abbott 2003; Athanatos 2015; Bhattacharya 1997; Bongers 2004; Brun 2006; Clark 2011; Cooper 1999; Cooper 2002; Cooper 2004; Duleba 2003; Hawe 2003; Meyer 1998; Laberge 2016; Pellicano 2002; Penninx 2010; Penninx 2016; Perino 2004; Romer 1998; Sambrook 2009).
Operative outcomes
A total of 19 trials compared the duration of surgery (in minutes) (Abbott 2003; Bhattacharya 1997; Bongers 2004; Brun 2006; Clark 2011; Cooper 1999; Cooper 2002; Corson 2000; Laberge 2016; McClure 1992; Meyer 1998; Onoglu 2007; Pellicano 2002; Penninx 2010; Penninx 2016; Perino 2004; Sambrook 2009; van Zon‐Rabelink 2003; Vercellini 1999). Twelve trials reported operative difficulties such as difficulty of surgery, technical complications, and abandoning the procedure (Abbott 2003; Bhattacharya 1997; Boujida 2002; Brun 2006; Cooper 1999; Corson 2000; Hawe 2003; Pellicano 2002; Perino 2004; Sambrook 2009; van Zon‐Rabelink 2003; Vercellini 1999). Only six trials compared the proportion given local rather than general anaesthesia (Cooper 2002; Cooper 2004; Corson 2000; Corson 2001; Duleba 2003; Sambrook 2009). Six trials reported length of hospital stay and time or ability to return to normal activities or work (Brun 2006; Clark 2011; Cooper 1999; Pellicano 2002; Sambrook 2009; Thabet 2010).
Quality of life
Six trials recorded women's perceived change in quality of life in a reproducible and validated format (Abbott 2003; Bongers 2004; Clark 2011; Cooper 1999; Hawe 2003; Sambrook 2009).
Improvement in other menstrual symptoms
Five trials reported on improvement in premenstrual syndrome (PMS) (Abbott 2003; Cooper 1999; Hawe 2003; Laberge 2016; Meyer 1998), and nine reported on improvement in dysmenorrhoea (Abbott 2003; Athanatos 2015; Bhattacharya 1997; Cooper 1999; Cooper 2004; Hawe 2003; Laberge 2016; Meyer 1998; Penninx 2010).
Complication rate
Fourteen trials reported the frequency of specific adverse events both before and after discharge from the hospital (Athanatos 2015; Bhattacharya 1997; Clark 2011; Cooper 1999; Cooper 2002; Cooper 2004; Corson 2000; Corson 2001; Laberge 2016; Meyer 1998; Pellicano 2002; Penninx 2010; Thabet 2010; van Zon‐Rabelink 2003).
We have divided complications into major and minor complications.
Major complications
-
Perforation
-
Endometritis
-
Myometritis
-
Cervical laceration/tear or stenosis
-
Pelvic sepsis
-
Pelvic abscess
-
Pelvic inflammatory disease
-
Haematometra
-
Uterine tamponade
-
Blood transfusion
-
Glycine toxicity
-
Fluid overload
-
Fluid deficit
-
Bowel obstruction
-
Urinary incontinence
Minor complications
-
Skin rash and burning sensation
-
Headache
-
Nausea, vomiting or severe pelvic pain
-
Weakness or fatigue during the first 24 hours
-
Backache during the first 24 hours
-
Bradycardia
-
Fever
-
Chills
-
Bloating
-
Abdominal tenderness
-
Dysuria
-
Urinary tract infection (UTI)
-
Hydrosalpinx
-
Spotting during the first 24 hours
-
Vaginal bleeding
-
Abdominal cramping
-
Infection (leucorrhoea)
-
First‐degree burn
Requirement for further surgery
A total of 23 trials reported on the requirement for further surgery (Abbott 2003; Athanatos 2015; Bhattacharya 1997; Bongers 2004; Boujida 2002; Brun 2006; Clark 2011; Cooper 1999; Cooper 2004; Corson 2000; Corson 2001; Duleba 2003; Hawe 2003; Laberge 2016; McClure 1992; Meyer 1998; Pellicano 2002; Penninx 2010; Penninx 2016; Perino 2004; Sambrook 2009; Thabet 2010; van Zon‐Rabelink 2003).
Sixteen trials reported on the requirement for further endometrial ablation or hysterectomy (Abbott 2003; Bhattacharya 1997; Boujida 2002; Brun 2006; Clark 2011; Cooper 1999; Cooper 2004; Corson 2001; Duleba 2003; Hawe 2003; McClure 1992; Meyer 1998; Pellicano 2002; Penninx 2010; Penninx 2016; van Zon‐Rabelink 2003).
Nineteen trials reported on the requirement for further hysterectomy (Athanatos 2015; Bongers 2004; Boujida 2002; Brun 2006; Clark 2011; Cooper 1999; Cooper 2004; Corson 2000; Corson 2001; Duleba 2003; Laberge 2016; Meyer 1998; Pellicano 2002; Penninx 2010; Penninx 2016; Perino 2004; Sambrook 2009; Thabet 2010; van Zon‐Rabelink 2003).
Mortality as a direct result of surgery
No trials reported mortality as a result of surgery.
Follow‐up
Eight trials followed up on women at 12 months (Cooper 2004; Corson 2001; Duleba 2003; Laberge 2016; Meyer 1998; Penninx 2016; Perino 2004; Vercellini 1999). Seven trials followed up on women at 3 and/or 6 months and at 12 months (Abbott 2003; Athanatos 2015; Brun 2006; Clark 2011; Cooper 2002; Corson 2000; Hawe 2003). One trial provided 6 months' follow‐up (McClure 1992), and another provided 9 and 15 months' follow‐up (Romer 1998).
One trial reported 3, 12, and 24 months' follow‐up (Pellicano 2002). Two provided follow‐up at different times and up to 5 years (Penninx 2010; Sambrook 2009). Three trials followed up at different times and up to 10 years (Bongers 2004; Boujida 2002; Cooper 1999).
One trial did not follow up on women, and all outcomes were related to the procedure (van Zon‐Rabelink 2003).
Three trials described unclear follow‐up time (Ghazizadeh 2014; Onoglu 2007; Thabet 2010).
Funding and conflicts of interest
In terms of funding, four trials reported institutional or government funding: from the Chief Scientist Office at the Scottish Department of Health (Bhattacharya 1997), from the Research Foundation of the County of West Zealand (Boujida 2002), from Akdeniz University (Onoglu 2007), and from the Chief Scientist Office at the Scottish Government Health Directorates (Sambrook 2009).
Fourteen trials reported that funding was received from industry, that study authors were associated with industry, or that equipment was provided by industry (Abbott 2003; Bongers 2004; Clark 2011; Cooper 1999; Cooper 2002; Cooper 2004; Corson 2000; Corson 2001; Duleba 2003; Hawe 2003; Laberge 2016; Meyer 1998; Pellicano 2002; Vercellini 1999). One trial acknowledged a medical equipment company for technical assistance, but it is unknown whether or not the trial received funding (Brun 2006).
Two trials reported no external funding (Ghazizadeh 2014; Penninx 2016).
Seven trials did not report details on the source of funding (Athanatos 2015; McClure 1992; Penninx 2010; Perino 2004; Romer 1998; Thabet 2010; van Zon‐Rabelink 2003).
Four trials reported conflicts of interest.
-
Cooper 1999: one study author was funded in part by industry as a research fellow, other study authors had received travel and accommodation support from industry for attending conferences and training courses, and one study author is director and a stock shareholder and receives travel grants from industry.
-
Duleba 2003: study authors are consultants for industry.
-
Penninx 2010: one study author received an unconditional grant from industry for another research project.
-
Sambrook 2009: two study authors received financial support from industry for travel and for attending meetings.
Three studies declared that authors had no conflicts of interest (Abbott 2003; Laberge 2016; Penninx 2016).
Twenty‐one trials provided no details on conflicts of interest (Athanatos 2015; Bhattacharya 1997; Bongers 2004; Boujida 2002; Brun 2006; Clark 2011; Cooper 2002; Cooper 2004; Corson 2000; Corson 2001; Ghazizadeh 2014; Hawe 2003; McClure 1992; Meyer 1998; Onoglu 2007; Pellicano 2002; Perino 2004; Romer 1998; Thabet 2010; van Zon‐Rabelink 2003; Vercellini 1999).
Excluded studies
We excluded six studies.
-
One compared different waveforms for rollerball ablation (Chang 2009).
-
One was not randomised (El‐Nashar 2009).
-
Two compared similar types of endometrial ablation with or without a co‐intervention (Abd Ek Hameed 2012; Cash 2012).
-
One did not take place (Cooper 2012).
-
One included a population that does not meet review criteria (Soysal 2001).
Risk of bias in included studies
We have provided information on risk of bias in the included studies in the Characteristics of included studies table, and we have summarised this information in Figure 2 and Figure 3.

Methodological quality summary: review authors' judgements about each methodological quality item for each included study.
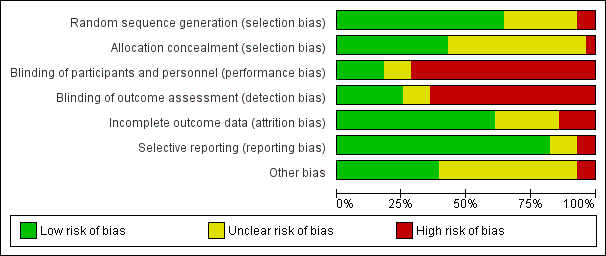
Risk of bias graph: review authors' judgements about each risk of bias item presented as percentages across all included studies.
Allocation
Randomisation method
Eighteen studies described adequate randomisation methods, and we judged them to be at low risk of selection bias. They used either computer‐generated numbers or lists of random numbers (Abbott 2003; Athanatos 2015; Bhattacharya 1997; Bongers 2004; Brun 2006; Clark 2011; Cooper 1999; Cooper 2002; Cooper 2004; Corson 2000; Corson 2001; Hawe 2003; Meyer 1998; Pellicano 2002; Penninx 2010; Perino 2004; Sambrook 2009; Vercellini 1999). We judged eight studies to be at unclear risk of selection bias; two reported unclear data about the random sequence generation (Laberge 2016; Thabet 2010), and six provided no details on the randomisation method (Duleba 2003; Ghazizadeh 2014; McClure 1992; Penninx 2016; Romer 1998; van Zon‐Rabelink 2003). Two studies provided details of an inadequate randomisation method (Boujida 2002; Onoglu 2007); Onoglu 2007 reported that researchers allocated participants to treatment in the order in which they came into the clinic. Boujida 2002 reported using odd and even numbers. We judged these studies to be at high risk of bias.
Allocation concealment
Thirteen studies provided evidence of adequate allocation concealment, and we judged them to be at low risk of bias. These studies used either sequentially numbered opaque envelopes or a central method for allocation to groups (Bhattacharya 1997; Bongers 2004; Boujida 2002; Brun 2006; Clark 2011; Cooper 1999; Cooper 2004; Corson 2000; Hawe 2003; Penninx 2010; Penninx 2016; Sambrook 2009; Vercellini 1999).
We judged that 14 studies were at unclear risk of bias because they did not provide details as to whether allocation was concealed (Abbott 2003; Athanatos 2015; Cooper 2002; Corson 2001; Duleba 2003; Ghazizadeh 2014; Laberge 2016; McClure 1992; Meyer 1998; Pellicano 2002; Perino 2004; Romer 1998; Thabet 2010; van Zon‐Rabelink 2003). We scored the remaining study as having no concealment and judged it to be at high risk of bias (Onoglu 2007).
Blinding
Performance bias
Most of the studies did not specifically undertake or report blinding; for all these studies, blinding was unlikely due to the nature of the interventions. Three studies that compared second‐generation techniques (bipolar radiofrequency vs balloon) (Abbott 2003; Bongers 2004; Penninx 2016), along with another comparing balloon versus laser (Hawe 2003), described triple blinding (patients, investigators, and assessors), and two studies on second‐generation approaches reported double blinding (patients and assessors) (Athanatos 2015; Penninx 2016). Women were blinded to allocation in Clark 2011, although they were likely to have guessed allocation; we judged this study to be at unclear risk of bias. Two other studies blinded women but not investigators (Penninx 2010; Sambrook 2009).
Detection bias
We judged seven studies to be at low risk of detection bias (Abbott 2003; Athanatos 2015; Bongers 2004; Hawe 2003; Penninx 2010; Penninx 2016; Sambrook 2009). We judged three studies to be at unclear risk of detection bias because they provided insufficient details (Clark 2011; Ghazizadeh 2014; Laberge 2016). For the remaining trials, we considered risk of detection bias to be high.
Incomplete outcome data
For assessments regarding incomplete outcome data, we scored 17 studies as having adequately addressed their missing data (if any) because they reported no dropouts, missing data were balanced between groups, or they had minimal loss to follow‐up that was unlikely to affect the calculation of estimates (Abbott 2003; Athanatos 2015; Bongers 2004; Boujida 2002; Cooper 1999; Cooper 2004; Hawe 2003; Laberge 2016; McClure 1992; Meyer 1998; Onoglu 2007; Penninx 2010; Perino 2004; Romer 1998; Sambrook 2009;; van Zon‐Rabelink 2003; Vercellini 1999); we judged these studies to be at low risk of attrition bias. For seven studies, it was unclear whether their missing data could cause bias (Cooper 2002; Corson 2000; Corson 2001; Duleba 2003; Ghazizadeh 2014; Pellicano 2002; Penninx 2016), and we judged them to be at unclear risk of bias. Most of them reported dropouts without reasons or details on the distribution per group. Four studies had high risk of attrition bias: one for differences in the number of participants providing data for different outcomes (Bhattacharya 1997), one for differences in the number lost at assessment at 12 months for different outcomes (Clark 2011), one because withdrawals were unbalanced between groups (Brun 2006), and another because dropouts were replaced by other cases, which is likely to cause major bias (Thabet 2010).
Selective reporting
We judged 23 out of 28 studies to have low risk of reporting bias; study authors reported all prespecified outcomes in the results sections (Abbott 2003; Athanatos 2015; Bhattacharya 1997; Boujida 2002; Brun 2006; Clark 2011; Cooper 1999; Cooper 2002; Cooper 2004; Corson 2000; Corson 2001; Duleba 2003; Hawe 2003; Laberge 2016; McClure 1992; Meyer 1998; Pellicano 2002; Penninx 2016; Perino 2004; Sambrook 2009; Thabet 2010; van Zon‐Rabelink 2003; Vercellini 1999).
Three studies had unclear risk of selective reporting ‐ two because they did not report complications (Penninx 2010; Romer 1998), and one because study authors did not report or prespecify adverse effects (Bongers 2004).
We judged only two studies as having high risk of selective reporting ‐ one because it reported no quantification of bleeding (Ghazizadeh 2014), and the other because study authors described prespecified bleeding patterns but did not report the data (Onoglu 2007).
Other potential sources of bias
Four studies had other potential sources of bias: one recruited participants over two different time periods and comparison of the two groups indicated substantial differences (Bhattacharya 1997); in another, numbers in the two randomised groups differed substantially with no explanation given (van Zon‐Rabelink 2003); in another, past medical history was significantly different between groups (Ghazizadeh 2014); and in another, one woman receiving cryoablation had higher PBAC scores than the others (Duleba 2003).
Effects of interventions
First‐generation technique comparisons
1. Laser ablation versus transcervical resection of the endometrium (TCRE) (Comparison 1)
Two studies with a total of 176 women reported laser versus transcervical resection of the endometrium (Bhattacharya 1997; McClure 1992) .
Primary outcomes
1.1 and 1.2 Bleeding
No clear evidence showed any differences between laser ablation and TCRE groups in the rate of amenorrhoea at 6 months (risk ratio (RR) 0.97, 95% confidence interval (CI) 0.66 to 1.45; 348 women; 2 studies; I² = 28%), the combined rate of amenorrhoea and hypomenorrhoea at 6 months (RR 0.97, 95% CI 0.89 to 1.05; 326 women; 1 study) or at 12 months (RR 1.06, 95% CI 0.92 to 1.22; 306 women; 1 study), or mean blood loss at 6 months (mean difference (MD) 23.60 mL, 95% CI ‐8.32 to 55.52; 22 women; 1 study). See Analysis 1.2 and Analysis 1.1.
1.3 Rate of satisfaction
One trial provided no clear evidence of a difference between laser ablation and TCRE groups in the rate of satisfaction at 12 months (RR 0.99, 95% CI 0.92 to 1.06; 321 women; 1 study). See Analysis 1.3.
Secondary outcomes
1.4 Duration of surgery
Duration of laser ablation surgery was on average 9 minutes longer than for TCRE (MD 9.15 minutes, 95% CI 7.2 to 11.1; 386 women; 2 studies; I² = 74%). See Analysis 1.4.
1.5 Operative difficulties
Risks of equipment failure were greater among women who had laser ablation than among those with TCRE (RR 5.54, 95% CI 1.65 to 18.60; 366 women; 1 study). Trials found no clear evidence of differences between groups for abandonment of procedure (RR 1.47, 95% CI 0.61 to 3.51; 366 women; 1 study), instrument failure (RR 0.20, 95% CI 0.01 to 4.05; 366 women; 1 study), or need for immediate hysterectomy (RR 0.33, 95% CI 0.01 to 7.95; 366 women; 1 study). See Analysis 1.5.
1.6 Women's perceived change in quality of life
Researchers found no clear evidence of a difference between laser ablation and TRCE at 12 months for the proportion of women reporting good general health (RR 1.03, 95% CI 0.95 to 1.12; 321 women). See Analysis 1.6.
1.7 Improvement in other menstrual symptoms
We found no clear evidence of differences between laser ablation and TRCE for improvement in general symptoms (RR 1.03, 95% CI 0.87 to 1.21; 321 women; 1 study) or for improvement in dysmenorrhoea at 6 months' (RR 1.17, 95% CI 1.00 to 1.38; 253 women; 1 study) or 12 months' follow‐up (RR 1.00, 95% CI 0.87 to 1.15; 218 women; 1 study). See Analysis 1.7.
1.8 Complication rate: major complications
No clear evidence showed a difference between laser ablation and TRCE in major complication rates including the following (see Analysis 1.8).
-
Perforation (RR 0.14, 95% CI 0.01 to 2.69; 366 women; 1 study).
-
Bowel obstruction (RR 2.94, 95% CI 0.12 to 71.59; 366 women; 1 study).
-
Pelvic sepsis (RR 0.82, 95% CI 0.25 to 2.62; 366 women; 1 study).
-
Haematometra (RR 0.20, 95% CI 0.01 to 4.05; 366 women; 1 study).
-
Glycine toxicity (RR 4.23, 95% CI 0.23 to 79.10 ; 22 women; 1 study).
-
Fluid overload >1.5 L (RR 4.89, 95% CI 1.44 to 16.61; 366 women; 1 study).
-
Uterine tamponade (RR 1.14, 95% CI 0.39 to 3.33; 366 women; 1 study).
1.9 Complication rate: minor complications
No clear evidence showed a difference between laser ablation and TRCE in minor complication rates including the following (see Analysis 1.9).
-
Burns (RR 4.89, 95% CI 0.24 to 101.21; 366 women; 1 study).
-
Urinary tract infection (RR 1.96, 95% CI 0.36 to 10.55; 366 women; 1 study).
1.10 Requirement for further surgery
Trials have provided no clear evidence of a difference between laser ablation and TRCE in the requirement of further surgery up to 12 months' follow‐up (RR 0.84, 95% CI 0.55 to 1.29; 388 women; 2 studies; I² = 0%). See Analysis 1.10.
Researchers have provided no data on the proportion of women given local rather than general anaesthesia, length of hospital stay, and time or ability to return to normal activities or work.
2. Vaporising electrode ablation versus TCRE (Comparison 2)
One study with 91 women reported on vaporising electrode ablation versus TCRE (Vercellini 1999).
Primary outcomes
2.1 and 2.2 Bleeding
Studies have provided no clear evidence of a difference between vaporising electrode ablation and TCRE for bleeding as measured by amenorrhoea (RR 0.90, 95% CI 0.73 to 1.12; 182 women; 1 study), hypomenorrhoea (scanty menstruation) rate (RR 0.99, 95% CI 0.80 to 1.22; 91 women; 1 study), or pictorial chart method (PBAC) score at 12 months (MD ‐5.00 units, 95% CI ‐19.18 to 9.18; 91 women; 1 study). See Analysis 2.1 and Analysis 2.2.
2.3 Rate of satisfaction
We found no clear evidence of a difference between vaporising electrode ablation and TCRE in the rate of satisfaction (very/moderately) with treatment at 12 months (RR 1.03, 95% CI 0.93 to 1.14; 91 women; 1 study). See Analysis 2.3.
Secondary outcomes
2.4 Duration of operation
The duration of the operation/procedure was shorter with vaporising electrode ablation than with TRCE (MD ‐1.50 minutes, 95% CI ‐2.65 to ‐0.35; 91 women; 1 study). See Analysis 2.4.
2.5 Operative difficulties
Vaporising electrode ablation was associated with a reduction in difficulty with surgery, reported as moderate or severe, compared with TCRE (RR 0.29, 95% CI 0.10 to 0.82; 91 women; 1 study). See Analysis 2.5.
2.6 Complication rate: major complications
The extent of fluid deficit was greater in the TCRE group than in the vaporising electrode ablation group (MD ‐258.00, 95% CI ‐342.05 to ‐173.95; 91 women; 1 study). See Analysis 2.6.
Researchers have provided no data on the proportion of women given local rather than general anaesthesia, length of hospital stay, time or ability to return to normal activities or work, women's perceived change in quality of life, improvement in menstrual symptoms, complication rates, requirement for further surgery, or mortality as a direct result of surgery.
3. Rollerball versus TCRE (Comparison 3)
Two trials with a total of 165 women reported on rollerball versus TCRE (Boujida 2002; Onoglu 2007).
Primary outcomes
Researchers have provided no data on bleeding or satisfaction rates.
Secondary outcomes
3.1 Duration of surgery
No clear evidence showed a difference between rollerball and TCRE for duration of surgery (MD ‐1.10 minutes, 95% CI ‐2.92 to 0.72; 45 women; 1 study). Boujida 2002 provided data as median (range) values that we did not include in the meta‐analysis. These data suggest that the duration of surgery was shorter with rollerball than with TCRE, median 13 minutes with rollerball (range 6 to 105 minutes) in 61 women versus 20 minutes (range 4 to 45 minutes) with TCRE in 59 women. See Analysis 3.1.
3.2 Complication rate
No clear evidence showed a difference in major complication rates between rollerball and TCRE such as the following (see Analysis 3.2).
-
Fluid deficit (RR 0.32, 95% CI 0.01 to 7.76; 120 women; 1 study).
-
Perforation (RR 0.32, 95% CI 0.01 to 7.76; 120 women; 1 study).
3.3 Requirement for further surgery
Trials have provided no evidence of any differences between rollerball and TCRE in the number of women requiring either hysterectomy or any surgical intervention up to 10 years' follow‐up, including the following (see Analysis 3.3).
-
2 years' follow‐up (hysterectomy and ablation) (RR 1.04, 95% CI 0.55 to 1.95; 120 women; 1 study).
-
2 years' follow‐up (hysterectomy only) (RR 1.45, 95% CI 0.43 to 4.88; 120 women; 1 study).
-
2 to 5 years' follow‐up (hysterectomy and ablation) (RR 1.21, 95% CI 0.70 to 2.10; 120 women; 1 study).
-
2 to 5 years' follow‐up (hysterectomy only) (RR 1.21, 95% CI 0.51 to 2.85; 120 women; 1 study).
-
More than 5 years' follow‐up (hysterectomy and ablation) (RR 1.39, 95% CI 0.82 to 2.36; 120 women; 1 study).
-
More than 5 years' follow‐up (hysterectomy only) (RR 1.32, 95% CI 0.66 to 2.63; 120 women; 1 study).
Researchers have provided no data for operative difficulties, the proportion of women given local rather than general anaesthesia, length of hospital stay, time or ability to return to normal activities or work, women's perceived change in quality of life, improvement in menstrual symptoms, complication rates, or mortality as a direct result of surgery.
Second‐generation versus first‐generation technique comparisons
4. Thermal laser versus TCRE (Comparison 4)
One study with 111 women reported on thermal laser versus TCRE (Perino 2004).
Primary outcomes
4.1 Bleeding
Rates of amenorrhoea at 1 and 3 years after surgery were greater for women in the thermal laser group than in the TCRE group (RR 2.46, 95% CI 1.50 to 4.03; 111 women; 1 study; RR 2.49, 95% CI 1.48 to 4.21; 111 women; 1 study, respectively). See Analysis 4.1.
4.2 Rate of satisfaction
Trials showed no clear evidence of a difference in satisfaction rates between thermal laser and TCRE at 1 year (RR 1.04, 95% CI 0.94 to 1.16; 111 women; 1 study) and 5 years' (RR 1.02, 95% CI 0.91 to 1.14; 111 women; 1 study) follow‐up. See Analysis 4.2.
Secondary outcomes
4.3 Duration of operation
Mean length of surgery was shorter for women in the thermal laser group than in the TCRE group (MD ‐9.30, 95% CI ‐11.36 to ‐7.24; 111 women; 1 study). See Analysis 4.3.
4.4 Complication rate: major complications
Researchers have provided no evidence of differences in the major complication rate between thermal laser and TCRE such as perforation (no events in either group). See Analysis 4.4.
4.5 Complication rate: minor complications
Studies have reported no evidence of differences in the minor complication rate between thermal laser and TCRE such as urinary tract infection (RR 0.49, 95% CI 0.05 to 5.26; 111 women; 1 study). See Analysis 4.5.
4.6 Requirement for further surgery
No clear evidence showed a difference in the requirement for hysterectomy at 2 to 5 years' follow‐up between thermal laser and TCRE groups (RR 0.59, 95% CI 0.15 to 2.35; 111 women; 1 study). See Analysis 4.6.
Trials have provided no data for operative difficulties, the proportion of women given local rather than general anaesthesia, length of hospital stay, time or ability to return to normal activities or work, women's perceived change in quality of life, improvement in menstrual symptoms, or mortality as a direct result of surgery.
5. Hydro ThermAblator (HTA) versus rollerball (Comparison 5)
One study with 276 women compared Hydro ThermAblator (HTA) versus rollerball (Corson 2001).
Primary outcomes
5.1 Bleeding
We assessed bleeding at 1 year, 2 years', and up to 5 years' follow‐up in three different ways: PBAC score up to and including 75; or PBAC score up to and including 100; or by reporting of amenorrhoea. Trials provided no clear evidence of a difference between HTA and rollerball, as shown by the following (see Analysis 5.1).
-
PBAC ≤ 75 at 1 year follow‐up (RR 0.94, 95% CI 0.82 to 1.07; 250 women; 1 study).
-
PBAC ≤ 100 at 1 year follow‐up (RR 0.96, 95% CI 0.86 to 1.07; 250 women; 1 study).
-
PBAC ≤ 100 at 2 years' follow‐up (RR 1.00, 95% CI 0.92 to 1.09; 225 women; 1 study).
-
PBAC ≤ 100 at 2 to 5 years' follow‐up (RR 1.03, 95% CI 0.95 to 1.12; 203 women; 1 study).
-
Amenorrhoea at 1 year follow‐up (RR 0.79, 95% CI 0.60 to 1.05; 250 women; 1 study).
-
Amenorrhoea at 2 years' follow‐up (RR 1.01, 95% CI 0.75 to 1.36; 225 women; 1 study).
-
Amenorrhoea at 2 to 5 years' follow‐up (RR 1.17, 95% CI 0.86 to 1.59; 203 women; 1 study).
5.2 Rate of satisfaction
We noted no clear evidence of a difference in the rate of satisfaction with treatment at 2 to 5 years' follow‐up between HTA and rollerball groups (RR 1.01, 95% CI 0.96 to 1.06; 203 women; 1 study). See Analysis 5.2.
Secondary outcomes
5.3 Proportion given local rather than general anaesthesia
Women undergoing HTA ablation were almost twice as likely as those with TRCE to require only a local anaesthetic (RR 2.02, 95% CI 1.32 to 3.09; 269 women; 1 study). See Analysis 5.3.
5.4 Complication rate: major complications
Women in the HTA group were less likely to experience the adverse event of haematometra (haemorrhage in the uterus) from surgery (RR 0.18, 95% CI 0.04 to 0.93). See Analysis 5.4. However, results showed no clear differences in other major complications such as the following.
-
Cervical lacerations (RR 0.09, 95% CI 0.00 to 1.92; 269 women; 1 study).
-
Endometritis (RR 0.92, 95% CI 0.08 to 10.05; 269 women; 1 study).
5.5 Complication rate: minor complications
Women with HTA were more likely to experience abdominal pain (RR 1.40, 95% CI 1.03 to 1.90; 269 women; 1 study) and nausea and vomiting after surgery (RR 3.08, 95% CI 1.36 to 6.98; 269 women; 1 study). See Analysis 5.5. Study results showed no clear evidence of differences in other minor complications such as the following.
-
Uterine cramping (RR 1.12, 95% CI 0.72 to 1.74; 269 women; 1 study).
-
Urinary tract infection (RR 1.15, 95% CI 0.23 to 5.83; 269 women; 1 study).
-
First‐degree burn (RR 2.32, 95% CI 0.11 to 47.89; 269 women; 1 study).
5.6 Requirement for further surgery
We found no clear evidence of differences between groups in the requirement for further surgery, including any surgery at 1 year follow‐up (RR 2.32, 95% CI 0.11 to 47.89; 269 women; 1 study); any surgery at 2 to 5 years' follow‐up (RR 1.26, 95% CI 0.58 to 2.73; 269 women; 1 study); or hysterectomy at 5 years' follow‐up (RR 1.54, 95% CI 0.58 to 4.06; 269 women; 1 study). See Analysis 5.6.
Researchers provided no data for duration of surgery, operative difficulties, length of hospital stay, time or ability to return to normal activities or work, women's perceived change in quality of life, improvement in menstrual symptoms, or mortality as a direct result of surgery.
6. Cryoablation versus rollerball (Comparison 6)
One study with 279 women compared cryoablation and rollerball (Duleba 2003).
Primary outcomes
6.1 Bleeding
Women undergoing cryoablation were less likely to have amenorrhoea 1 year after surgery than women receiving rollerball treatment (odds ratio (OR) 0.5, 95% CI 0.36 to 0.69; 279 women; 1 study). See Analysis 6.1.
6.2 Rate of satisfaction
We found no evidence of clear differences between groups for satisfaction with treatment at 1 year (RR 1.06, 95% CI 0.96 to 1.17; 279 women; 1 study) or 2 years' follow‐up (RR 1.04, 95% CI 0.91 to 1.17; 279 women; 1 study). See Analysis 6.2.
Secondary outcomes
Operative outcomes
6.3 Proportion given local anaesthesia
Women undergoing cryoablation were more likely to receive local rather than general anaesthesia than women undergoing rollerball ablation (RR 6.6, 95% CI 3.2 to 13.6; 279 women; 1 study). See Analysis 6.3.
6.4 Complication rate: major complications
No evidence showed clear differences between groups for major complications such as the following (see Analysis 6.4).
-
Perforation (RR 0.15, 95% CI 0.01 to 3.63; 279 women; 1 study).
6.5 Complication rate: minor complications
No evidence showed clear differences between groups for minor complications such as the following (See Analysis 6.5)
-
Vaginal bleeding (RR 1.35, 95% CI 0.06 to 32.70; 279 women; 1 study).
-
Abdominal cramping (RR 2.24, 95% CI 0.11 to 46.21; 279 women; 1 study).
-
Urinary tract infection (RR 0.15, 95% CI 0.01 to 3.63; 279 women; 1 study).
-
Severe pelvic pain (RR 0.15, 95% CI 0.01 to 3.63; 279 women; 1 study).
6.6 Requirement for further surgery
Researchers showed no clear evidence of differences between groups in the requirement for further surgery at 2 years after ablation treatment for any surgery (RR 1.00, 95% CI 0.45 to 2.22; 279 women; 1 study) or for hysterectomy only (RR 0.83, 95% CI 0.34 to 2.00; 279 women; 1 study). See Analysis 6.6.
Researchers provided no data for duration of surgery, operative difficulties, length of hospital stay, time or ability to return to normal activities or work, women's perceived change in quality of life, improvement in menstrual symptoms, or mortality as a direct result of surgery.
7. Electrode ablation (balloon or mesh) versus TCRE (Comparison 7)
Two studies with a total of 541 women compared electrode ablation (balloon or mesh) versus TCRE. Corson 2000 compared electrode ablation with a balloon system, and Cooper 2002 compared an electrode balloon system versus mesh.
Primary outcomes
7.1 , 7.2, and 7.3 Bleeding
Trial results showed no clear evidence of differences between groups for bleeding.
-
Amenorrhoea rate with the balloon system (RR 0.89, 95% CI 0.62 to 1.29; 234 women; 1 study) versus the mesh system (RR 1.16, 95% CI 0.82 to 1.64; 236 women; 1 study). See Analysis 7.1.
-
PBAC score < 75 with the balloon system (RR 1.05, 95% CI 0.94 to 1.17; 234 women; 1 study) versus the mesh system (RR 1.08, 95% CI 0.96 to 1.22; 236 women; 1 study). See Analysis 7.2.
-
PBAC score at 12 months' follow‐up. See Analysis 7.3.
7.4 Rate of satisfaction
Upon assessing rate of satisfaction with treatment after 1 year, study authors did not report clear differences between groups comparing the mesh system to TCRE (RR 0.99, 95% CI 0.92 to 1.06; 236 women; 1 study). See Analysis 7.4.
Secondary outcomes
Operative outcomes
7.5 Duration of surgery
The duration of the procedure was significantly longer for women undergoing TCRE compared with ablation (MD 18.7 minutes, 95% CI 16.8 to 20.7; 520 women; 2 studies; I² = 69%). See Analysis 7.5.
7.6 Procedure abandonment
We found no evidence of a clear difference between groups for abandonment of the procedure (RR 2.57, 95% CI 0.11 to 62.41; 267 women; 1 study). See Analysis 7.6.
7.7 Proportion given general versus local anaesthesia
Women undergoing electrode ablation were more likely to receive local rather than general anaesthesia compared with women having TCRE (RR 3.9, 95% CI 2.9 to 5.0; 520 women; 2 studies; I² = 0%). See Analysis 7.7.
7.8 Complication rate: major complications
Clear evidence showed differences in major complications such as perforation and cervical tears or lacerations between groups. Perforation (RR 0.13, 95% CI 0.02 to 1.01; 532 women; 2 studies; I² = 0%) and cervical tears or lacerations (RR 0.11, 95% CI 0.01 to 0.87; 532 women; 2 studies; I² = 0%) were less likely with electrode ablation than with TCRE. See Analysis 7.8.
We found no report of clear evidence of differences in other major complications such as the following.
-
Pelvic abscess (RR 0.17, 95% CI 0.01 to 4.19; 267 women; 1 study).
-
Haematometra (RR 0.43, 95% CI 0.08 to 2.23; 267 women; 1 study).
-
Fluid overload (RR 0.29, 95% CI 0.01 to 6.93; 267 women; 1 study).
-
Myometritis (RR 0.29, 95% CI 0.01 to 6.93; 267 women; 1 study).
-
Urinary incontinence (RR 0.29, 95% CI 0.01 to 6.93; 267 women; 1 study).
-
Pelvic inflammatory disease (RR 1.03, 95% CI 0.09 to 11.19; 267 women; 1 study).
-
Endometritis (RR 0.34, 95% CI 0.06 to 2.01; 267 women; 1 study).
7.9 Complication rate: minor complications
The minor complication rate did not show clear evidence of differences between groups for minor complications such as the following (see Analysis 7.9).
-
Nausea/vomiting or severe pelvic pain (RR 1.10, 95% CI 0.37 to 3.27; 267 women; 1 study).
-
Urinary tract infection (RR 1.05, 95% CI 0.39 to 2.84; 267 women; 1 study).
-
Fever (RR 0.85, 95% CI 0.05 to 13.51; 267 women; 1 study).
-
Haemorrhage (RR 0.51, 95% CI 0.03 to 8.13; 267 women; 1 study).
-
Bradycardia (RR 1.55, 95% CI 0.06 to 37.70; 267 women; 1 study).
7.10 Requirement for further surgery
At two years' follow‐up, comparison of the balloon system versus TCRE + roller ball provided no clear evidence of differences between groups for hysterectomy rate (RR 0.52, 95% CI 0.18 to 1.50; 255 women; 1 study). See Analysis 7.10.
Researchers provided no data for operative difficulties, length of hospital stay, time or ability to return to normal activities or work, women's perceived change in quality of life, improvement in menstrual symptoms, or mortality as a direct result of surgery.
8. Microwave versus TCRE plus rollerball (Comparison 8)
Two studies with a total of 585 women compared microwave versus TCRE plus rollerball (Cooper 1999; Cooper 2004).
Primary outcomes
8.1 Bleeding
No evidence showed differences between groups in primary outcomes measuring menstrual blood loss (see Analysis 8.1). Bleeding was measured by:
-
PBAC < 75 or acceptable improvement at 1 year follow‐up (RR 1.04, 95% CI 0.96 to 1.13; 562 women; 2 studies; I² = 0%);
-
PBAC < 75 or acceptable improvement at 2 to 5 years' follow‐up (RR 1.12, 95% CI 0.97 to 1.28; 236 women; 1 study);
-
PBAC < 75 or acceptable improvement at > 5 years' follow‐up (RR 1.08, 95% CI 0.87 to 1.34; 263 women; 1 study);
-
Amenorrhoea at 1 year follow‐up (RR 1.12, 95% CI 0.93 to 1.36; 562 women; 2 studies; I² = 0%);
-
Amenorrhoea at 2 years' follow‐up (RR 1.16, 95% CI 0.87 to 1.53; 249 women; 1 study);
-
Amenorrhoea at 2 to 5 years' follow‐up (RR 0.93, 95% CI 0.78 to 1.12; 236 women; 1 study); and
-
Amenorrhoea at > 5 years' follow‐up (RR 0.94, 95% CI 0.83 to 1.05; 189 women; 1 study).
8.2 Rate of satisfaction
Results of the comparison vary over time. At 2 years' follow‐up, results showed benefit for microwave ablation in terms of satisfaction with treatment when compared with TCRE (RR 1.01, 95% CI 0.95 to 1.07; 533 women; 2 studies; I² = 0%), and this benefit was maintained at 5 years' (RR 1.19, 95% CI 1.02 to 1.38; 249 women; 1 study) but not at 10 years' follow‐up in the same study (RR 1.14, 95% CI 0.92 to 1.42; participants = 263; studies = 1). See Analysis 8.2.
Secondary outcomes
Operative outcomes
8.3 Duration of surgery
In one study, the duration of the procedure was significantly shorter with microwave than with TCRE (MD 3.6, 95% CI ‐5.7 to ‐1.4; P = 0.001). See Analysis 8.3.
8.4 Surgery difficulties
In one study, risk of equipment failure was higher in the microwave group than in the TCRE group (RR 3.81, 95% CI 1.09 to 13.34; 263 women; 1 study), and results did not show clear evidence of differences between groups in abandoning the procedure (RR 1.04, 95% CI 0.31 to 3.50; 263 women; 1 study). See Analysis 8.4.
8.5 Proportion given general versus local anaesthesia
Participants undergoing microwave ablation were more likely to receive local anaesthesia than those undergoing TCRE (RR 2.54, 95% CI 1.73 to 3.72; 315 women; 1 study). See Analysis 8.5.
8.6 Duration of hospital stay
We found no clear evidence of a difference between groups in terms of hours spent in the hospital (no differences; P = 0.17). See Analysis 8.6.
8.7 Inability to work
Researchers provided no clear evidence of differences between groups in the proportion of women with inability to work at 12 months' (RR 0.53, 95% CI 0.17 to 1.73; 240 women; 1 study) and 5 years' follow‐up (RR 1.52, 95% CI 0.26 to 8.87; 189 women; 1 study). See Analysis 8.7.
8.8 Quality of life
We found no clear evidence of differences between groups on Short Form‐36 (SF‐36) after treatment at 12 months, and at 2, 5, and 10 years. See Analysis 8.8.
8.9 Improvement in other menstrual symptoms: PMS
We found no clear evidence of differences in PMS improvement between groups at 1 year follow‐up (RR 0.98, 95% CI 0.89 to 1.09; 533 women; 2 studies; I² = 0%) or at 2 years' follow‐up (RR 1.05, 95% CI 0.93 to 1.19; 249 women; 1 study). See Analysis 8.9.
8.10 and 8.11 Improvement in other menstrual symptoms: dysmenorrhoea
Trial results showed no clear evidence of differences in improvement in the rate of dysmenorrhoea between groups at 1 year follow‐up (RR 0.98, 95% CI 0.89 to 1.09; 533 women; 2 studies; I² = 0%) nor at 2 years' follow‐up (RR 1.05, 95% CI 0.93 to 1.19; 249 women; 1 study). See Analysis 8.10. They also provided no clear evidence of differences in reduction in pain score at 5 years' follow‐up (MD ‐0.80, 95% CI ‐4.32 to 2.72; 189 women; 1 study). See Analysis 8.11.
8.12 Postoperative analgesia rate
Researchers provided no clear evidence of differences between groups (RR 0.94, 95% CI 0.81 to 1.10; 263 women; 1 study). See Analysis 8.12.
8.13 Complication rate: major complications
We found no clear evidence of differences between groups in the incidence of major complications such as haemorrhage (RR 0.09, 95% CI 0.01 to 1.69; 263 women; 1 study). See Analysis 8.13.
-
Perforation (RR 1.63, 95% CI 0.22 to 12.12; 585 women; 2 studies; I² = 0%).
-
Cervical laceration (RR 0.50, 95% CI 0.07 to 3.48; 322 women; 1 study).
-
Cervical stenosis (RR 1.50, 95% CI 0.06 to 36.52; 322 women; 1 study).
-
Endometritis (RR 6.50, 95% CI 0.37 to 114.31; 322 women; 1 study).
8.14 Complication rate: minor complications
We found no clear evidence of differences between groups in the incidence of minor complications such as the following (see Analysis 8.14).
-
Chills (RR 1.35, 95% CI 0.59 to 3.11; 322 women; 1 study).
-
Bloating (RR 0.83, 95% CI 0.38 to 1.83; 322 women; 1 study).
-
Dysuria (RR 0.77, 95% CI 0.37 to 1.58; 322 women; 1 study).
-
Fever (RR 2.50, 95% CI 0.12 to 51.62; 322 women; 1 study).
-
Headache (RR 0.75, 95% CI 0.22 to 2.59; 322 women; 1 study).
-
Nausea (RR 1.35, 95% CI 0.83 to 2.21; 322 women; 1 study).
-
Vomiting (RR 3.61, 95% CI 1.30 to 10.00; 322 women; 1 study).
-
Urinary tract infection (RR 0.50, 95% CI 0.03 to 7.88; 322 women; 1 study).
-
Vaginal infection (RR 1.50, 95% CI 0.06 to 36.52; 322 women; 1 study).
-
Uterine cramping (RR 1.21, 95% CI 1.01 to 1.44; 322 women; 1 study).
-
Abdominal tenderness (RR 0.61, 95% CI 0.26 to 1.42; 322 women; 1 study).
8.15 Requirement for further surgery
At 10 years' follow‐up, risk of hysterectomy was reduced with microwave ablation compared with TCRE plus rollerball (RR 0.60, 95% CI 0.38 to 0.96; n = 263; 1 study). See Analysis 8.15. Caution is advised when these results are interpreted, as evidence is based on a single study that reported loss to follow‐up greater than 25%.
Investigators reported no data for operative difficulties nor for mortality as a direct result of surgery.
9. Balloon versus rollerball (Comparison 9)
Three studies with a total of 414 women compared balloon versus rollerball (Meyer 1998; Romer 1998; van Zon‐Rabelink 2003).
Primary outcomes
9.1 to 9.4 Bleeding
9.1 Amenorrhoea was less likely after balloon ablation than after rollerball ablation at 1 year follow‐up (RR 0.62, 95% CI 0.39 to 1.00; 259 women; 2 studies; I² = 41%), but results showed no significant differences between groups at 2 years (RR 0.60, 95% CI 0.33 to 1.07; 227 women; 1 study) and up to 5 years (RR 0.70, 95% CI 0.39 to 1.25; 122 women; 1 study) after treatment, although a strong trend favoured rollerball ablation. See Analysis 9.1. No evidence showed significant differences between groups for rate of amenorrhoea/eumenorrhoea at 1 year follow‐up (RR 0.95, 95% CI 0.86 to 1.06; 259 women; 2 studies; I² = 0%), at 2 years' follow‐up (RR 0.99, 95% CI 0.91 to 1.08; 227 women; 1 study), or at 2 to 5 years' follow‐up (RR 0.98, 95% CI 0.91 to 1.06; 122 women; 1 study). See Analysis 9.1.
9.2 Results showed no clear differences in PBAC score at 1 year follow‐up, but one study (van Zon‐Rabelink 2003) found a significantly lower PBAC at 2 years' follow‐up in women treated with balloon (median 33.5, SD 0.905; vs median 73, SD 0.585; P = 0.01; 111 women). See Analysis 9.2.
9.3 Results showed no clear differences between groups in terms of success of treatment measured as lighter periods and no need for further surgery at 2 to 5 years' follow‐up (RR 0.98, 95% CI 0.80 to 1.20; 170 women; 1 study). See Analysis 9.3.
9.4 Researchers reported no clear differences between groups in terms of success of treatment measured as menstrual score < 185 at 1 year follow‐up (RR 1.00, 95% CI 0.83 to 1.20; 129 women; 1 study) nor at 2 years' follow‐up (RR 1.01, 95% CI 0.83 to 1.23; 121 women; 1 study).
9.5 Rate of satisfaction
No evidence showed clear differences between groups in terms of satisfaction with treatment at 1 year follow‐up (RR 0.97, 95% CI 0.93 to 1.01; 259 women; 2 studies; I² = 0%), at 2 years' follow‐up (RR 1.02, 95% CI 0.93 to 1.12; 348 women; 2 studies; I² = 0%), or at 2 to 5 years' follow‐up (RR 0.93, 95% CI 0.87 to 1.01; 122 women; 1 study). See Analysis 9.5.
Secondary outcomes
Operative outcomes
9.6 Duration of surgery
The mean difference between duration of surgery for women in the balloon group and those in the rollerball group was 15 minutes (MD ‐14.58, 95% CI ‐17.00 to ‐12.17; participants = 378; 2 studies; I² = 74%). See Analysis 9.6.
9.7 Operative difficulties
We found no evidence of significant differences between groups in terms of technical complication rates (RR 1.05, 95% CI 0.49 to 2.22; 139 women; 1 study). See Analysis 9.7.
9.8 Inability to work
Trials did not present clear evidence of differences between groups for ability to work at 1 year follow‐up (RR 1.52, 95% CI 0.37 to 6.22; 239 women; 1 study), at 2 years' follow‐up (RR 0.29, 95% CI 0.03 to 2.72; 227 women; 1 study), or at 2 to 5 years' follow‐up (RR 0.87, 95% CI 0.26 to 2.93; 210 women; 1 study). See Analysis 9.8.
9.9 Improvement in other menstrual symptoms
Trials did not present clear evidence of differences between groups in terms of improvement in other menstrual symptoms for dysmenorrhoea at 12 months (RR 0.93, 95% CI 0.80 to 1.09; 239 women; 1 study) and in premenstrual symptoms from moderate to severe at 1 year (RR 0.94, 95% CI 0.74 to 1.19; 185 women; 1 study), at 2 years' (RR 1.03, 95% CI 0.82 to 1.29; 177 women; 1 study), and at 2 to 5 years' follow‐up (RR 0.99, 95% CI 0.75 to 1.30; 166 women; 1 study). See Analysis 9.9.
9.10 Complication rate: major complications
We found no clear evidence of differences between groups in major complications such as the following (see Analysis 9.10).
-
Fluid overload (RR 0.18, 95% CI 0.01 to 3.76; 239 women; 1 study).
-
Perforation (RR 0.17, 95% CI 0.02 to 1.42; 378 women; 2 studies; I² = 0%).
-
Cervical lacerations (RR 0.17, 95% CI 0.02 to 1.42; 378 women; 2 studies; I² = 0%).
-
Endometritis (RR 2.74, 95% CI 0.29 to 25.93; 239 women; 1 study).
-
Haematometra (RR 0.30, 95% CI 0.01 to 7.39; 239 women; 1 study).
9.11 Complication rate: minor complications
We found no clear evidence of differences between groups in minor complications such as the following (see Analysis 9.11).
-
Urinary tract infection (RR 2.74, 95% CI 0.11 to 66.54; 239 women; 1 study).
-
Hydrosalpinx (RR 0.30, 95% CI 0.01 to 7.39; 239 women; 1 study).
-
Pain (RR 5.65, 95% CI 0.30 to 107.43; 139 women; 1 study).
-
Nausea (RR 0.27, 95% CI 0.01 to 6.50; 139 women; 1 study).
-
Infection (RR 0.27, 95% CI 0.01 to 6.50; 139 women; 1 study).
9.12 Requirement for further surgery
Trials provided no evidence of clear differences between groups in the requirement for further surgery including the following (see Analysis 9.12).
-
Any surgery at 1 year follow‐up (RR 0.61, 95% CI 0.10 to 3.57; 239 women; 1 study), at 2 years' follow‐up (RR 0.67, 95% CI 0.35 to 1.28; 392 women; 2 studies; I² = 61%), and at 2 to 5 years' follow‐up (RR 1.00, 95% CI 0.64 to 1.55; 122 women; 1 study). .
-
Hysterectomy at 2 years' follow‐up (RR 1.04, 95% CI 0.38 to 2.83; 137 women; 1 study) or at 2 to 5 years' follow‐up (RR 1.00, 95% CI 0.61 to 1.63; 122 women; 1 study).
Researchers provided no data for the proportion having general versus local anaesthesia, time or ability to return to normal activities or work, or mortality as a direct result of surgery.
10. Balloon versus laser (Comparison 10)
One study with 70 women compared balloon versus laser (Hawe 2003).
Primary outcomes
10.1 and 10.2 Bleeding
Researchers measured bleeding as rate of amenorrhoea and PBAC score after treatment. Evidence showed no clear differences between groups, including the following (see Analysis 10.1 and Analysis 10.2).
-
Amenorrhoea at 6 months' follow‐up (RR 1.11, 95% CI 0.61 to 2.02; 70 women; 1 study).
-
Amenorrhoea at 12 months' follow‐up (RR 0.75, 95% CI 0.38 to 1.46; 67 women; 1 study).
-
PBAC score at 6 months' follow‐up (mean (SD), 28.8 (59.6)/27.4 (57.6)); study authors did not report significance.
10.3 Rate of satisfaction
Trials provided no clear evidence of differences between groups in rate of satisfaction with treatment at 6 months' (RR 1.04, 95% CI 0.91 to 1.20; 69 women; 1 study) and at 12 months' follow‐up (RR 0.97, 95% CI 0.86 to 1.09; 57 women; 1 study). See Analysis 10.3.
Secondary outcomes
Operative outcomes
10.4 Operative difficulties
No evidence showed clear differences between groups in the rate of equipment failure (RR 4.47, 95% CI 0.22 to 89.94; 70 women; 1 study). See Analysis 10.4.
10.5 Post‐procedure pain
Participants completed a visual analogue scale (VAS) 4 hours postoperatively and indicated that the laser was significantly less painful than the balloon (mean (SD), 63.6 (17.6) vs 30.9 (20.4); MD 32.7, 95% CI 14.0 to 51.4; P = 0.002). See Analysis 10.5.
10.5 Quality of life
Women receiving balloon treatment had a significantly greater pain score than women receiving laser treatment (MD 32.7, 95% CI 23.7 to 41.7; 1 study). At 12 months after treatment, women in the balloon group had higher scores on the EuroQoL Group Quality of Life Questionnaire based on 5 dimensions (EQ‐5D) VAS than women in the laser group (MD 10.1, 95% CI 2.4 to 17.8; 1 study); this was not found at earlier follow‐up nor for other quality of life scores. See Analysis 10.6.
10.7 Improvement in other menstrual symptoms: PMS
In one study with 70 women, researchers reported on improvement in PMS for the balloon group versus the laser group at 6 months (mean (SD), 24.6 (33) for balloon and 30.5 (36) for laser) and at 12 months (mean (SD), 21.9 (26.9) for balloon and 30.5 (34.7) for laser) but did not report on the significance of differences between groups in improvement in PMS. See Analysis 10.7.
10.8 Improvement in other menstrual symptoms: dysmenorrhoea
One study with 70 women reported on improvement in dysmenorrhoea for the balloon versus the laser at 6 months (mean (SD), 24 (30.9) for the balloon vs 23 (33.9) for the laser) and at 12 months (mean (SD), 25.2 (31.5) for the balloon and 16.5 (22.3) for the laser) but did not report on the significance of differences between groups in improvement of dysmenorrhoea. See Analysis 10.8.
10.9 Requirement for further surgery
One study with 67 women found no clear differences between groups in the requirement for further surgery up to 12 months' follow‐up (RR 0.78, 95% CI 0.23 to 2.64). See Analysis 10.9.
Study authors provided no data for duration of surgery, proportion given general versus local anaesthesia, length of hospital stay, time or ability to return to normal activities or work, complication rates, or mortality as a direct result of surgery.
11. Balloon versus TCRE (Comparison 11)
Two studies with a total of 133 women compared balloon and TCRE (Brun 2006; Pellicano 2002).
Primary outcomes
11.1 Bleeding
We found no evidence of a clear difference between groups in rates of amenorrhoea at 6 months' (RR 0.95, 95% CI 0.31 to 2.93; 49 women; 1 study) and 12 months' follow‐up after surgery (RR 1.21, 95% CI 0.50 to 2.95; 45 women; 1 study). See Analysis 11.1.
11.2 Rate of satisfaction
Satisfaction with treatment was greater in the balloon group than in the TCRE group 2 years after surgery (RR 1.4, 95% CI 1.1 to 1.7; 69 women; 1 study), but this difference was not evident at 6 months (RR 1.06, 95% CI 0.93 to 1.20; 50 women; 1 study) or 1 year after surgery (RR 1.06, 95% CI 0.96 to 1.18; 122 women; 2 studies; I² = 0%). See Analysis 11.2.
Secondary outcomes
Operative outcomes
11.3 and 11.4 Duration of surgery
One trial with 82 women found that surgical time was significantly shorter (35%) with balloon than with TCRE treatment (MD ‐13.00, 95% CI ‐15.20 to ‐10.80) (see Analysis 11.3), but the second trial did not confirm this finding (mean (SD) 48 (24 to 150)/45 (23 to 105); no statistical test reported, but significant difference unlikely). See Analysis 11.4.
11.5 Operative difficulties
Equipment failure was not clearly different between groups (RR 7.22, 95% CI 0.42 to 123.83; 51 women; 1 study). See Analysis 11.5.
11.6 and 11.7 Intraoperative complications
Mean intraoperative blood loss (measured in millilitres) was significantly less for balloon treatment than for laser treatment in one small trial ((MD ‐81.80, 95% CI ‐93.33 to ‐70.27; 82 women; 1 study). See Analysis 11.13. Study authors reported that fluid overload (RR 0.10, 95% CI 0.01 to 1.67; 82 women; 1 study), cervical tear (RR 0.35, 95% CI 0.01 to 8.34; 82 women; 1 study), and rate of conversion to hysterectomy (RR 0.24, 95% CI 0.01 to 4.84; 88 women; 1 study) did not show clear differences between groups. See Analysis 11.12.
11.9 and 11.10 Postoperative pain
Postoperative pain (as measured by a continuous VAS score) was significantly greater for women in the TCRE group than in the balloon group in both trials (MD ‐0.60, 95% CI ‐0.88 to ‐0.32; 82 women; 1 study; see Analysis 11.6; mean (SD), 45 (1 to 100)/10 (0 to 90); P = 0.012; see Analysis 11.7).
11.10 and 11.11 Recovery
Length of the stay in hospital was shorter in the balloon group than in the TCRE group (MD ‐0.30 days, 95% CI ‐0.52 to ‐0.08; 82 women; 1 study). See Analysis 11.8.
Time until return to normal activities was significantly shorter for the balloon group in one study (MD ‐2.10 days, 95% CI ‐3.38 to ‐0.82; 82 women; 1 study; see Analysis 11.10), but it was not clearly different in the second study (mean (SD) 4 days (1 to 20) and 2 days (1 to 30); 49 women;1 study; see Analysis 11.11).
11.12 Complication rate: major complications
Trial results showed no evidence of clear differences between groups for major complications such as the following (Analysis 11.12).
-
Fluid overload (RR 0.10, 95% CI 0.01 to 1.67; 82 women; 1 study).
-
Cervical tear (RR 0.35, 95% CI 0.01 to 8.34; 82 women; 1 study).
-
Conversion to hysterectomy (RR 0.24, 95% CI 0.01 to 4.84; 88 women; 1 study).
-
Blood transfusion (RR 5.24, 95% CI 0.26 to 105.97; 82 women; 1 study).
11.13 and 11.14 Complication rate: minor complications
Blood loss during the procedure was clearly less in the balloon group (MD ‐81.80 mL, 95% CI ‐93.33 to ‐70.27; 82 women; 1 study). See Analysis 11.13.
We found no evidence of clear differences between groups for other minor complications such as the following (see Analysis 11.14).
-
Fever (RR 0.53, 95% CI 0.05 to 5.57; 82 women; 1 study).
-
Urinary tract infection or retention (RR 0.35, 95% CI 0.01 to 8.34; 82 women; 1 study).
-
Haemorrhage (RR 1.31, 95% CI 0.38 to 4.54; 82 women; 1 study).
11.15 Requirement for further surgery
No evidence showed any differences between groups at 12 months' follow‐up after any surgery (RR 0.51, 95% CI 0.10 to 2.64; 75 women; 1 study) or after hysterectomy (RR 0.12, 95% CI 0.01 to 2.44; 45 women; 1 study), nor at 2 years' follow‐up, for any surgery (RR 0.38, 95% CI 0.08 to 1.81; 68 women; 1 study). See Analysis 11.15.
Researchers provided no data for proportion given general versus local anaesthesia, women's perceived change in quality of life, improvement in menstrual symptoms, or mortality as a direct result of surgery.
Second‐generation ablation comparisons
12. Bipolar electrode ablation (second generation) versus balloon (second generation) (Comparison 12)
Four studies with a total of 366 women compared bipolar electrode ablation versus balloon (Abbott 2003; Bongers 2004; Clark 2011; Penninx 2016).
Primary outcomes
12.1 and 12.2 Bleeding
-
Amenorrhoea was more likely for women in the electrode ablation group than in the balloon group, both at 6 months (RR 3.37, 95% CI 2.09 to 5.44; 283 women; 3 studies; I² = 0%) and at 12 months after treatment (RR 3.12, 95% CI 2.06 to 4.72; 335 women; 4 studies; I² = 0%). Trial results showed no clear differences between groups at longer follow‐up: at 2 to 5 years' (RR 1.56, 95% CI 0.93 to 2.64;120 women; 1 study) nor at 10 years' follow‐up (RR 1.10, 95% CI 0.83 to 1.46; 104 women; 1 study). See Analysis 12.1.
-
In terms of PBAC, results differed between studies. One trial at 12 months' follow‐up did not find a difference between groups in PBAC scores after treatment (median (SD), 3(0.720)/21(0.157); 55 women; 1 study), but a second trial reported a clear difference favouring bipolar ablation in light of PBAC < 100 at 12 months' follow‐up (RR 0.4, 95% CI 0.2 to 0.8; 104 women; 1 study). See Analysis 12.2.
12.3 Rate of satisfaction
The rate of satisfaction was variable over time. We found no evidence of significant differences between groups in rates of satisfaction after treatment at 6 months' (RR 1.08, 95% CI 0.94 to 1.24; 181 women; 2 studies; I² = 90%) or at 10 years' follow‐up, but at 12 months' follow‐up, a clear difference favoured bipolar.ablation (RR 1.14, 95% CI 1.04 to 1.26; 334 women; 4 studies; I² = 0%).
Secondary outcomes
Operative outcomes
12.4 Duration of surgery
The duration of the procedure was 2 to 19 minutes shorter with bipolar ablation than with balloon ablation in four studies (two of which recorded significant differences). See Analysis 12.4.
12.5 Operative difficulties
Only one trial reported these without significant differences (Abbott 2003).
12.6 Completion of the procedure
Only one trial reported on this without significant differences (Clark 2011).
12.7 Time taken off work and 12.8 Time to return to work
One trial reported on this but did not provide data in a format that could be entered into meta‐analysis (see Analysis 12.7 and Analysis 12.8) (Clark 2011).
12.9 Quality of life
Most quality of life scores revealed no significant differences between groups. However, women undergoing balloon ablation had significantly higher scores on the SF‐36 emotional role domain than those having bipolar ablation 5 years after treatment (MD ‐9.0 points, 95% CI ‐3.6 to ‐14.5), but not at other follow‐up times. See Analysis 12.9.
12.10 Menorrhagia outcome questionnaire
Trial results showed no evidence of a difference between groups (MD ‐0.60, 95% CI ‐3.87 to 2.67; 51 women; 1 study).
12.11 Dysmenorhoea rate (VAS score)
One trial reported this but did not provide data in a format that could be entered into meta‐analysis (see Analysis 12.11) (Abbott 2003).
12.12 Improvement in other menstrual symptoms
Results were inconsistent for rates of dysmenorrhoea and PMS: two trials found no evidence of a difference in rates of dysmenorrhoea between groups, and one trial found no evidence of a difference in PMS symptoms. However, another trial found that bipolar ablation was associated with improved dysmenorrhoea and PMS symptoms (summary figures not provided).
12.14 Complication rate and 12.15 Requirement for further surgery
One trial showed no evidence of significant differences between groups for complications or requirement for further surgery up to 10 years' follow‐up.
13. Microwave ablation (MEA) (second generation) versus balloon ablation (second generation) (Comparison 13)
One trial with 320 women compared microwave ablation versus balloon ablation (Sambrook 2009).
Primary outcomes
13.1 Bleeding
Researchers reported bleeding as rates of amenorrhoea and PBAC scores. Microwave ablation was associated with higher rates of amenorrhoea than balloon ablation at 6 months' follow‐up (RR 1.50, 95% CI 1.07 to 2.12; 277 women; 1 study). Trial results showed no clear differences between groups at 12 months' follow‐up (RR 1.10, 95% CI 0.82 to 1.47; n = 282; trials = 1) nor at 5 years' follow‐up (RR 1.03, 95% CI 0.86 to 1.23; 217 women; 1 study). See Analysis 13.1. Study authors reported PBAC scores as means with an interquartile range. No clear difference between groups was evident. See Analysis 13.2.
13.3 Rate of satisfaction
Satisfaction rates were not clearly different between groups at 12 months' (RR 1.00, 95% CI 0.88 to 1.14; 278 women; 1 study) nor at 5 years' follow‐up (RR 0.99, 95% CI 0.87 to 1.13; 217 women; 1 study). See Analysis 13.3.
Secondary outcome
13.4 Duration of surgery
Microwave ablation led to reduced operation time by almost 7 minutes compared to balloon ablation (MD ‐6.6 minutes, 95% CI ‐5.8 to ‐7.4; 314 women; 1 study). See Analysis 13.4.
13.5 Surgery difficulties causing failure
The microwave device was less likely to fail than the balloon (RR 0.09, 95% CI 0.01 to 0.70; 314 women; 1 study). Researchers did not report clear differences between difficulties causing failure such as unsuitable cavity (RR 0.75, 95% CI 0.17 to 3.30; 314 women; 1 study) or use of a non‐sterile device (RR 5.00, 95% CI 0.24 to 103.32; 314 women; 1 study). See Analysis 13.5.
13.6 Proportion given local anaesthesia
We found no evidence of clear differences between groups in the proportion of women choosing local or general anaesthesia (RR 1.01, 95% CI 0.79 to 1.31; 314 women; 1 study). See Analysis 13.6.
13.7 Proportion requiring opiate analgesia
No evidence showed clear differences between groups in the requirement for opiate analgesia (RR 0.92, 95% CI 0.83 to 1.01; 314 women; 1 study). See Analysis 13.7.
13.8 Recovery: proportion requiring overnight stay
No evidence showed clear differences between groups in the requirement for overnight stay (RR 0.66, 95% CI 0.42 to 1.04; 314 women; 1 study). See Analysis 13.8.
13.9 Quality of life
Researchers measured quality of life using EQ‐5D and SF‐12 physical and mental scores. Results provide no evidence of clear differences between groups at any time point. Test scales range from 0 to 100: results at 12 months are presented here for EQ‐5D (MD 0.02 points, 95% CI ‐0.04 to 0.08; 285 women; 1 study), SF‐12 physical (MD ‐0.70 points, 95% CI ‐2.64 to 1.24; 285 women; 1 study), and SF‐12 mental (MD ‐1.20 points, 95% CI ‐3.67 to 1.27; 285 women; 1 study); and at 5 years for EQ‐5D (MD 0.00 points, 95% CI ‐0.07 to 0.07; 217 women; 1 study), SF‐12 physical (MD ‐1.50 points, 95% CI ‐3.99 to 0.99; 217 women; 1 study), and SF‐12 mental (MD ‐0.30 points, 95% CI ‐2.90 to 2.30; 217 women; 1 study). See Analysis 13.9.
13.10 Requirement for further surgery
We found no evidence of clear differences in the requirement for further hysterectomy between groups at 12 months' (RR 0.94, 95% CI 0.31 to 2.84; 285 women; 1 study) and up to 5 years' follow‐up (RR 1.29, 95% CI 0.51 to 3.27; 217 women; 1 study). See Analysis 13.10.
Study authors provided no data for time or ability to return to normal activities or work, improvement in menstrual symptoms, complication rates, or mortality as a direct result of surgery.
14. Bipolar electrode ablation (second generation) versus hydrothermal ablation (second generation) (Comparison 14)
One study with 160 women compared bipolar electrode ablation versus hydrothermal ablation (Penninx 2010).
Primary outcomes
14.1 Bleeding
Amenorrhoea rates were significantly increased with bipolar ablation when compared to hydrothermal ablation at all time points: at 6 months' (RR 2.27, 95% CI 1.25 to 4.12; 150 women; 1 study), 12 months' (RR 1.95, 95% CI 1.21 to 3.15; 146 women; 1 study), or up to 2 to 5 years' follow‐up (RR 1.57, 95% CI 1.06 to 2.31; 139 women; 1 study). See Analysis 14.1.
14.2 Rate of satisfaction
Satisfaction rates were higher in the bipolar group than in the hydrothermal balloon group at 6 months' (RR 1.44, 95% CI 1.17 to 1.77; 150 women; 1 study), 12 months' (RR 1.11, 95% CI 1.02 to 1.21; 146 women; 1 study), and up to 2 to 5 years' follow‐up (RR 1.62, 95% CI 1.23 to 2.13; 139 women; 1 study). See Analysis 14.2.
Secondary outcomes
Operative outcomes
14.3 Duration of surgery
The duration of the procedure was significantly shorter with bipolar ablation (median (range), 11.8 minutes (5 to 40) with bipolar vs 27.8 (14 to 55) minutes with hydrothermal ablation; 156 women; 1 study). See Analysis 14.3.
14.4 Improvement in other menstrual symptoms: dysmenorrhoea
The chance of eliminating dysmenorrhoea symptoms was greater with bipolar ablation than with hydrothermal ablation at 5 years' follow‐up (RR 1.32, 95% CI 1.00 to 1.74; 139 women; 1 study), but no clear difference was evident at 12 months' follow‐up (RR 0.92, 95% CI 0.79 to 1.06; 146 women; 1 study). See Analysis 14.4.
14.5 Surgical complications: major complications
We found no evidence of clear differences between groups for major complications including the following (see Analysis 14.4).
-
Uterine perforation (RR 2.71, 95% CI 0.11 to 65.54; 156 women; 1 study).
-
Saline leakage (RR 0.13, 95% CI 0.01 to 2.46; 156 women; 1 study).
14.6 Requirement for further surgery
Risk of requiring any surgery (ablation or hysterectomy) was reduced with bipolar ablation compared to hydrothermal ablation both at 12 months' (RR 0.28, 95% CI 0.11 to 0.72; 160 women; 1 study) and up to 5 years' follow‐up (RR 0.44, 95% CI 0.23 to 0.83; 136 women; 1 study). The difference is not clear when the risk of requiring a hysterectomy was compared at 12 months' (RR 0.42, 95% CI 0.14 to 1.32; 160 women; 1 study) and up to 2 to 5 years' follow‐up (RR 0.63, 95% CI 0.29 to 1.38; 136 women; 1 study). See Analysis 14.6.
Researchers provided no data for operative difficulties, proportion given general versus local anaesthesia, length of hospital stay, time or ability to return to normal activities or work, women's perceived change in quality of life, or mortality as a direct result of surgery.
15. Ablative curettage versus overcurettage (Comparison 15)
One study with 100 women compared ablative curettage versus overcurettage (Thabet 2010).
Primary outcomes
15.1 Bleeding
Researchers measured bleeding as amenorrhoea or eumenorrhoea at 3 years' follow‐up. Ablative curettage resulted in significantly higher rates of amenorrhoea compared with overcurettage (RR 4.50, 95% CI 2.33 to 8.69; 100 women; 1 study) and higher rates of amenorrhoea and normal menses combined (RR 1.9, 95% CI 1.3 to 2.7; 100 women; 1 study). See Analysis 15.1.
Secondary outcomes
Operative outcomes
15.2 Surgery difficulties
Failure of the procedure was less likely with ablative curettage than with overcurettage (RR 0.29, 95% CI 0.12 to 0.74; 100 women; 1 study). See Analysis 15.2.
15.3 Recovery hospital stay
Overcurettage was associated with a significantly reduced hospital stay in comparison to ablative curettage (MD 1.6 days, 95% CI 1.2 to 2.0; 100 women; 1 study). See Analysis 15.3;
15.4 Complication rate: major complications
Evidence showed no clear difference in the rate of perforation between groups (RR 0.14, 95% CI 0.01 to 2.70; 100 women; 1 study).
15.5 Complication rate: minor complications
Bleeding complications were significantly less likely with ablative curettage than with overcurettage (RR 0.21, 95% CI 0.07 to 0.70; 100 women; 1 study); study authors provided no evidence of clear differences in the rate of infection or vaginal discharge (leucorrhoea) between groups (RR 0.80, 95% CI 0.23 to 2.81; 100 women; 1 study). See Analysis 15.4.
15.6 Requirement for further surgery
Trial results showed no evidence of clear differences between groups in the requirement for hysterectomy up to 3 years' follow‐up (RR 0.42, 95% CI 0.16 to 1.10; 100 women; 1 study). See Analysis 15.6.
Study authors provided no data on rate of satisfaction, duration of surgery, proportion given general versus local anaesthesia, time or ability to return to normal activities or work, women's perceived change in quality of life, improvement in menstrual symptoms, or mortality as a direct result of surgery.
16. Microwave ablation (second generation) versus bipolar radiofrequency ablation (second generation) (Comparison 16)
One trial with a total of 66 women compared microwave ablation versus bipolar radiofrequency ablation (Athanatos 2015).
Primary outcomes
16.1 and 16.2 Bleeding
Amenorrhoea rates were increased in the microwave ablation group when compared to the bipolar radiofrequency ablation group at 3 months (RR 0.19, 95% CI 0.07 to 0.54; 66 women; 1 study) and at 12 months (RR 0.10, 95% CI 0.03 to 0.32; 66 women; 1 study). See Analysis 16.1. The PBAC at 12 months showed a clear difference favouring the bipolar group (RR ‐57.42, 95%CI ‐108.41 to ‐6.43; 66 women; 1 study). See Analysis 16.2.
16.3 Rate of satisfaction
Researchers measured rate of satisfaction as satisfaction with treatment and as improvement in everyday life. No evidence showed a clear difference at 3 months (RR 0.97, 95% CI 0.89 to 1.05; 66 women; 1 study); results indicated that microwave ablation may decrease the rate of satisfaction compared with bipolar frequency ablation at 12 months (RR 0.85, 95% CI 0.73 to 0.99; 66 women; 1 study). See Analysis 16.3. For improvement in everyday life, study authors did not provide clear evidence of differences in both groups at 12 months' follow‐up (RR 0.91, 95% CI 0.81 to 1.03; 66 women; 1 study).
Secondary outcomes
Operative outcomes
16.4 Duration of surgery
Surgical duration was measured in seconds, so even though results show a clear difference (MD 9.80, 95% CI 2.63 to 16.97; 66 women; 1 study), both procedures took less than 2 minutes to perform. See Analysis 16.4.
16.5 Improvement in other menstrual symptoms: dysmenorrhoea
The dysmenorrhoea rate did not show clear differences between groups at 3 months' (RR 2.00, 95% CI 0.39 to 10.18; 66 women; 1 study) nor at 12 months' (RR 4.00, 95% CI 0.92 to 17.44; 66 women; 1 study) follow‐up. See Analysis 16.5.
16.6 Complication rate: major and minor complications
Researchers reported no complications in either group. See Analysis 16.6.
The risk of requiring post‐procedure analgesia was significantly higher in the microwave endometrial ablation group (RR 25.98, 95% CI 1.44 to 468.00). See Analysis 16.6.
16.7 Requirement for further surgery
Trial results did show a clear difference between groups in the requirement for hysterectomy at 12 months' follow‐up (RR 5.00, 95% CI 0.25 to 100.32; 66 women; 1 study). See Analysis 16.7.
Study authors provided no data for operative difficulties, proportion given general versus local anaesthesia, length of hospital stay, time or ability to return to normal activities or work, women's perceived change in quality of life, or mortality as a direct result of surgery.
17. Bipolar (Minerva) (second generation) versus rollerball ablation (first generation) (Comparison 17)
One study with 153 women compared bipolar an endometrial ablation system (Minerva) versus rollerball ablation (Laberge 2016).
Primary outcome
17.1 Bleeding
Researchers reported using haematin alkaline < 80 mL/cycle at 12 months and rate of amenorrhoea at 12 months as dichotomous outcomes. Results for women having haematin alkaline less than 80 mL/cycle at 12 months did not show a clear difference between groups (RR 1.16, 95% CI 1.00 to 1.34), even though data showed a trend towards bipolar. The amenorrhoea rate at 12 months was clearly higher in the bipolar group (RR 1.46, 95% CI 1.08 to 1.98; 153 women; 1 study). See Analysis 17.1.
17.2 Rate of satisfaction
The rate of satisfaction did not show clear differences between groups at 12 months' follow‐up. See Analysis 17.2.
Secondary outcomes
Operative outcomes
17.3 Duration of surgery
The duration of the procedure was significantly shorter in the bipolar group than in the rollerball group (MD ‐14.10 minutes, 95% CI ‐15.94 to ‐12.26; 153 women; 1 study). See Analysis 17.3.
17.4 Improvement in other menstrual symptoms: dysmenorrhoea
The rate of improvement in dysmenorrhoea did not show clear differences between groups (RR 1.02, 95% CI 0.71 to 1.48; 153 women; 1 study). See Analysis 17.4.
17.5 Improvement in other menstrual symptoms: PMS
The rate of improvement in PMS did not show clear differences between groups (RR 1.25, 95% CI 0.87 to 1.80; 153 women; 1 study). See Analysis 17.5.
17.6 Complication rate: major complications
No evidence showed clear differences between groups in major complications such as the following (see Analysis 17.6).
-
Endometritis or endomyometritis (RR 0.25, 95% CI 0.02 to 2.69; 153 women; 1 study).
-
Pelvic inflammatory disease (RR 1.51, 95% CI 0.06 to 36.54; 153 women; 1 study).
-
Haematometra (RR 1.51, 95% CI 0.06 to 36.54; 153 women; 1 study).
17.7 Complication rate: minor complications
Studies have provided no evidence of clear differences between groups for minor complications such as the following (see Analysis 17.7).
-
Intraoperative skin rash and/or itching or burning sensation (RR 1.51, 95% CI 0.06 to 36.54; 153 women; 1 study).
-
Bleeding or spotting first 24 hours (RR 0.17, 95% CI 0.01 to 4.06; 153 women; 1 study).
-
Nausea or vomiting first 24 hours (RR 0.17, 95% CI 0.01 to 4.06; 153 women; 1 study).
-
Weakness, fatigue, sleepiness, lack of concentration, dizziness first 24 hours (RR 1.51, 95% CI 0.06 to 36.54; 153 women; 1 study).
-
Backache first 24 hours (RR 1.51, 95% CI 0.06 to 36.54; 153 women; 1 study).
-
Fever first 24 hours (RR 1.51, 95% CI 0.06 to 36.54; 153 women; 1 study).
-
Abdominal pain or bloating up to 2 weeks (RR 1.50, 95% CI 0.16 to 14.06; 153 women; 1 study).
-
Abdominal pain and/or bloating for more than 2 weeks (RR 0.17, 95% CI 0.01 to 4.06 ; 153 women; 1 study)
-
Pelvic pain for up to 2 weeks (RR 1.51, 95% CI 0.06 to 36.54; 153 women; 1 study).
-
Vaginal discharge and/or unpleasant vaginal smell or other abnormal sensation for up to 2 weeks (RR 1.51, 95% CI 0.06 to 36.54; 153 women; 1 study).
-
Weakness, fatigue, sleepiness, lack of concentration, dizziness for up to 2 weeks (RR 0.50, 95% CI 0.03 to 7.83; 153 women; 1 study).
-
Constipation for up to 2 weeks (RR 0.17, 95% CI 0.01 to 4.06; 153 women; 1 study).
-
Skin rash and/or itching or burning sensation for up to 2 weeks (RR 0.50, 95% CI 0.03 to 7.83; 153 women; 1 study).
-
Dysmenorrhea for up to 1 year (RR 0.17, 95% CI 0.01 to 4.06; 153 women; 1 study).
17.8 Requirement for further surgery
Trial results showed no clear evidence of differences between groups in the rate of hysterectomy up to 1 year (RR 0.33, 95% CI 0.06 to 1.93; 153 women; 1 study). See Analysis 17.8.
Study authors provided no data for duration of surgery, operative difficulties, proportion given general versus local anaesthesia, length of hospital stay, time or ability to return to normal activities or work, women's perceived change in quality of life, or mortality as a direct result of surgery.
18 Second‐generation ablative techniques versus first‐generation ablation techniques (overall)
Thirteen studies with a total of 2368 women compared first‐ versus second‐generation ablation techniques (Brun 2006; Cooper 1999; Cooper 2002; Cooper 2004; Corson 2000; Corson 2001; Duleba 2003; Hawe 2003; Laberge 2016; Meyer 1998; Perino 2004; Romer 1998; van Zon‐Rabelink 2003).
Primary outcomes
18.1 Bleeding
We found no evidence of clear differences in bleeding parameters such as the following (see Analysis 18.1).
-
Amenorrhoea at 6 months' follow‐up (RR 1.27, 95% CI 0.91 to 1.77; 49 women; 1 study).
-
Amenorrhoea at 2 years' follow‐up (RR 0.97, 95% CI 0.72 to 1.30; 701 women; 3 studies; I² = 51%).
-
Amenorrhoea at 2 to 5 years' follow‐up (RR 1.16, 95% CI 0.78 to 1.72; 672 women; 4 studies; I² = 80%).
-
Amenorrhoea at up to 10 years' follow‐up (RR 0.94, 95% CI 0.83 to 1.05; 189 women; 1 study).
-
PBAC < 75 or acceptable improvement at 12 months' follow‐up (RR 1.03, 95% CI 0.98 to 1.09; 1282 women; 5 studies; I² = 0%).
-
PBAC < 75 or acceptable improvement at 2 to 5 years' follow‐up (RR 1.12, 95% CI 0.97 to 1.28; 236 women; 1 study).
-
PBAC < 75 or acceptable improvement at up to 10 years' follow‐up (RR 1.11, 95% CI 0.95 to 1.30; 189 women; 1 study).
18.2 Amenorrhoea at 1 year follow‐up
Trials provided no evidence of clear differences in the rate of amenorrhoea between groups at 12 months' follow‐up (RR 0.99, 95% CI 0.78 to 1.27; 2145 women; 12 studies; I² = 77%). See Analysis 18.2. See the funnel plot for this comparison in Figure 4.
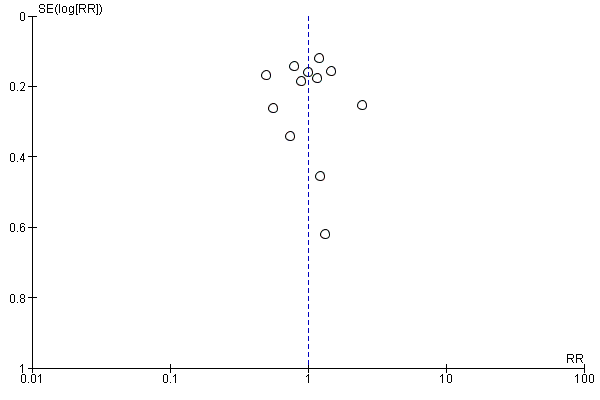
Funnel plot of comparison: 18 Overall analyses: second‐generation endometrial ablation versus first‐generation endometrial ablation, outcome: 18.2 Bleeding ‐ amenorrhoea at 12 months (final plot).
18.3 Rate of satisfaction
We found no evidence of clear differences in satisfaction rates up to 10 years' follow‐up, including the following (see Analysis 18.3).
-
Satisfaction rate at 6 months' follow‐up (RR 1.06, 95% CI 0.93 to 1.20; 50 women; 1 study).
-
Satisfaction rate at 2 years' follow‐up (RR 1.09, 95% CI 0.99 to 1.21; 802 women; 5 studies; I² = 52%).
-
Satisfaction rate at 2 to 5 years' follow‐up (RR 1.02, 95% CI 0.93 to 1.13; 672 women; 4 studies; I² = 81%).
-
Satisfaction rate at 10 years' follow‐up (RR 1.11, 95% CI 0.95 to 1.30; 189 women; 1 study).
18.4 Satisfaction rate at 12 months' follow‐up
Study results showed no evidence of clear differences in rates of amenorrhoea between groups at 12 months' follow‐up (RR 1.01, 95% CI 0.98 to 1.04; 1750 women; 11 studies; I² = 36%). See Analysis 18.4. See the funnel plot for this comparison in Figure 5.

Funnel plot of comparison: 18 Overall analyses: second‐generation endometrial ablation versus first‐generation endometrial ablation, outcome: 18.4 Satisfaction rate at 1 year follow‐up (final plot).
Secondary outcomes
Operative outcomes
18.5 Duration of surgery
The mean difference in average surgical time between first‐ and second‐generation techniques was 13 minutes, ranging between 17 and 10 minutes. Heterogeneity was very high (94%), so we could not pool the analysis; we found that removing studies with high risk of allocation bias did not make any difference. See Analysis 18.5.
18.6 Operative difficulties
Risk of equipment failure was greater with second‐generation devices (RR 4.26, 95% CI 1.46 to 12.43; 384 women; 3 studies; I² = 0%). See Analysis 18.6. It is important to mention here that only 3 of 10 studies comparing first‐ versus second‐generation ablation techniques reported equipment failure. Lack of reporting of treatment failure does not necessarily mean that it did not happen. The theory that treatment failure could be associated with the beginning of the technique does not explain it; only one of the remaining seven studies is newer than the ones reporting equipment failure. We found no evidence of clear differences between groups in terms of abandoning the procedure (RR 1.18, 95% CI 0.38 to 3.67; 629 women; 3 studies; I² = 0%).
18.7 Proportion given local anaesthesia
The chance that local rather than general anaesthesia would be used was greater with second‐generation devices (RR 2.78, 95% CI 1.76 to 4.40; I² = 85%). This must be carefully interpreted because heterogeneity was high. See Analysis 18.7.
18.8 Inability to work
We noted no evidence of a clear difference between groups in inability to work (RR 0.84, 95% CI 0.30 to 2.30; 279 women; 2 studies; I² = 20%). See Analysis 18.8.
18.9 Complication rate: major complications
Regarding major complications, women undergoing second‐generation ablation procedures, when compared to the group having first‐generation procedures, were less likely to have the following major complications.
-
Cervical lacerations (RR 0.21, 95% CI 0.07 to 0.61; 1583 women; 7 studies; I² = 0%).
-
Haematometra (RR 0.34, 95% CI 0.12 to 0.95; 1193 women; 5 studies; I² = 0%).
-
Fluid overload (RR 0.16, 95% CI 0.03 to 0.94; 588 women; 3 studies; I² = 0%).
We found no clear evidence of differences between groups in other major complications such as the following (see Analysis 18.9).
-
Perforation (RR 0.32, 95% CI 0.10 to 1.01; 1885 women; 8 studies; I² = 0%).
-
Endometritis (RR 1.19, 95% CI 0.33 to 4.37; 1095 women; 4 studies; I² = 25%).
-
Myometritis (RR 0.29, 95% CI 0.01 to 6.93; 267 women; 1 study).
-
Cervical stenosis (RR 1.50, 95% CI 0.06 to 36.52; 322 women; 1 study).
-
Pelvic abscess (RR 0.17, 95% CI 0.01 to 4.19; 265 women; 1 study).
-
Pelvic inflammatory disease (RR 1.18, 95% CI 0.18 to 7.98; 418 women; 2 studies; I² = 0%).
-
Blood transfusion (RR 5.24, 95% CI 0.26 to 105.97; 82 women; 1 study).
18.10 Complication rate: minor complications
Regarding minor complications, women undergoing first‐generation ablation procedures, when compared to those having second‐generation procedures, were less likely to have the following minor complications.
-
Nausea and vomiting (RR 2.01, 95% CI 1.40 to 2.88; 997 women; 4 studies; I² = 0%).
-
Uterine cramping (RR 1.21, 95% CI 1.02 to 1.45; 601 women; 2 studies; I² = 0%).
Trial results provided no clear evidence of differences between groups for other minor complications such as the following (see Analysis 18.10).
-
Urinary tract infection (RR 0.88, 95% CI 0.45 to 1.73; 1834 women; 4 studies; I² = 0%).
-
Fever (RR 0.98, 95% CI 0.22 to 4.26; 671 women; 3 studies; I² = 0%).
-
Haemorrhage (RR 0.64, 95% CI 0.26 to 1.58; 889 women; 4 studies; I² = 4%).
-
Muscle fasciculation (RR 2.57, 95% CI 0.11 to 62.41; 267 women; 1 study).
-
External burns (first degree) (RR 2.32, 95% CI 0.11 to 47.89; 269 women; 1 study).
-
Hydrosalpinx (RR 0.30, 95% CI 0.01 to 7.39; 239 women; 1 study).
-
Severe pelvic pain (RR 0.95, 95% CI 0.36 to 2.48; OR 0.95, 95% CI 0.35 to 2.60; 683 women; 3 studies; I² = 30%).
18.11 Requirement for further surgery
We found no evidence of significant differences in the requirement for any additional surgery (hysterectomy or ablation) or hysterectomy in both groups up to 5 years' follow‐up, including the following (see Analysis 18.11).
-
Requirement for any additional surgery (hysterectomy or ablation) at 1 year follow‐up (RR 0.72, 95% CI 0.41 to 1.26; 935 women; 6 studies; I² = 0%).
-
Requirement for any additional surgery (hysterectomy or ablation) at 2 years' follow‐up (RR 0.83, 95% CI 0.52 to 1.32; 988 women; 5 studies; I² = 13%).
-
Requirement for any additional surgery (hysterectomy or ablation) at 2 to 5 years' follow‐up (RR 0.95, 95% CI 0.72 to 1.26; 647 women; 3 studies; I² = 0%).
-
Requirement for hysterectomy at 1 year follow‐up (RR 0.66, 95% CI 0.35 to 1.21; (RR 0.66, 95% CI 0.35 to 1.21; 925 women ; 5 studies; I2 = 0%).
-
Requirement for hysterectomy at 2 years' follow‐up (RR 0.86, 95% CI 0.52 to 1.42; 920 women; 4 studies; I² = 0%).
-
Requirement for hysterectomy at 2 to 5 years' follow‐up (RR 0.85, 95% CI 0.59 to 1.22; 758 women; 4 studies; I² = 14%).
At 10 years' follow‐up, women undergoing second‐generation techniques have reduced possibilities of undergoing any further surgery (ablation or hysterectomy) (RR 0.57, 95% CI 0.37 to 0.87; 189 women; 1 study) or a subsequent hysterectomy (RR 0.60, 95% CI 0.38 to 0.96; 189 women; 1 study). These results must be interpreted cautiously; they reflect only one trial, in which more than 25% of participants were lost to follow‐up. Study authors also reported 9% requiring further hysteroscopies with the second‐generation technique but did not provide further details.
The main outcomes for this overall comparison can be viewed in summary of findings Table for the main comparison.
Heterogeneity
1. Specific types of endometrial resection or ablation
Most of the forest plots comparing specific types of endometrial ablation showed comparisons between groups in individual studies or pooled two or four studies at most, and they provided little evidence of statistical heterogeneity. However, we found substantial statistical heterogeneity (I² > 50%) for the following forest plots.
Comparison 1.4 (Analysis 1.4): duration of operation (laser vs TCRE).
Comparison 7.5 (Analysis 7.5): duration of operation (electrode ablation vs TCRE + rollerball).
Comparison 9.6 (Analysis 9.6): duration of operation (balloon vs rollerball).
Comparison 9.12 (Analysis 9.12): requirement for further surgery (2 years' follow‐up) (balloon vs rollerball).
Comparison 12.3 (Analysis 12.3): satisfaction rate (6 months' follow‐up) (bipolar radiofrequency ablation vs balloon).
Comparison 12.15 (Analysis 12.15): requirement for further surgery (bipolar radiofrequency vs balloon).
Duration of operation was affected by numerous confounding factors such as expertise of individual surgeons, hospital type and procedures, and differences between groups of women. For the comparison laser versus TCRE, the Bhattacharya study did not include total time spent in theatre, and the McClure study recorded induction and reversal of anaesthesia in the estimation of operation time, which resulted in much larger estimates. In this latter trial, temporary laser malfunction prolonged two laser cases to 240 minutes. For the comparison electrode ablation versus TCRE + rollerball, differences between studies were likely to be explained by the two different systems used: the Corson study used the Vesta balloon ablation, and the Cooper study used Novasure. In the comparison balloon versus rollerball, all three pooled studies used the Thermachoice balloon system. The operation time recorded for rollerball ablation was similar in the three trials, but times differed between studies for balloon ablation. The Meyer study provided no preoperative treatment to thin the endometrium, whereas the other two studies provided 2 months of gonadotropin‐releasing hormone (GnRH) agonist pretreatment. Other factors such as cavity length were correlated with operation time, and it is not clear whether these were similarly distributed between participants in the three trials. Another major confounding factor was the ability to use local rather than general anaesthesia, which was more likely in trials comparing second‐generation versus first‐generation ablation methods.
Satisfaction is also likely to have varied because of different methods of measurement used. In the comparison bipolar radiofrequency ablation versus balloon, satisfaction rates at 6 months in the small Abbott trial may have been related to the technical failure rate for the Novasure procedure, but rates at 12 months' follow‐up were similar and were not significantly different.
Significant heterogeneity was evident for the outcome requirement for further surgery in the comparisons of balloon versus rollerball and bipolar electrode ablation versus balloon. Different results in the two pooled trials for either comparison could not be explained by examining their characteristics. Neither trial reported a significant difference in outcomes by ablation technique.
2. Overall analyses comparing first‐ and second‐generation techniques
Substantial heterogeneity was evident for many outcomes when researchers compared first‐generation procedures versus second‐generation procedures (Comparison 18), in particular, rate of amenorrhoea, duration of operation, and proportion given local as opposed to general anaesthesia. The I² value for the outcome amenorrhoea at 1 year after surgery was 77%, at 2 years 51%, and at 2 to 5 years 80%. Rates of amenorrhoea ranged widely in the included trials, and study authors reported no statistical differences between groups. When we compared estimates calculated with the fixed‐effect model versus estimates calculated with a random‐effects model, we found that estimates did not change markedly, but confidence intervals (CIs) were wider with the latter approach. Thus no evidence shows that amenorrhoea rates varied according to whether first‐ or second‐generation techniques were used to ablate the endometrium.
Forest plots for the outcomes duration of surgery and local versus general anaesthesia also indicated substantial heterogeneity. Given that these two categories were very broad and included several different ablative techniques, we expected to find heterogeneity, and we used a random‐effects model to display results. As previously explained, apart from differences between techniques, duration of surgery was likely to be affected by extraneous factors such as skill and expertise of the surgeon, hospital policy, and the operating environment. However, each of the included trials reported separately that second‐generation techniques took significantly less time to perform than first‐generation techniques, regardless of the procedures compared. A random‐effects model approach indicated significantly less time required for second‐generation procedures; each of the trials individually showed a statistically significant difference. The other comparison ‐ proportion of women given local as opposed to general anaesthesia ‐ also showed highly significant heterogeneity. For all trials in the meta‐analysis, the proportions of women undergoing ablation with first‐generation techniques under local anaesthesia (either TCRE + rollerball or rollerball alone) ranged from 8% to 23%, and the proportion undergoing second‐generation ablation under local anaesthesia (Vesta, HTA, Novasure, cryoablation, or microwave) ranged from 45% to 86%. All trials separately reported large significant differences between first‐ and second‐generation techniques. A random‐effects model confirmed these differences in pooled results.
To sum up, random‐effects model analyses confirmed the following.
-
Evidence showing no difference in rates of amenorrhoea when first‐generation techniques were compared with second‐generation techniques.
-
Evidence suggesting that duration of surgery with second‐generation techniques overall was less than with first‐generation techniques (average of 14 minutes less); however, due to high levels of heterogeneity, we were unable to pool the data for meta‐analysis.
-
Women undergoing ablation with second‐generation techniques were more likely to be given local anaesthesia than those undergoing ablation with first‐generation techniques.
Sensitivity analyses
We performed sensitivity analyses only on comparisons for which five or more trials were pooled, specifically for the comparison of rates of satisfaction and amenorrhoea at 1 year follow‐up between first‐ and second‐generation ablation. We found no significant differences reported between randomised groups, and planned sensitivity analyses did not substantially change the results of included trials, although heterogeneity was reduced.
Discussion
Summary of main results
See summary of findings Table for the main comparison.
This review has assessed a wide range of efficacy, satisfaction, and safety outcomes related to different techniques for ablation or resection of the endometrium for women with heavy menstrual bleeding.
Overall comparison of first‐generation versus second‐generation techniques
Some types of intraoperative and postoperative complications such as fluid overload, cervical lacerations, and haematometra were more common with first‐generation ablation; other types of complications, nausea and vomiting, and uterine cramping and pain were more common with second‐generation techniques. No clear evidence shows differences in perforation rates between first‐ and second‐generation techniques. Concerns about these 'blind' methods leading to bowel injuries from undetected uterine perforation did not seem to be confirmed in published studies. However, many anecdotal examples indicate that such events can occur, and great care must be taken to minimise the risk of such potentially serious complications.
Trial results showed no differences in rates of re‐intervention ‐ either repeat ablation or hysterectomy or both ‐ between first‐ and second‐generation ablation up to 5 years' follow‐up. Only one small trial reported a clear difference at 10 years, but this should be interpreted cautiously because if repeated hysteroscopy is considered a surgical procedure, the difference is not significant, and no report provided the number of women transitioned through menopause. A recurrent comment about newer techniques that rely on 'devices' inserted into the uterine cavity to destroy the endometrium involved the incidence of equipment failure. This may represent expected 'teething problems' associated with new equipment. However, given that the older methods are extremely simple (a loop, laser, or diathermy to destroy the endometrium below it) and that newer techniques are potentially complex (microwaves, bags of fluid, etc.), the potential remains for mechanical breakdown to occur. In addition, considerable experience in intrauterine cavity assessment and manipulation is required for safe use any of these devices.
Comparison of different types of first‐generation ablation techniques
First‐generation ablation techniques have been acknowledged traditionally as the 'gold standard' by which other, newer procedures were judged (Papadopoulos 2007). Improvement in menstrual bleeding and satisfaction seems to be similar between first‐generation techniques. The complication profile between techniques is slightly different; for example, fluid overload was more likely with laser ablation than with transcervical resection of the endometrium (TCRE) and was more likely with TCRE than with vaporising electrode ablation. However, it is likely that operator safety is a much more important arbiter of patient safety than the instrument itself. Duration of surgery was longer with the laser than with TCRE and was longer with TCRE than with vaporising electrode ablation. Equipment failure was more likely with laser ablation than with TCRE, and the procedure was more difficult with TCRE than with vaporising electrode ablation.
Comparison of different types of second‐generation ablation techniques
Bipolar radiofrequency ablation was associated with significantly higher rates of amenorrhoea than was balloon ablation up to 12 months' follow‐up, but researchers report no significant differences at 2, 5, and 10 years' follow‐up. In accordance with the amenorrhoea report, the satisfaction rate is higher at 12 months for bipolar radiofrequency ablation but trials show no significant differences at 6 months' or 10 years' follow‐up. Surgery was shorter with bipolar ablation, and premenstrual syndrome (PMS) scores were reduced. No evidence shows that bipolar radiofrequency ablation resulted in lower rates of further surgery for heavy menstrual bleeding when compared to balloon ablation.
Bipolar ablation also increased rates of amenorrhoea and satisfaction when compared with hydrothermal ablation. Procedure time was shorter with bipolar ablation and women were less likely to require additional surgery at later follow‐up when compared to hydrothermal ablation. Amenorrhoea rates appeared to be increased with microwave when compared with balloon, but trials reported no differences in Pictorial Blood Assessment Chart (PBAC) scores or satisfaction. Operation time was also reduced with microwave ablation.
Comparison of different types of first‐generation and second‐generation techniques
With reference to comparisons of different types of second‐generation techniques versus first‐generation techniques, thermal laser was more effective than TCRE in reducing blood loss (as measured by rates of amenorrhoea), but research shows no differences in patient satisfaction between approaches (using the same measurement tools). Although rollerball ablation was more likely to result in amenorrhoea when compared to cryoablation, trial results showed no difference in patient satisfaction between approaches. Patients appeared to be more satisfied with microwave than with TCRE at 2 and 5 years after surgery, but these findings were not significant at 1 and 10 years' follow‐up. With regards to secondary outcomes, duration of surgery was consistently shorter with second‐generation ablation, and procedures were more likely to be performed with the patient under local anaesthesia. Post‐surgical pain was also more likely with some types of second‐generation techniques such as thermal laser, balloon, and Hydro ThermAblator (HTA), but not all trials measured this outcome. Data show no significant differences between procedures in terms of improvement in dysmenorrhoea.
Overall completeness and applicability of evidence
The diagnosis of HMB is based on subjective complaints and its impact on quality of life ‐ not on objective measures of blood loss (Munroe 2006; NICE 2018). However, many women with heavy menstrual bleeding (HMB) referred from primary to tertiary care do not describe HMB when directly questioned, suggesting a tendency for broad description of menstrual characteristics to be reframed as excessive bleeding at referral and during management (Warner 2001). This is likely to result in women receiving inappropriate care and will influence the actual and perceived efficacy of treatment modalities for HMB.
Published literature on endometrial destruction techniques for HMB covers a wide range of surgical methods and uses a variety of outcome measures to assess treatment success, making clear comparisons between studies difficult. Participant groups showed varied and often potentially important clinical factors such as the presence of uterine fibroids or a perimenopausal state, which were not mentioned in the inclusion or exclusion criteria. This is particularly important with longer follow‐up studies. Current clinical approaches to HMB advise that medical therapy should be offered in the first instance, and it would be unusual in normal practice to advise endometrial resection or ablation without trying any medical therapies. Indeed, medical treatment with the levonorgestrel‐releasing intrauterine system (Mirena, Schering) reduces menstrual blood loss (MBL) by 94% at 3 months (Irvine 1998), and it is equally effective as thermal balloon ablation (de Souza 2010; Shaw 2007), rollerball endometrial ablation (Ergun 2012), and endometrial ablation. Surgical approaches to resect or ablate the endometrium are generally second‐line after medical therapies. Fourteen published studies focussed on women with failed medical management of HMB.
Published studies show wide variation in the outcome criteria used to assess the efficacy of endometrial ablation and resection techniques. No studies have used women's perceptions of HMB as an inclusion criterion nor women's perception of improvement as an outcome, even though this is the main diagnostic criterion. Several studies used the PBAC (Higham 1990), but entry and success criteria for PBAC score varied widely between studies. It is important to identify core outcomes for future trials on treatments for HMB for better comparisons. The COMET initiative (Core Outcome Measures in Effectiveness Trials) is working towards this objective; it is hoped that this initiative will help to improve study outcomes for HMB (COMET 2018).
Quality of the evidence
The evidence base on which this review is based was of variable quality. In particular, few studies were blinded, and for most comparisons between individual techniques, a limited number of studies provided data. Lack of blinding is likely to influence more subjective outcomes such as satisfaction rates, so findings of these types of outcomes should be viewed with caution.
We identified substantial heterogeneity in some outcomes in the overall comparison between first‐ and second‐generation techniques, and we have downgraded the quality of evidence to reflect the uncertainty around summary effect estimates. See summary of findings Table for the main comparison.
Potential biases in the review process
A comprehensive search for relevant studies, together with duplicate and independent study selection, data extraction, and quality assessment of studies, has minimised the chance of potential bias in the review process.
Agreements and disagreements with other studies or reviews
It is surprising that although numerous randomised controlled trials (RCTs) and observational studies have examined specific types of endometrial ablation techniques, few systematic reviews have made overall comparisons of specific endometrial ablation techniques for reduction of HMB. Numerous narrative reviews have been published, together with comprehensive audits for first‐generation techniques. Upon comparing first‐generation methods of endometrial ablation versus resection, the MISTLETOE study concluded that methods produced similar outcomes in terms of bleeding and participant satisfaction, but that resection methods are associated with significantly more complications, suggesting that ablation should be used for all women with a non‐fibroid uterus (Overton 1997).
Systematic reviews ‐ one with individual participant data ‐ have not been able to determine major differences between first‐ and second‐generation techniques in terms of effectiveness or satisfaction with treatment (Garside 2005; Middleton 2010). However, Middleton has confirmed the findings of this review that second‐generation techniques are faster, local anaesthesia is more likely to be used, and some complications are less frequent. The suggestion in this review that additional surgery may be less likely with second‐generation techniques at longer follow‐up (10 years) is based on only one trial and needs confirmation from further research. On the other hand, at 2 to 5 years' follow‐up, researchers found no significant difference in the requirement for further surgery ‐ hysterectomy or ablation (risk ratio (RR) 0.95, 95% confidence interval (CI) 0.72 to 1.26; 647 women; 3 studies) or only hysterectomy (RR 0.85, 95% CI 0.59 to 1.22; 758 women; 4 studies). According to a Scottish review of 14,078 women with endometrial ablation having a subsequent hysterectomy, the median time interval between surgeries was 15 months (range 8 to 32 months) (Cooper 2011).
Among second‐generation techniques, the most studied have been Novasure, balloon, and microwave ablation (NHS 2011). A recent network meta‐analysis reported that bipolar radiofrequency and microwave ablation resulted in higher rates of amenorrhoea than thermal balloon ablation at 12 months after treatment (Daniels 2012), but no evidence shows a convincing difference between the three techniques in terms of satisfaction rates or the number of women still experiencing heavy bleeding. Researchers did not assess other outcomes. However, lack of a consistent measure of effectiveness has made it difficult to adequately compare techniques and reach conclusions on the technique of choice. Other study authors have suggested that there might be commercial resistance to comparing devices, given the likely effect on the market share for the inferior treatment (McGurgan 2007). It has also been suggested that a potential limitation of second‐generation devices involves restrictions on size and configuration of the endometrial cavity that may prevent general application of any device to the HMB population (Munroe 2006). Many of the included studies that evaluated these devices in this review applied fairly strict inclusion criteria, limiting the applicability of results to women with large or distorted uteri. Thus, not all women with HMB may be candidates for second‐generation ablation, and it has been suggested that gynaecologists should retain their skills in hysteroscopic surgery for certain types of intrauterine pathology (Papadopoulos 2007).
An additional issue is the role of patient preferences in decision‐making regarding treatments for HBS. A recent review suggested that reaching a decision on a 'one size fits all' approach may be elusive, and that eliciting patient preferences, based on the evidence, is required to reach the decision on the 'best' approach (Roberts 2011).

Study flow diagram.
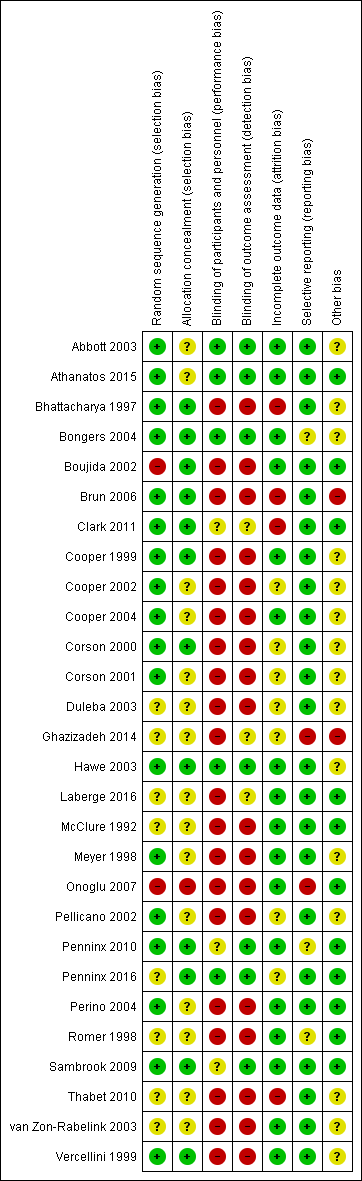
Methodological quality summary: review authors' judgements about each methodological quality item for each included study.

Risk of bias graph: review authors' judgements about each risk of bias item presented as percentages across all included studies.

Funnel plot of comparison: 18 Overall analyses: second‐generation endometrial ablation versus first‐generation endometrial ablation, outcome: 18.2 Bleeding ‐ amenorrhoea at 12 months (final plot).

Funnel plot of comparison: 18 Overall analyses: second‐generation endometrial ablation versus first‐generation endometrial ablation, outcome: 18.4 Satisfaction rate at 1 year follow‐up (final plot).

Comparison 1 Laser ablation (first generation) versus transcervical resection of the endometrium (TCRE) (first generation), Outcome 1 Bleeding ‐ blood loss (mL) at 6 months.
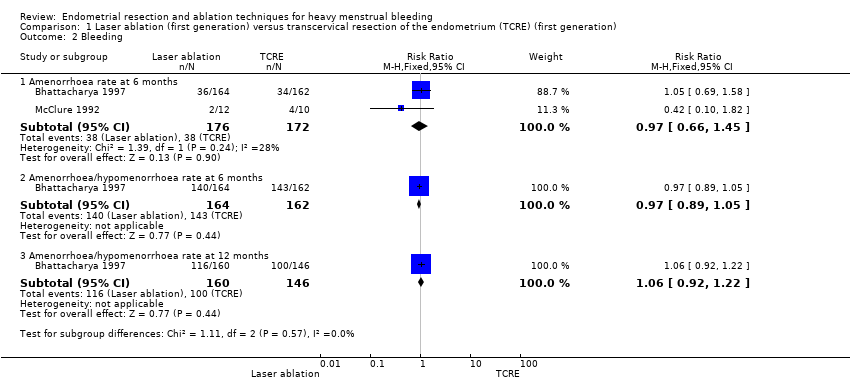
Comparison 1 Laser ablation (first generation) versus transcervical resection of the endometrium (TCRE) (first generation), Outcome 2 Bleeding.

Comparison 1 Laser ablation (first generation) versus transcervical resection of the endometrium (TCRE) (first generation), Outcome 3 Rate of satisfaction at 12 months (very/moderately).

Comparison 1 Laser ablation (first generation) versus transcervical resection of the endometrium (TCRE) (first generation), Outcome 4 Duration of operation (minutes).
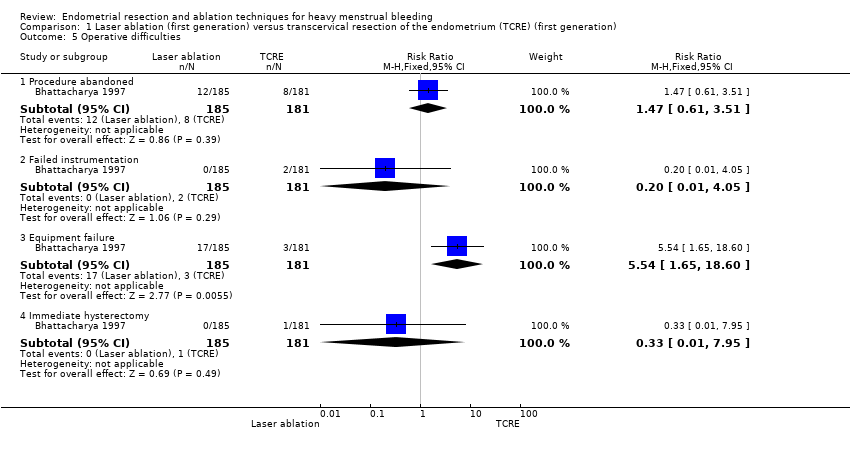
Comparison 1 Laser ablation (first generation) versus transcervical resection of the endometrium (TCRE) (first generation), Outcome 5 Operative difficulties.

Comparison 1 Laser ablation (first generation) versus transcervical resection of the endometrium (TCRE) (first generation), Outcome 6 Good general health.

Comparison 1 Laser ablation (first generation) versus transcervical resection of the endometrium (TCRE) (first generation), Outcome 7 Improvement in menstrual symptoms.

Comparison 1 Laser ablation (first generation) versus transcervical resection of the endometrium (TCRE) (first generation), Outcome 8 Complication rate: major complications.

Comparison 1 Laser ablation (first generation) versus transcervical resection of the endometrium (TCRE) (first generation), Outcome 9 Complication rate: minor complications.
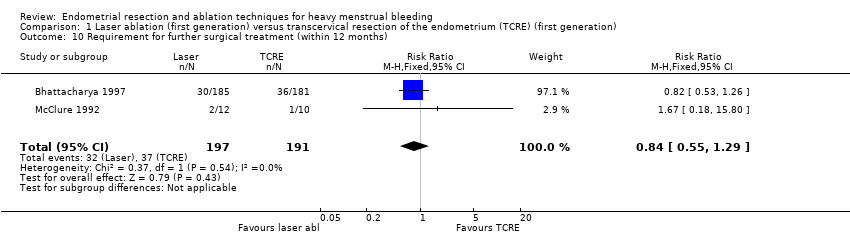
Comparison 1 Laser ablation (first generation) versus transcervical resection of the endometrium (TCRE) (first generation), Outcome 10 Requirement for further surgical treatment (within 12 months).
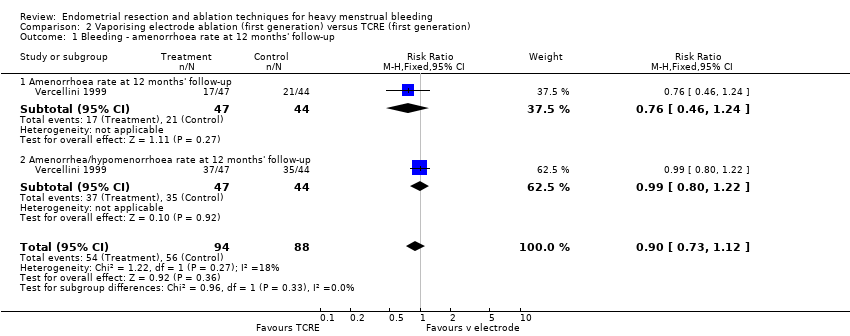
Comparison 2 Vaporising electrode ablation (first generation) versus TCRE (first generation), Outcome 1 Bleeding ‐ amenorrhoea rate at 12 months' follow‐up.

Comparison 2 Vaporising electrode ablation (first generation) versus TCRE (first generation), Outcome 2 Bleeding ‐ PBAC score at 12 months.
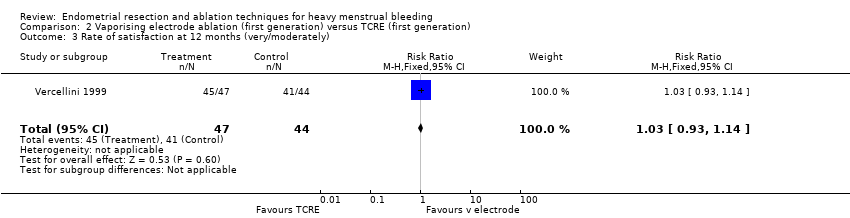
Comparison 2 Vaporising electrode ablation (first generation) versus TCRE (first generation), Outcome 3 Rate of satisfaction at 12 months (very/moderately).

Comparison 2 Vaporising electrode ablation (first generation) versus TCRE (first generation), Outcome 4 Duration of operation (minutes).
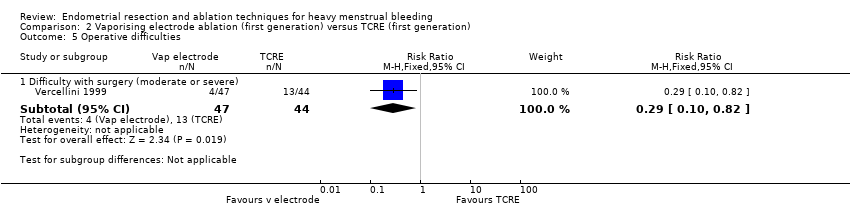
Comparison 2 Vaporising electrode ablation (first generation) versus TCRE (first generation), Outcome 5 Operative difficulties.
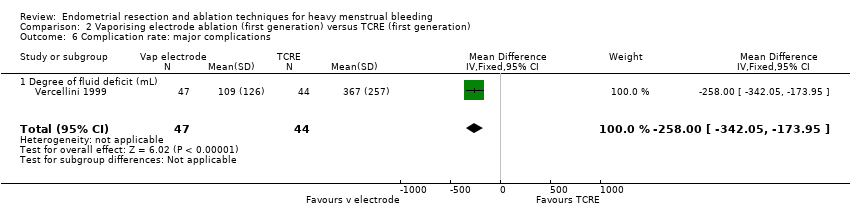
Comparison 2 Vaporising electrode ablation (first generation) versus TCRE (first generation), Outcome 6 Complication rate: major complications.
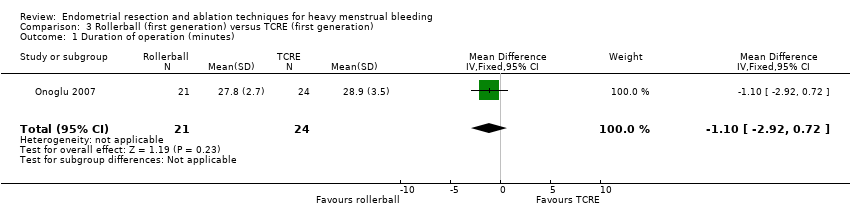
Comparison 3 Rollerball (first generation) versus TCRE (first generation), Outcome 1 Duration of operation (minutes).
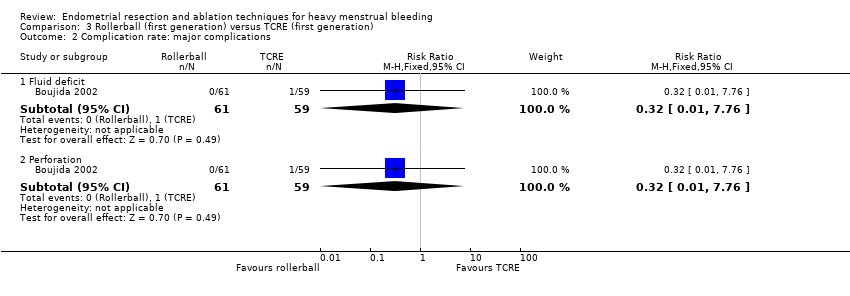
Comparison 3 Rollerball (first generation) versus TCRE (first generation), Outcome 2 Complication rate: major complications.
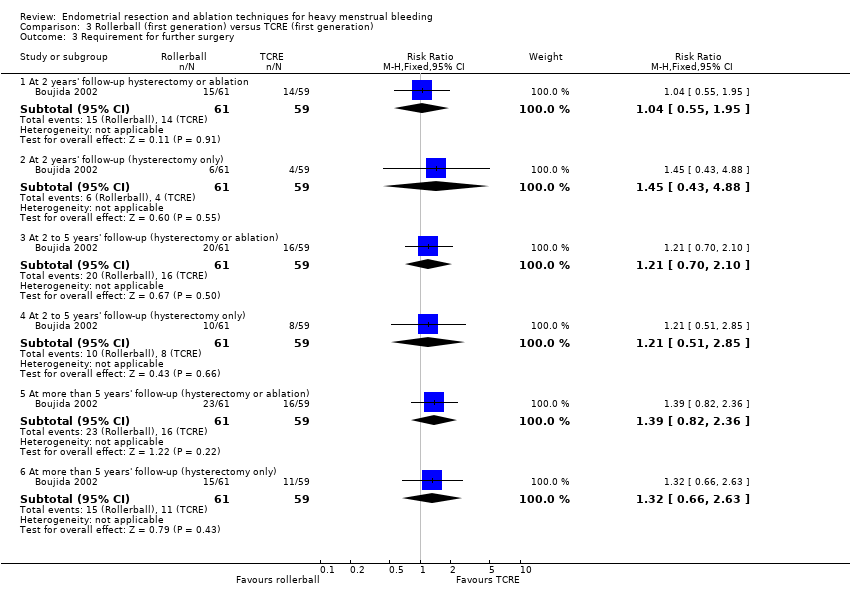
Comparison 3 Rollerball (first generation) versus TCRE (first generation), Outcome 3 Requirement for further surgery.

Comparison 4 Thermal laser (second generation) versus TCRE (first generation), Outcome 1 Bleeding ‐ amenorrhoea rate.

Comparison 4 Thermal laser (second generation) versus TCRE (first generation), Outcome 2 Rate of satisfaction.

Comparison 4 Thermal laser (second generation) versus TCRE (first generation), Outcome 3 Duration of operation.

Comparison 4 Thermal laser (second generation) versus TCRE (first generation), Outcome 4 Complication rate: major complications.

Comparison 4 Thermal laser (second generation) versus TCRE (first generation), Outcome 5 Complication rate: minor complications.
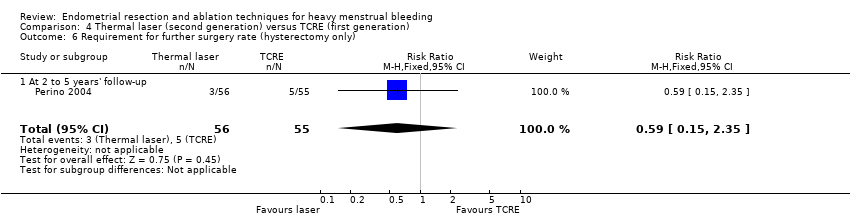
Comparison 4 Thermal laser (second generation) versus TCRE (first generation), Outcome 6 Requirement for further surgery rate (hysterectomy only).
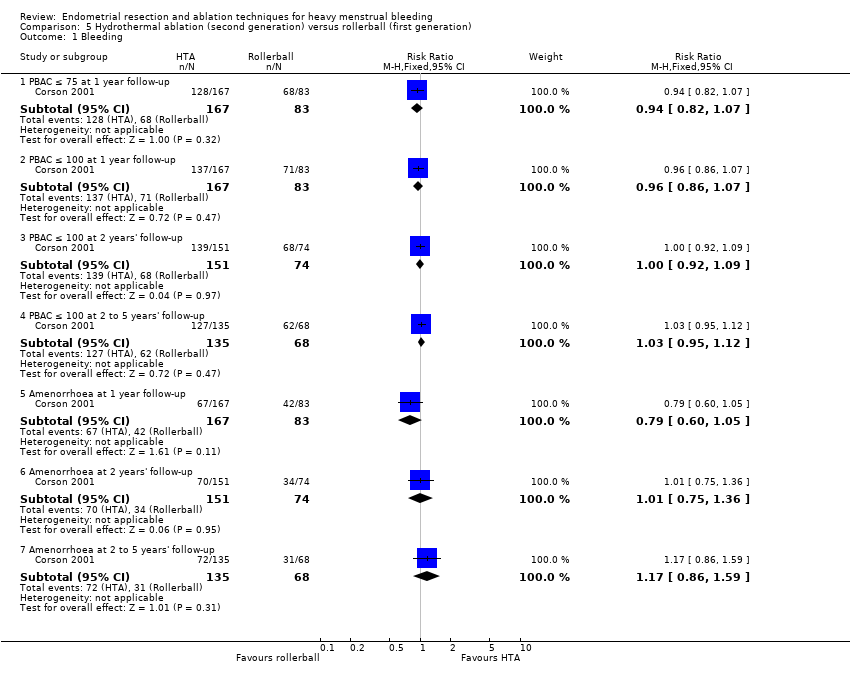
Comparison 5 Hydrothermal ablation (second generation) versus rollerball (first generation), Outcome 1 Bleeding.

Comparison 5 Hydrothermal ablation (second generation) versus rollerball (first generation), Outcome 2 Rate of satisfaction.

Comparison 5 Hydrothermal ablation (second generation) versus rollerball (first generation), Outcome 3 Proportion given local rather than general anaesthesia.
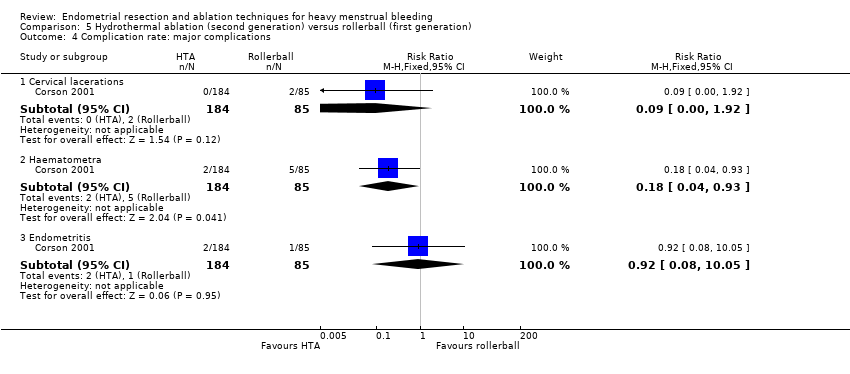
Comparison 5 Hydrothermal ablation (second generation) versus rollerball (first generation), Outcome 4 Complication rate: major complications.
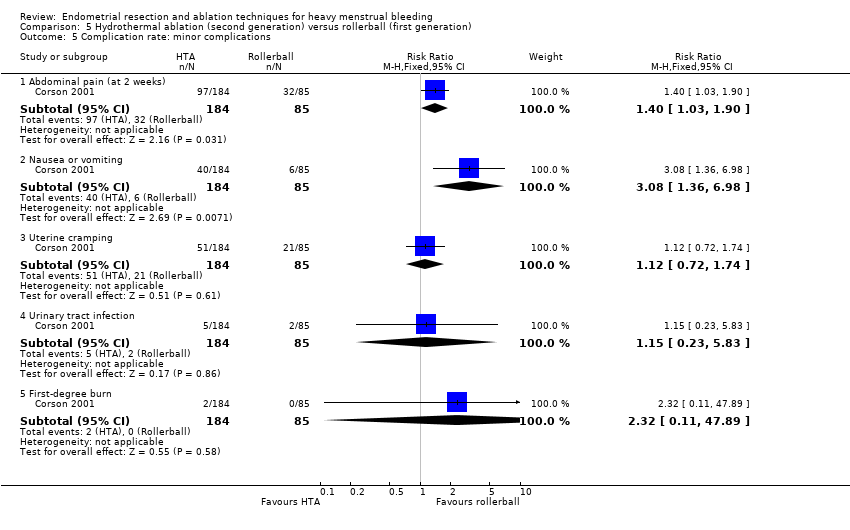
Comparison 5 Hydrothermal ablation (second generation) versus rollerball (first generation), Outcome 5 Complication rate: minor complications.

Comparison 5 Hydrothermal ablation (second generation) versus rollerball (first generation), Outcome 6 Requirement for further surgery.

Comparison 6 Cryoablation (second generation) versus rollerball (first generation), Outcome 1 Bleeding.

Comparison 6 Cryoablation (second generation) versus rollerball (first generation), Outcome 2 Rate of satisfaction.
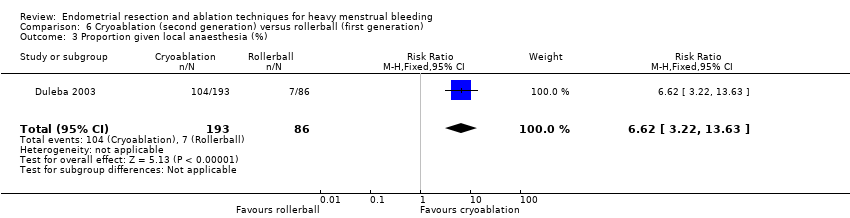
Comparison 6 Cryoablation (second generation) versus rollerball (first generation), Outcome 3 Proportion given local anaesthesia (%).
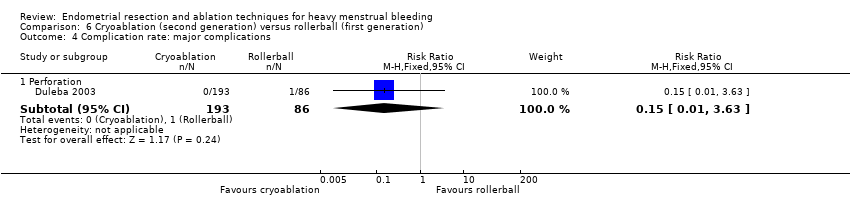
Comparison 6 Cryoablation (second generation) versus rollerball (first generation), Outcome 4 Complication rate: major complications.

Comparison 6 Cryoablation (second generation) versus rollerball (first generation), Outcome 5 Complication rate: minor complications.

Comparison 6 Cryoablation (second generation) versus rollerball (first generation), Outcome 6 Requirement for further surgery.

Comparison 7 Electrode ablation (second generation) versus TCRE + rollerball (first generation), Outcome 1 Bleeding ‐ amenorrhoea rate at 1 year follow‐up.

Comparison 7 Electrode ablation (second generation) versus TCRE + rollerball (first generation), Outcome 2 Proportion with successful Rx (PBAC < 75).
| Study | Electrode system | TCRE + RB | Stat test for diff |
| Balloon system | |||
| Corson 2000 | N=122 | N=112 | Not significantly different |
| Mesh system | |||
| Cooper 2002 | N=154 | N=82 | No reported difference |
Comparison 7 Electrode ablation (second generation) versus TCRE + rollerball (first generation), Outcome 3 PBAC score 12 months after treatment.
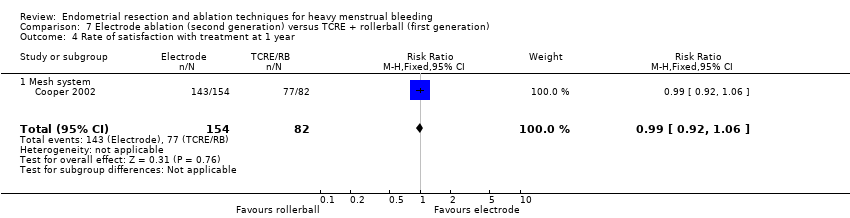
Comparison 7 Electrode ablation (second generation) versus TCRE + rollerball (first generation), Outcome 4 Rate of satisfaction with treatment at 1 year.

Comparison 7 Electrode ablation (second generation) versus TCRE + rollerball (first generation), Outcome 5 Duration of operation (minutes).
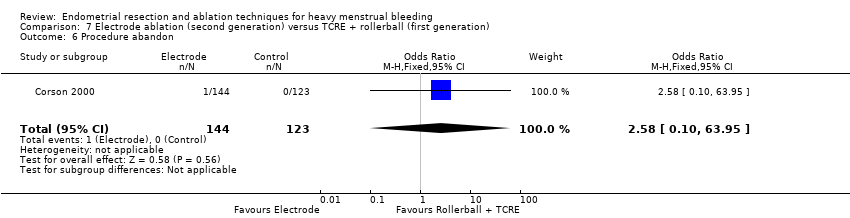
Comparison 7 Electrode ablation (second generation) versus TCRE + rollerball (first generation), Outcome 6 Procedure abandon.

Comparison 7 Electrode ablation (second generation) versus TCRE + rollerball (first generation), Outcome 7 Proportion given local anaesthesia (%).
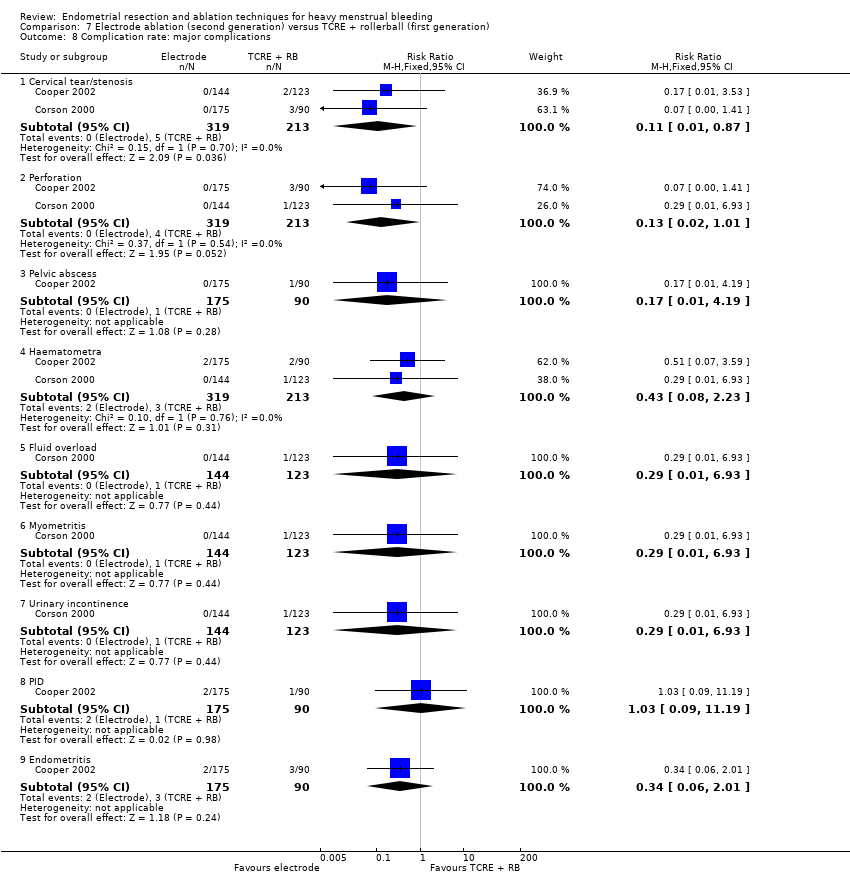
Comparison 7 Electrode ablation (second generation) versus TCRE + rollerball (first generation), Outcome 8 Complication rate: major complications.
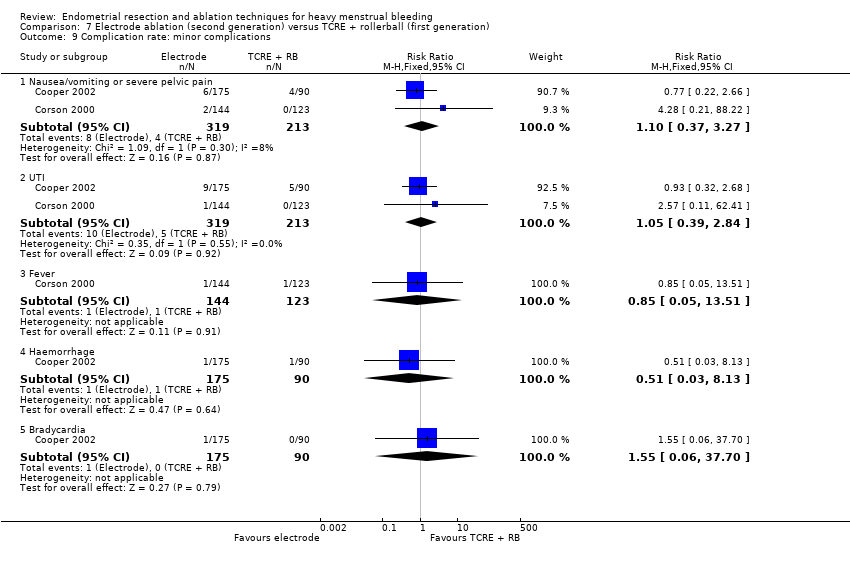
Comparison 7 Electrode ablation (second generation) versus TCRE + rollerball (first generation), Outcome 9 Complication rate: minor complications.

Comparison 7 Electrode ablation (second generation) versus TCRE + rollerball (first generation), Outcome 10 Requirement for further surgery at 2 years (hysterectomy).
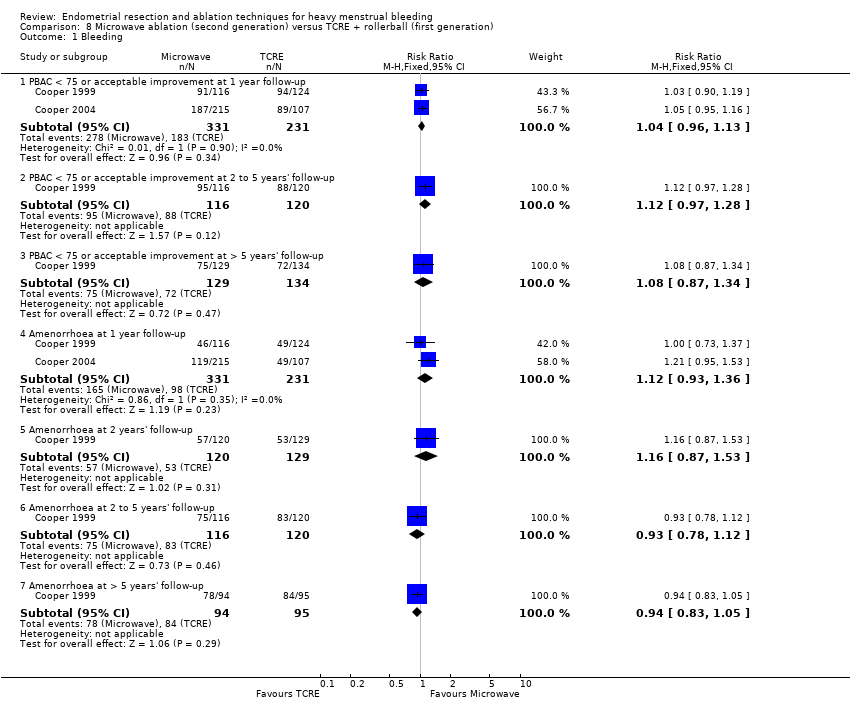
Comparison 8 Microwave ablation (second generation) versus TCRE + rollerball (first generation), Outcome 1 Bleeding.

Comparison 8 Microwave ablation (second generation) versus TCRE + rollerball (first generation), Outcome 2 Rate of satisfaction.
| Study | Microwave | TCRE | Results |
| Cooper 1999 | N=129 | N=134 | Mann Whitney U test |
Comparison 8 Microwave ablation (second generation) versus TCRE + rollerball (first generation), Outcome 3 Duration of operation (minutes).
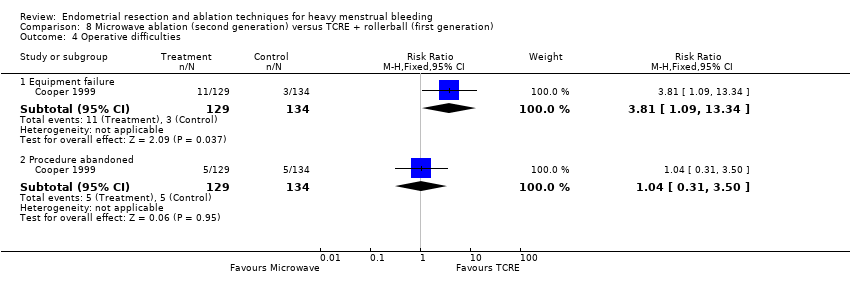
Comparison 8 Microwave ablation (second generation) versus TCRE + rollerball (first generation), Outcome 4 Operative difficulties.

Comparison 8 Microwave ablation (second generation) versus TCRE + rollerball (first generation), Outcome 5 Proportion given local anaesthesia.
| Study | Microwave | TCRE | Results |
| Cooper 1999 | N=129 | N=134 | Mann Whitney U test |
Comparison 8 Microwave ablation (second generation) versus TCRE + rollerball (first generation), Outcome 6 Duration of hospital stay (hours).

Comparison 8 Microwave ablation (second generation) versus TCRE + rollerball (first generation), Outcome 7 Inability to work (proportion of women).
| Study | MEA | TCRE | Results |
| Physical functioning | |||
| Cooper 1999 | AT 1 YEAR: At 10 YEARS: N=94 Mean change (SD): ‐4.4 (27) | AT 1 YEAR: At 10 YEARS: N=95 Mean change (SD): ‐3.0 (25) | AT 1 YEAR: At 10 YEARS: t test: NS (95% CI ‐8.9 to 6.1) |
| Social functioning | |||
| Cooper 1999 | AT 1 YEAR: At 10 YEARS: N=94 Mean change (SD): 10.1 (30) | At 1 YEAR: N=124 At 10 YEARS: N=95 Mean change (SD): 9.9 (26) | AT 1 YEAR: At 10 YEARS: t test: NS (95% CI ‐7.9 to 8.3) |
| Physical role | |||
| Cooper 1999 | AT 1 YEAR: At 10 YEARS: N=94 Mean change (SD): 15.0 (53) | AT 1 YEAR: At 10 YEARS: N=95 Mean change (SD): 10.9 (47) | AT 1 YEAR: At 10 YEARS: t test: NS, 95% CI ‐10.3 to 18.5 |
| Emotional role | |||
| Cooper 1999 | AT ONE YEAR: At 10 YEARS: N=94 Mean change (SD): 21.1 (50) | AT 1 YEAR: N=120 At 10 YEARS: N=95 Mean change (SD): 13.5 (47) | AT 1 YEAR: At 10 YEARS: t test: NS, 95% CI 6.3 to 21.5 |
| Mental health | |||
| Cooper 1999 | AT 1 YEAR: At 10 YEARS: N=94 Mean change (SD): 7.2 (21) | AT 1 YEAR: N=120 At 10 YEARS: N=95 Mean change (SD): 7.9 (25) | AT 1 YEAR: At 10 YEARS: t test: NS, 95% CI ‐7.3 to 5.9 |
| Energy/fatigue | |||
| Cooper 1999 | AT 1 YEAR: N=116 At 10 YEARS: N=94 Mean change (SD): 12.9 (29) | AT 1 YEAR: N=120 At 10 YEARS: N=95 Mean change (SD): 15.3 (27) | AT 1 YEAR: At 10 YEARS: t test: NS, 95% CI ‐10.4 to 5.6 |
| Pain | |||
| Cooper 1999 | AT 1 YEAR: N=116 At 10 YEARS: N=94 Mean change (SD): 11.6 (37) | AT 1 YEAR: N=120 At 10 YEARS: N=95 Mean change (SD): 12.3 (35) | AT 1 YEAR: At 10 YEARS: t test: NS, 95% CI ‐11.0 to 9.6 |
| General health | |||
| Cooper 1999 | AT 1 YEAR: N=116 At 10 YEARS: N=94 Mean change (SD): 0.94 (23) | AT 1 YEAR: N=120 At 10 YEARS: N=95 Mean change (SD): 2.8 (22) | AT 1 YEAR: At 10 YEARS: t test: NS, 95% CI ‐8.3 to 4.6 |
Comparison 8 Microwave ablation (second generation) versus TCRE + rollerball (first generation), Outcome 8 Quality of life ‐ change in SF‐36 score after treatment.

Comparison 8 Microwave ablation (second generation) versus TCRE + rollerball (first generation), Outcome 9 Improvement in other menstrual symptoms: PMS.

Comparison 8 Microwave ablation (second generation) versus TCRE + rollerball (first generation), Outcome 10 Improvement in other menstrual symptoms.
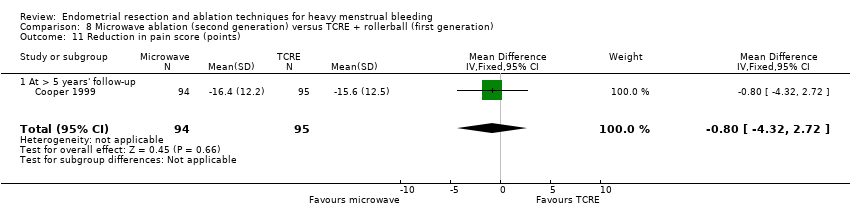
Comparison 8 Microwave ablation (second generation) versus TCRE + rollerball (first generation), Outcome 11 Reduction in pain score (points).
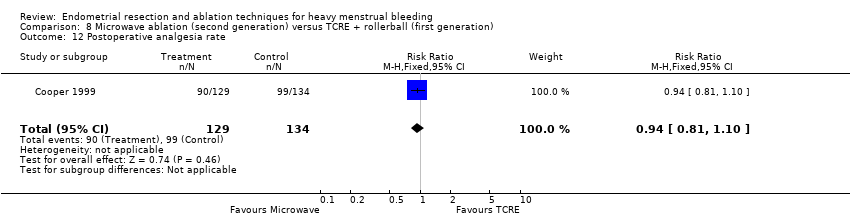
Comparison 8 Microwave ablation (second generation) versus TCRE + rollerball (first generation), Outcome 12 Postoperative analgesia rate.

Comparison 8 Microwave ablation (second generation) versus TCRE + rollerball (first generation), Outcome 13 Complication rate: major complications.

Comparison 8 Microwave ablation (second generation) versus TCRE + rollerball (first generation), Outcome 14 Complication rate: minor complications.

Comparison 8 Microwave ablation (second generation) versus TCRE + rollerball (first generation), Outcome 15 Requirement for further surgery.

Comparison 9 Balloon endometrial ablation (second generation) versus rollerball endometrial ablation (first generation), Outcome 1 Bleeding.
| Study | Balloon | Rollerball | Results |
| At 1 year follow‐up | |||
| Meyer 1998 | N=125 | N=114 | No statistical test performed of these outcomes |
| van Zon‐Rabelink 2003 | N=74 | N=55 | Wilcoxon test: |
| At 2 years' follow‐up | |||
| van Zon‐Rabelink 2003 | N=66 | N=55 | Wilcoxon test: P=0.01 |
Comparison 9 Balloon endometrial ablation (second generation) versus rollerball endometrial ablation (first generation), Outcome 2 PBAC score after treatment.

Comparison 9 Balloon endometrial ablation (second generation) versus rollerball endometrial ablation (first generation), Outcome 3 Success of treatment (lighter periods and no further surgery).

Comparison 9 Balloon endometrial ablation (second generation) versus rollerball endometrial ablation (first generation), Outcome 4 Success of treatment (menstrual score < 185).

Comparison 9 Balloon endometrial ablation (second generation) versus rollerball endometrial ablation (first generation), Outcome 5 Rate of satisfaction.

Comparison 9 Balloon endometrial ablation (second generation) versus rollerball endometrial ablation (first generation), Outcome 6 Duration of operation (minutes).

Comparison 9 Balloon endometrial ablation (second generation) versus rollerball endometrial ablation (first generation), Outcome 7 Operative difficulties.
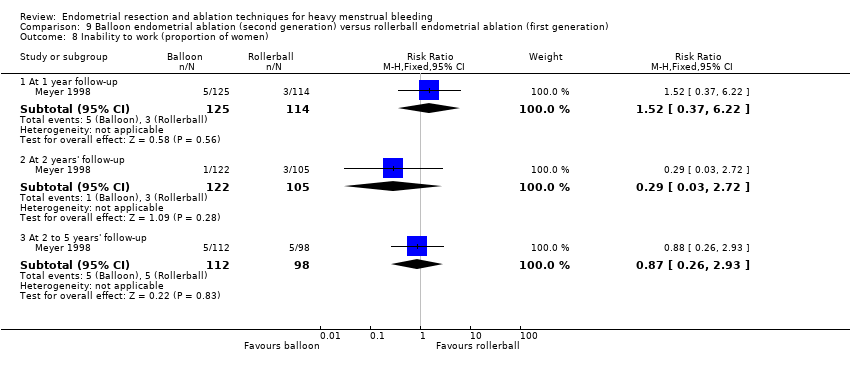
Comparison 9 Balloon endometrial ablation (second generation) versus rollerball endometrial ablation (first generation), Outcome 8 Inability to work (proportion of women).
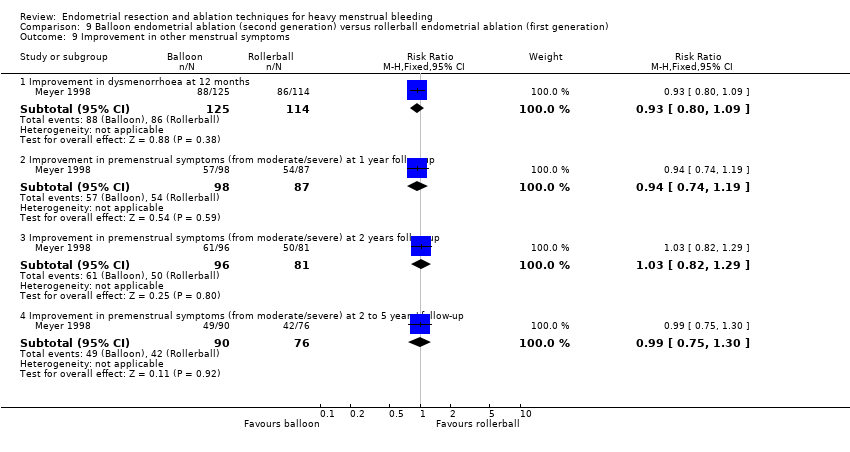
Comparison 9 Balloon endometrial ablation (second generation) versus rollerball endometrial ablation (first generation), Outcome 9 Improvement in other menstrual symptoms.
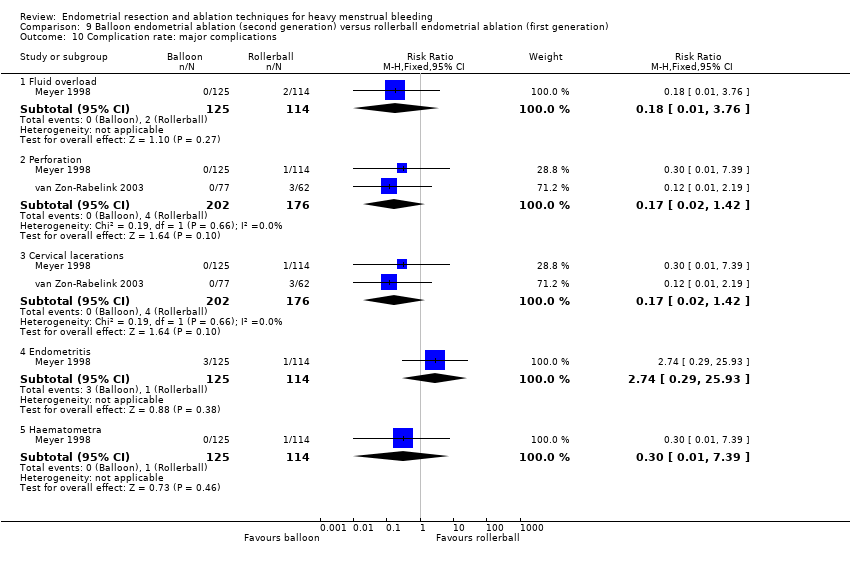
Comparison 9 Balloon endometrial ablation (second generation) versus rollerball endometrial ablation (first generation), Outcome 10 Complication rate: major complications.

Comparison 9 Balloon endometrial ablation (second generation) versus rollerball endometrial ablation (first generation), Outcome 11 Complication rate: minor complications.

Comparison 9 Balloon endometrial ablation (second generation) versus rollerball endometrial ablation (first generation), Outcome 12 Requirement for further surgery.
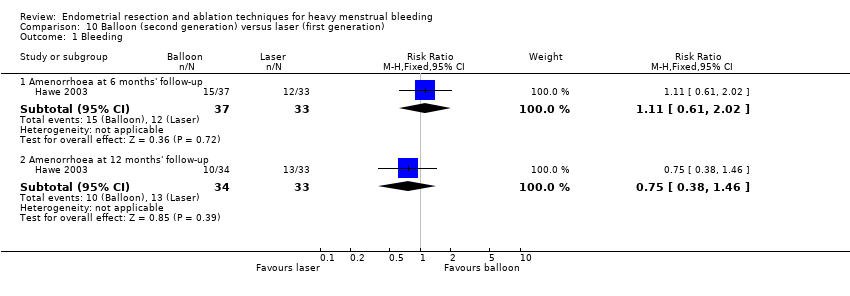
Comparison 10 Balloon (second generation) versus laser (first generation), Outcome 1 Bleeding.
| Study | Balloon | Laser | Statistical test |
| At 6 months' follow‐up | |||
| Hawe 2003 | N=37 | N=33 | Significance not reported |
Comparison 10 Balloon (second generation) versus laser (first generation), Outcome 2 PBAC score after treatment.

Comparison 10 Balloon (second generation) versus laser (first generation), Outcome 3 Rate of satisfaction.

Comparison 10 Balloon (second generation) versus laser (first generation), Outcome 4 Operative difficulties.

Comparison 10 Balloon (second generation) versus laser (first generation), Outcome 5 Pain score 4 hours post procedure.
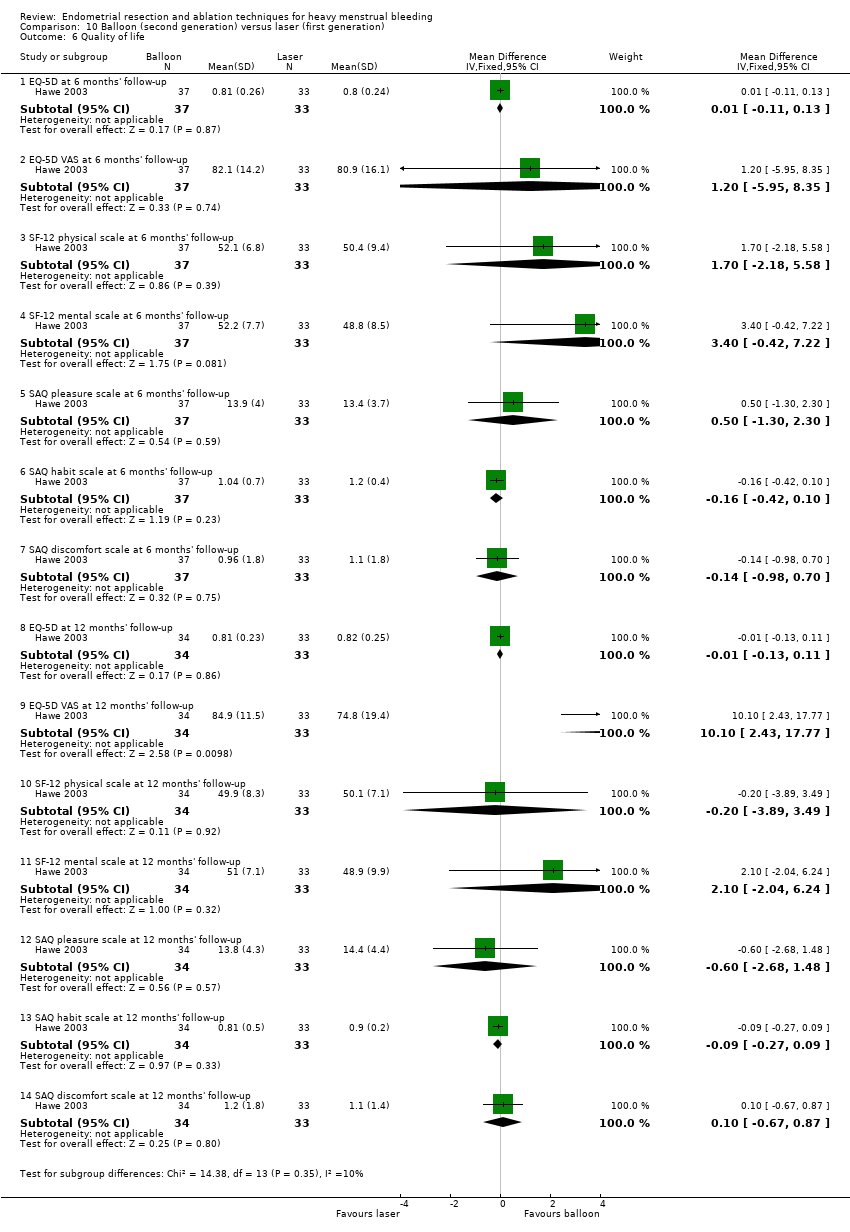
Comparison 10 Balloon (second generation) versus laser (first generation), Outcome 6 Quality of life.
| Study | Balloon | Laser | Statistical test |
| PMS at 6 months' follow‐up | |||
| Hawe 2003 | N=37 | N=33 | Not reported |
| PMS at 12 months' follow‐up | |||
| Hawe 2003 | N=34 | N=33 | Not reported |
Comparison 10 Balloon (second generation) versus laser (first generation), Outcome 7 Improvement in other menstrual symptoms.
| Study | Balloon | Laser | Statistical test |
| Dysmenorrhoea at 6 months' follow‐up | |||
| Hawe 2003 | N=37 | N=33 | Not reported |
| Dysmenorrhoea at 12 months' follow‐up | |||
| Hawe 2003 | N=34 | N=33 | Not reported |
Comparison 10 Balloon (second generation) versus laser (first generation), Outcome 8 Improvement in other menstrual symptoms: dysmenorrhoea (visual analogue).
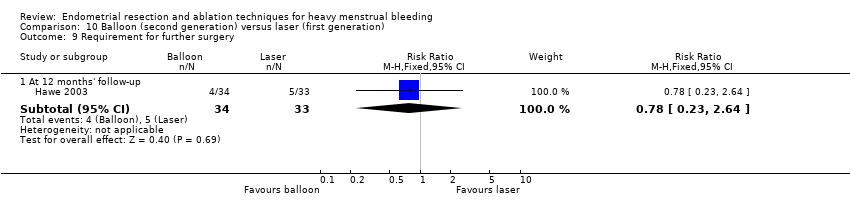
Comparison 10 Balloon (second generation) versus laser (first generation), Outcome 9 Requirement for further surgery.

Comparison 11 Balloon (second generation) versus TCRE (first generation), Outcome 1 Bleeding.

Comparison 11 Balloon (second generation) versus TCRE (first generation), Outcome 2 Rate of satisfaction.

Comparison 11 Balloon (second generation) versus TCRE (first generation), Outcome 3 Duration of operation (minutes).
| Study | Cavaterm balloon | TCRE | Comments |
| Brun 2006 | n=31 Median (range): 48 (24‐150) | n=20 Median (range): 45 (23‐105) | No statistical test reported ‐ unlikely to be a difference |
Comparison 11 Balloon (second generation) versus TCRE (first generation), Outcome 4 Duration of operation (minutes).

Comparison 11 Balloon (second generation) versus TCRE (first generation), Outcome 5 Operative difficulties.

Comparison 11 Balloon (second generation) versus TCRE (first generation), Outcome 6 Postoperative pain (continuous data).
| Study | Cavaterm balloon | TCRE | Comments |
| Brun 2006 | n=31 Pain score (VAS scale 0‐100): median (range): 45 (1‐100) | n=20 Pain score (VAS scale 0‐100): median (range): 10 (0‐90) | Mann Whitney rank sum test: P=0.012 |
Comparison 11 Balloon (second generation) versus TCRE (first generation), Outcome 7 Postoperative pain (descriptive data).
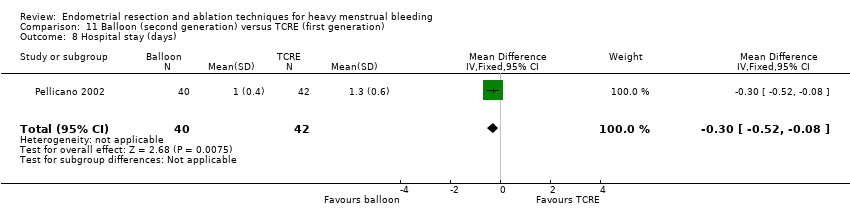
Comparison 11 Balloon (second generation) versus TCRE (first generation), Outcome 8 Hospital stay (days).
| Study | Cavaterm balloon | TCRE | Comments |
| Brun 2006 | n=31 Median (range): 21 (0‐36) | n=20 Median (range): 30 (6‐72) | Mann Whitney rank sum test P=0.012 |
Comparison 11 Balloon (second generation) versus TCRE (first generation), Outcome 9 Duration of hospital stay (hours).

Comparison 11 Balloon (second generation) versus TCRE (first generation), Outcome 10 Return to normal activities (days).
| Study | Cavaterm balloon | TCRE | Comments |
| Brun 2006 | n=31 Median (range): 4 (1‐20) | n=20 Median (range): 2 (1‐30) | Mann Whitney rank test ‐ not significantly different |
Comparison 11 Balloon (second generation) versus TCRE (first generation), Outcome 11 Return to normal activities (days).

Comparison 11 Balloon (second generation) versus TCRE (first generation), Outcome 12 Complication rate: major complications.
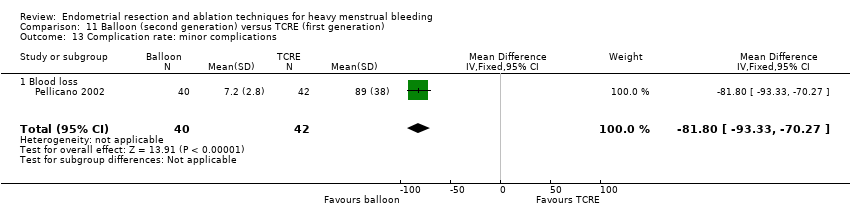
Comparison 11 Balloon (second generation) versus TCRE (first generation), Outcome 13 Complication rate: minor complications.

Comparison 11 Balloon (second generation) versus TCRE (first generation), Outcome 14 Complication rate: minor complications (dichotomous).

Comparison 11 Balloon (second generation) versus TCRE (first generation), Outcome 15 Requirement for further surgery.
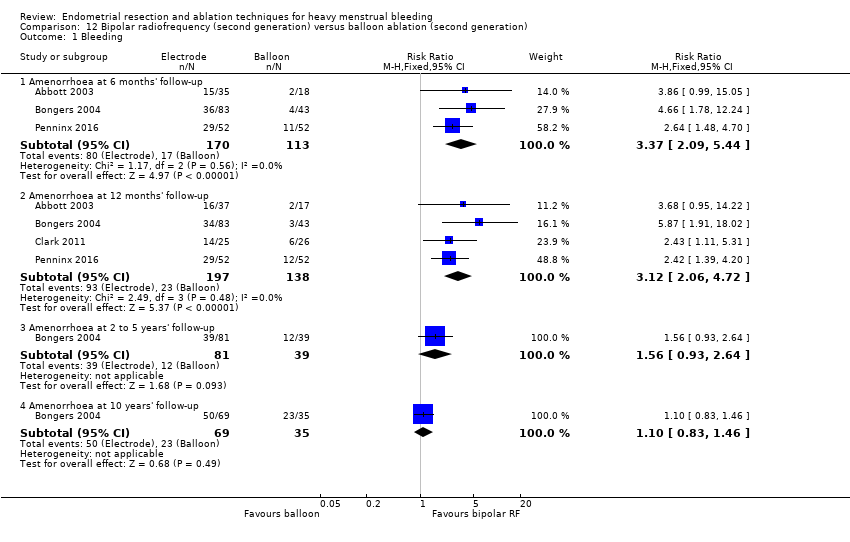
Comparison 12 Bipolar radiofrequency (second generation) versus balloon ablation (second generation), Outcome 1 Bleeding.
| Study | Electrode | Balloon | Statistical test |
| At 6 months' follow‐up | |||
| Penninx 2016 | |||
| At 12 months' follow‐up | |||
| Abbott 2003 | N=37 | N=18 | Mann Whitney |
| Penninx 2016 | N=52 PBAC<100 at 12 months: 44 | N=52 PBAC<100 at 12 months: 31 | RR=0.4 95% CI=0.2‐0.8 |
Comparison 12 Bipolar radiofrequency (second generation) versus balloon ablation (second generation), Outcome 2 PBAC score after treatment.

Comparison 12 Bipolar radiofrequency (second generation) versus balloon ablation (second generation), Outcome 3 Rate of satisfaction.
| Study | Electrode | Balloon | Statistical test |
| Abbott 2003 | N=37 | N=18 | t test |
| Bongers 2004 | N=82 | N=43 | Not reported |
| Clark 2011 | N=42 Mean time in mins (SD): 5.7 (2.1) | N=39 Mean time in mins (SD): 12.5 (2.3) | MD=6.7 mins (95% CI 5.8 to 7.7); p<0.001 Note: this is an office procedure in both arms) |
| Penninx 2016 | N=52 Mean time in mins (range) 10.4 min (6‐30) | N=52 Mean time in mins (range) 12.1 (5‐45) | p=0.34 |
Comparison 12 Bipolar radiofrequency (second generation) versus balloon ablation (second generation), Outcome 4 Duration of operation.

Comparison 12 Bipolar radiofrequency (second generation) versus balloon ablation (second generation), Outcome 5 Operative difficulties.

Comparison 12 Bipolar radiofrequency (second generation) versus balloon ablation (second generation), Outcome 6 Completion of procedure.
| Study | Bipolar RF ablation | Thermal ablation | Results |
| Clark 2011 | N=42 Mean: 6.4 days | N=39 Mean: 6.6 days | No significant difference between groups: 0.2 days difference (95% CI ‐5.9 to 6.2) |
Comparison 12 Bipolar radiofrequency (second generation) versus balloon ablation (second generation), Outcome 7 Time taken off work (days).
| Study | Bipolar RF ablation | Balloon ablation | Results |
| Clark 2011 | N=42 Mean (days): 4.9 | N=39 Mean (days): 8.1 | No significant difference between groups: 3.2 days difference (95% CI ‐1.6 to 8.1) |
Comparison 12 Bipolar radiofrequency (second generation) versus balloon ablation (second generation), Outcome 8 Time to resume normal activities (days).
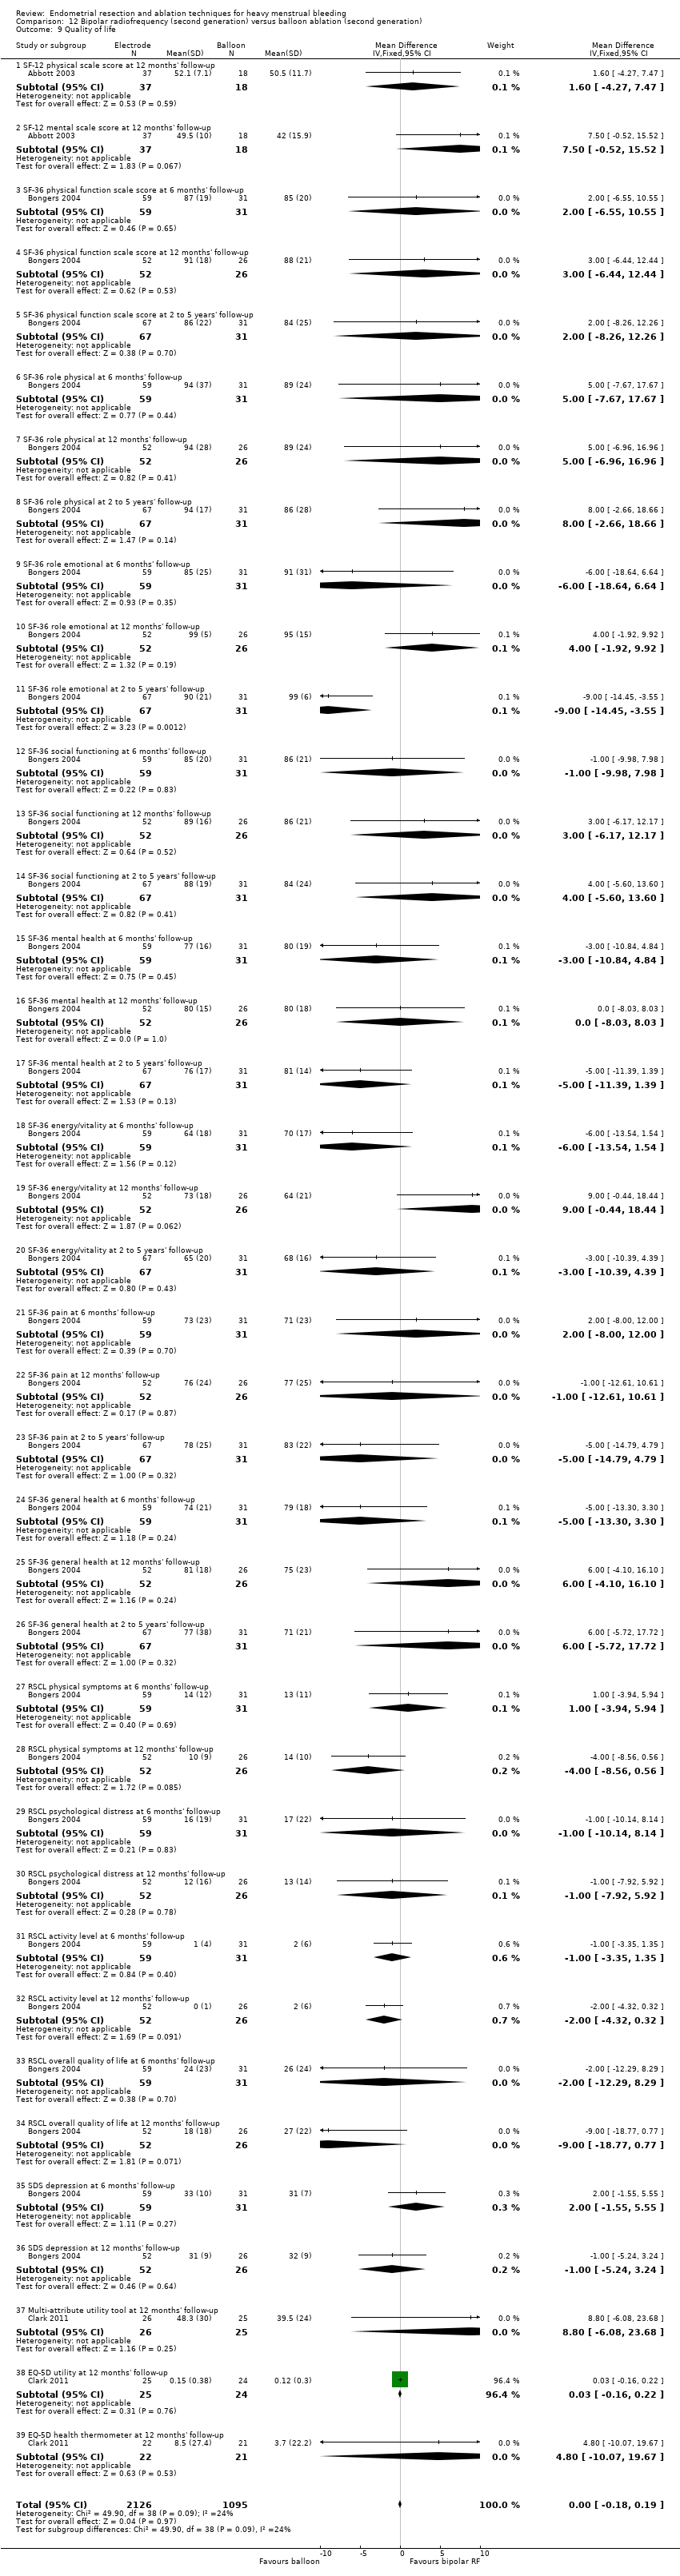
Comparison 12 Bipolar radiofrequency (second generation) versus balloon ablation (second generation), Outcome 9 Quality of life.

Comparison 12 Bipolar radiofrequency (second generation) versus balloon ablation (second generation), Outcome 10 Menorrhagia Outcome Questionnaire.
| Study | Electrode | Balloon | Statistical test |
| At 12 months' follow‐up | |||
| Abbott 2003 | N=37 | N=18 | Mann Whitney |
Comparison 12 Bipolar radiofrequency (second generation) versus balloon ablation (second generation), Outcome 11 Dysmenorrhoea rate (VAS score).
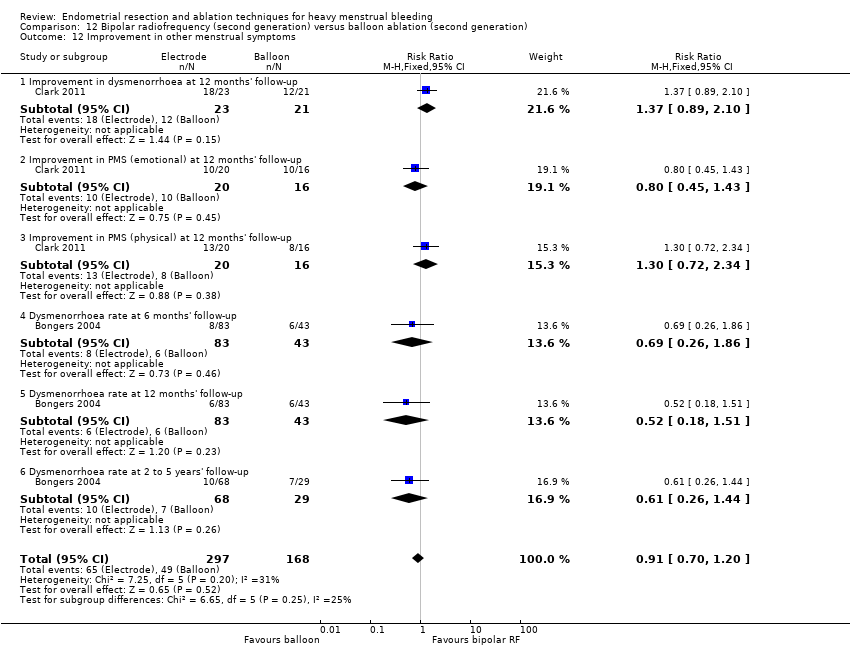
Comparison 12 Bipolar radiofrequency (second generation) versus balloon ablation (second generation), Outcome 12 Improvement in other menstrual symptoms.
| Study | Electrode | Balloon | Statistical test |
| At 12 months' follow‐up | |||
| Abbott 2003 | N=37 | N=18 | Mann Whitney |
Comparison 12 Bipolar radiofrequency (second generation) versus balloon ablation (second generation), Outcome 13 PMS rate (VAS score).

Comparison 12 Bipolar radiofrequency (second generation) versus balloon ablation (second generation), Outcome 14 Complication rate: major complications.
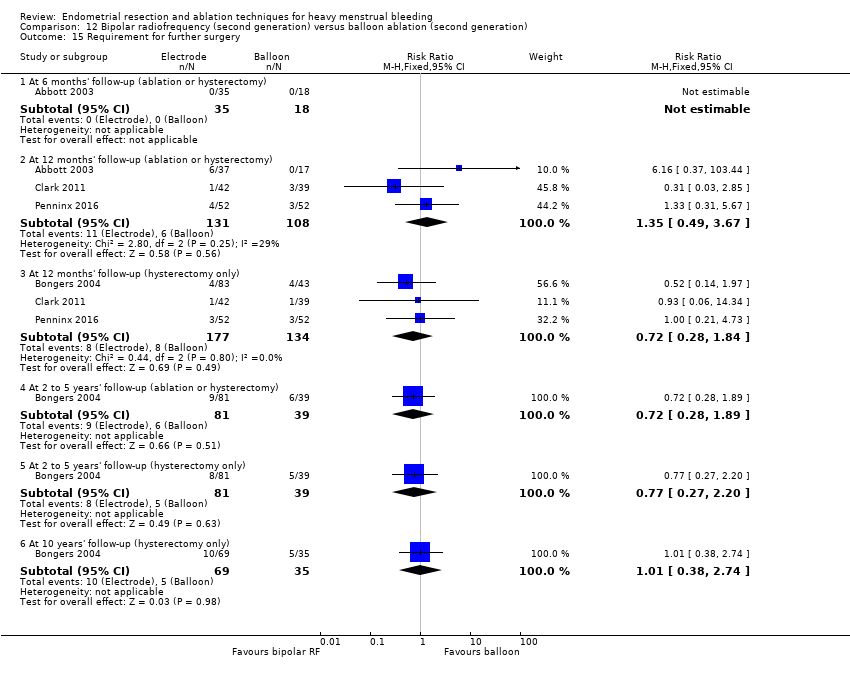
Comparison 12 Bipolar radiofrequency (second generation) versus balloon ablation (second generation), Outcome 15 Requirement for further surgery.
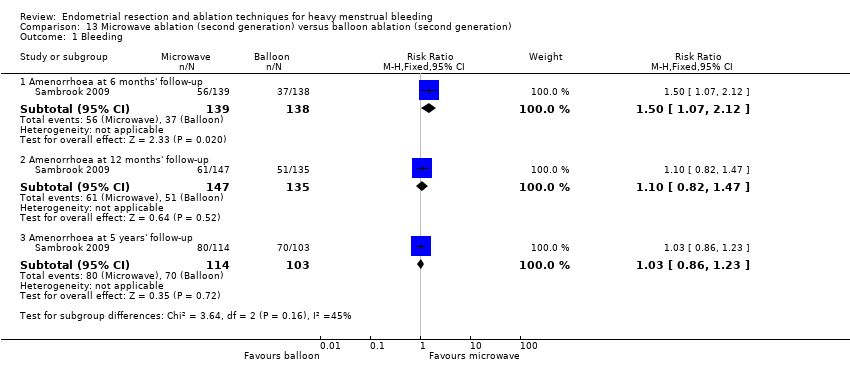
Comparison 13 Microwave ablation (second generation) versus balloon ablation (second generation), Outcome 1 Bleeding.
| Study | Follow up | Microwave ablation | Balloon ablation | Results |
| Sambrook 2009 | 12 months | N=143 Mean PBAC score (interquartile range): 3.0 (0.0 to 14.0) | N=135 Mean PBAC score (interquartile range): 4.0 (0.0 to 14.0) | Incidence rate ratio (95% CI): 0.91 (0.6 to 1.5) |
Comparison 13 Microwave ablation (second generation) versus balloon ablation (second generation), Outcome 2 PBAC score at 12 months' follow‐up.

Comparison 13 Microwave ablation (second generation) versus balloon ablation (second generation), Outcome 3 Rate of satisfaction.

Comparison 13 Microwave ablation (second generation) versus balloon ablation (second generation), Outcome 4 Operation time (minutes).
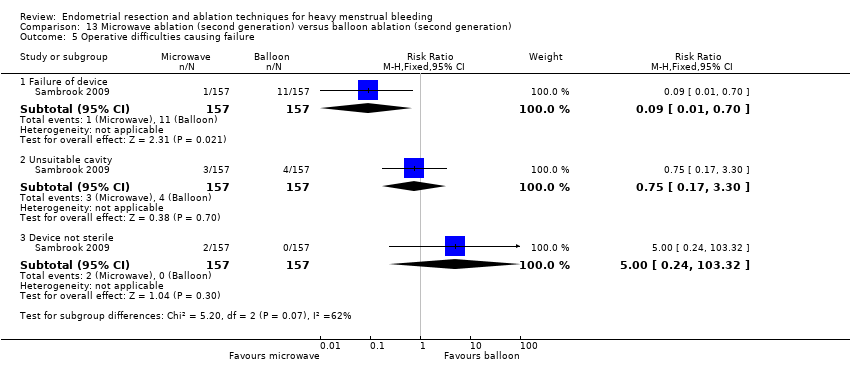
Comparison 13 Microwave ablation (second generation) versus balloon ablation (second generation), Outcome 5 Operative difficulties causing failure.

Comparison 13 Microwave ablation (second generation) versus balloon ablation (second generation), Outcome 6 Proportion choosing local anaesthesia.
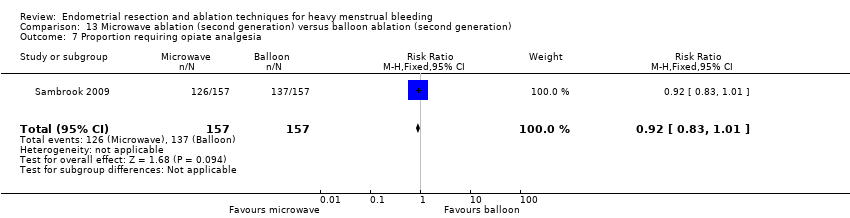
Comparison 13 Microwave ablation (second generation) versus balloon ablation (second generation), Outcome 7 Proportion requiring opiate analgesia.

Comparison 13 Microwave ablation (second generation) versus balloon ablation (second generation), Outcome 8 Recovery: proportion requiring overnight stay.

Comparison 13 Microwave ablation (second generation) versus balloon ablation (second generation), Outcome 9 Quality of life scores.
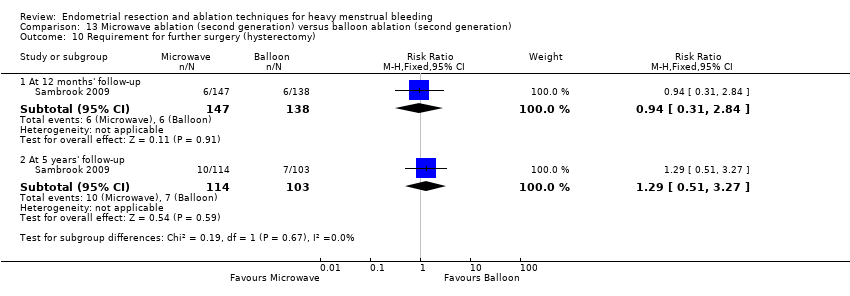
Comparison 13 Microwave ablation (second generation) versus balloon ablation (second generation), Outcome 10 Requirement for further surgery (hysterectomy).
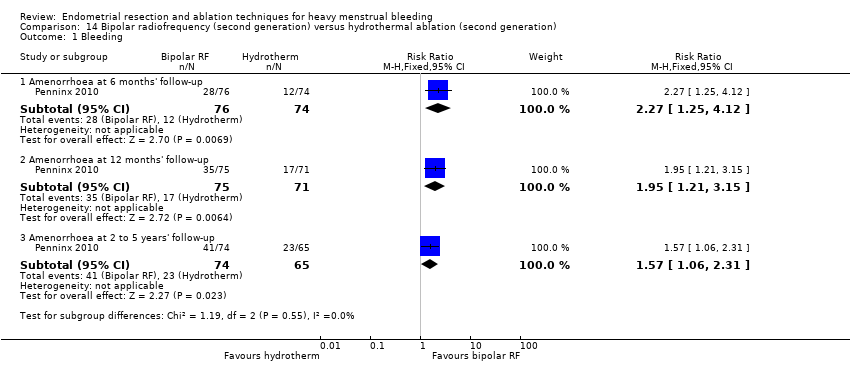
Comparison 14 Bipolar radiofrequency (second generation) versus hydrothermal ablation (second generation), Outcome 1 Bleeding.

Comparison 14 Bipolar radiofrequency (second generation) versus hydrothermal ablation (second generation), Outcome 2 Rate of satisfaction.
| Study | Bipolar RF | Hydrotherm ablation | Results |
| Penninx 2010 | N=82 Median (range): 11.8 (5 to 40) | N=74 Median (range): 27.8 (14 to 55) | Test used not stated p<0.001 |
Comparison 14 Bipolar radiofrequency (second generation) versus hydrothermal ablation (second generation), Outcome 3 Duration of procedure (minutes).

Comparison 14 Bipolar radiofrequency (second generation) versus hydrothermal ablation (second generation), Outcome 4 Improvement in other menstrual symptoms.

Comparison 14 Bipolar radiofrequency (second generation) versus hydrothermal ablation (second generation), Outcome 5 Complication rate: major complications.
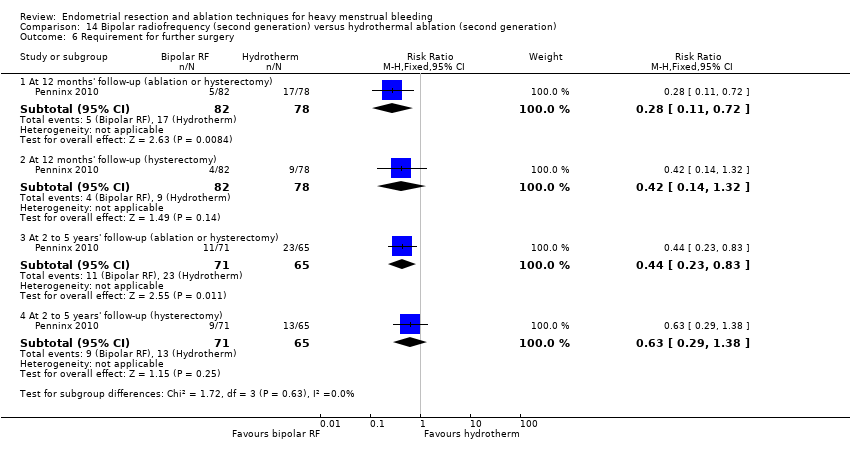
Comparison 14 Bipolar radiofrequency (second generation) versus hydrothermal ablation (second generation), Outcome 6 Requirement for further surgery.

Comparison 15 Ablative curettage versus overcurettage, Outcome 1 Bleeding.

Comparison 15 Ablative curettage versus overcurettage, Outcome 2 Surgery difficulties: failure rate of procedure.
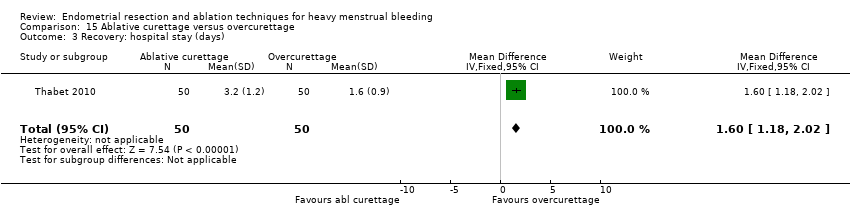
Comparison 15 Ablative curettage versus overcurettage, Outcome 3 Recovery: hospital stay (days).

Comparison 15 Ablative curettage versus overcurettage, Outcome 4 Complication rate: major complications.

Comparison 15 Ablative curettage versus overcurettage, Outcome 5 Complication rate: minor complications.
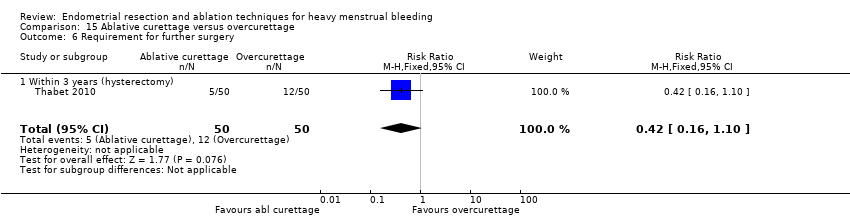
Comparison 15 Ablative curettage versus overcurettage, Outcome 6 Requirement for further surgery.

Comparison 16 Microwave ablation (second generation) versus bipolar radiofrequency (second generation), Outcome 1 Bleeding.
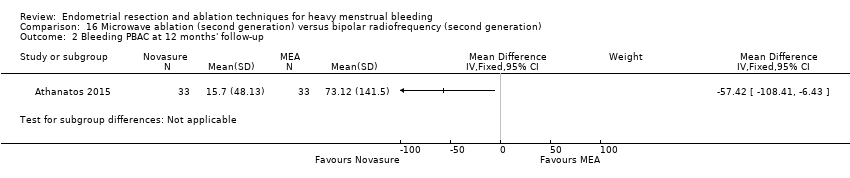
Comparison 16 Microwave ablation (second generation) versus bipolar radiofrequency (second generation), Outcome 2 Bleeding PBAC at 12 months' follow‐up.

Comparison 16 Microwave ablation (second generation) versus bipolar radiofrequency (second generation), Outcome 3 Rate of satisfaction.
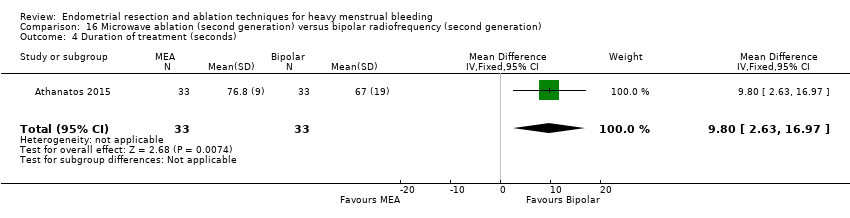
Comparison 16 Microwave ablation (second generation) versus bipolar radiofrequency (second generation), Outcome 4 Duration of treatment (seconds).

Comparison 16 Microwave ablation (second generation) versus bipolar radiofrequency (second generation), Outcome 5 Improvement in other menstrual symptoms: dysmenorrhoea.

Comparison 16 Microwave ablation (second generation) versus bipolar radiofrequency (second generation), Outcome 6 Complication rate.
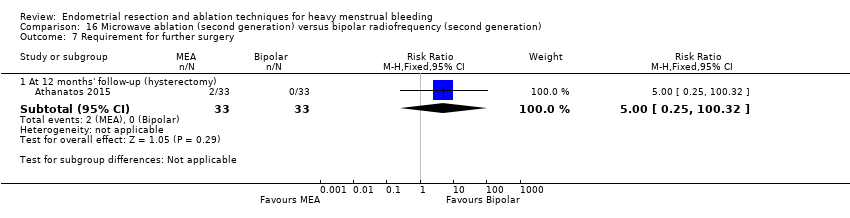
Comparison 16 Microwave ablation (second generation) versus bipolar radiofrequency (second generation), Outcome 7 Requirement for further surgery.
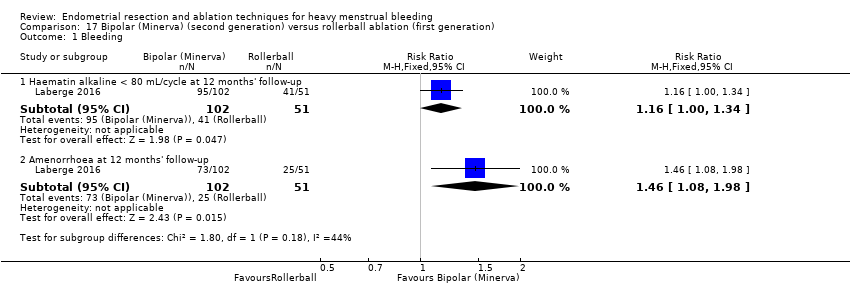
Comparison 17 Bipolar (Minerva) (second generation) versus rollerball ablation (first generation), Outcome 1 Bleeding.

Comparison 17 Bipolar (Minerva) (second generation) versus rollerball ablation (first generation), Outcome 2 Rate of satisfaction.

Comparison 17 Bipolar (Minerva) (second generation) versus rollerball ablation (first generation), Outcome 3 Duration of surgery.
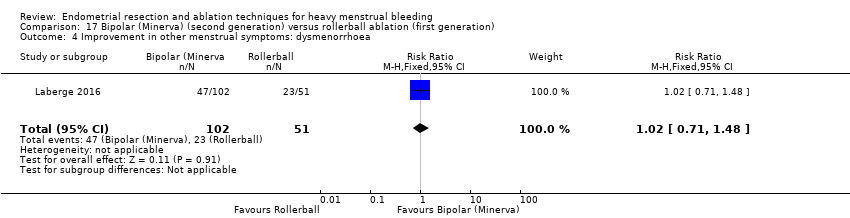
Comparison 17 Bipolar (Minerva) (second generation) versus rollerball ablation (first generation), Outcome 4 Improvement in other menstrual symptoms: dysmenorrhoea.
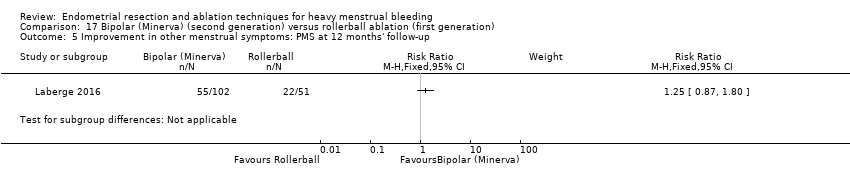
Comparison 17 Bipolar (Minerva) (second generation) versus rollerball ablation (first generation), Outcome 5 Improvement in other menstrual symptoms: PMS at 12 months' follow‐up.
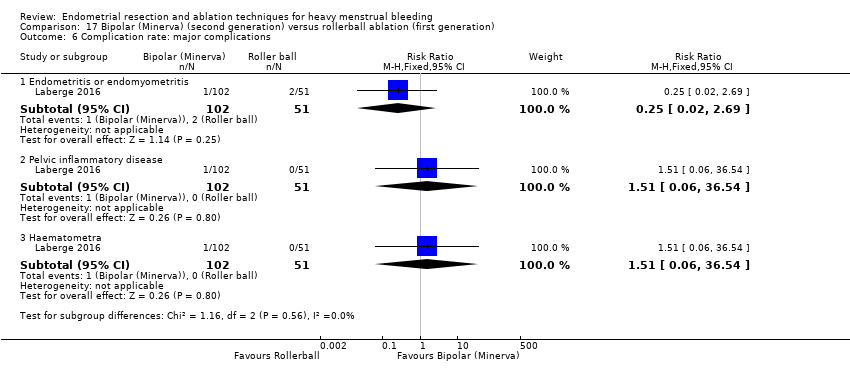
Comparison 17 Bipolar (Minerva) (second generation) versus rollerball ablation (first generation), Outcome 6 Complication rate: major complications.

Comparison 17 Bipolar (Minerva) (second generation) versus rollerball ablation (first generation), Outcome 7 Complication rate: minor complications.
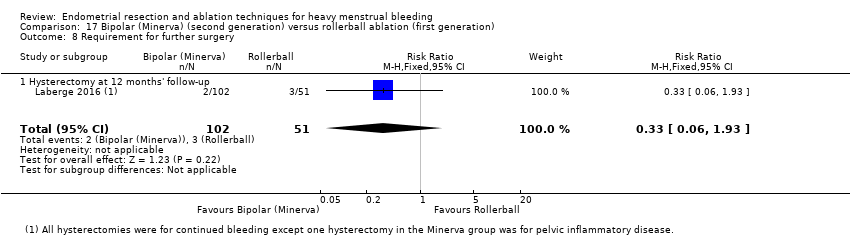
Comparison 17 Bipolar (Minerva) (second generation) versus rollerball ablation (first generation), Outcome 8 Requirement for further surgery.
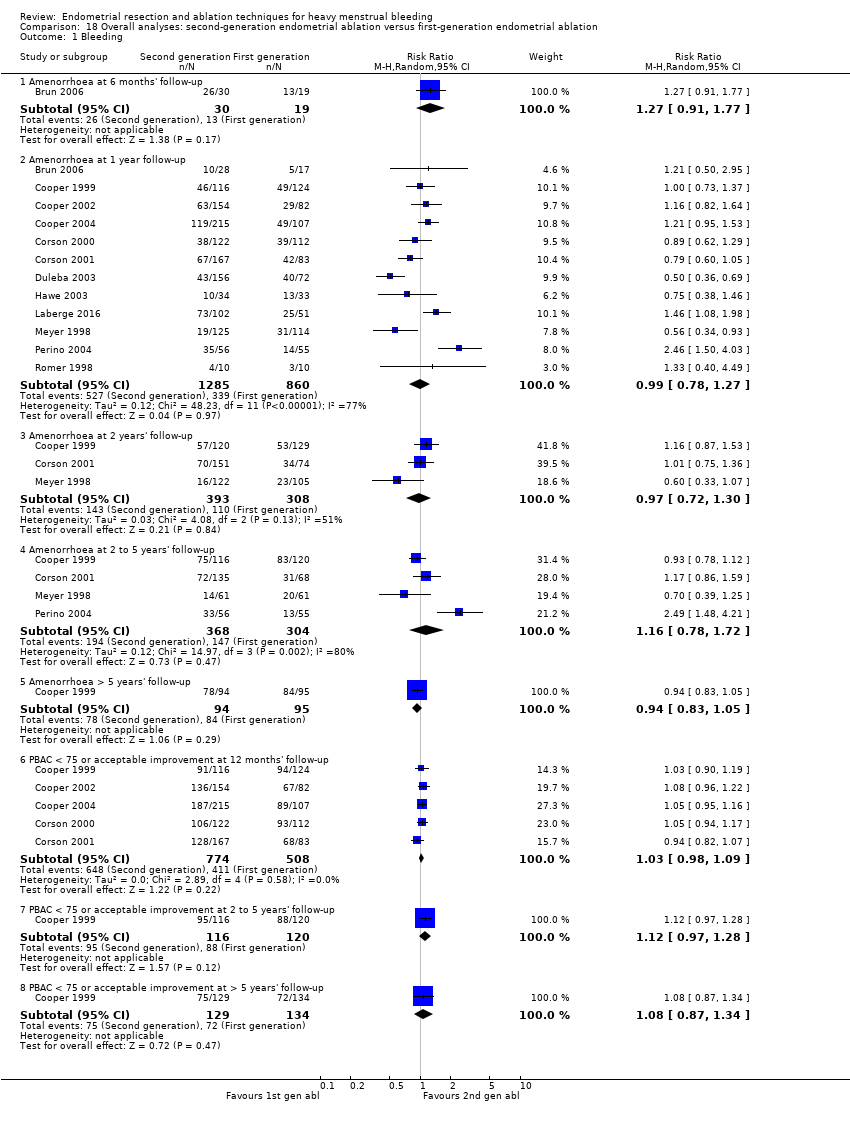
Comparison 18 Overall analyses: second‐generation endometrial ablation versus first‐generation endometrial ablation, Outcome 1 Bleeding.
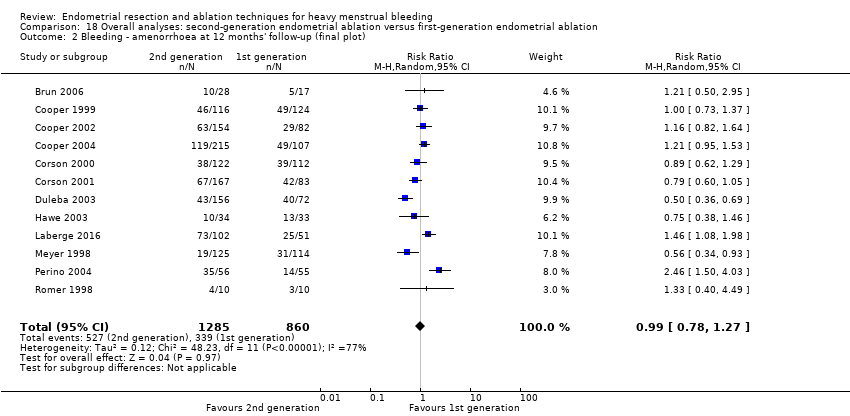
Comparison 18 Overall analyses: second‐generation endometrial ablation versus first‐generation endometrial ablation, Outcome 2 Bleeding ‐ amenorrhoea at 12 months' follow‐up (final plot).

Comparison 18 Overall analyses: second‐generation endometrial ablation versus first‐generation endometrial ablation, Outcome 3 Satisfaction rate.

Comparison 18 Overall analyses: second‐generation endometrial ablation versus first‐generation endometrial ablation, Outcome 4 Satisfaction rate at 1 year follow‐up (final plot).

Comparison 18 Overall analyses: second‐generation endometrial ablation versus first‐generation endometrial ablation, Outcome 5 Duration of operation (minutes).

Comparison 18 Overall analyses: second‐generation endometrial ablation versus first‐generation endometrial ablation, Outcome 6 Operative difficulties.

Comparison 18 Overall analyses: second‐generation endometrial ablation versus first‐generation endometrial ablation, Outcome 7 Proportion given local anaesthesia (%).
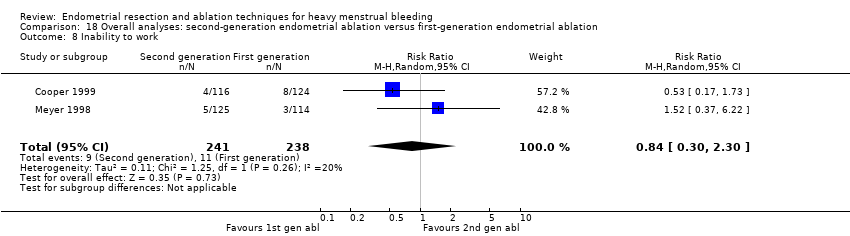
Comparison 18 Overall analyses: second‐generation endometrial ablation versus first‐generation endometrial ablation, Outcome 8 Inability to work.

Comparison 18 Overall analyses: second‐generation endometrial ablation versus first‐generation endometrial ablation, Outcome 9 Complication rate: major complications.
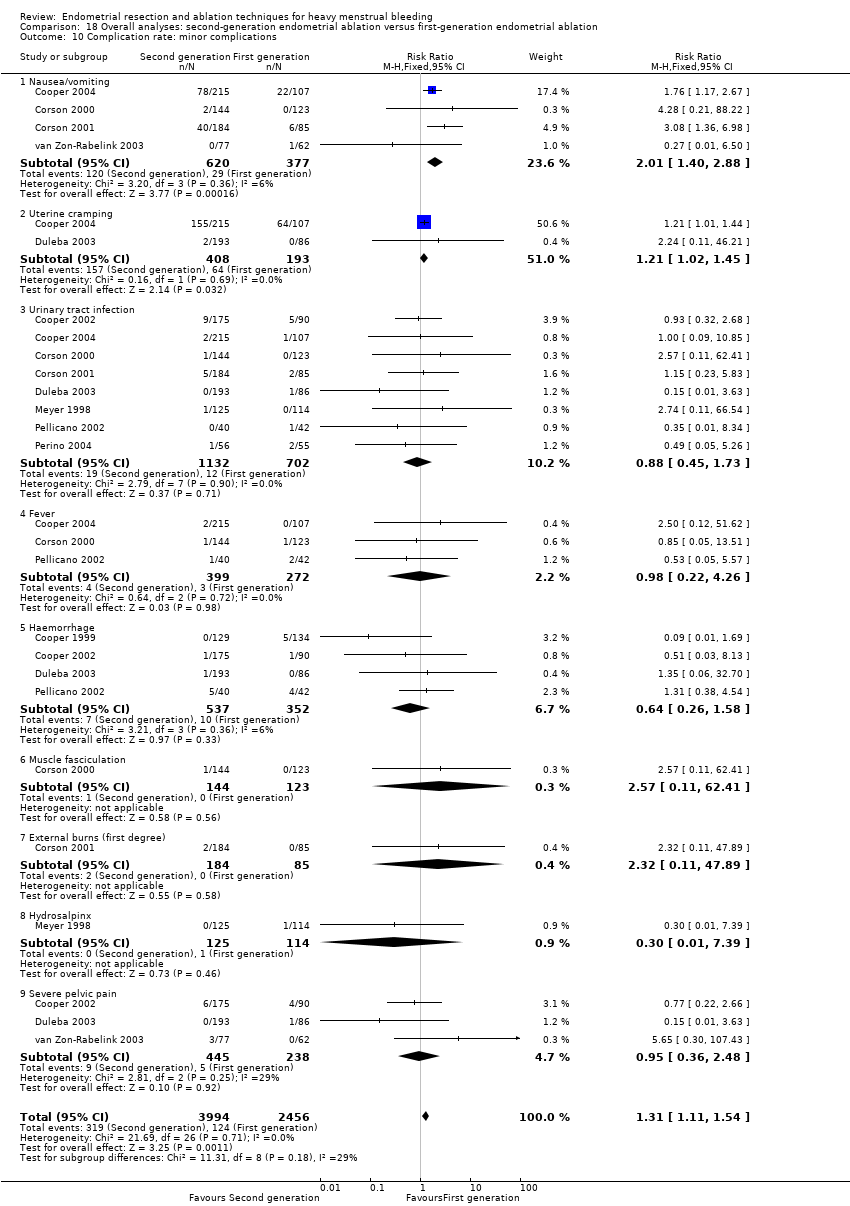
Comparison 18 Overall analyses: second‐generation endometrial ablation versus first‐generation endometrial ablation, Outcome 10 Complication rate: minor complications.

Comparison 18 Overall analyses: second‐generation endometrial ablation versus first‐generation endometrial ablation, Outcome 11 Requirement for additional surgery.
| Overall analyses: second‐generation endometrial ablation compared to first‐generation endometrial ablation for heavy menstrual bleeding | |||||||
| Patient or population: heavy menstrual bleeding | |||||||
| Outcomes | Anticipated absolute effects* (95% CI) | Relative effect | No. of participants | Certainty of the evidence | Comments | ||
| Risk with first‐generation endometrial ablation | Risk with overall analyses: second‐generation endometrial ablation | ||||||
| Bleeding | Amenorrhoea at 1 year follow‐up | 394 per 1000 | 390 per 1000 | RR 0.99 | 2145 | ⊕⊝⊝⊝ | |
| PBAC < 75 or acceptable improvement at 12 months' follow‐up | 809 per 1000 | 833 per 1000 | RR 1.03 | 1282 | ⊕⊕⊝⊝ | ||
| Amenorrhoea at 2 to 5 years' follow‐up | 484 per 1000 | 561 per 1000 | RR 1.16 | 672 | ⊕⊝⊝⊝ | ||
| PBAC < 75 or acceptable improvement at 5 years' follow‐up | 537 per 1000 | 580 per 1000 | RR 1.08 | 263 | ⊕⊕⊝⊝ | ||
| Satisfaction rate | At 1 year follow‐up | 898 per 1000 | 907 per 1000 | RR 1.01 | 1750 | ⊕⊕⊝⊝ | |
| At 2 to 5 years' follow‐up | 868 per 1000 | 886 per 1000 | RR 1.02 | 672 | ⊕⊝⊝⊝ | ||
| Duration of operation (minutes) | Mean duration of operation (minutes) was 27 | MD 13.52 lower | ‐ | 1822 | ⊕⊝⊝⊝ | ||
| Proportion given local anaesthesia (%) | 208 per 1000 | 578 per 1000 | RR 2.78 | 1434 | ⊕⊝⊝⊝ | ||
| Complication rate ‐ perforation | 13 per 1000 | 4 per 1000 | RR 0.32 | 1885 | ⊕⊕⊝⊝ | ||
| Requirement for additional surgery | At 1 year follow‐up (ablation or hysterectomy) | 66 per 1000 | 47 per 1000 | RR 0.72 | 935 | ⊕⊕⊝⊝ | |
| At 2 to 5 years' follow‐up (hysterectomy) | 191 per 1000 | 162 per 1000 | RR 0.85 | 758 | ⊕⊕⊕⊝ | ||
| *The risk in the intervention group (and its 95% confidence interval) is based on the assumed risk in the comparison group and the relative effect of the intervention (and its 95% CI). | |||||||
| GRADE Working Group grades of evidence. | |||||||
| aEight studies provided insufficient details for a judgement about allocation concealment; downgraded one level. bHeterogeneity was high at I² > 75%; downgraded two levels. cThe funnel plot suggested asymmetry; downgraded one level. dOnly two studies provided sufficient details for a judgement about allocation concealment; no blinding of participants/researchers or outcome assessors; downgraded one level. eNo blinding of participants/researchers or outcome assessors; downgraded one level. fThree studies provided insufficient details for a judgement about allocation concealment; only one study provided adequate data on blinding of participants/researchers and outcome assessors; downgraded two levels. gEvidence of imprecision based on one study with n < 300; downgraded one level. hOnly one study provided adequate data on blinding of participants/researchers and outcome assessors; downgraded one level. iOnly one study provided sufficient details for a judgement about allocation concealment; downgraded one level. jThe confidence interval has a very wide range (1.76 to 4.40); downgraded one level. kThe number of events is very low and the confidence interval is wide; downgraded one level. lThe number of events is very low; downgraded one level. | |||||||
| Outcome or subgroup title | No. of studies | No. of participants | Statistical method | Effect size |
| 1 Bleeding ‐ blood loss (mL) at 6 months Show forest plot | 1 | 22 | Mean Difference (IV, Fixed, 95% CI) | 23.6 [‐8.32, 55.52] |
| 2 Bleeding Show forest plot | 2 | Risk Ratio (M‐H, Fixed, 95% CI) | Subtotals only | |
| 2.1 Amenorrhoea rate at 6 months | 2 | 348 | Risk Ratio (M‐H, Fixed, 95% CI) | 0.97 [0.66, 1.45] |
| 2.2 Amenorrhoea/hypomenorrhoea rate at 6 months | 1 | 326 | Risk Ratio (M‐H, Fixed, 95% CI) | 0.97 [0.89, 1.05] |
| 2.3 Amenorrhoea/hypomenorrhoea rate at 12 months | 1 | 306 | Risk Ratio (M‐H, Fixed, 95% CI) | 1.06 [0.92, 1.22] |
| 3 Rate of satisfaction at 12 months (very/moderately) Show forest plot | 1 | 321 | Risk Ratio (M‐H, Fixed, 95% CI) | 0.99 [0.92, 1.06] |
| 4 Duration of operation (minutes) Show forest plot | 2 | 386 | Mean Difference (IV, Fixed, 95% CI) | 9.15 [7.21, 11.09] |
| 5 Operative difficulties Show forest plot | 1 | Risk Ratio (M‐H, Fixed, 95% CI) | Subtotals only | |
| 5.1 Procedure abandoned | 1 | 366 | Risk Ratio (M‐H, Fixed, 95% CI) | 1.47 [0.61, 3.51] |
| 5.2 Failed instrumentation | 1 | 366 | Risk Ratio (M‐H, Fixed, 95% CI) | 0.20 [0.01, 4.05] |
| 5.3 Equipment failure | 1 | 366 | Risk Ratio (M‐H, Fixed, 95% CI) | 5.54 [1.65, 18.60] |
| 5.4 Immediate hysterectomy | 1 | 366 | Risk Ratio (M‐H, Fixed, 95% CI) | 0.33 [0.01, 7.95] |
| 6 Good general health Show forest plot | 1 | 321 | Risk Ratio (M‐H, Fixed, 95% CI) | 1.03 [0.95, 1.12] |
| 7 Improvement in menstrual symptoms Show forest plot | 1 | Risk Ratio (M‐H, Fixed, 95% CI) | Subtotals only | |
| 7.1 Improvement in symptoms (general) | 1 | 321 | Risk Ratio (M‐H, Fixed, 95% CI) | 1.03 [0.87, 1.21] |
| 7.2 Improvement in dysmenorrhoea at 6 months | 1 | 253 | Risk Ratio (M‐H, Fixed, 95% CI) | 1.17 [1.00, 1.38] |
| 7.3 Improvement in dysmenorrhoea at 12 months | 1 | 218 | Risk Ratio (M‐H, Fixed, 95% CI) | 1.00 [0.87, 1.15] |
| 8 Complication rate: major complications Show forest plot | 2 | 2218 | Risk Ratio (M‐H, Fixed, 95% CI) | 1.41 [0.83, 2.41] |
| 8.1 Perforation | 1 | 366 | Risk Ratio (M‐H, Fixed, 95% CI) | 0.14 [0.01, 2.69] |
| 8.2 Bowel obstruction | 1 | 366 | Risk Ratio (M‐H, Fixed, 95% CI) | 2.94 [0.12, 71.59] |
| 8.3 Pelvic sepsis | 1 | 366 | Risk Ratio (M‐H, Fixed, 95% CI) | 0.82 [0.25, 2.62] |
| 8.4 Haematometra | 1 | 366 | Risk Ratio (M‐H, Fixed, 95% CI) | 0.20 [0.01, 4.05] |
| 8.5 Glycine toxicity | 1 | 22 | Risk Ratio (M‐H, Fixed, 95% CI) | 4.23 [0.23, 79.10] |
| 8.6 Fluid overload (> 1.5 L) | 1 | 366 | Risk Ratio (M‐H, Fixed, 95% CI) | 4.89 [1.44, 16.61] |
| 8.7 Uterine tamponade | 1 | 366 | Risk Ratio (M‐H, Fixed, 95% CI) | 1.14 [0.39, 3.33] |
| 9 Complication rate: minor complications Show forest plot | 1 | Risk Ratio (M‐H, Fixed, 95% CI) | Subtotals only | |
| 9.1 Burns | 1 | 366 | Risk Ratio (M‐H, Fixed, 95% CI) | 4.89 [0.24, 101.21] |
| 9.2 Urinary tract infection | 1 | 366 | Risk Ratio (M‐H, Fixed, 95% CI) | 1.96 [0.36, 10.55] |
| 10 Requirement for further surgical treatment (within 12 months) Show forest plot | 2 | 388 | Risk Ratio (M‐H, Fixed, 95% CI) | 0.84 [0.55, 1.29] |
| Outcome or subgroup title | No. of studies | No. of participants | Statistical method | Effect size |
| 1 Bleeding ‐ amenorrhoea rate at 12 months' follow‐up Show forest plot | 1 | 182 | Risk Ratio (M‐H, Fixed, 95% CI) | 0.90 [0.73, 1.12] |
| 1.1 Amenorrhoea rate at 12 months' follow‐up | 1 | 91 | Risk Ratio (M‐H, Fixed, 95% CI) | 0.76 [0.46, 1.24] |
| 1.2 Amenorrhea/hypomenorrhoea rate at 12 months' follow‐up | 1 | 91 | Risk Ratio (M‐H, Fixed, 95% CI) | 0.99 [0.80, 1.22] |
| 2 Bleeding ‐ PBAC score at 12 months Show forest plot | 1 | 91 | Mean Difference (IV, Fixed, 95% CI) | ‐5.0 [‐19.18, 9.18] |
| 3 Rate of satisfaction at 12 months (very/moderately) Show forest plot | 1 | 91 | Risk Ratio (M‐H, Fixed, 95% CI) | 1.03 [0.93, 1.14] |
| 4 Duration of operation (minutes) Show forest plot | 1 | 91 | Mean Difference (IV, Fixed, 95% CI) | ‐1.50 [‐2.65, ‐0.35] |
| 5 Operative difficulties Show forest plot | 1 | Risk Ratio (M‐H, Fixed, 95% CI) | Subtotals only | |
| 5.1 Difficulty with surgery (moderate or severe) | 1 | 91 | Risk Ratio (M‐H, Fixed, 95% CI) | 0.29 [0.10, 0.82] |
| 6 Complication rate: major complications Show forest plot | 1 | 91 | Mean Difference (IV, Fixed, 95% CI) | ‐258.0 [‐342.05, ‐173.95] |
| 6.1 Degree of fluid deficit (mL) | 1 | 91 | Mean Difference (IV, Fixed, 95% CI) | ‐258.0 [‐342.05, ‐173.95] |
| Outcome or subgroup title | No. of studies | No. of participants | Statistical method | Effect size |
| 1 Duration of operation (minutes) Show forest plot | 1 | 45 | Mean Difference (IV, Fixed, 95% CI) | ‐1.10 [‐2.92, 0.72] |
| 2 Complication rate: major complications Show forest plot | 1 | Risk Ratio (M‐H, Fixed, 95% CI) | Subtotals only | |
| 2.1 Fluid deficit | 1 | 120 | Risk Ratio (M‐H, Fixed, 95% CI) | 0.32 [0.01, 7.76] |
| 2.2 Perforation | 1 | 120 | Risk Ratio (M‐H, Fixed, 95% CI) | 0.32 [0.01, 7.76] |
| 3 Requirement for further surgery Show forest plot | 1 | Risk Ratio (M‐H, Fixed, 95% CI) | Subtotals only | |
| 3.1 At 2 years' follow‐up hysterectomy or ablation | 1 | 120 | Risk Ratio (M‐H, Fixed, 95% CI) | 1.04 [0.55, 1.95] |
| 3.2 At 2 years' follow‐up (hysterectomy only) | 1 | 120 | Risk Ratio (M‐H, Fixed, 95% CI) | 1.45 [0.43, 4.88] |
| 3.3 At 2 to 5 years' follow‐up (hysterectomy or ablation) | 1 | 120 | Risk Ratio (M‐H, Fixed, 95% CI) | 1.21 [0.70, 2.10] |
| 3.4 At 2 to 5 years' follow‐up (hysterectomy only) | 1 | 120 | Risk Ratio (M‐H, Fixed, 95% CI) | 1.21 [0.51, 2.85] |
| 3.5 At more than 5 years' follow‐up (hysterectomy or ablation) | 1 | 120 | Risk Ratio (M‐H, Fixed, 95% CI) | 1.39 [0.82, 2.36] |
| 3.6 At more than 5 years' follow‐up (hysterectomy only) | 1 | 120 | Risk Ratio (M‐H, Fixed, 95% CI) | 1.32 [0.66, 2.63] |
| Outcome or subgroup title | No. of studies | No. of participants | Statistical method | Effect size |
| 1 Bleeding ‐ amenorrhoea rate Show forest plot | 1 | Risk Ratio (M‐H, Fixed, 95% CI) | Subtotals only | |
| 1.1 At 1 year follow‐up | 1 | 111 | Risk Ratio (M‐H, Fixed, 95% CI) | 2.46 [1.50, 4.03] |
| 1.2 At 2 to 5 years' follow‐up | 1 | 111 | Risk Ratio (M‐H, Fixed, 95% CI) | 2.49 [1.48, 4.21] |
| 2 Rate of satisfaction Show forest plot | 1 | Risk Ratio (M‐H, Fixed, 95% CI) | Subtotals only | |
| 2.1 At 1 year follow‐up | 1 | 111 | Risk Ratio (M‐H, Fixed, 95% CI) | 1.04 [0.94, 1.16] |
| 2.2 At 2 to 5 years' follow‐up | 1 | 111 | Risk Ratio (M‐H, Fixed, 95% CI) | 1.02 [0.91, 1.14] |
| 3 Duration of operation Show forest plot | 1 | 111 | Mean Difference (IV, Fixed, 95% CI) | ‐9.30 [‐11.36, ‐7.24] |
| 4 Complication rate: major complications Show forest plot | 1 | Risk Ratio (M‐H, Fixed, 95% CI) | Subtotals only | |
| 4.1 Perforation | 1 | 111 | Risk Ratio (M‐H, Fixed, 95% CI) | 0.0 [0.0, 0.0] |
| 5 Complication rate: minor complications Show forest plot | 1 | 111 | Odds Ratio (M‐H, Fixed, 95% CI) | 0.48 [0.04, 5.47] |
| 5.1 UTI | 1 | 111 | Odds Ratio (M‐H, Fixed, 95% CI) | 0.48 [0.04, 5.47] |
| 6 Requirement for further surgery rate (hysterectomy only) Show forest plot | 1 | 111 | Risk Ratio (M‐H, Fixed, 95% CI) | 0.59 [0.15, 2.35] |
| 6.1 At 2 to 5 years' follow‐up | 1 | 111 | Risk Ratio (M‐H, Fixed, 95% CI) | 0.59 [0.15, 2.35] |
| Outcome or subgroup title | No. of studies | No. of participants | Statistical method | Effect size |
| 1 Bleeding Show forest plot | 1 | Risk Ratio (M‐H, Fixed, 95% CI) | Subtotals only | |
| 1.1 PBAC ≤ 75 at 1 year follow‐up | 1 | 250 | Risk Ratio (M‐H, Fixed, 95% CI) | 0.94 [0.82, 1.07] |
| 1.2 PBAC ≤ 100 at 1 year follow‐up | 1 | 250 | Risk Ratio (M‐H, Fixed, 95% CI) | 0.96 [0.86, 1.07] |
| 1.3 PBAC ≤ 100 at 2 years' follow‐up | 1 | 225 | Risk Ratio (M‐H, Fixed, 95% CI) | 1.00 [0.92, 1.09] |
| 1.4 PBAC ≤ 100 at 2 to 5 years' follow‐up | 1 | 203 | Risk Ratio (M‐H, Fixed, 95% CI) | 1.03 [0.95, 1.12] |
| 1.5 Amenorrhoea at 1 year follow‐up | 1 | 250 | Risk Ratio (M‐H, Fixed, 95% CI) | 0.79 [0.60, 1.05] |
| 1.6 Amenorrhoea at 2 years' follow‐up | 1 | 225 | Risk Ratio (M‐H, Fixed, 95% CI) | 1.01 [0.75, 1.36] |
| 1.7 Amenorrhoea at 2 to 5 years' follow‐up | 1 | 203 | Risk Ratio (M‐H, Fixed, 95% CI) | 1.17 [0.86, 1.59] |
| 2 Rate of satisfaction Show forest plot | 1 | 203 | Risk Ratio (M‐H, Fixed, 95% CI) | 1.01 [0.96, 1.06] |
| 2.1 At 2 to 5 years' follow‐up | 1 | 203 | Risk Ratio (M‐H, Fixed, 95% CI) | 1.01 [0.96, 1.06] |
| 3 Proportion given local rather than general anaesthesia Show forest plot | 1 | 269 | Risk Ratio (M‐H, Fixed, 95% CI) | 2.02 [1.32, 3.09] |
| 4 Complication rate: major complications Show forest plot | 1 | Risk Ratio (M‐H, Fixed, 95% CI) | Subtotals only | |
| 4.1 Cervical lacerations | 1 | 269 | Risk Ratio (M‐H, Fixed, 95% CI) | 0.09 [0.00, 1.92] |
| 4.2 Haematometra | 1 | 269 | Risk Ratio (M‐H, Fixed, 95% CI) | 0.18 [0.04, 0.93] |
| 4.3 Endometritis | 1 | 269 | Risk Ratio (M‐H, Fixed, 95% CI) | 0.92 [0.08, 10.05] |
| 5 Complication rate: minor complications Show forest plot | 1 | Risk Ratio (M‐H, Fixed, 95% CI) | Subtotals only | |
| 5.1 Abdominal pain (at 2 weeks) | 1 | 269 | Risk Ratio (M‐H, Fixed, 95% CI) | 1.40 [1.03, 1.90] |
| 5.2 Nausea or vomiting | 1 | 269 | Risk Ratio (M‐H, Fixed, 95% CI) | 3.08 [1.36, 6.98] |
| 5.3 Uterine cramping | 1 | 269 | Risk Ratio (M‐H, Fixed, 95% CI) | 1.12 [0.72, 1.74] |
| 5.4 Urinary tract infection | 1 | 269 | Risk Ratio (M‐H, Fixed, 95% CI) | 1.15 [0.23, 5.83] |
| 5.5 First‐degree burn | 1 | 269 | Risk Ratio (M‐H, Fixed, 95% CI) | 2.32 [0.11, 47.89] |
| 6 Requirement for further surgery Show forest plot | 1 | Risk Ratio (M‐H, Fixed, 95% CI) | Subtotals only | |
| 6.1 At 1 year follow‐up (any surgery) | 1 | 269 | Risk Ratio (M‐H, Fixed, 95% CI) | 2.32 [0.11, 47.89] |
| 6.2 At 2 to 5 years' follow‐up (any surgery) | 1 | 262 | Risk Ratio (M‐H, Fixed, 95% CI) | 1.26 [0.58, 2.73] |
| 6.3 At 5 years' follow‐up (hysterectomy only) | 1 | 262 | Risk Ratio (M‐H, Fixed, 95% CI) | 1.54 [0.58, 4.06] |
| Outcome or subgroup title | No. of studies | No. of participants | Statistical method | Effect size |
| 1 Bleeding Show forest plot | 1 | 228 | Risk Ratio (M‐H, Fixed, 95% CI) | 0.50 [0.36, 0.69] |
| 1.1 Amenorrhoea at 1 year follow‐up | 1 | 228 | Risk Ratio (M‐H, Fixed, 95% CI) | 0.50 [0.36, 0.69] |
| 2 Rate of satisfaction Show forest plot | 1 | Risk Ratio (M‐H, Fixed, 95% CI) | Subtotals only | |
| 2.1 At 1 year follow‐up | 1 | 279 | Risk Ratio (M‐H, Fixed, 95% CI) | 1.06 [0.96, 1.17] |
| 2.2 At 2 years' follow‐up | 1 | 137 | Risk Ratio (M‐H, Fixed, 95% CI) | 1.04 [0.91, 1.17] |
| 3 Proportion given local anaesthesia (%) Show forest plot | 1 | 279 | Risk Ratio (M‐H, Fixed, 95% CI) | 6.62 [3.22, 13.63] |
| 4 Complication rate: major complications Show forest plot | 1 | Risk Ratio (M‐H, Fixed, 95% CI) | Subtotals only | |
| 4.1 Perforation | 1 | 279 | Risk Ratio (M‐H, Fixed, 95% CI) | 0.15 [0.01, 3.63] |
| 5 Complication rate: minor complications Show forest plot | 1 | 1116 | Odds Ratio (M‐H, Fixed, 95% CI) | 0.56 [0.15, 2.09] |
| 5.1 Vaginal bleeding | 1 | 279 | Odds Ratio (M‐H, Fixed, 95% CI) | 1.35 [0.05, 33.43] |
| 5.2 Abdominal cramping | 1 | 279 | Odds Ratio (M‐H, Fixed, 95% CI) | 2.26 [0.11, 47.54] |
| 5.3 UTI | 1 | 279 | Odds Ratio (M‐H, Fixed, 95% CI) | 0.15 [0.01, 3.65] |
| 5.4 Severe pelvic pain | 1 | 279 | Odds Ratio (M‐H, Fixed, 95% CI) | 0.15 [0.01, 3.65] |
| 6 Requirement for further surgery Show forest plot | 1 | Risk Ratio (M‐H, Fixed, 95% CI) | Subtotals only | |
| 6.1 At 2 years' follow‐up (any surgery) | 1 | 279 | Risk Ratio (M‐H, Fixed, 95% CI) | 1.00 [0.45, 2.22] |
| 6.2 At 2 years' follow‐up (hysterectomy) | 1 | 279 | Risk Ratio (M‐H, Fixed, 95% CI) | 0.83 [0.34, 2.00] |
| Outcome or subgroup title | No. of studies | No. of participants | Statistical method | Effect size |
| 1 Bleeding ‐ amenorrhoea rate at 1 year follow‐up Show forest plot | 2 | 470 | Risk Ratio (M‐H, Fixed, 95% CI) | 1.02 [0.79, 1.31] |
| 1.1 Balloon system | 1 | 234 | Risk Ratio (M‐H, Fixed, 95% CI) | 0.89 [0.62, 1.29] |
| 1.2 Mesh system | 1 | 236 | Risk Ratio (M‐H, Fixed, 95% CI) | 1.16 [0.82, 1.64] |
| 2 Proportion with successful Rx (PBAC < 75) Show forest plot | 2 | 470 | Risk Ratio (M‐H, Fixed, 95% CI) | 1.06 [0.98, 1.15] |
| 2.1 Balloon system | 1 | 234 | Risk Ratio (M‐H, Fixed, 95% CI) | 1.05 [0.94, 1.17] |
| 2.2 Mesh system | 1 | 236 | Risk Ratio (M‐H, Fixed, 95% CI) | 1.08 [0.96, 1.22] |
| 3 PBAC score 12 months after treatment Show forest plot | Other data | No numeric data | ||
| 3.1 Balloon system | Other data | No numeric data | ||
| 3.2 Mesh system | Other data | No numeric data | ||
| 4 Rate of satisfaction with treatment at 1 year Show forest plot | 1 | 236 | Risk Ratio (M‐H, Fixed, 95% CI) | 0.99 [0.92, 1.06] |
| 4.1 Mesh system | 1 | 236 | Risk Ratio (M‐H, Fixed, 95% CI) | 0.99 [0.92, 1.06] |
| 5 Duration of operation (minutes) Show forest plot | 2 | 520 | Mean Difference (IV, Fixed, 95% CI) | ‐18.70 [‐20.66, ‐16.75] |
| 5.1 Balloon system | 1 | 255 | Mean Difference (IV, Fixed, 95% CI) | ‐16.20 [‐19.55, ‐12.85] |
| 5.2 Mesh system | 1 | 265 | Mean Difference (IV, Fixed, 95% CI) | ‐20.0 [‐22.41, ‐17.59] |
| 6 Procedure abandon Show forest plot | 1 | 267 | Odds Ratio (M‐H, Fixed, 95% CI) | 2.58 [0.10, 63.95] |
| 7 Proportion given local anaesthesia (%) Show forest plot | 2 | 520 | Risk Ratio (M‐H, Fixed, 95% CI) | 3.85 [2.94, 5.04] |
| 7.1 Balloon system | 1 | 255 | Risk Ratio (M‐H, Fixed, 95% CI) | 3.66 [2.65, 5.07] |
| 7.2 Mesh system | 1 | 265 | Risk Ratio (M‐H, Fixed, 95% CI) | 4.11 [2.61, 6.47] |
| 8 Complication rate: major complications Show forest plot | 2 | Risk Ratio (M‐H, Fixed, 95% CI) | Subtotals only | |
| 8.1 Cervical tear/stenosis | 2 | 532 | Risk Ratio (M‐H, Fixed, 95% CI) | 0.11 [0.01, 0.87] |
| 8.2 Perforation | 2 | 532 | Risk Ratio (M‐H, Fixed, 95% CI) | 0.13 [0.02, 1.01] |
| 8.3 Pelvic abscess | 1 | 265 | Risk Ratio (M‐H, Fixed, 95% CI) | 0.17 [0.01, 4.19] |
| 8.4 Haematometra | 2 | 532 | Risk Ratio (M‐H, Fixed, 95% CI) | 0.43 [0.08, 2.23] |
| 8.5 Fluid overload | 1 | 267 | Risk Ratio (M‐H, Fixed, 95% CI) | 0.29 [0.01, 6.93] |
| 8.6 Myometritis | 1 | 267 | Risk Ratio (M‐H, Fixed, 95% CI) | 0.29 [0.01, 6.93] |
| 8.7 Urinary incontinence | 1 | 267 | Risk Ratio (M‐H, Fixed, 95% CI) | 0.29 [0.01, 6.93] |
| 8.8 PID | 1 | 265 | Risk Ratio (M‐H, Fixed, 95% CI) | 1.03 [0.09, 11.19] |
| 8.9 Endometritis | 1 | 265 | Risk Ratio (M‐H, Fixed, 95% CI) | 0.34 [0.06, 2.01] |
| 9 Complication rate: minor complications Show forest plot | 2 | Risk Ratio (M‐H, Fixed, 95% CI) | Subtotals only | |
| 9.1 Nausea/vomiting or severe pelvic pain | 2 | 532 | Risk Ratio (M‐H, Fixed, 95% CI) | 1.10 [0.37, 3.27] |
| 9.2 UTI | 2 | 532 | Risk Ratio (M‐H, Fixed, 95% CI) | 1.05 [0.39, 2.84] |
| 9.3 Fever | 1 | 267 | Risk Ratio (M‐H, Fixed, 95% CI) | 0.85 [0.05, 13.51] |
| 9.4 Haemorrhage | 1 | 265 | Risk Ratio (M‐H, Fixed, 95% CI) | 0.51 [0.03, 8.13] |
| 9.5 Bradycardia | 1 | 265 | Risk Ratio (M‐H, Fixed, 95% CI) | 1.55 [0.06, 37.70] |
| 10 Requirement for further surgery at 2 years (hysterectomy) Show forest plot | 1 | 255 | Risk Ratio (M‐H, Fixed, 95% CI) | 0.52 [0.18, 1.50] |
| 10.1 Balloon system | 1 | 255 | Risk Ratio (M‐H, Fixed, 95% CI) | 0.52 [0.18, 1.50] |
| Outcome or subgroup title | No. of studies | No. of participants | Statistical method | Effect size |
| 1 Bleeding Show forest plot | 2 | Risk Ratio (M‐H, Fixed, 95% CI) | Subtotals only | |
| 1.1 PBAC < 75 or acceptable improvement at 1 year follow‐up | 2 | 562 | Risk Ratio (M‐H, Fixed, 95% CI) | 1.04 [0.96, 1.13] |
| 1.2 PBAC < 75 or acceptable improvement at 2 to 5 years' follow‐up | 1 | 236 | Risk Ratio (M‐H, Fixed, 95% CI) | 1.12 [0.97, 1.28] |
| 1.3 PBAC < 75 or acceptable improvement at > 5 years' follow‐up | 1 | 263 | Risk Ratio (M‐H, Fixed, 95% CI) | 1.08 [0.87, 1.34] |
| 1.4 Amenorrhoea at 1 year follow‐up | 2 | 562 | Risk Ratio (M‐H, Fixed, 95% CI) | 1.12 [0.93, 1.36] |
| 1.5 Amenorrhoea at 2 years' follow‐up | 1 | 249 | Risk Ratio (M‐H, Fixed, 95% CI) | 1.16 [0.87, 1.53] |
| 1.6 Amenorrhoea at 2 to 5 years' follow‐up | 1 | 236 | Risk Ratio (M‐H, Fixed, 95% CI) | 0.93 [0.78, 1.12] |
| 1.7 Amenorrhoea at > 5 years' follow‐up | 1 | 189 | Risk Ratio (M‐H, Fixed, 95% CI) | 0.94 [0.83, 1.05] |
| 2 Rate of satisfaction Show forest plot | 2 | Risk Ratio (M‐H, Fixed, 95% CI) | Subtotals only | |
| 2.1 At 1 year follow‐up | 2 | 533 | Risk Ratio (M‐H, Fixed, 95% CI) | 1.01 [0.95, 1.07] |
| 2.2 At 2 years' follow‐up | 1 | 249 | Risk Ratio (M‐H, Fixed, 95% CI) | 1.19 [1.02, 1.38] |
| 2.3 At 2 to 5 years' follow‐up | 1 | 236 | Risk Ratio (M‐H, Fixed, 95% CI) | 1.19 [1.04, 1.36] |
| 2.4 At 10 years' follow‐up | 1 | 189 | Risk Ratio (M‐H, Fixed, 95% CI) | 1.11 [0.95, 1.30] |
| 3 Duration of operation (minutes) Show forest plot | Other data | No numeric data | ||
| 4 Operative difficulties Show forest plot | 1 | Risk Ratio (M‐H, Fixed, 95% CI) | Subtotals only | |
| 4.1 Equipment failure | 1 | 263 | Risk Ratio (M‐H, Fixed, 95% CI) | 3.81 [1.09, 13.34] |
| 4.2 Procedure abandoned | 1 | 263 | Risk Ratio (M‐H, Fixed, 95% CI) | 1.04 [0.31, 3.50] |
| 5 Proportion given local anaesthesia Show forest plot | 1 | 315 | Risk Ratio (M‐H, Fixed, 95% CI) | 2.54 [1.73, 3.72] |
| 6 Duration of hospital stay (hours) Show forest plot | Other data | No numeric data | ||
| 7 Inability to work (proportion of women) Show forest plot | 1 | Risk Ratio (M‐H, Fixed, 95% CI) | Subtotals only | |
| 7.1 At 12 months' follow‐up | 1 | 240 | Risk Ratio (M‐H, Fixed, 95% CI) | 0.53 [0.17, 1.73] |
| 7.2 At > 5 years' follow‐up | 1 | 189 | Risk Ratio (M‐H, Fixed, 95% CI) | 1.52 [0.26, 8.87] |
| 8 Quality of life ‐ change in SF‐36 score after treatment Show forest plot | Other data | No numeric data | ||
| 8.1 Physical functioning | Other data | No numeric data | ||
| 8.2 Social functioning | Other data | No numeric data | ||
| 8.3 Physical role | Other data | No numeric data | ||
| 8.4 Emotional role | Other data | No numeric data | ||
| 8.5 Mental health | Other data | No numeric data | ||
| 8.6 Energy/fatigue | Other data | No numeric data | ||
| 8.7 Pain | Other data | No numeric data | ||
| 8.8 General health | Other data | No numeric data | ||
| 9 Improvement in other menstrual symptoms: PMS Show forest plot | 1 | Risk Ratio (M‐H, Fixed, 95% CI) | Subtotals only | |
| 9.1 At 1 year follow‐up | 1 | 240 | Risk Ratio (M‐H, Fixed, 95% CI) | 1.03 [0.90, 1.19] |
| 9.2 At 2 to 5 years' follow‐up | 1 | 236 | Risk Ratio (M‐H, Fixed, 95% CI) | 1.12 [0.97, 1.28] |
| 10 Improvement in other menstrual symptoms Show forest plot | 2 | Risk Ratio (M‐H, Fixed, 95% CI) | Subtotals only | |
| 10.1 Improvement in dysmenorrhoea at 1 year follow‐up | 2 | 533 | Risk Ratio (M‐H, Fixed, 95% CI) | 0.98 [0.89, 1.09] |
| 10.2 Improvement in dysmenorrhoea at 2 years' follow‐up | 1 | 249 | Risk Ratio (M‐H, Fixed, 95% CI) | 1.05 [0.93, 1.19] |
| 11 Reduction in pain score (points) Show forest plot | 1 | 189 | Mean Difference (IV, Fixed, 95% CI) | ‐0.80 [‐4.32, 2.72] |
| 11.1 At > 5 years' follow‐up | 1 | 189 | Mean Difference (IV, Fixed, 95% CI) | ‐0.80 [‐4.32, 2.72] |
| 12 Postoperative analgesia rate Show forest plot | 1 | 263 | Risk Ratio (M‐H, Fixed, 95% CI) | 0.94 [0.81, 1.10] |
| 13 Complication rate: major complications Show forest plot | 2 | Risk Ratio (M‐H, Fixed, 95% CI) | Subtotals only | |
| 13.1 Perforation | 2 | 585 | Risk Ratio (M‐H, Fixed, 95% CI) | 1.63 [0.22, 12.12] |
| 13.2 Cervical laceration | 1 | 322 | Risk Ratio (M‐H, Fixed, 95% CI) | 0.50 [0.07, 3.48] |
| 13.3 Cervical stenosis | 1 | 322 | Risk Ratio (M‐H, Fixed, 95% CI) | 1.5 [0.06, 36.52] |
| 13.4 Endometritis | 1 | 322 | Risk Ratio (M‐H, Fixed, 95% CI) | 6.5 [0.37, 114.31] |
| 14 Complication rate: minor complications Show forest plot | 2 | Risk Ratio (M‐H, Fixed, 95% CI) | Subtotals only | |
| 14.1 Chills | 1 | 322 | Risk Ratio (M‐H, Fixed, 95% CI) | 1.35 [0.59, 3.11] |
| 14.2 Bloating | 1 | 322 | Risk Ratio (M‐H, Fixed, 95% CI) | 0.83 [0.38, 1.83] |
| 14.3 Dysuria | 1 | 322 | Risk Ratio (M‐H, Fixed, 95% CI) | 0.77 [0.37, 1.58] |
| 14.4 Fever | 1 | 322 | Risk Ratio (M‐H, Fixed, 95% CI) | 2.5 [0.12, 51.62] |
| 14.5 Headache | 1 | 322 | Risk Ratio (M‐H, Fixed, 95% CI) | 0.75 [0.22, 2.59] |
| 14.6 Nausea | 1 | 322 | Risk Ratio (M‐H, Fixed, 95% CI) | 1.35 [0.83, 2.21] |
| 14.7 Vomiting | 1 | 322 | Risk Ratio (M‐H, Fixed, 95% CI) | 3.61 [1.30, 10.00] |
| 14.8 UTI | 1 | 322 | Risk Ratio (M‐H, Fixed, 95% CI) | 0.50 [0.03, 7.88] |
| 14.9 Vaginal infection | 1 | 322 | Risk Ratio (M‐H, Fixed, 95% CI) | 1.5 [0.06, 36.52] |
| 14.10 Uterine cramping | 1 | 322 | Risk Ratio (M‐H, Fixed, 95% CI) | 1.21 [1.01, 1.44] |
| 14.11 Abdominal tenderness | 1 | 322 | Risk Ratio (M‐H, Fixed, 95% CI) | 0.61 [0.26, 1.42] |
| 14.12 Haemorrhage | 1 | 263 | Risk Ratio (M‐H, Fixed, 95% CI) | 0.09 [0.01, 1.69] |
| 15 Requirement for further surgery Show forest plot | 2 | Risk Ratio (M‐H, Fixed, 95% CI) | Subtotals only | |
| 15.1 At 1 year follow‐up (any surgery) | 1 | 240 | Risk Ratio (M‐H, Fixed, 95% CI) | 0.82 [0.38, 1.80] |
| 15.2 At 1 year follow‐up (hysterectomy only) | 2 | 562 | Risk Ratio (M‐H, Fixed, 95% CI) | 0.77 [0.35, 1.70] |
| 15.3 At 2 years' follow‐up (any surgery) | 1 | 249 | Risk Ratio (M‐H, Fixed, 95% CI) | 0.97 [0.55, 1.72] |
| 15.4 At 2 years' follow‐up (hysterectomy only) | 1 | 249 | Risk Ratio (M‐H, Fixed, 95% CI) | 0.95 [0.50, 1.81] |
| 15.5 At 5 years' follow‐up (ablation or hysterectomy) | 1 | 263 | Risk Ratio (M‐H, Fixed, 95% CI) | 0.85 [0.56, 1.27] |
| 15.6 At 5 years' follow‐up (hysterectomy only) | 1 | 263 | Risk Ratio (M‐H, Fixed, 95% CI) | 0.63 [0.38, 1.04] |
| 15.7 At 10 years' follow‐up (ablation or hysterectomy) | 1 | 263 | Risk Ratio (M‐H, Fixed, 95% CI) | 0.84 [0.57, 1.23] |
| 15.8 At 10 years' follow‐up (hysterectomy only) | 1 | 263 | Risk Ratio (M‐H, Fixed, 95% CI) | 0.60 [0.38, 0.96] |
| Outcome or subgroup title | No. of studies | No. of participants | Statistical method | Effect size |
| 1 Bleeding Show forest plot | 2 | Risk Ratio (M‐H, Fixed, 95% CI) | Subtotals only | |
| 1.1 Amenorrhoea at 1 year follow‐up | 2 | 259 | Risk Ratio (M‐H, Fixed, 95% CI) | 0.62 [0.39, 1.00] |
| 1.2 Amenorrhoea at 2 years' follow‐up | 1 | 227 | Risk Ratio (M‐H, Fixed, 95% CI) | 0.60 [0.33, 1.07] |
| 1.3 Amenorrhoea at 2 to 5 years' follow‐up | 1 | 122 | Risk Ratio (M‐H, Fixed, 95% CI) | 0.7 [0.39, 1.25] |
| 1.4 Amenorrhoea/eumenorrhoea rate at 1 year follow‐up | 2 | 259 | Risk Ratio (M‐H, Fixed, 95% CI) | 0.95 [0.86, 1.06] |
| 1.5 Amenorrhoea/eumenorrhoea rate at 2 years' follow‐up | 1 | 227 | Risk Ratio (M‐H, Fixed, 95% CI) | 0.99 [0.91, 1.08] |
| 1.6 Amenorrhoea/eumenorrhoea rate at 2 to 5 years' follow‐up | 1 | 122 | Risk Ratio (M‐H, Fixed, 95% CI) | 0.98 [0.91, 1.06] |
| 2 PBAC score after treatment Show forest plot | Other data | No numeric data | ||
| 2.1 At 1 year follow‐up | Other data | No numeric data | ||
| 2.2 At 2 years' follow‐up | Other data | No numeric data | ||
| 3 Success of treatment (lighter periods and no further surgery) Show forest plot | 1 | Risk Ratio (M‐H, Fixed, 95% CI) | Subtotals only | |
| 3.1 At 2 to 5 years' follow‐up | 1 | 170 | Risk Ratio (M‐H, Fixed, 95% CI) | 0.98 [0.80, 1.20] |
| 4 Success of treatment (menstrual score < 185) Show forest plot | 1 | Risk Ratio (M‐H, Fixed, 95% CI) | Subtotals only | |
| 4.1 At 1 year follow‐up | 1 | 129 | Risk Ratio (M‐H, Fixed, 95% CI) | 1.00 [0.83, 1.20] |
| 4.2 At 2 years' follow‐up | 1 | 121 | Risk Ratio (M‐H, Fixed, 95% CI) | 1.01 [0.83, 1.23] |
| 5 Rate of satisfaction Show forest plot | 3 | Risk Ratio (M‐H, Fixed, 95% CI) | Subtotals only | |
| 5.1 At 1 year follow‐up | 2 | 259 | Risk Ratio (M‐H, Fixed, 95% CI) | 0.97 [0.93, 1.01] |
| 5.2 At 2 years' follow‐up | 2 | 348 | Risk Ratio (M‐H, Fixed, 95% CI) | 1.02 [0.93, 1.12] |
| 5.3 At 2 to 5 years' follow‐up | 1 | 122 | Risk Ratio (M‐H, Fixed, 95% CI) | 0.93 [0.87, 1.01] |
| 6 Duration of operation (minutes) Show forest plot | 2 | 378 | Mean Difference (IV, Fixed, 95% CI) | ‐14.58 [‐15.00, ‐12.17] |
| 7 Operative difficulties Show forest plot | 1 | 139 | Risk Ratio (M‐H, Fixed, 95% CI) | 1.05 [0.49, 2.22] |
| 7.1 Technical complication rate | 1 | 139 | Risk Ratio (M‐H, Fixed, 95% CI) | 1.05 [0.49, 2.22] |
| 8 Inability to work (proportion of women) Show forest plot | 1 | Risk Ratio (M‐H, Fixed, 95% CI) | Subtotals only | |
| 8.1 At 1 year follow‐up | 1 | 239 | Risk Ratio (M‐H, Fixed, 95% CI) | 1.52 [0.37, 6.22] |
| 8.2 At 2 years' follow‐up | 1 | 227 | Risk Ratio (M‐H, Fixed, 95% CI) | 0.29 [0.03, 2.72] |
| 8.3 At 2 to 5 years' follow‐up | 1 | 210 | Risk Ratio (M‐H, Fixed, 95% CI) | 0.87 [0.26, 2.93] |
| 9 Improvement in other menstrual symptoms Show forest plot | 1 | Risk Ratio (M‐H, Fixed, 95% CI) | Subtotals only | |
| 9.1 Improvement in dysmenorrhoea at 12 months | 1 | 239 | Risk Ratio (M‐H, Fixed, 95% CI) | 0.93 [0.80, 1.09] |
| 9.2 Improvement in premenstrual symptoms (from moderate/severe) at 1 year follow‐up | 1 | 185 | Risk Ratio (M‐H, Fixed, 95% CI) | 0.94 [0.74, 1.19] |
| 9.3 Improvement in premenstrual symptoms (from moderate/severe) at 2 years follow up | 1 | 177 | Risk Ratio (M‐H, Fixed, 95% CI) | 1.03 [0.82, 1.29] |
| 9.4 Improvement in premenstrual symptoms (from moderate/severe) at 2 to 5 years' follow‐up | 1 | 166 | Risk Ratio (M‐H, Fixed, 95% CI) | 0.99 [0.75, 1.30] |
| 10 Complication rate: major complications Show forest plot | 2 | Risk Ratio (M‐H, Fixed, 95% CI) | Subtotals only | |
| 10.1 Fluid overload | 1 | 239 | Risk Ratio (M‐H, Fixed, 95% CI) | 0.18 [0.01, 3.76] |
| 10.2 Perforation | 2 | 378 | Risk Ratio (M‐H, Fixed, 95% CI) | 0.17 [0.02, 1.42] |
| 10.3 Cervical lacerations | 2 | 378 | Risk Ratio (M‐H, Fixed, 95% CI) | 0.17 [0.02, 1.42] |
| 10.4 Endometritis | 1 | 239 | Risk Ratio (M‐H, Fixed, 95% CI) | 2.74 [0.29, 25.93] |
| 10.5 Haematometra | 1 | 239 | Risk Ratio (M‐H, Fixed, 95% CI) | 0.30 [0.01, 7.39] |
| 11 Complication rate: minor complications Show forest plot | 2 | 895 | Odds Ratio (M‐H, Fixed, 95% CI) | 0.99 [0.32, 3.12] |
| 11.1 UTI | 1 | 239 | Odds Ratio (M‐H, Fixed, 95% CI) | 2.76 [0.11, 68.41] |
| 11.2 Hydrosalpinx | 1 | 239 | Odds Ratio (M‐H, Fixed, 95% CI) | 0.30 [0.01, 7.47] |
| 11.3 Pain | 1 | 139 | Odds Ratio (M‐H, Fixed, 95% CI) | 5.87 [0.30, 115.87] |
| 11.4 Nausea | 1 | 139 | Odds Ratio (M‐H, Fixed, 95% CI) | 0.26 [0.01, 6.61] |
| 11.5 Infection | 1 | 139 | Odds Ratio (M‐H, Fixed, 95% CI) | 0.26 [0.01, 6.61] |
| 12 Requirement for further surgery Show forest plot | 2 | Risk Ratio (M‐H, Fixed, 95% CI) | Subtotals only | |
| 12.1 At 1 year follow‐up (any surgery) | 1 | 239 | Risk Ratio (M‐H, Fixed, 95% CI) | 0.61 [0.10, 3.57] |
| 12.2 At 2 years' follow‐up (any surgery) | 2 | 392 | Risk Ratio (M‐H, Fixed, 95% CI) | 0.67 [0.35, 1.28] |
| 12.3 At 2 to 5 years' follow‐up (any surgery) | 1 | 122 | Risk Ratio (M‐H, Fixed, 95% CI) | 1.0 [0.64, 1.55] |
| 12.4 At 2 years' follow‐up (hysterectomy) | 1 | 137 | Risk Ratio (M‐H, Fixed, 95% CI) | 1.04 [0.38, 2.83] |
| 12.5 At 2 to 5 years' follow‐up (hysterectomy) | 1 | 122 | Risk Ratio (M‐H, Fixed, 95% CI) | 1.0 [0.61, 1.63] |
| Outcome or subgroup title | No. of studies | No. of participants | Statistical method | Effect size |
| 1 Bleeding Show forest plot | 1 | Risk Ratio (M‐H, Fixed, 95% CI) | Subtotals only | |
| 1.1 Amenorrhoea at 6 months' follow‐up | 1 | 70 | Risk Ratio (M‐H, Fixed, 95% CI) | 1.11 [0.61, 2.02] |
| 1.2 Amenorrhoea at 12 months' follow‐up | 1 | 67 | Risk Ratio (M‐H, Fixed, 95% CI) | 0.75 [0.38, 1.46] |
| 2 PBAC score after treatment Show forest plot | Other data | No numeric data | ||
| 2.1 At 6 months' follow‐up | Other data | No numeric data | ||
| 3 Rate of satisfaction Show forest plot | 1 | Risk Ratio (M‐H, Fixed, 95% CI) | Subtotals only | |
| 3.1 At 6 months' follow‐up | 1 | 69 | Risk Ratio (M‐H, Fixed, 95% CI) | 1.04 [0.91, 1.20] |
| 3.2 At 12 months' follow‐up | 1 | 57 | Risk Ratio (M‐H, Fixed, 95% CI) | 0.97 [0.86, 1.09] |
| 4 Operative difficulties Show forest plot | 1 | 70 | Risk Ratio (M‐H, Fixed, 95% CI) | 4.47 [0.22, 89.94] |
| 4.1 Failure of equipment | 1 | 70 | Risk Ratio (M‐H, Fixed, 95% CI) | 4.47 [0.22, 89.94] |
| 5 Pain score 4 hours post procedure Show forest plot | 1 | 70 | Mean Difference (IV, Fixed, 95% CI) | 32.7 [23.72, 41.68] |
| 6 Quality of life Show forest plot | 1 | Mean Difference (IV, Fixed, 95% CI) | Subtotals only | |
| 6.1 EQ‐5D at 6 months' follow‐up | 1 | 70 | Mean Difference (IV, Fixed, 95% CI) | 0.01 [‐0.11, 0.13] |
| 6.2 EQ‐5D VAS at 6 months' follow‐up | 1 | 70 | Mean Difference (IV, Fixed, 95% CI) | 1.20 [‐5.95, 8.35] |
| 6.3 SF‐12 physical scale at 6 months' follow‐up | 1 | 70 | Mean Difference (IV, Fixed, 95% CI) | 1.70 [‐2.18, 5.58] |
| 6.4 SF‐12 mental scale at 6 months' follow‐up | 1 | 70 | Mean Difference (IV, Fixed, 95% CI) | 3.40 [‐0.42, 7.22] |
| 6.5 SAQ pleasure scale at 6 months' follow‐up | 1 | 70 | Mean Difference (IV, Fixed, 95% CI) | 0.5 [‐1.30, 2.30] |
| 6.6 SAQ habit scale at 6 months' follow‐up | 1 | 70 | Mean Difference (IV, Fixed, 95% CI) | ‐0.16 [‐0.42, 0.10] |
| 6.7 SAQ discomfort scale at 6 months' follow‐up | 1 | 70 | Mean Difference (IV, Fixed, 95% CI) | ‐0.14 [‐0.98, 0.70] |
| 6.8 EQ‐5D at 12 months' follow‐up | 1 | 67 | Mean Difference (IV, Fixed, 95% CI) | ‐0.01 [‐0.13, 0.11] |
| 6.9 EQ‐5D VAS at 12 months' follow‐up | 1 | 67 | Mean Difference (IV, Fixed, 95% CI) | 10.10 [2.43, 17.77] |
| 6.10 SF‐12 physical scale at 12 months' follow‐up | 1 | 67 | Mean Difference (IV, Fixed, 95% CI) | ‐0.20 [‐3.89, 3.49] |
| 6.11 SF‐12 mental scale at 12 months' follow‐up | 1 | 67 | Mean Difference (IV, Fixed, 95% CI) | 2.10 [‐2.04, 6.24] |
| 6.12 SAQ pleasure scale at 12 months' follow‐up | 1 | 67 | Mean Difference (IV, Fixed, 95% CI) | ‐0.60 [‐2.68, 1.48] |
| 6.13 SAQ habit scale at 12 months' follow‐up | 1 | 67 | Mean Difference (IV, Fixed, 95% CI) | ‐0.09 [‐0.27, 0.09] |
| 6.14 SAQ discomfort scale at 12 months' follow‐up | 1 | 67 | Mean Difference (IV, Fixed, 95% CI) | 0.10 [‐0.67, 0.87] |
| 7 Improvement in other menstrual symptoms Show forest plot | Other data | No numeric data | ||
| 7.1 PMS at 6 months' follow‐up | Other data | No numeric data | ||
| 7.2 PMS at 12 months' follow‐up | Other data | No numeric data | ||
| 8 Improvement in other menstrual symptoms: dysmenorrhoea (visual analogue) Show forest plot | Other data | No numeric data | ||
| 8.1 Dysmenorrhoea at 6 months' follow‐up | Other data | No numeric data | ||
| 8.2 Dysmenorrhoea at 12 months' follow‐up | Other data | No numeric data | ||
| 9 Requirement for further surgery Show forest plot | 1 | Risk Ratio (M‐H, Fixed, 95% CI) | Subtotals only | |
| 9.1 At 12 months' follow‐up | 1 | 67 | Risk Ratio (M‐H, Fixed, 95% CI) | 0.78 [0.23, 2.64] |
| Outcome or subgroup title | No. of studies | No. of participants | Statistical method | Effect size |
| 1 Bleeding Show forest plot | 1 | Risk Ratio (M‐H, Fixed, 95% CI) | Subtotals only | |
| 1.1 Amenorrhoea at 6 months' follow‐up | 1 | 49 | Risk Ratio (M‐H, Fixed, 95% CI) | 0.95 [0.31, 2.93] |
| 1.2 Amenorrhoea at 12 months' follow‐up | 1 | 45 | Risk Ratio (M‐H, Fixed, 95% CI) | 1.21 [0.50, 2.95] |
| 2 Rate of satisfaction Show forest plot | 2 | Risk Ratio (M‐H, Fixed, 95% CI) | Subtotals only | |
| 2.1 At 6 months' follow‐up | 1 | 50 | Risk Ratio (M‐H, Fixed, 95% CI) | 1.06 [0.93, 1.20] |
| 2.2 At 12 months' follow‐up | 2 | 122 | Risk Ratio (M‐H, Fixed, 95% CI) | 1.06 [0.96, 1.18] |
| 2.3 At 2 years' follow‐up | 1 | 68 | Risk Ratio (M‐H, Fixed, 95% CI) | 1.35 [1.06, 1.72] |
| 3 Duration of operation (minutes) Show forest plot | 1 | 82 | Mean Difference (IV, Fixed, 95% CI) | ‐13.0 [‐15.20, ‐10.80] |
| 4 Duration of operation (minutes) Show forest plot | Other data | No numeric data | ||
| 5 Operative difficulties Show forest plot | 1 | 51 | Risk Ratio (M‐H, Fixed, 95% CI) | 7.22 [0.42, 123.83] |
| 5.1 Equipment failure | 1 | 51 | Risk Ratio (M‐H, Fixed, 95% CI) | 7.22 [0.42, 123.83] |
| 6 Postoperative pain (continuous data) Show forest plot | 1 | 82 | Mean Difference (IV, Fixed, 95% CI) | ‐0.60 [‐0.88, ‐0.32] |
| 7 Postoperative pain (descriptive data) Show forest plot | Other data | No numeric data | ||
| 8 Hospital stay (days) Show forest plot | 1 | 82 | Mean Difference (IV, Fixed, 95% CI) | ‐0.30 [‐0.52, ‐0.08] |
| 9 Duration of hospital stay (hours) Show forest plot | Other data | No numeric data | ||
| 10 Return to normal activities (days) Show forest plot | 1 | 82 | Mean Difference (IV, Fixed, 95% CI) | ‐2.10 [‐3.38, ‐0.82] |
| 11 Return to normal activities (days) Show forest plot | Other data | No numeric data | ||
| 12 Complication rate: major complications Show forest plot | 1 | Risk Ratio (M‐H, Fixed, 95% CI) | Subtotals only | |
| 12.1 Fluid overload | 1 | 82 | Risk Ratio (M‐H, Fixed, 95% CI) | 0.10 [0.01, 1.67] |
| 12.2 Cervical tear | 1 | 82 | Risk Ratio (M‐H, Fixed, 95% CI) | 0.35 [0.01, 8.34] |
| 12.3 Conversion to hysterectomy | 1 | 88 | Risk Ratio (M‐H, Fixed, 95% CI) | 0.24 [0.01, 4.84] |
| 12.4 Blood transfusion | 1 | 82 | Risk Ratio (M‐H, Fixed, 95% CI) | 5.24 [0.26, 105.97] |
| 13 Complication rate: minor complications Show forest plot | 1 | 82 | Mean Difference (IV, Fixed, 95% CI) | ‐81.8 [‐93.33, ‐70.27] |
| 13.1 Blood loss | 1 | 82 | Mean Difference (IV, Fixed, 95% CI) | ‐81.8 [‐93.33, ‐70.27] |
| 14 Complication rate: minor complications (dichotomous) Show forest plot | 1 | Risk Ratio (M‐H, Fixed, 95% CI) | Subtotals only | |
| 14.1 Fever | 1 | 82 | Risk Ratio (M‐H, Fixed, 95% CI) | 0.53 [0.05, 5.57] |
| 14.2 Urinary infection or retention | 1 | 82 | Risk Ratio (M‐H, Fixed, 95% CI) | 0.35 [0.01, 8.34] |
| 14.3 Haemorrhage | 1 | 82 | Risk Ratio (M‐H, Fixed, 95% CI) | 1.31 [0.38, 4.54] |
| 15 Requirement for further surgery Show forest plot | 2 | Risk Ratio (M‐H, Fixed, 95% CI) | Subtotals only | |
| 15.1 At 12 months' follow‐up (ablation and hysterectomy) | 1 | 75 | Risk Ratio (M‐H, Fixed, 95% CI) | 0.51 [0.10, 2.64] |
| 15.2 At 2 years' follow‐up (ablation and hysterectomy) | 1 | 68 | Risk Ratio (M‐H, Fixed, 95% CI) | 0.38 [0.08, 1.81] |
| 15.3 At 12 months' follow‐up (hysterectomy only) | 1 | 45 | Risk Ratio (M‐H, Fixed, 95% CI) | 0.12 [0.01, 2.44] |
| Outcome or subgroup title | No. of studies | No. of participants | Statistical method | Effect size |
| 1 Bleeding Show forest plot | 4 | Risk Ratio (M‐H, Fixed, 95% CI) | Subtotals only | |
| 1.1 Amenorrhoea at 6 months' follow‐up | 3 | 283 | Risk Ratio (M‐H, Fixed, 95% CI) | 3.37 [2.09, 5.44] |
| 1.2 Amenorrhoea at 12 months' follow‐up | 4 | 335 | Risk Ratio (M‐H, Fixed, 95% CI) | 3.12 [2.06, 4.72] |
| 1.3 Amenorrhoea at 2 to 5 years' follow‐up | 1 | 120 | Risk Ratio (M‐H, Fixed, 95% CI) | 1.56 [0.93, 2.64] |
| 1.4 Amenorrhoea at 10 years' follow‐up | 1 | 104 | Risk Ratio (M‐H, Fixed, 95% CI) | 1.10 [0.83, 1.46] |
| 2 PBAC score after treatment Show forest plot | Other data | No numeric data | ||
| 2.1 At 6 months' follow‐up | Other data | No numeric data | ||
| 2.2 At 12 months' follow‐up | Other data | No numeric data | ||
| 3 Rate of satisfaction Show forest plot | 4 | Risk Ratio (M‐H, Fixed, 95% CI) | Subtotals only | |
| 3.1 At 6 months' follow‐up | 2 | 181 | Risk Ratio (M‐H, Fixed, 95% CI) | 1.08 [0.94, 1.24] |
| 3.2 At 12 months' follow‐up | 4 | 334 | Risk Ratio (M‐H, Fixed, 95% CI) | 1.14 [1.04, 1.26] |
| 3.3 At 10 years' follow‐up | 1 | 104 | Risk Ratio (M‐H, Fixed, 95% CI) | 1.05 [0.85, 1.30] |
| 4 Duration of operation Show forest plot | Other data | No numeric data | ||
| 5 Operative difficulties Show forest plot | 1 | Risk Ratio (M‐H, Fixed, 95% CI) | Subtotals only | |
| 5.1 Technical complication rate | 1 | 55 | Risk Ratio (M‐H, Fixed, 95% CI) | 0.73 [0.13, 3.99] |
| 6 Completion of procedure Show forest plot | 1 | 81 | Risk Ratio (M‐H, Fixed, 95% CI) | 1.05 [0.97, 1.15] |
| 7 Time taken off work (days) Show forest plot | Other data | No numeric data | ||
| 8 Time to resume normal activities (days) Show forest plot | Other data | No numeric data | ||
| 9 Quality of life Show forest plot | 3 | 3221 | Mean Difference (IV, Fixed, 95% CI) | 0.00 [‐0.18, 0.19] |
| 9.1 SF‐12 physical scale score at 12 months' follow‐up | 1 | 55 | Mean Difference (IV, Fixed, 95% CI) | 1.60 [‐4.27, 7.47] |
| 9.2 SF‐12 mental scale score at 12 months' follow‐up | 1 | 55 | Mean Difference (IV, Fixed, 95% CI) | 7.5 [‐0.52, 15.52] |
| 9.3 SF‐36 physical function scale score at 6 months' follow‐up | 1 | 90 | Mean Difference (IV, Fixed, 95% CI) | 2.0 [‐6.55, 10.55] |
| 9.4 SF‐36 physical function scale score at 12 months' follow‐up | 1 | 78 | Mean Difference (IV, Fixed, 95% CI) | 3.0 [‐6.44, 12.44] |
| 9.5 SF‐36 physical function scale score at 2 to 5 years' follow‐up | 1 | 98 | Mean Difference (IV, Fixed, 95% CI) | 2.0 [‐8.26, 12.26] |
| 9.6 SF‐36 role physical at 6 months' follow‐up | 1 | 90 | Mean Difference (IV, Fixed, 95% CI) | 5.0 [‐7.67, 17.67] |
| 9.7 SF‐36 role physical at 12 months' follow‐up | 1 | 78 | Mean Difference (IV, Fixed, 95% CI) | 5.0 [‐6.96, 16.96] |
| 9.8 SF‐36 role physical at 2 to 5 years' follow‐up | 1 | 98 | Mean Difference (IV, Fixed, 95% CI) | 8.0 [‐2.66, 18.66] |
| 9.9 SF‐36 role emotional at 6 months' follow‐up | 1 | 90 | Mean Difference (IV, Fixed, 95% CI) | ‐6.0 [‐18.64, 6.64] |
| 9.10 SF‐36 role emotional at 12 months' follow‐up | 1 | 78 | Mean Difference (IV, Fixed, 95% CI) | 4.0 [‐1.92, 9.92] |
| 9.11 SF‐36 role emotional at 2 to 5 years' follow‐up | 1 | 98 | Mean Difference (IV, Fixed, 95% CI) | ‐9.0 [‐14.45, ‐3.55] |
| 9.12 SF‐36 social functioning at 6 months' follow‐up | 1 | 90 | Mean Difference (IV, Fixed, 95% CI) | ‐1.0 [‐9.98, 7.98] |
| 9.13 SF‐36 social functioning at 12 months' follow‐up | 1 | 78 | Mean Difference (IV, Fixed, 95% CI) | 3.0 [‐6.17, 12.17] |
| 9.14 SF‐36 social functioning at 2 to 5 years' follow‐up | 1 | 98 | Mean Difference (IV, Fixed, 95% CI) | 4.0 [‐5.60, 13.60] |
| 9.15 SF‐36 mental health at 6 months' follow‐up | 1 | 90 | Mean Difference (IV, Fixed, 95% CI) | ‐3.0 [‐10.84, 4.84] |
| 9.16 SF‐36 mental health at 12 months' follow‐up | 1 | 78 | Mean Difference (IV, Fixed, 95% CI) | 0.0 [‐8.03, 8.03] |
| 9.17 SF‐36 mental health at 2 to 5 years' follow‐up | 1 | 98 | Mean Difference (IV, Fixed, 95% CI) | ‐5.0 [‐11.39, 1.39] |
| 9.18 SF‐36 energy/vitality at 6 months' follow‐up | 1 | 90 | Mean Difference (IV, Fixed, 95% CI) | ‐6.0 [‐13.54, 1.54] |
| 9.19 SF‐36 energy/vitality at 12 months' follow‐up | 1 | 78 | Mean Difference (IV, Fixed, 95% CI) | 9.0 [‐0.44, 18.44] |
| 9.20 SF‐36 energy/vitality at 2 to 5 years' follow‐up | 1 | 98 | Mean Difference (IV, Fixed, 95% CI) | ‐3.0 [‐10.39, 4.39] |
| 9.21 SF‐36 pain at 6 months' follow‐up | 1 | 90 | Mean Difference (IV, Fixed, 95% CI) | 2.0 [‐6.00, 12.00] |
| 9.22 SF‐36 pain at 12 months' follow‐up | 1 | 78 | Mean Difference (IV, Fixed, 95% CI) | ‐1.0 [‐12.61, 10.61] |
| 9.23 SF‐36 pain at 2 to 5 years' follow‐up | 1 | 98 | Mean Difference (IV, Fixed, 95% CI) | ‐5.0 [‐14.79, 4.79] |
| 9.24 SF‐36 general health at 6 months' follow‐up | 1 | 90 | Mean Difference (IV, Fixed, 95% CI) | ‐5.0 [‐13.30, 3.30] |
| 9.25 SF‐36 general health at 12 months' follow‐up | 1 | 78 | Mean Difference (IV, Fixed, 95% CI) | 6.0 [‐4.10, 16.10] |
| 9.26 SF‐36 general health at 2 to 5 years' follow‐up | 1 | 98 | Mean Difference (IV, Fixed, 95% CI) | 6.0 [‐5.72, 17.72] |
| 9.27 RSCL physical symptoms at 6 months' follow‐up | 1 | 90 | Mean Difference (IV, Fixed, 95% CI) | 1.0 [‐3.94, 5.94] |
| 9.28 RSCL physical symptoms at 12 months' follow‐up | 1 | 78 | Mean Difference (IV, Fixed, 95% CI) | ‐4.0 [‐8.56, 0.56] |
| 9.29 RSCL psychological distress at 6 months' follow‐up | 1 | 90 | Mean Difference (IV, Fixed, 95% CI) | ‐1.0 [‐10.14, 8.14] |
| 9.30 RSCL psychological distress at 12 months' follow‐up | 1 | 78 | Mean Difference (IV, Fixed, 95% CI) | ‐1.0 [‐7.92, 5.92] |
| 9.31 RSCL activity level at 6 months' follow‐up | 1 | 90 | Mean Difference (IV, Fixed, 95% CI) | ‐1.0 [‐3.35, 1.35] |
| 9.32 RSCL activity level at 12 months' follow‐up | 1 | 78 | Mean Difference (IV, Fixed, 95% CI) | ‐2.0 [‐4.32, 0.32] |
| 9.33 RSCL overall quality of life at 6 months' follow‐up | 1 | 90 | Mean Difference (IV, Fixed, 95% CI) | ‐2.0 [‐12.29, 8.29] |
| 9.34 RSCL overall quality of life at 12 months' follow‐up | 1 | 78 | Mean Difference (IV, Fixed, 95% CI) | ‐9.0 [‐18.77, 0.77] |
| 9.35 SDS depression at 6 months' follow‐up | 1 | 90 | Mean Difference (IV, Fixed, 95% CI) | 2.0 [‐1.55, 5.55] |
| 9.36 SDS depression at 12 months' follow‐up | 1 | 78 | Mean Difference (IV, Fixed, 95% CI) | ‐1.0 [‐5.24, 3.24] |
| 9.37 Multi‐attribute utility tool at 12 months' follow‐up | 1 | 51 | Mean Difference (IV, Fixed, 95% CI) | 8.80 [‐6.08, 23.68] |
| 9.38 EQ‐5D utility at 12 months' follow‐up | 1 | 49 | Mean Difference (IV, Fixed, 95% CI) | 0.03 [‐0.16, 0.22] |
| 9.39 EQ‐5D health thermometer at 12 months' follow‐up | 1 | 43 | Mean Difference (IV, Fixed, 95% CI) | 4.8 [‐10.07, 19.67] |
| 10 Menorrhagia Outcome Questionnaire Show forest plot | 1 | 51 | Mean Difference (IV, Fixed, 95% CI) | ‐0.60 [‐3.87, 2.67] |
| 10.1 At 12 months' follow‐up | 1 | 51 | Mean Difference (IV, Fixed, 95% CI) | ‐0.60 [‐3.87, 2.67] |
| 11 Dysmenorrhoea rate (VAS score) Show forest plot | Other data | No numeric data | ||
| 11.1 At 12 months' follow‐up | Other data | No numeric data | ||
| 12 Improvement in other menstrual symptoms Show forest plot | 2 | 465 | Risk Ratio (M‐H, Fixed, 95% CI) | 0.91 [0.70, 1.20] |
| 12.1 Improvement in dysmenorrhoea at 12 months' follow‐up | 1 | 44 | Risk Ratio (M‐H, Fixed, 95% CI) | 1.37 [0.89, 2.10] |
| 12.2 Improvement in PMS (emotional) at 12 months' follow‐up | 1 | 36 | Risk Ratio (M‐H, Fixed, 95% CI) | 0.8 [0.45, 1.43] |
| 12.3 Improvement in PMS (physical) at 12 months' follow‐up | 1 | 36 | Risk Ratio (M‐H, Fixed, 95% CI) | 1.3 [0.72, 2.34] |
| 12.4 Dysmenorrhoea rate at 6 months' follow‐up | 1 | 126 | Risk Ratio (M‐H, Fixed, 95% CI) | 0.69 [0.26, 1.86] |
| 12.5 Dysmenorrhoea rate at 12 months' follow‐up | 1 | 126 | Risk Ratio (M‐H, Fixed, 95% CI) | 0.52 [0.18, 1.51] |
| 12.6 Dysmenorrhoea rate at 2 to 5 years' follow‐up | 1 | 97 | Risk Ratio (M‐H, Fixed, 95% CI) | 0.61 [0.26, 1.44] |
| 13 PMS rate (VAS score) Show forest plot | Other data | No numeric data | ||
| 13.1 At 12 months' follow‐up | Other data | No numeric data | ||
| 14 Complication rate: major complications Show forest plot | 1 | Risk Ratio (M‐H, Fixed, 95% CI) | Subtotals only | |
| 14.1 Infection (endometritis) | 1 | 73 | Risk Ratio (M‐H, Fixed, 95% CI) | 0.30 [0.06, 1.42] |
| 15 Requirement for further surgery Show forest plot | 4 | Risk Ratio (M‐H, Fixed, 95% CI) | Subtotals only | |
| 15.1 At 6 months' follow‐up (ablation or hysterectomy) | 1 | 53 | Risk Ratio (M‐H, Fixed, 95% CI) | 0.0 [0.0, 0.0] |
| 15.2 At 12 months' follow‐up (ablation or hysterectomy) | 3 | 239 | Risk Ratio (M‐H, Fixed, 95% CI) | 1.35 [0.49, 3.67] |
| 15.3 At 12 months' follow‐up (hysterectomy only) | 3 | 311 | Risk Ratio (M‐H, Fixed, 95% CI) | 0.72 [0.28, 1.84] |
| 15.4 At 2 to 5 years' follow‐up (ablation or hysterectomy) | 1 | 120 | Risk Ratio (M‐H, Fixed, 95% CI) | 0.72 [0.28, 1.89] |
| 15.5 At 2 to 5 years' follow‐up (hysterectomy only) | 1 | 120 | Risk Ratio (M‐H, Fixed, 95% CI) | 0.77 [0.27, 2.20] |
| 15.6 At 10 years' follow‐up (hysterectomy only) | 1 | 104 | Risk Ratio (M‐H, Fixed, 95% CI) | 1.01 [0.38, 2.74] |
| Outcome or subgroup title | No. of studies | No. of participants | Statistical method | Effect size |
| 1 Bleeding Show forest plot | 1 | Risk Ratio (M‐H, Fixed, 95% CI) | Subtotals only | |
| 1.1 Amenorrhoea at 6 months' follow‐up | 1 | 277 | Risk Ratio (M‐H, Fixed, 95% CI) | 1.50 [1.07, 2.12] |
| 1.2 Amenorrhoea at 12 months' follow‐up | 1 | 282 | Risk Ratio (M‐H, Fixed, 95% CI) | 1.10 [0.82, 1.47] |
| 1.3 Amenorrhoea at 5 years' follow‐up | 1 | 217 | Risk Ratio (M‐H, Fixed, 95% CI) | 1.03 [0.86, 1.23] |
| 2 PBAC score at 12 months' follow‐up Show forest plot | Other data | No numeric data | ||
| 3 Rate of satisfaction Show forest plot | 1 | Risk Ratio (M‐H, Fixed, 95% CI) | Subtotals only | |
| 3.1 At 12 months' follow‐up | 1 | 278 | Risk Ratio (M‐H, Fixed, 95% CI) | 1.00 [0.88, 1.14] |
| 3.2 At 5 years' follow‐up | 1 | 217 | Risk Ratio (M‐H, Fixed, 95% CI) | 0.99 [0.87, 1.13] |
| 4 Operation time (minutes) Show forest plot | 1 | 314 | Mean Difference (IV, Fixed, 95% CI) | ‐6.60 [‐7.36, ‐5.84] |
| 5 Operative difficulties causing failure Show forest plot | 1 | Risk Ratio (M‐H, Fixed, 95% CI) | Subtotals only | |
| 5.1 Failure of device | 1 | 314 | Risk Ratio (M‐H, Fixed, 95% CI) | 0.09 [0.01, 0.70] |
| 5.2 Unsuitable cavity | 1 | 314 | Risk Ratio (M‐H, Fixed, 95% CI) | 0.75 [0.17, 3.30] |
| 5.3 Device not sterile | 1 | 314 | Risk Ratio (M‐H, Fixed, 95% CI) | 5.0 [0.24, 103.32] |
| 6 Proportion choosing local anaesthesia Show forest plot | 1 | 314 | Risk Ratio (M‐H, Fixed, 95% CI) | 1.01 [0.79, 1.31] |
| 7 Proportion requiring opiate analgesia Show forest plot | 1 | 314 | Risk Ratio (M‐H, Fixed, 95% CI) | 0.92 [0.83, 1.01] |
| 8 Recovery: proportion requiring overnight stay Show forest plot | 1 | 314 | Risk Ratio (M‐H, Fixed, 95% CI) | 0.66 [0.42, 1.04] |
| 9 Quality of life scores Show forest plot | 1 | Mean Difference (IV, Fixed, 95% CI) | Subtotals only | |
| 9.1 EQ‐5D at 12 months' follow‐up | 1 | 285 | Mean Difference (IV, Fixed, 95% CI) | 0.02 [‐0.04, 0.08] |
| 9.2 EQ‐5D at 5 years' follow‐up | 1 | 217 | Mean Difference (IV, Fixed, 95% CI) | 0.0 [‐0.07, 0.07] |
| 9.3 SF‐12 physical scores at 12 months' follow‐up | 1 | 285 | Mean Difference (IV, Fixed, 95% CI) | ‐0.70 [‐2.64, 1.24] |
| 9.4 SF‐12 physical scores at 5 years' follow‐up | 1 | 217 | Mean Difference (IV, Fixed, 95% CI) | ‐1.5 [‐3.99, 0.99] |
| 9.5 SF‐12 mental scores at 12 months' follow‐up | 1 | 285 | Mean Difference (IV, Fixed, 95% CI) | ‐1.20 [‐3.67, 1.27] |
| 9.6 SF‐12 mental scores at 5 years' follow‐up | 1 | 217 | Mean Difference (IV, Fixed, 95% CI) | ‐0.30 [‐2.90, 2.30] |
| 10 Requirement for further surgery (hysterectomy) Show forest plot | 1 | Risk Ratio (M‐H, Fixed, 95% CI) | Subtotals only | |
| 10.1 At 12 months' follow‐up | 1 | 285 | Risk Ratio (M‐H, Fixed, 95% CI) | 0.94 [0.31, 2.84] |
| 10.2 At 5 years' follow‐up | 1 | 217 | Risk Ratio (M‐H, Fixed, 95% CI) | 1.29 [0.51, 3.27] |
| Outcome or subgroup title | No. of studies | No. of participants | Statistical method | Effect size |
| 1 Bleeding Show forest plot | 1 | Risk Ratio (M‐H, Fixed, 95% CI) | Subtotals only | |
| 1.1 Amenorrhoea at 6 months' follow‐up | 1 | 150 | Risk Ratio (M‐H, Fixed, 95% CI) | 2.27 [1.25, 4.12] |
| 1.2 Amenorrhoea at 12 months' follow‐up | 1 | 146 | Risk Ratio (M‐H, Fixed, 95% CI) | 1.95 [1.21, 3.15] |
| 1.3 Amenorrhoea at 2 to 5 years' follow‐up | 1 | 139 | Risk Ratio (M‐H, Fixed, 95% CI) | 1.57 [1.06, 2.31] |
| 2 Rate of satisfaction Show forest plot | 1 | Risk Ratio (M‐H, Fixed, 95% CI) | Subtotals only | |
| 2.1 At 6 months' follow‐up | 1 | 150 | Risk Ratio (M‐H, Fixed, 95% CI) | 1.44 [1.17, 1.77] |
| 2.2 At 12 months' follow‐up | 1 | 146 | Risk Ratio (M‐H, Fixed, 95% CI) | 1.11 [1.02, 1.21] |
| 2.3 At 2 to 5 years' follow‐up | 1 | 139 | Risk Ratio (M‐H, Fixed, 95% CI) | 1.62 [1.23, 2.13] |
| 3 Duration of procedure (minutes) Show forest plot | Other data | No numeric data | ||
| 4 Improvement in other menstrual symptoms Show forest plot | 1 | Risk Ratio (M‐H, Fixed, 95% CI) | Subtotals only | |
| 4.1 Absence of dysmenorrhoea at 12 months' follow‐up | 1 | 146 | Risk Ratio (M‐H, Fixed, 95% CI) | 0.92 [0.79, 1.06] |
| 4.2 Absence of dysmenorrhoea at 2 to 5 years' follow‐up | 1 | 139 | Risk Ratio (M‐H, Fixed, 95% CI) | 1.32 [1.00, 1.74] |
| 5 Complication rate: major complications Show forest plot | 1 | Risk Ratio (M‐H, Fixed, 95% CI) | Subtotals only | |
| 5.1 Uterine perforation | 1 | 156 | Risk Ratio (M‐H, Fixed, 95% CI) | 2.71 [0.11, 65.54] |
| 5.2 Saline leakage | 1 | 156 | Risk Ratio (M‐H, Fixed, 95% CI) | 0.13 [0.01, 2.46] |
| 6 Requirement for further surgery Show forest plot | 1 | Risk Ratio (M‐H, Fixed, 95% CI) | Subtotals only | |
| 6.1 At 12 months' follow‐up (ablation or hysterectomy) | 1 | 160 | Risk Ratio (M‐H, Fixed, 95% CI) | 0.28 [0.11, 0.72] |
| 6.2 At 12 months' follow‐up (hysterectomy) | 1 | 160 | Risk Ratio (M‐H, Fixed, 95% CI) | 0.42 [0.14, 1.32] |
| 6.3 At 2 to 5 years' follow‐up (ablation or hysterectomy) | 1 | 136 | Risk Ratio (M‐H, Fixed, 95% CI) | 0.44 [0.23, 0.83] |
| 6.4 At 2 to 5 years' follow‐up (hysterectomy) | 1 | 136 | Risk Ratio (M‐H, Fixed, 95% CI) | 0.63 [0.29, 1.38] |
| Outcome or subgroup title | No. of studies | No. of participants | Statistical method | Effect size |
| 1 Bleeding Show forest plot | 1 | 200 | Risk Ratio (M‐H, Fixed, 95% CI) | 2.59 [1.87, 3.58] |
| 1.1 Amenorrhoea at 3 years' follow‐up | 1 | 100 | Risk Ratio (M‐H, Fixed, 95% CI) | 4.5 [2.33, 8.69] |
| 1.2 Amenorrhoea and eumenorrhoea at 3 years' follow‐up | 1 | 100 | Risk Ratio (M‐H, Fixed, 95% CI) | 1.86 [1.30, 2.66] |
| 2 Surgery difficulties: failure rate of procedure Show forest plot | 1 | 100 | Risk Ratio (M‐H, Fixed, 95% CI) | 0.29 [0.12, 0.74] |
| 3 Recovery: hospital stay (days) Show forest plot | 1 | 100 | Mean Difference (IV, Fixed, 95% CI) | 1.6 [1.18, 2.02] |
| 4 Complication rate: major complications Show forest plot | 1 | Risk Ratio (M‐H, Fixed, 95% CI) | Subtotals only | |
| 4.1 Uterine perforation | 1 | 100 | Risk Ratio (M‐H, Fixed, 95% CI) | 0.14 [0.01, 2.70] |
| 5 Complication rate: minor complications Show forest plot | 1 | 200 | Risk Ratio (M‐H, Fixed, 95% CI) | 0.37 [0.16, 0.84] |
| 5.1 Bleeding | 1 | 100 | Risk Ratio (M‐H, Fixed, 95% CI) | 0.21 [0.07, 0.70] |
| 5.2 Infection/leucorrhoea | 1 | 100 | Risk Ratio (M‐H, Fixed, 95% CI) | 0.8 [0.23, 2.81] |
| 6 Requirement for further surgery Show forest plot | 1 | 100 | Risk Ratio (M‐H, Fixed, 95% CI) | 0.42 [0.16, 1.10] |
| 6.1 Within 3 years (hysterectomy) | 1 | 100 | Risk Ratio (M‐H, Fixed, 95% CI) | 0.42 [0.16, 1.10] |
| Outcome or subgroup title | No. of studies | No. of participants | Statistical method | Effect size |
| 1 Bleeding Show forest plot | 1 | 132 | Odds Ratio (M‐H, Fixed, 95% CI) | 7.07 [3.29, 15.22] |
| 1.1 Amenorrhoea at 3 months' follow‐up | 1 | 66 | Odds Ratio (M‐H, Fixed, 95% CI) | 5.33 [1.86, 15.30] |
| 1.2 Amenorrhoea at 12 months' follow‐up | 1 | 66 | Odds Ratio (M‐H, Fixed, 95% CI) | 9.77 [3.17, 30.11] |
| 2 Bleeding PBAC at 12 months' follow‐up Show forest plot | 1 | Mean Difference (IV, Fixed, 95% CI) | Subtotals only | |
| 3 Rate of satisfaction Show forest plot | 1 | Risk Ratio (M‐H, Fixed, 95% CI) | Subtotals only | |
| 3.1 Satisfaction ‐ with treatment at 3 months' follow‐up | 1 | 66 | Risk Ratio (M‐H, Fixed, 95% CI) | 0.97 [0.89, 1.05] |
| 3.2 Satisfaction ‐ with treatment at 12 months' follow‐up | 1 | 66 | Risk Ratio (M‐H, Fixed, 95% CI) | 0.85 [0.73, 0.99] |
| 3.3 Satisfaction ‐ improvement in everyday life at 12 months' follow‐up | 1 | 66 | Risk Ratio (M‐H, Fixed, 95% CI) | 0.91 [0.81, 1.03] |
| 4 Duration of treatment (seconds) Show forest plot | 1 | 66 | Mean Difference (IV, Fixed, 95% CI) | 9.80 [2.63, 16.97] |
| 5 Improvement in other menstrual symptoms: dysmenorrhoea Show forest plot | 1 | Risk Ratio (M‐H, Fixed, 95% CI) | Subtotals only | |
| 5.1 Dysmenorrhoea at 3 months' follow‐up | 1 | 66 | Risk Ratio (M‐H, Fixed, 95% CI) | 2.0 [0.39, 10.18] |
| 5.2 Dysmenorrhoea at 12 months' follow‐up | 1 | 66 | Risk Ratio (M‐H, Fixed, 95% CI) | 4.0 [0.92, 17.44] |
| 6 Complication rate Show forest plot | 1 | 198 | Odds Ratio (M‐H, Fixed, 95% CI) | 25.98 [1.44, 468.00] |
| 6.1 Minor complications | 1 | 66 | Odds Ratio (M‐H, Fixed, 95% CI) | 0.0 [0.0, 0.0] |
| 6.2 Major complications | 1 | 66 | Odds Ratio (M‐H, Fixed, 95% CI) | 0.0 [0.0, 0.0] |
| 6.3 Requirement for post‐procedure analgesia | 1 | 66 | Odds Ratio (M‐H, Fixed, 95% CI) | 25.98 [1.44, 468.00] |
| 7 Requirement for further surgery Show forest plot | 1 | Risk Ratio (M‐H, Fixed, 95% CI) | Subtotals only | |
| 7.1 At 12 months' follow‐up (hysterectomy) | 1 | 66 | Risk Ratio (M‐H, Fixed, 95% CI) | 5.0 [0.25, 100.32] |
| Outcome or subgroup title | No. of studies | No. of participants | Statistical method | Effect size |
| 1 Bleeding Show forest plot | 1 | Risk Ratio (M‐H, Fixed, 95% CI) | Subtotals only | |
| 1.1 Haematin alkaline < 80 mL/cycle at 12 months' follow‐up | 1 | 153 | Risk Ratio (M‐H, Fixed, 95% CI) | 1.16 [1.00, 1.34] |
| 1.2 Amenorrhoea at 12 months' follow‐up | 1 | 153 | Risk Ratio (M‐H, Fixed, 95% CI) | 1.46 [1.08, 1.98] |
| 2 Rate of satisfaction Show forest plot | 1 | Risk Ratio (M‐H, Fixed, 95% CI) | Subtotals only | |
| 2.1 At 12 months' follow‐up | 1 | 153 | Risk Ratio (M‐H, Fixed, 95% CI) | 1.15 [0.99, 1.33] |
| 3 Duration of surgery Show forest plot | 1 | 153 | Mean Difference (IV, Fixed, 95% CI) | ‐14.1 [‐15.94, ‐12.26] |
| 4 Improvement in other menstrual symptoms: dysmenorrhoea Show forest plot | 1 | 153 | Risk Ratio (M‐H, Fixed, 95% CI) | 1.02 [0.71, 1.48] |
| 5 Improvement in other menstrual symptoms: PMS at 12 months' follow‐up Show forest plot | 1 | Risk Ratio (M‐H, Fixed, 95% CI) | Subtotals only | |
| 6 Complication rate: major complications Show forest plot | 1 | Risk Ratio (M‐H, Fixed, 95% CI) | Subtotals only | |
| 6.1 Endometritis or endomyometritis | 1 | 153 | Risk Ratio (M‐H, Fixed, 95% CI) | 0.25 [0.02, 2.69] |
| 6.2 Pelvic inflammatory disease | 1 | 153 | Risk Ratio (M‐H, Fixed, 95% CI) | 1.51 [0.06, 36.54] |
| 6.3 Haematometra | 1 | 153 | Risk Ratio (M‐H, Fixed, 95% CI) | 1.51 [0.06, 36.54] |
| 7 Complication rate: minor complications Show forest plot | 1 | 2142 | Risk Ratio (M‐H, Fixed, 95% CI) | 0.62 [0.30, 1.26] |
| 7.1 Intraoperative skin rash and/or itching or burning sensation | 1 | 153 | Risk Ratio (M‐H, Fixed, 95% CI) | 1.51 [0.06, 36.54] |
| 7.2 Bleeding or spotting first 24 hours | 1 | 153 | Risk Ratio (M‐H, Fixed, 95% CI) | 0.17 [0.01, 4.06] |
| 7.3 Nausea or vomiting first 24 hours | 1 | 153 | Risk Ratio (M‐H, Fixed, 95% CI) | 0.17 [0.01, 4.06] |
| 7.4 Weakness, fatigue, sleepiness, lack of concentration, dizziness first 24 hours | 1 | 153 | Risk Ratio (M‐H, Fixed, 95% CI) | 1.51 [0.06, 36.54] |
| 7.5 Backache first 24 hours | 1 | 153 | Risk Ratio (M‐H, Fixed, 95% CI) | 1.51 [0.06, 36.54] |
| 7.6 Fever first 24 hours | 1 | 153 | Risk Ratio (M‐H, Fixed, 95% CI) | 1.51 [0.06, 36.54] |
| 7.7 Abdominal pain or bloating (> 24 hours to 2 weeks) | 1 | 153 | Risk Ratio (M‐H, Fixed, 95% CI) | 1.5 [0.16, 14.06] |
| 7.8 Abdominal pain and/or bloating > 2 weeks | 1 | 153 | Risk Ratio (M‐H, Fixed, 95% CI) | 0.17 [0.01, 4.06] |
| 7.9 Pelvic pain (> 24 hours to 2 weeks) | 1 | 153 | Risk Ratio (M‐H, Fixed, 95% CI) | 1.51 [0.06, 36.54] |
| 7.10 Vaginal discharge and/or unpleasant vaginal smell or other abnormal sensation (> 24 hours to 2 weeks) | 1 | 153 | Risk Ratio (M‐H, Fixed, 95% CI) | 1.51 [0.06, 36.54] |
| 7.11 Weakness, fatigue, sleepiness, lack of concentration, dizziness (> 24 hours to 2 weeks) | 1 | 153 | Risk Ratio (M‐H, Fixed, 95% CI) | 0.5 [0.03, 7.83] |
| 7.12 Constipation (> 24 hours to 2 weeks) | 1 | 153 | Risk Ratio (M‐H, Fixed, 95% CI) | 0.17 [0.01, 4.06] |
| 7.13 Skin rash and/or itching or burning sensation (> 24 hours to 2 weeks) | 1 | 153 | Risk Ratio (M‐H, Fixed, 95% CI) | 0.5 [0.03, 7.83] |
| 7.14 Dysmenorrhoea (2 weeks to 1 year) | 1 | 153 | Risk Ratio (M‐H, Fixed, 95% CI) | 0.17 [0.01, 4.06] |
| 8 Requirement for further surgery Show forest plot | 1 | 153 | Risk Ratio (M‐H, Fixed, 95% CI) | 0.33 [0.06, 1.93] |
| 8.1 Hysterectomy at 12 months' follow‐up | 1 | 153 | Risk Ratio (M‐H, Fixed, 95% CI) | 0.33 [0.06, 1.93] |
| Outcome or subgroup title | No. of studies | No. of participants | Statistical method | Effect size |
| 1 Bleeding Show forest plot | 12 | Risk Ratio (M‐H, Random, 95% CI) | Subtotals only | |
| 1.1 Amenorrhoea at 6 months' follow‐up | 1 | 49 | Risk Ratio (M‐H, Random, 95% CI) | 1.27 [0.91, 1.77] |
| 1.2 Amenorrhoea at 1 year follow‐up | 12 | 2145 | Risk Ratio (M‐H, Random, 95% CI) | 0.99 [0.78, 1.27] |
| 1.3 Amenorrhoea at 2 years' follow‐up | 3 | 701 | Risk Ratio (M‐H, Random, 95% CI) | 0.97 [0.72, 1.30] |
| 1.4 Amenorrhoea at 2 to 5 years' follow‐up | 4 | 672 | Risk Ratio (M‐H, Random, 95% CI) | 1.16 [0.78, 1.72] |
| 1.5 Amenorrhoea > 5 years' follow‐up | 1 | 189 | Risk Ratio (M‐H, Random, 95% CI) | 0.94 [0.83, 1.05] |
| 1.6 PBAC < 75 or acceptable improvement at 12 months' follow‐up | 5 | 1282 | Risk Ratio (M‐H, Random, 95% CI) | 1.03 [0.98, 1.09] |
| 1.7 PBAC < 75 or acceptable improvement at 2 to 5 years' follow‐up | 1 | 236 | Risk Ratio (M‐H, Random, 95% CI) | 1.12 [0.97, 1.28] |
| 1.8 PBAC < 75 or acceptable improvement at > 5 years' follow‐up | 1 | 263 | Risk Ratio (M‐H, Random, 95% CI) | 1.08 [0.87, 1.34] |
| 2 Bleeding ‐ amenorrhoea at 12 months' follow‐up (final plot) Show forest plot | 12 | 2145 | Risk Ratio (M‐H, Random, 95% CI) | 0.99 [0.78, 1.27] |
| 3 Satisfaction rate Show forest plot | 13 | Risk Ratio (M‐H, Random, 95% CI) | Subtotals only | |
| 3.1 At 6 months' follow‐up | 1 | 50 | Risk Ratio (M‐H, Random, 95% CI) | 1.06 [0.93, 1.20] |
| 3.2 At 1 year follow‐up | 11 | 1750 | Risk Ratio (M‐H, Random, 95% CI) | 1.01 [0.98, 1.04] |
| 3.3 At 2 years' follow‐up | 5 | 802 | Risk Ratio (M‐H, Random, 95% CI) | 1.09 [0.99, 1.21] |
| 3.4 At 2 to 5 years' follow‐up | 4 | 672 | Risk Ratio (M‐H, Random, 95% CI) | 1.02 [0.93, 1.13] |
| 3.5 At 10 years' follow‐up | 1 | 189 | Risk Ratio (M‐H, Random, 95% CI) | 1.11 [0.95, 1.30] |
| 4 Satisfaction rate at 1 year follow‐up (final plot) Show forest plot | 11 | 1750 | Risk Ratio (M‐H, Fixed, 95% CI) | 1.02 [0.99, 1.05] |
| 5 Duration of operation (minutes) Show forest plot | 9 | Mean Difference (IV, Random, 95% CI) | Totals not selected | |
| 6 Operative difficulties Show forest plot | 5 | Risk Ratio (M‐H, Random, 95% CI) | Subtotals only | |
| 6.1 Equipment failure | 3 | 384 | Risk Ratio (M‐H, Random, 95% CI) | 4.26 [1.46, 12.43] |
| 6.2 Procedure abandoned | 3 | 629 | Risk Ratio (M‐H, Random, 95% CI) | 1.18 [0.38, 3.67] |
| 7 Proportion given local anaesthesia (%) Show forest plot | 6 | 1434 | Risk Ratio (M‐H, Random, 95% CI) | 2.78 [1.76, 4.40] |
| 8 Inability to work Show forest plot | 2 | 479 | Risk Ratio (M‐H, Random, 95% CI) | 0.84 [0.30, 2.30] |
| 9 Complication rate: major complications Show forest plot | 11 | Risk Ratio (M‐H, Random, 95% CI) | Subtotals only | |
| 9.1 Perforation | 8 | 1885 | Risk Ratio (M‐H, Random, 95% CI) | 0.32 [0.10, 1.01] |
| 9.2 Endometritis | 4 | 1095 | Risk Ratio (M‐H, Random, 95% CI) | 1.19 [0.33, 4.37] |
| 9.3 Myometritis | 1 | 267 | Risk Ratio (M‐H, Random, 95% CI) | 0.29 [0.01, 6.93] |
| 9.4 Cervical lacerations | 7 | 1583 | Risk Ratio (M‐H, Random, 95% CI) | 0.21 [0.07, 0.61] |
| 9.5 Cervical stenosis | 1 | 322 | Risk Ratio (M‐H, Random, 95% CI) | 1.5 [0.06, 36.52] |
| 9.6 Pelvic abscess | 1 | 265 | Risk Ratio (M‐H, Random, 95% CI) | 0.17 [0.01, 4.19] |
| 9.7 Pelvic inflammatory disease | 2 | 418 | Risk Ratio (M‐H, Random, 95% CI) | 1.18 [0.18, 7.98] |
| 9.8 Haematometra | 5 | 1193 | Risk Ratio (M‐H, Random, 95% CI) | 0.34 [0.12, 0.95] |
| 9.9 Blood transfusion | 1 | 82 | Risk Ratio (M‐H, Random, 95% CI) | 5.24 [0.26, 105.97] |
| 9.10 Fluid overload | 3 | 588 | Risk Ratio (M‐H, Random, 95% CI) | 0.16 [0.03, 0.94] |
| 10 Complication rate: minor complications Show forest plot | 10 | 6450 | Risk Ratio (M‐H, Fixed, 95% CI) | 1.31 [1.11, 1.54] |
| 10.1 Nausea/vomiting | 4 | 997 | Risk Ratio (M‐H, Fixed, 95% CI) | 2.01 [1.40, 2.88] |
| 10.2 Uterine cramping | 2 | 601 | Risk Ratio (M‐H, Fixed, 95% CI) | 1.21 [1.02, 1.45] |
| 10.3 Urinary tract infection | 8 | 1834 | Risk Ratio (M‐H, Fixed, 95% CI) | 0.88 [0.45, 1.73] |
| 10.4 Fever | 3 | 671 | Risk Ratio (M‐H, Fixed, 95% CI) | 0.98 [0.22, 4.26] |
| 10.5 Haemorrhage | 4 | 889 | Risk Ratio (M‐H, Fixed, 95% CI) | 0.64 [0.26, 1.58] |
| 10.6 Muscle fasciculation | 1 | 267 | Risk Ratio (M‐H, Fixed, 95% CI) | 2.57 [0.11, 62.41] |
| 10.7 External burns (first degree) | 1 | 269 | Risk Ratio (M‐H, Fixed, 95% CI) | 2.32 [0.11, 47.89] |
| 10.8 Hydrosalpinx | 1 | 239 | Risk Ratio (M‐H, Fixed, 95% CI) | 0.30 [0.01, 7.39] |
| 10.9 Severe pelvic pain | 3 | 683 | Risk Ratio (M‐H, Fixed, 95% CI) | 0.95 [0.36, 2.48] |
| 11 Requirement for additional surgery Show forest plot | 12 | Risk Ratio (M‐H, Random, 95% CI) | Subtotals only | |
| 11.1 At 1 year follow‐up (ablation or hysterectomy) | 6 | 935 | Risk Ratio (M‐H, Random, 95% CI) | 0.72 [0.41, 1.26] |
| 11.2 At 1 year follow‐up (hysterectomy) | 5 | 925 | Risk Ratio (M‐H, Random, 95% CI) | 0.66 [0.35, 1.21] |
| 11.3 At 2 years' follow‐up (ablation or hysterectomy) | 5 | 988 | Risk Ratio (M‐H, Random, 95% CI) | 0.83 [0.52, 1.32] |
| 11.4 At 2 years' follow‐up (hysterectomy) | 4 | 920 | Risk Ratio (M‐H, Random, 95% CI) | 0.86 [0.52, 1.42] |
| 11.5 At 2 to 5 years' follow‐up (ablation or hysterectomy) | 3 | 647 | Risk Ratio (M‐H, Random, 95% CI) | 0.95 [0.72, 1.26] |
| 11.6 At 2 to 5 years' follow‐up (hysterectomy) | 4 | 758 | Risk Ratio (M‐H, Random, 95% CI) | 0.85 [0.59, 1.22] |
| 11.7 At 10 years' follow‐up (ablation or hysterectomy) | 1 | 189 | Risk Ratio (M‐H, Random, 95% CI) | 0.57 [0.37, 0.87] |
| 11.8 At 10 years' follow‐up (hysterectomy) | 1 | 189 | Risk Ratio (M‐H, Random, 95% CI) | 0.59 [0.38, 0.91] |