Técnicas de resección y ablación del endometrio para el sangrado menstrual abundante
Information
- DOI:
- https://doi.org/10.1002/14651858.CD001501.pub5Copy DOI

- Database:
-
- Cochrane Database of Systematic Reviews
- Version published:
-
- 22 January 2019see what's new
- Type:
-
- Intervention
- Stage:
-
- Review
- Cochrane Editorial Group:
-
Cochrane Gynaecology and Fertility Group
- Copyright:
-
- Copyright © 2019 The Cochrane Collaboration. Published by John Wiley & Sons, Ltd.
Article metrics
Altmetric:
Cited by:
Authors
Contributions of authors
For the 2018 update:
Magdalena Bofill performed selection of trials, data extraction, and data entry and prepared all versions of drafts and the final version of the review for comments from the other review authors.
Anne Lethaby performed selection of trials and commented on all versions of drafts and the final version of the review.
Mihaela Grigore performed selection of trials and data extraction.
Julie Brown performed selection of trials and data extraction and checked data entry; she also commented on all versions of drafts and the final version of the review.
Cindy Farquhar and Martha Hickey contributed clinical knowledge and commented on the final version of the review.
All review authors approved the final version.
Jane Marjoribanks helped update the search for the 2013 update.
Josien Penninx performed independent data extraction and assessment of risk of bias for the 2009 and 2013 updates and commented on the final version of the review.
Julie Brown performed independent selection of trials for the 2009 update.
Anne Lethaby wrote the original protocol, searched for relevant trials, assessed trials for eligibility for inclusion, extracted data from the included trials, assessed trials for risk of bias, compared independent data extraction and clarified points of disagreement, entered data, and wrote and commented on the final review (excluding the discussion and conclusion).
Martha Hickey commented on the final list of included trials, extracted data from the included trials for earlier versions of the review, wrote the discussion and conclusion, and commented on the draft of the protocol and an earlier version of the full review.
Ray Garry commented on the final draft of an earlier version of the review.
Sources of support
Internal sources
-
No sources of support supplied
External sources
-
UK NHS, Other.
The update in 2009 was funded by Dept of Health (England) Incentive Scheme 2008
Declarations of interest
MB, AL, CF, MG and JB did not report any conflicts of interest.
Acknowledgements
The authors of the 2018 update of this review thank Dr Jane Thomas and Dr Shantini Paranjothy for providing peer review comments. They also thank Marian Showell (Information Specialist) and Helen Nagels (Managing Editor) at the Cochrane Gynaecology and Fertility Group's editorial base for their time and support, and Dolores Matthews for comprehensive copy editing of their draft.
The authors of the 2013 review acknowledge and thank the Cochrane Menstrual Disorders and Subfertility Group for extensive support in the preparation of this review. Special thanks are due to Shauna Sylvester, Sarah Hetrick, Michelle Proctor, Jane Clarke, and Helen Nagels (Managing Editors during the lifecycle of this review); Sue Furness, Ruth Withers, and Marian Showell (Trials Search Co‐ordinators or Information Specialists); Neil Johnson (Editor); and Sue Hall (who provided secretarial assistance). The review authors also thank Amy Goodwin, Manager of Clinical Research, Gynecare, for extra data and for answering queries on the Meyer trial; authors from some of the other trials (Abbott 2003; Boujida 2002; Perino 2004; van Zon‐Rabelink 2003); and Joerg Neumann for translating relevant sections of the Romer trial. The review authors are also indebted to Sarah Hetrick of the Australasian Cochrane Centre, who helped with update searching in 2004, as well as extraction of data and addition of entries to the Characteristics of included studies.
Version history
| Published | Title | Stage | Authors | Version |
| 2019 Jan 22 | Endometrial resection and ablation techniques for heavy menstrual bleeding | Review | Magdalena Bofill Rodriguez, Anne Lethaby, Mihaela Grigore, Julie Brown, Martha Hickey, Cindy Farquhar | |
| 2013 Aug 30 | Endometrial resection and ablation techniques for heavy menstrual bleeding | Review | Anne Lethaby, Josien Penninx, Martha Hickey, Ray Garry, Jane Marjoribanks | |
| 2009 Oct 07 | Endometrial resection / ablation techniques for heavy menstrual bleeding | Review | Anne Lethaby, Martha Hickey, Ray Garry, Josien Penninx | |
| 2009 Jul 08 | Endometrial destruction techniques for heavy menstrual bleeding | Review | Anne Lethaby, Martha Hickey, Ray Garry | |
| 2002 Apr 22 | Endometrial destruction techniques for heavy menstrual bleeding | Review | Anne Lethaby, Martha Hickey | |
Differences between protocol and review
In December 2008, we changed the title from "Endometrial destruction techniques for heavy menstrual bleeding" to "Endometrial resection and ablation techniques for heavy menstrual bleeding".
In 2018, we divided the complication rate into major and minor categories to distinguish common adverse effects of surgery such as nausea and vomiting from more serious post‐procedure complications.
Keywords
MeSH
Medical Subject Headings (MeSH) Keywords
Medical Subject Headings Check Words
Adult; Female; Humans; Middle Aged;
PICOs

Methodological quality summary: review authors' judgements about each methodological quality item for each included study.
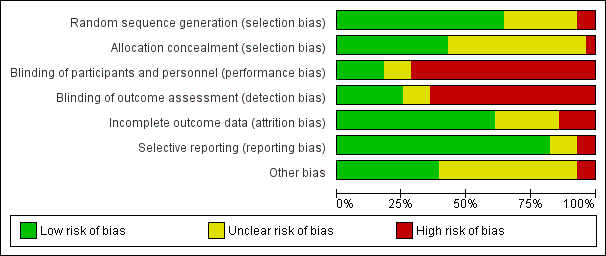
Risk of bias graph: review authors' judgements about each risk of bias item presented as percentages across all included studies.
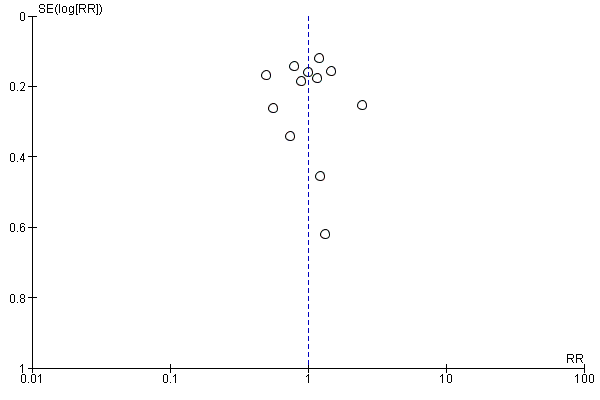
Funnel plot of comparison: 18 Overall analyses: second‐generation endometrial ablation versus first‐generation endometrial ablation, outcome: 18.2 Bleeding ‐ amenorrhoea at 12 months (final plot).

Funnel plot of comparison: 18 Overall analyses: second‐generation endometrial ablation versus first‐generation endometrial ablation, outcome: 18.4 Satisfaction rate at 1 year follow‐up (final plot).

Comparison 1 Laser ablation (first generation) versus transcervical resection of the endometrium (TCRE) (first generation), Outcome 1 Bleeding ‐ blood loss (mL) at 6 months.

Comparison 1 Laser ablation (first generation) versus transcervical resection of the endometrium (TCRE) (first generation), Outcome 2 Bleeding.

Comparison 1 Laser ablation (first generation) versus transcervical resection of the endometrium (TCRE) (first generation), Outcome 3 Rate of satisfaction at 12 months (very/moderately).

Comparison 1 Laser ablation (first generation) versus transcervical resection of the endometrium (TCRE) (first generation), Outcome 4 Duration of operation (minutes).

Comparison 1 Laser ablation (first generation) versus transcervical resection of the endometrium (TCRE) (first generation), Outcome 5 Operative difficulties.

Comparison 1 Laser ablation (first generation) versus transcervical resection of the endometrium (TCRE) (first generation), Outcome 6 Good general health.

Comparison 1 Laser ablation (first generation) versus transcervical resection of the endometrium (TCRE) (first generation), Outcome 7 Improvement in menstrual symptoms.

Comparison 1 Laser ablation (first generation) versus transcervical resection of the endometrium (TCRE) (first generation), Outcome 8 Complication rate: major complications.

Comparison 1 Laser ablation (first generation) versus transcervical resection of the endometrium (TCRE) (first generation), Outcome 9 Complication rate: minor complications.

Comparison 1 Laser ablation (first generation) versus transcervical resection of the endometrium (TCRE) (first generation), Outcome 10 Requirement for further surgical treatment (within 12 months).

Comparison 2 Vaporising electrode ablation (first generation) versus TCRE (first generation), Outcome 1 Bleeding ‐ amenorrhoea rate at 12 months' follow‐up.

Comparison 2 Vaporising electrode ablation (first generation) versus TCRE (first generation), Outcome 2 Bleeding ‐ PBAC score at 12 months.

Comparison 2 Vaporising electrode ablation (first generation) versus TCRE (first generation), Outcome 3 Rate of satisfaction at 12 months (very/moderately).

Comparison 2 Vaporising electrode ablation (first generation) versus TCRE (first generation), Outcome 4 Duration of operation (minutes).

Comparison 2 Vaporising electrode ablation (first generation) versus TCRE (first generation), Outcome 5 Operative difficulties.

Comparison 2 Vaporising electrode ablation (first generation) versus TCRE (first generation), Outcome 6 Complication rate: major complications.

Comparison 3 Rollerball (first generation) versus TCRE (first generation), Outcome 1 Duration of operation (minutes).

Comparison 3 Rollerball (first generation) versus TCRE (first generation), Outcome 2 Complication rate: major complications.

Comparison 3 Rollerball (first generation) versus TCRE (first generation), Outcome 3 Requirement for further surgery.

Comparison 4 Thermal laser (second generation) versus TCRE (first generation), Outcome 1 Bleeding ‐ amenorrhoea rate.

Comparison 4 Thermal laser (second generation) versus TCRE (first generation), Outcome 2 Rate of satisfaction.

Comparison 4 Thermal laser (second generation) versus TCRE (first generation), Outcome 3 Duration of operation.

Comparison 4 Thermal laser (second generation) versus TCRE (first generation), Outcome 4 Complication rate: major complications.

Comparison 4 Thermal laser (second generation) versus TCRE (first generation), Outcome 5 Complication rate: minor complications.

Comparison 4 Thermal laser (second generation) versus TCRE (first generation), Outcome 6 Requirement for further surgery rate (hysterectomy only).

Comparison 5 Hydrothermal ablation (second generation) versus rollerball (first generation), Outcome 1 Bleeding.

Comparison 5 Hydrothermal ablation (second generation) versus rollerball (first generation), Outcome 2 Rate of satisfaction.

Comparison 5 Hydrothermal ablation (second generation) versus rollerball (first generation), Outcome 3 Proportion given local rather than general anaesthesia.

Comparison 5 Hydrothermal ablation (second generation) versus rollerball (first generation), Outcome 4 Complication rate: major complications.

Comparison 5 Hydrothermal ablation (second generation) versus rollerball (first generation), Outcome 5 Complication rate: minor complications.

Comparison 5 Hydrothermal ablation (second generation) versus rollerball (first generation), Outcome 6 Requirement for further surgery.

Comparison 6 Cryoablation (second generation) versus rollerball (first generation), Outcome 1 Bleeding.

Comparison 6 Cryoablation (second generation) versus rollerball (first generation), Outcome 2 Rate of satisfaction.

Comparison 6 Cryoablation (second generation) versus rollerball (first generation), Outcome 3 Proportion given local anaesthesia (%).

Comparison 6 Cryoablation (second generation) versus rollerball (first generation), Outcome 4 Complication rate: major complications.

Comparison 6 Cryoablation (second generation) versus rollerball (first generation), Outcome 5 Complication rate: minor complications.

Comparison 6 Cryoablation (second generation) versus rollerball (first generation), Outcome 6 Requirement for further surgery.

Comparison 7 Electrode ablation (second generation) versus TCRE + rollerball (first generation), Outcome 1 Bleeding ‐ amenorrhoea rate at 1 year follow‐up.

Comparison 7 Electrode ablation (second generation) versus TCRE + rollerball (first generation), Outcome 2 Proportion with successful Rx (PBAC < 75).
| Study | Electrode system | TCRE + RB | Stat test for diff |
| Balloon system | |||
| Corson 2000 | N=122 | N=112 | Not significantly different |
| Mesh system | |||
| Cooper 2002 | N=154 | N=82 | No reported difference |
Comparison 7 Electrode ablation (second generation) versus TCRE + rollerball (first generation), Outcome 3 PBAC score 12 months after treatment.

Comparison 7 Electrode ablation (second generation) versus TCRE + rollerball (first generation), Outcome 4 Rate of satisfaction with treatment at 1 year.

Comparison 7 Electrode ablation (second generation) versus TCRE + rollerball (first generation), Outcome 5 Duration of operation (minutes).

Comparison 7 Electrode ablation (second generation) versus TCRE + rollerball (first generation), Outcome 6 Procedure abandon.

Comparison 7 Electrode ablation (second generation) versus TCRE + rollerball (first generation), Outcome 7 Proportion given local anaesthesia (%).

Comparison 7 Electrode ablation (second generation) versus TCRE + rollerball (first generation), Outcome 8 Complication rate: major complications.

Comparison 7 Electrode ablation (second generation) versus TCRE + rollerball (first generation), Outcome 9 Complication rate: minor complications.

Comparison 7 Electrode ablation (second generation) versus TCRE + rollerball (first generation), Outcome 10 Requirement for further surgery at 2 years (hysterectomy).

Comparison 8 Microwave ablation (second generation) versus TCRE + rollerball (first generation), Outcome 1 Bleeding.

Comparison 8 Microwave ablation (second generation) versus TCRE + rollerball (first generation), Outcome 2 Rate of satisfaction.
| Study | Microwave | TCRE | Results |
| Cooper 1999 | N=129 | N=134 | Mann Whitney U test |
Comparison 8 Microwave ablation (second generation) versus TCRE + rollerball (first generation), Outcome 3 Duration of operation (minutes).

Comparison 8 Microwave ablation (second generation) versus TCRE + rollerball (first generation), Outcome 4 Operative difficulties.

Comparison 8 Microwave ablation (second generation) versus TCRE + rollerball (first generation), Outcome 5 Proportion given local anaesthesia.
| Study | Microwave | TCRE | Results |
| Cooper 1999 | N=129 | N=134 | Mann Whitney U test |
Comparison 8 Microwave ablation (second generation) versus TCRE + rollerball (first generation), Outcome 6 Duration of hospital stay (hours).

Comparison 8 Microwave ablation (second generation) versus TCRE + rollerball (first generation), Outcome 7 Inability to work (proportion of women).
| Study | MEA | TCRE | Results |
| Physical functioning | |||
| Cooper 1999 | AT 1 YEAR: At 10 YEARS: N=94 Mean change (SD): ‐4.4 (27) | AT 1 YEAR: At 10 YEARS: N=95 Mean change (SD): ‐3.0 (25) | AT 1 YEAR: At 10 YEARS: t test: NS (95% CI ‐8.9 to 6.1) |
| Social functioning | |||
| Cooper 1999 | AT 1 YEAR: At 10 YEARS: N=94 Mean change (SD): 10.1 (30) | At 1 YEAR: N=124 At 10 YEARS: N=95 Mean change (SD): 9.9 (26) | AT 1 YEAR: At 10 YEARS: t test: NS (95% CI ‐7.9 to 8.3) |
| Physical role | |||
| Cooper 1999 | AT 1 YEAR: At 10 YEARS: N=94 Mean change (SD): 15.0 (53) | AT 1 YEAR: At 10 YEARS: N=95 Mean change (SD): 10.9 (47) | AT 1 YEAR: At 10 YEARS: t test: NS, 95% CI ‐10.3 to 18.5 |
| Emotional role | |||
| Cooper 1999 | AT ONE YEAR: At 10 YEARS: N=94 Mean change (SD): 21.1 (50) | AT 1 YEAR: N=120 At 10 YEARS: N=95 Mean change (SD): 13.5 (47) | AT 1 YEAR: At 10 YEARS: t test: NS, 95% CI 6.3 to 21.5 |
| Mental health | |||
| Cooper 1999 | AT 1 YEAR: At 10 YEARS: N=94 Mean change (SD): 7.2 (21) | AT 1 YEAR: N=120 At 10 YEARS: N=95 Mean change (SD): 7.9 (25) | AT 1 YEAR: At 10 YEARS: t test: NS, 95% CI ‐7.3 to 5.9 |
| Energy/fatigue | |||
| Cooper 1999 | AT 1 YEAR: N=116 At 10 YEARS: N=94 Mean change (SD): 12.9 (29) | AT 1 YEAR: N=120 At 10 YEARS: N=95 Mean change (SD): 15.3 (27) | AT 1 YEAR: At 10 YEARS: t test: NS, 95% CI ‐10.4 to 5.6 |
| Pain | |||
| Cooper 1999 | AT 1 YEAR: N=116 At 10 YEARS: N=94 Mean change (SD): 11.6 (37) | AT 1 YEAR: N=120 At 10 YEARS: N=95 Mean change (SD): 12.3 (35) | AT 1 YEAR: At 10 YEARS: t test: NS, 95% CI ‐11.0 to 9.6 |
| General health | |||
| Cooper 1999 | AT 1 YEAR: N=116 At 10 YEARS: N=94 Mean change (SD): 0.94 (23) | AT 1 YEAR: N=120 At 10 YEARS: N=95 Mean change (SD): 2.8 (22) | AT 1 YEAR: At 10 YEARS: t test: NS, 95% CI ‐8.3 to 4.6 |
Comparison 8 Microwave ablation (second generation) versus TCRE + rollerball (first generation), Outcome 8 Quality of life ‐ change in SF‐36 score after treatment.

Comparison 8 Microwave ablation (second generation) versus TCRE + rollerball (first generation), Outcome 9 Improvement in other menstrual symptoms: PMS.

Comparison 8 Microwave ablation (second generation) versus TCRE + rollerball (first generation), Outcome 10 Improvement in other menstrual symptoms.

Comparison 8 Microwave ablation (second generation) versus TCRE + rollerball (first generation), Outcome 11 Reduction in pain score (points).

Comparison 8 Microwave ablation (second generation) versus TCRE + rollerball (first generation), Outcome 12 Postoperative analgesia rate.

Comparison 8 Microwave ablation (second generation) versus TCRE + rollerball (first generation), Outcome 13 Complication rate: major complications.

Comparison 8 Microwave ablation (second generation) versus TCRE + rollerball (first generation), Outcome 14 Complication rate: minor complications.

Comparison 8 Microwave ablation (second generation) versus TCRE + rollerball (first generation), Outcome 15 Requirement for further surgery.

Comparison 9 Balloon endometrial ablation (second generation) versus rollerball endometrial ablation (first generation), Outcome 1 Bleeding.
| Study | Balloon | Rollerball | Results |
| At 1 year follow‐up | |||
| Meyer 1998 | N=125 | N=114 | No statistical test performed of these outcomes |
| van Zon‐Rabelink 2003 | N=74 | N=55 | Wilcoxon test: |
| At 2 years' follow‐up | |||
| van Zon‐Rabelink 2003 | N=66 | N=55 | Wilcoxon test: P=0.01 |
Comparison 9 Balloon endometrial ablation (second generation) versus rollerball endometrial ablation (first generation), Outcome 2 PBAC score after treatment.

Comparison 9 Balloon endometrial ablation (second generation) versus rollerball endometrial ablation (first generation), Outcome 3 Success of treatment (lighter periods and no further surgery).

Comparison 9 Balloon endometrial ablation (second generation) versus rollerball endometrial ablation (first generation), Outcome 4 Success of treatment (menstrual score < 185).

Comparison 9 Balloon endometrial ablation (second generation) versus rollerball endometrial ablation (first generation), Outcome 5 Rate of satisfaction.

Comparison 9 Balloon endometrial ablation (second generation) versus rollerball endometrial ablation (first generation), Outcome 6 Duration of operation (minutes).

Comparison 9 Balloon endometrial ablation (second generation) versus rollerball endometrial ablation (first generation), Outcome 7 Operative difficulties.

Comparison 9 Balloon endometrial ablation (second generation) versus rollerball endometrial ablation (first generation), Outcome 8 Inability to work (proportion of women).

Comparison 9 Balloon endometrial ablation (second generation) versus rollerball endometrial ablation (first generation), Outcome 9 Improvement in other menstrual symptoms.

Comparison 9 Balloon endometrial ablation (second generation) versus rollerball endometrial ablation (first generation), Outcome 10 Complication rate: major complications.

Comparison 9 Balloon endometrial ablation (second generation) versus rollerball endometrial ablation (first generation), Outcome 11 Complication rate: minor complications.

Comparison 9 Balloon endometrial ablation (second generation) versus rollerball endometrial ablation (first generation), Outcome 12 Requirement for further surgery.

Comparison 10 Balloon (second generation) versus laser (first generation), Outcome 1 Bleeding.
| Study | Balloon | Laser | Statistical test |
| At 6 months' follow‐up | |||
| Hawe 2003 | N=37 | N=33 | Significance not reported |
Comparison 10 Balloon (second generation) versus laser (first generation), Outcome 2 PBAC score after treatment.

Comparison 10 Balloon (second generation) versus laser (first generation), Outcome 3 Rate of satisfaction.

Comparison 10 Balloon (second generation) versus laser (first generation), Outcome 4 Operative difficulties.

Comparison 10 Balloon (second generation) versus laser (first generation), Outcome 5 Pain score 4 hours post procedure.

Comparison 10 Balloon (second generation) versus laser (first generation), Outcome 6 Quality of life.
| Study | Balloon | Laser | Statistical test |
| PMS at 6 months' follow‐up | |||
| Hawe 2003 | N=37 | N=33 | Not reported |
| PMS at 12 months' follow‐up | |||
| Hawe 2003 | N=34 | N=33 | Not reported |
Comparison 10 Balloon (second generation) versus laser (first generation), Outcome 7 Improvement in other menstrual symptoms.
| Study | Balloon | Laser | Statistical test |
| Dysmenorrhoea at 6 months' follow‐up | |||
| Hawe 2003 | N=37 | N=33 | Not reported |
| Dysmenorrhoea at 12 months' follow‐up | |||
| Hawe 2003 | N=34 | N=33 | Not reported |
Comparison 10 Balloon (second generation) versus laser (first generation), Outcome 8 Improvement in other menstrual symptoms: dysmenorrhoea (visual analogue).

Comparison 10 Balloon (second generation) versus laser (first generation), Outcome 9 Requirement for further surgery.

Comparison 11 Balloon (second generation) versus TCRE (first generation), Outcome 1 Bleeding.

Comparison 11 Balloon (second generation) versus TCRE (first generation), Outcome 2 Rate of satisfaction.

Comparison 11 Balloon (second generation) versus TCRE (first generation), Outcome 3 Duration of operation (minutes).
| Study | Cavaterm balloon | TCRE | Comments |
| Brun 2006 | n=31 Median (range): 48 (24‐150) | n=20 Median (range): 45 (23‐105) | No statistical test reported ‐ unlikely to be a difference |
Comparison 11 Balloon (second generation) versus TCRE (first generation), Outcome 4 Duration of operation (minutes).

Comparison 11 Balloon (second generation) versus TCRE (first generation), Outcome 5 Operative difficulties.

Comparison 11 Balloon (second generation) versus TCRE (first generation), Outcome 6 Postoperative pain (continuous data).
| Study | Cavaterm balloon | TCRE | Comments |
| Brun 2006 | n=31 Pain score (VAS scale 0‐100): median (range): 45 (1‐100) | n=20 Pain score (VAS scale 0‐100): median (range): 10 (0‐90) | Mann Whitney rank sum test: P=0.012 |
Comparison 11 Balloon (second generation) versus TCRE (first generation), Outcome 7 Postoperative pain (descriptive data).

Comparison 11 Balloon (second generation) versus TCRE (first generation), Outcome 8 Hospital stay (days).
| Study | Cavaterm balloon | TCRE | Comments |
| Brun 2006 | n=31 Median (range): 21 (0‐36) | n=20 Median (range): 30 (6‐72) | Mann Whitney rank sum test P=0.012 |
Comparison 11 Balloon (second generation) versus TCRE (first generation), Outcome 9 Duration of hospital stay (hours).

Comparison 11 Balloon (second generation) versus TCRE (first generation), Outcome 10 Return to normal activities (days).
| Study | Cavaterm balloon | TCRE | Comments |
| Brun 2006 | n=31 Median (range): 4 (1‐20) | n=20 Median (range): 2 (1‐30) | Mann Whitney rank test ‐ not significantly different |
Comparison 11 Balloon (second generation) versus TCRE (first generation), Outcome 11 Return to normal activities (days).

Comparison 11 Balloon (second generation) versus TCRE (first generation), Outcome 12 Complication rate: major complications.

Comparison 11 Balloon (second generation) versus TCRE (first generation), Outcome 13 Complication rate: minor complications.

Comparison 11 Balloon (second generation) versus TCRE (first generation), Outcome 14 Complication rate: minor complications (dichotomous).

Comparison 11 Balloon (second generation) versus TCRE (first generation), Outcome 15 Requirement for further surgery.

Comparison 12 Bipolar radiofrequency (second generation) versus balloon ablation (second generation), Outcome 1 Bleeding.
| Study | Electrode | Balloon | Statistical test |
| At 6 months' follow‐up | |||
| Penninx 2016 | |||
| At 12 months' follow‐up | |||
| Abbott 2003 | N=37 | N=18 | Mann Whitney |
| Penninx 2016 | N=52 PBAC<100 at 12 months: 44 | N=52 PBAC<100 at 12 months: 31 | RR=0.4 95% CI=0.2‐0.8 |
Comparison 12 Bipolar radiofrequency (second generation) versus balloon ablation (second generation), Outcome 2 PBAC score after treatment.

Comparison 12 Bipolar radiofrequency (second generation) versus balloon ablation (second generation), Outcome 3 Rate of satisfaction.
| Study | Electrode | Balloon | Statistical test |
| Abbott 2003 | N=37 | N=18 | t test |
| Bongers 2004 | N=82 | N=43 | Not reported |
| Clark 2011 | N=42 Mean time in mins (SD): 5.7 (2.1) | N=39 Mean time in mins (SD): 12.5 (2.3) | MD=6.7 mins (95% CI 5.8 to 7.7); p<0.001 Note: this is an office procedure in both arms) |
| Penninx 2016 | N=52 Mean time in mins (range) 10.4 min (6‐30) | N=52 Mean time in mins (range) 12.1 (5‐45) | p=0.34 |
Comparison 12 Bipolar radiofrequency (second generation) versus balloon ablation (second generation), Outcome 4 Duration of operation.

Comparison 12 Bipolar radiofrequency (second generation) versus balloon ablation (second generation), Outcome 5 Operative difficulties.

Comparison 12 Bipolar radiofrequency (second generation) versus balloon ablation (second generation), Outcome 6 Completion of procedure.
| Study | Bipolar RF ablation | Thermal ablation | Results |
| Clark 2011 | N=42 Mean: 6.4 days | N=39 Mean: 6.6 days | No significant difference between groups: 0.2 days difference (95% CI ‐5.9 to 6.2) |
Comparison 12 Bipolar radiofrequency (second generation) versus balloon ablation (second generation), Outcome 7 Time taken off work (days).
| Study | Bipolar RF ablation | Balloon ablation | Results |
| Clark 2011 | N=42 Mean (days): 4.9 | N=39 Mean (days): 8.1 | No significant difference between groups: 3.2 days difference (95% CI ‐1.6 to 8.1) |
Comparison 12 Bipolar radiofrequency (second generation) versus balloon ablation (second generation), Outcome 8 Time to resume normal activities (days).

Comparison 12 Bipolar radiofrequency (second generation) versus balloon ablation (second generation), Outcome 9 Quality of life.

Comparison 12 Bipolar radiofrequency (second generation) versus balloon ablation (second generation), Outcome 10 Menorrhagia Outcome Questionnaire.
| Study | Electrode | Balloon | Statistical test |
| At 12 months' follow‐up | |||
| Abbott 2003 | N=37 | N=18 | Mann Whitney |
Comparison 12 Bipolar radiofrequency (second generation) versus balloon ablation (second generation), Outcome 11 Dysmenorrhoea rate (VAS score).

Comparison 12 Bipolar radiofrequency (second generation) versus balloon ablation (second generation), Outcome 12 Improvement in other menstrual symptoms.
| Study | Electrode | Balloon | Statistical test |
| At 12 months' follow‐up | |||
| Abbott 2003 | N=37 | N=18 | Mann Whitney |
Comparison 12 Bipolar radiofrequency (second generation) versus balloon ablation (second generation), Outcome 13 PMS rate (VAS score).

Comparison 12 Bipolar radiofrequency (second generation) versus balloon ablation (second generation), Outcome 14 Complication rate: major complications.

Comparison 12 Bipolar radiofrequency (second generation) versus balloon ablation (second generation), Outcome 15 Requirement for further surgery.

Comparison 13 Microwave ablation (second generation) versus balloon ablation (second generation), Outcome 1 Bleeding.
| Study | Follow up | Microwave ablation | Balloon ablation | Results |
| Sambrook 2009 | 12 months | N=143 Mean PBAC score (interquartile range): 3.0 (0.0 to 14.0) | N=135 Mean PBAC score (interquartile range): 4.0 (0.0 to 14.0) | Incidence rate ratio (95% CI): 0.91 (0.6 to 1.5) |
Comparison 13 Microwave ablation (second generation) versus balloon ablation (second generation), Outcome 2 PBAC score at 12 months' follow‐up.

Comparison 13 Microwave ablation (second generation) versus balloon ablation (second generation), Outcome 3 Rate of satisfaction.

Comparison 13 Microwave ablation (second generation) versus balloon ablation (second generation), Outcome 4 Operation time (minutes).

Comparison 13 Microwave ablation (second generation) versus balloon ablation (second generation), Outcome 5 Operative difficulties causing failure.

Comparison 13 Microwave ablation (second generation) versus balloon ablation (second generation), Outcome 6 Proportion choosing local anaesthesia.

Comparison 13 Microwave ablation (second generation) versus balloon ablation (second generation), Outcome 7 Proportion requiring opiate analgesia.

Comparison 13 Microwave ablation (second generation) versus balloon ablation (second generation), Outcome 8 Recovery: proportion requiring overnight stay.

Comparison 13 Microwave ablation (second generation) versus balloon ablation (second generation), Outcome 9 Quality of life scores.

Comparison 13 Microwave ablation (second generation) versus balloon ablation (second generation), Outcome 10 Requirement for further surgery (hysterectomy).

Comparison 14 Bipolar radiofrequency (second generation) versus hydrothermal ablation (second generation), Outcome 1 Bleeding.

Comparison 14 Bipolar radiofrequency (second generation) versus hydrothermal ablation (second generation), Outcome 2 Rate of satisfaction.
| Study | Bipolar RF | Hydrotherm ablation | Results |
| Penninx 2010 | N=82 Median (range): 11.8 (5 to 40) | N=74 Median (range): 27.8 (14 to 55) | Test used not stated p<0.001 |
Comparison 14 Bipolar radiofrequency (second generation) versus hydrothermal ablation (second generation), Outcome 3 Duration of procedure (minutes).

Comparison 14 Bipolar radiofrequency (second generation) versus hydrothermal ablation (second generation), Outcome 4 Improvement in other menstrual symptoms.

Comparison 14 Bipolar radiofrequency (second generation) versus hydrothermal ablation (second generation), Outcome 5 Complication rate: major complications.

Comparison 14 Bipolar radiofrequency (second generation) versus hydrothermal ablation (second generation), Outcome 6 Requirement for further surgery.

Comparison 15 Ablative curettage versus overcurettage, Outcome 1 Bleeding.

Comparison 15 Ablative curettage versus overcurettage, Outcome 2 Surgery difficulties: failure rate of procedure.

Comparison 15 Ablative curettage versus overcurettage, Outcome 3 Recovery: hospital stay (days).

Comparison 15 Ablative curettage versus overcurettage, Outcome 4 Complication rate: major complications.

Comparison 15 Ablative curettage versus overcurettage, Outcome 5 Complication rate: minor complications.

Comparison 15 Ablative curettage versus overcurettage, Outcome 6 Requirement for further surgery.

Comparison 16 Microwave ablation (second generation) versus bipolar radiofrequency (second generation), Outcome 1 Bleeding.

Comparison 16 Microwave ablation (second generation) versus bipolar radiofrequency (second generation), Outcome 2 Bleeding PBAC at 12 months' follow‐up.

Comparison 16 Microwave ablation (second generation) versus bipolar radiofrequency (second generation), Outcome 3 Rate of satisfaction.

Comparison 16 Microwave ablation (second generation) versus bipolar radiofrequency (second generation), Outcome 4 Duration of treatment (seconds).

Comparison 16 Microwave ablation (second generation) versus bipolar radiofrequency (second generation), Outcome 5 Improvement in other menstrual symptoms: dysmenorrhoea.

Comparison 16 Microwave ablation (second generation) versus bipolar radiofrequency (second generation), Outcome 6 Complication rate.

Comparison 16 Microwave ablation (second generation) versus bipolar radiofrequency (second generation), Outcome 7 Requirement for further surgery.

Comparison 17 Bipolar (Minerva) (second generation) versus rollerball ablation (first generation), Outcome 1 Bleeding.

Comparison 17 Bipolar (Minerva) (second generation) versus rollerball ablation (first generation), Outcome 2 Rate of satisfaction.

Comparison 17 Bipolar (Minerva) (second generation) versus rollerball ablation (first generation), Outcome 3 Duration of surgery.

Comparison 17 Bipolar (Minerva) (second generation) versus rollerball ablation (first generation), Outcome 4 Improvement in other menstrual symptoms: dysmenorrhoea.

Comparison 17 Bipolar (Minerva) (second generation) versus rollerball ablation (first generation), Outcome 5 Improvement in other menstrual symptoms: PMS at 12 months' follow‐up.

Comparison 17 Bipolar (Minerva) (second generation) versus rollerball ablation (first generation), Outcome 6 Complication rate: major complications.

Comparison 17 Bipolar (Minerva) (second generation) versus rollerball ablation (first generation), Outcome 7 Complication rate: minor complications.

Comparison 17 Bipolar (Minerva) (second generation) versus rollerball ablation (first generation), Outcome 8 Requirement for further surgery.

Comparison 18 Overall analyses: second‐generation endometrial ablation versus first‐generation endometrial ablation, Outcome 1 Bleeding.

Comparison 18 Overall analyses: second‐generation endometrial ablation versus first‐generation endometrial ablation, Outcome 2 Bleeding ‐ amenorrhoea at 12 months' follow‐up (final plot).

Comparison 18 Overall analyses: second‐generation endometrial ablation versus first‐generation endometrial ablation, Outcome 3 Satisfaction rate.

Comparison 18 Overall analyses: second‐generation endometrial ablation versus first‐generation endometrial ablation, Outcome 4 Satisfaction rate at 1 year follow‐up (final plot).

Comparison 18 Overall analyses: second‐generation endometrial ablation versus first‐generation endometrial ablation, Outcome 5 Duration of operation (minutes).

Comparison 18 Overall analyses: second‐generation endometrial ablation versus first‐generation endometrial ablation, Outcome 6 Operative difficulties.

Comparison 18 Overall analyses: second‐generation endometrial ablation versus first‐generation endometrial ablation, Outcome 7 Proportion given local anaesthesia (%).

Comparison 18 Overall analyses: second‐generation endometrial ablation versus first‐generation endometrial ablation, Outcome 8 Inability to work.

Comparison 18 Overall analyses: second‐generation endometrial ablation versus first‐generation endometrial ablation, Outcome 9 Complication rate: major complications.

Comparison 18 Overall analyses: second‐generation endometrial ablation versus first‐generation endometrial ablation, Outcome 10 Complication rate: minor complications.

Comparison 18 Overall analyses: second‐generation endometrial ablation versus first‐generation endometrial ablation, Outcome 11 Requirement for additional surgery.
| Overall analyses: second‐generation endometrial ablation compared to first‐generation endometrial ablation for heavy menstrual bleeding | |||||||
| Patient or population: heavy menstrual bleeding | |||||||
| Outcomes | Anticipated absolute effects* (95% CI) | Relative effect | No. of participants | Certainty of the evidence | Comments | ||
| Risk with first‐generation endometrial ablation | Risk with overall analyses: second‐generation endometrial ablation | ||||||
| Bleeding | Amenorrhoea at 1 year follow‐up | 394 per 1000 | 390 per 1000 | RR 0.99 | 2145 | ⊕⊝⊝⊝ | |
| PBAC < 75 or acceptable improvement at 12 months' follow‐up | 809 per 1000 | 833 per 1000 | RR 1.03 | 1282 | ⊕⊕⊝⊝ | ||
| Amenorrhoea at 2 to 5 years' follow‐up | 484 per 1000 | 561 per 1000 | RR 1.16 | 672 | ⊕⊝⊝⊝ | ||
| PBAC < 75 or acceptable improvement at 5 years' follow‐up | 537 per 1000 | 580 per 1000 | RR 1.08 | 263 | ⊕⊕⊝⊝ | ||
| Satisfaction rate | At 1 year follow‐up | 898 per 1000 | 907 per 1000 | RR 1.01 | 1750 | ⊕⊕⊝⊝ | |
| At 2 to 5 years' follow‐up | 868 per 1000 | 886 per 1000 | RR 1.02 | 672 | ⊕⊝⊝⊝ | ||
| Duration of operation (minutes) | Mean duration of operation (minutes) was 27 | MD 13.52 lower | ‐ | 1822 | ⊕⊝⊝⊝ | ||
| Proportion given local anaesthesia (%) | 208 per 1000 | 578 per 1000 | RR 2.78 | 1434 | ⊕⊝⊝⊝ | ||
| Complication rate ‐ perforation | 13 per 1000 | 4 per 1000 | RR 0.32 | 1885 | ⊕⊕⊝⊝ | ||
| Requirement for additional surgery | At 1 year follow‐up (ablation or hysterectomy) | 66 per 1000 | 47 per 1000 | RR 0.72 | 935 | ⊕⊕⊝⊝ | |
| At 2 to 5 years' follow‐up (hysterectomy) | 191 per 1000 | 162 per 1000 | RR 0.85 | 758 | ⊕⊕⊕⊝ | ||
| *The risk in the intervention group (and its 95% confidence interval) is based on the assumed risk in the comparison group and the relative effect of the intervention (and its 95% CI). | |||||||
| GRADE Working Group grades of evidence. | |||||||
| aEight studies provided insufficient details for a judgement about allocation concealment; downgraded one level. bHeterogeneity was high at I² > 75%; downgraded two levels. cThe funnel plot suggested asymmetry; downgraded one level. dOnly two studies provided sufficient details for a judgement about allocation concealment; no blinding of participants/researchers or outcome assessors; downgraded one level. eNo blinding of participants/researchers or outcome assessors; downgraded one level. fThree studies provided insufficient details for a judgement about allocation concealment; only one study provided adequate data on blinding of participants/researchers and outcome assessors; downgraded two levels. gEvidence of imprecision based on one study with n < 300; downgraded one level. hOnly one study provided adequate data on blinding of participants/researchers and outcome assessors; downgraded one level. iOnly one study provided sufficient details for a judgement about allocation concealment; downgraded one level. jThe confidence interval has a very wide range (1.76 to 4.40); downgraded one level. kThe number of events is very low and the confidence interval is wide; downgraded one level. lThe number of events is very low; downgraded one level. | |||||||
| Outcome or subgroup title | No. of studies | No. of participants | Statistical method | Effect size |
| 1 Bleeding ‐ blood loss (mL) at 6 months Show forest plot | 1 | 22 | Mean Difference (IV, Fixed, 95% CI) | 23.6 [‐8.32, 55.52] |
| 2 Bleeding Show forest plot | 2 | Risk Ratio (M‐H, Fixed, 95% CI) | Subtotals only | |
| 2.1 Amenorrhoea rate at 6 months | 2 | 348 | Risk Ratio (M‐H, Fixed, 95% CI) | 0.97 [0.66, 1.45] |
| 2.2 Amenorrhoea/hypomenorrhoea rate at 6 months | 1 | 326 | Risk Ratio (M‐H, Fixed, 95% CI) | 0.97 [0.89, 1.05] |
| 2.3 Amenorrhoea/hypomenorrhoea rate at 12 months | 1 | 306 | Risk Ratio (M‐H, Fixed, 95% CI) | 1.06 [0.92, 1.22] |
| 3 Rate of satisfaction at 12 months (very/moderately) Show forest plot | 1 | 321 | Risk Ratio (M‐H, Fixed, 95% CI) | 0.99 [0.92, 1.06] |
| 4 Duration of operation (minutes) Show forest plot | 2 | 386 | Mean Difference (IV, Fixed, 95% CI) | 9.15 [7.21, 11.09] |
| 5 Operative difficulties Show forest plot | 1 | Risk Ratio (M‐H, Fixed, 95% CI) | Subtotals only | |
| 5.1 Procedure abandoned | 1 | 366 | Risk Ratio (M‐H, Fixed, 95% CI) | 1.47 [0.61, 3.51] |
| 5.2 Failed instrumentation | 1 | 366 | Risk Ratio (M‐H, Fixed, 95% CI) | 0.20 [0.01, 4.05] |
| 5.3 Equipment failure | 1 | 366 | Risk Ratio (M‐H, Fixed, 95% CI) | 5.54 [1.65, 18.60] |
| 5.4 Immediate hysterectomy | 1 | 366 | Risk Ratio (M‐H, Fixed, 95% CI) | 0.33 [0.01, 7.95] |
| 6 Good general health Show forest plot | 1 | 321 | Risk Ratio (M‐H, Fixed, 95% CI) | 1.03 [0.95, 1.12] |
| 7 Improvement in menstrual symptoms Show forest plot | 1 | Risk Ratio (M‐H, Fixed, 95% CI) | Subtotals only | |
| 7.1 Improvement in symptoms (general) | 1 | 321 | Risk Ratio (M‐H, Fixed, 95% CI) | 1.03 [0.87, 1.21] |
| 7.2 Improvement in dysmenorrhoea at 6 months | 1 | 253 | Risk Ratio (M‐H, Fixed, 95% CI) | 1.17 [1.00, 1.38] |
| 7.3 Improvement in dysmenorrhoea at 12 months | 1 | 218 | Risk Ratio (M‐H, Fixed, 95% CI) | 1.00 [0.87, 1.15] |
| 8 Complication rate: major complications Show forest plot | 2 | 2218 | Risk Ratio (M‐H, Fixed, 95% CI) | 1.41 [0.83, 2.41] |
| 8.1 Perforation | 1 | 366 | Risk Ratio (M‐H, Fixed, 95% CI) | 0.14 [0.01, 2.69] |
| 8.2 Bowel obstruction | 1 | 366 | Risk Ratio (M‐H, Fixed, 95% CI) | 2.94 [0.12, 71.59] |
| 8.3 Pelvic sepsis | 1 | 366 | Risk Ratio (M‐H, Fixed, 95% CI) | 0.82 [0.25, 2.62] |
| 8.4 Haematometra | 1 | 366 | Risk Ratio (M‐H, Fixed, 95% CI) | 0.20 [0.01, 4.05] |
| 8.5 Glycine toxicity | 1 | 22 | Risk Ratio (M‐H, Fixed, 95% CI) | 4.23 [0.23, 79.10] |
| 8.6 Fluid overload (> 1.5 L) | 1 | 366 | Risk Ratio (M‐H, Fixed, 95% CI) | 4.89 [1.44, 16.61] |
| 8.7 Uterine tamponade | 1 | 366 | Risk Ratio (M‐H, Fixed, 95% CI) | 1.14 [0.39, 3.33] |
| 9 Complication rate: minor complications Show forest plot | 1 | Risk Ratio (M‐H, Fixed, 95% CI) | Subtotals only | |
| 9.1 Burns | 1 | 366 | Risk Ratio (M‐H, Fixed, 95% CI) | 4.89 [0.24, 101.21] |
| 9.2 Urinary tract infection | 1 | 366 | Risk Ratio (M‐H, Fixed, 95% CI) | 1.96 [0.36, 10.55] |
| 10 Requirement for further surgical treatment (within 12 months) Show forest plot | 2 | 388 | Risk Ratio (M‐H, Fixed, 95% CI) | 0.84 [0.55, 1.29] |
| Outcome or subgroup title | No. of studies | No. of participants | Statistical method | Effect size |
| 1 Bleeding ‐ amenorrhoea rate at 12 months' follow‐up Show forest plot | 1 | 182 | Risk Ratio (M‐H, Fixed, 95% CI) | 0.90 [0.73, 1.12] |
| 1.1 Amenorrhoea rate at 12 months' follow‐up | 1 | 91 | Risk Ratio (M‐H, Fixed, 95% CI) | 0.76 [0.46, 1.24] |
| 1.2 Amenorrhea/hypomenorrhoea rate at 12 months' follow‐up | 1 | 91 | Risk Ratio (M‐H, Fixed, 95% CI) | 0.99 [0.80, 1.22] |
| 2 Bleeding ‐ PBAC score at 12 months Show forest plot | 1 | 91 | Mean Difference (IV, Fixed, 95% CI) | ‐5.0 [‐19.18, 9.18] |
| 3 Rate of satisfaction at 12 months (very/moderately) Show forest plot | 1 | 91 | Risk Ratio (M‐H, Fixed, 95% CI) | 1.03 [0.93, 1.14] |
| 4 Duration of operation (minutes) Show forest plot | 1 | 91 | Mean Difference (IV, Fixed, 95% CI) | ‐1.50 [‐2.65, ‐0.35] |
| 5 Operative difficulties Show forest plot | 1 | Risk Ratio (M‐H, Fixed, 95% CI) | Subtotals only | |
| 5.1 Difficulty with surgery (moderate or severe) | 1 | 91 | Risk Ratio (M‐H, Fixed, 95% CI) | 0.29 [0.10, 0.82] |
| 6 Complication rate: major complications Show forest plot | 1 | 91 | Mean Difference (IV, Fixed, 95% CI) | ‐258.0 [‐342.05, ‐173.95] |
| 6.1 Degree of fluid deficit (mL) | 1 | 91 | Mean Difference (IV, Fixed, 95% CI) | ‐258.0 [‐342.05, ‐173.95] |
| Outcome or subgroup title | No. of studies | No. of participants | Statistical method | Effect size |
| 1 Duration of operation (minutes) Show forest plot | 1 | 45 | Mean Difference (IV, Fixed, 95% CI) | ‐1.10 [‐2.92, 0.72] |
| 2 Complication rate: major complications Show forest plot | 1 | Risk Ratio (M‐H, Fixed, 95% CI) | Subtotals only | |
| 2.1 Fluid deficit | 1 | 120 | Risk Ratio (M‐H, Fixed, 95% CI) | 0.32 [0.01, 7.76] |
| 2.2 Perforation | 1 | 120 | Risk Ratio (M‐H, Fixed, 95% CI) | 0.32 [0.01, 7.76] |
| 3 Requirement for further surgery Show forest plot | 1 | Risk Ratio (M‐H, Fixed, 95% CI) | Subtotals only | |
| 3.1 At 2 years' follow‐up hysterectomy or ablation | 1 | 120 | Risk Ratio (M‐H, Fixed, 95% CI) | 1.04 [0.55, 1.95] |
| 3.2 At 2 years' follow‐up (hysterectomy only) | 1 | 120 | Risk Ratio (M‐H, Fixed, 95% CI) | 1.45 [0.43, 4.88] |
| 3.3 At 2 to 5 years' follow‐up (hysterectomy or ablation) | 1 | 120 | Risk Ratio (M‐H, Fixed, 95% CI) | 1.21 [0.70, 2.10] |
| 3.4 At 2 to 5 years' follow‐up (hysterectomy only) | 1 | 120 | Risk Ratio (M‐H, Fixed, 95% CI) | 1.21 [0.51, 2.85] |
| 3.5 At more than 5 years' follow‐up (hysterectomy or ablation) | 1 | 120 | Risk Ratio (M‐H, Fixed, 95% CI) | 1.39 [0.82, 2.36] |
| 3.6 At more than 5 years' follow‐up (hysterectomy only) | 1 | 120 | Risk Ratio (M‐H, Fixed, 95% CI) | 1.32 [0.66, 2.63] |
| Outcome or subgroup title | No. of studies | No. of participants | Statistical method | Effect size |
| 1 Bleeding ‐ amenorrhoea rate Show forest plot | 1 | Risk Ratio (M‐H, Fixed, 95% CI) | Subtotals only | |
| 1.1 At 1 year follow‐up | 1 | 111 | Risk Ratio (M‐H, Fixed, 95% CI) | 2.46 [1.50, 4.03] |
| 1.2 At 2 to 5 years' follow‐up | 1 | 111 | Risk Ratio (M‐H, Fixed, 95% CI) | 2.49 [1.48, 4.21] |
| 2 Rate of satisfaction Show forest plot | 1 | Risk Ratio (M‐H, Fixed, 95% CI) | Subtotals only | |
| 2.1 At 1 year follow‐up | 1 | 111 | Risk Ratio (M‐H, Fixed, 95% CI) | 1.04 [0.94, 1.16] |
| 2.2 At 2 to 5 years' follow‐up | 1 | 111 | Risk Ratio (M‐H, Fixed, 95% CI) | 1.02 [0.91, 1.14] |
| 3 Duration of operation Show forest plot | 1 | 111 | Mean Difference (IV, Fixed, 95% CI) | ‐9.30 [‐11.36, ‐7.24] |
| 4 Complication rate: major complications Show forest plot | 1 | Risk Ratio (M‐H, Fixed, 95% CI) | Subtotals only | |
| 4.1 Perforation | 1 | 111 | Risk Ratio (M‐H, Fixed, 95% CI) | 0.0 [0.0, 0.0] |
| 5 Complication rate: minor complications Show forest plot | 1 | 111 | Odds Ratio (M‐H, Fixed, 95% CI) | 0.48 [0.04, 5.47] |
| 5.1 UTI | 1 | 111 | Odds Ratio (M‐H, Fixed, 95% CI) | 0.48 [0.04, 5.47] |
| 6 Requirement for further surgery rate (hysterectomy only) Show forest plot | 1 | 111 | Risk Ratio (M‐H, Fixed, 95% CI) | 0.59 [0.15, 2.35] |
| 6.1 At 2 to 5 years' follow‐up | 1 | 111 | Risk Ratio (M‐H, Fixed, 95% CI) | 0.59 [0.15, 2.35] |
| Outcome or subgroup title | No. of studies | No. of participants | Statistical method | Effect size |
| 1 Bleeding Show forest plot | 1 | Risk Ratio (M‐H, Fixed, 95% CI) | Subtotals only | |
| 1.1 PBAC ≤ 75 at 1 year follow‐up | 1 | 250 | Risk Ratio (M‐H, Fixed, 95% CI) | 0.94 [0.82, 1.07] |
| 1.2 PBAC ≤ 100 at 1 year follow‐up | 1 | 250 | Risk Ratio (M‐H, Fixed, 95% CI) | 0.96 [0.86, 1.07] |
| 1.3 PBAC ≤ 100 at 2 years' follow‐up | 1 | 225 | Risk Ratio (M‐H, Fixed, 95% CI) | 1.00 [0.92, 1.09] |
| 1.4 PBAC ≤ 100 at 2 to 5 years' follow‐up | 1 | 203 | Risk Ratio (M‐H, Fixed, 95% CI) | 1.03 [0.95, 1.12] |
| 1.5 Amenorrhoea at 1 year follow‐up | 1 | 250 | Risk Ratio (M‐H, Fixed, 95% CI) | 0.79 [0.60, 1.05] |
| 1.6 Amenorrhoea at 2 years' follow‐up | 1 | 225 | Risk Ratio (M‐H, Fixed, 95% CI) | 1.01 [0.75, 1.36] |
| 1.7 Amenorrhoea at 2 to 5 years' follow‐up | 1 | 203 | Risk Ratio (M‐H, Fixed, 95% CI) | 1.17 [0.86, 1.59] |
| 2 Rate of satisfaction Show forest plot | 1 | 203 | Risk Ratio (M‐H, Fixed, 95% CI) | 1.01 [0.96, 1.06] |
| 2.1 At 2 to 5 years' follow‐up | 1 | 203 | Risk Ratio (M‐H, Fixed, 95% CI) | 1.01 [0.96, 1.06] |
| 3 Proportion given local rather than general anaesthesia Show forest plot | 1 | 269 | Risk Ratio (M‐H, Fixed, 95% CI) | 2.02 [1.32, 3.09] |
| 4 Complication rate: major complications Show forest plot | 1 | Risk Ratio (M‐H, Fixed, 95% CI) | Subtotals only | |
| 4.1 Cervical lacerations | 1 | 269 | Risk Ratio (M‐H, Fixed, 95% CI) | 0.09 [0.00, 1.92] |
| 4.2 Haematometra | 1 | 269 | Risk Ratio (M‐H, Fixed, 95% CI) | 0.18 [0.04, 0.93] |
| 4.3 Endometritis | 1 | 269 | Risk Ratio (M‐H, Fixed, 95% CI) | 0.92 [0.08, 10.05] |
| 5 Complication rate: minor complications Show forest plot | 1 | Risk Ratio (M‐H, Fixed, 95% CI) | Subtotals only | |
| 5.1 Abdominal pain (at 2 weeks) | 1 | 269 | Risk Ratio (M‐H, Fixed, 95% CI) | 1.40 [1.03, 1.90] |
| 5.2 Nausea or vomiting | 1 | 269 | Risk Ratio (M‐H, Fixed, 95% CI) | 3.08 [1.36, 6.98] |
| 5.3 Uterine cramping | 1 | 269 | Risk Ratio (M‐H, Fixed, 95% CI) | 1.12 [0.72, 1.74] |
| 5.4 Urinary tract infection | 1 | 269 | Risk Ratio (M‐H, Fixed, 95% CI) | 1.15 [0.23, 5.83] |
| 5.5 First‐degree burn | 1 | 269 | Risk Ratio (M‐H, Fixed, 95% CI) | 2.32 [0.11, 47.89] |
| 6 Requirement for further surgery Show forest plot | 1 | Risk Ratio (M‐H, Fixed, 95% CI) | Subtotals only | |
| 6.1 At 1 year follow‐up (any surgery) | 1 | 269 | Risk Ratio (M‐H, Fixed, 95% CI) | 2.32 [0.11, 47.89] |
| 6.2 At 2 to 5 years' follow‐up (any surgery) | 1 | 262 | Risk Ratio (M‐H, Fixed, 95% CI) | 1.26 [0.58, 2.73] |
| 6.3 At 5 years' follow‐up (hysterectomy only) | 1 | 262 | Risk Ratio (M‐H, Fixed, 95% CI) | 1.54 [0.58, 4.06] |
| Outcome or subgroup title | No. of studies | No. of participants | Statistical method | Effect size |
| 1 Bleeding Show forest plot | 1 | 228 | Risk Ratio (M‐H, Fixed, 95% CI) | 0.50 [0.36, 0.69] |
| 1.1 Amenorrhoea at 1 year follow‐up | 1 | 228 | Risk Ratio (M‐H, Fixed, 95% CI) | 0.50 [0.36, 0.69] |
| 2 Rate of satisfaction Show forest plot | 1 | Risk Ratio (M‐H, Fixed, 95% CI) | Subtotals only | |
| 2.1 At 1 year follow‐up | 1 | 279 | Risk Ratio (M‐H, Fixed, 95% CI) | 1.06 [0.96, 1.17] |
| 2.2 At 2 years' follow‐up | 1 | 137 | Risk Ratio (M‐H, Fixed, 95% CI) | 1.04 [0.91, 1.17] |
| 3 Proportion given local anaesthesia (%) Show forest plot | 1 | 279 | Risk Ratio (M‐H, Fixed, 95% CI) | 6.62 [3.22, 13.63] |
| 4 Complication rate: major complications Show forest plot | 1 | Risk Ratio (M‐H, Fixed, 95% CI) | Subtotals only | |
| 4.1 Perforation | 1 | 279 | Risk Ratio (M‐H, Fixed, 95% CI) | 0.15 [0.01, 3.63] |
| 5 Complication rate: minor complications Show forest plot | 1 | 1116 | Odds Ratio (M‐H, Fixed, 95% CI) | 0.56 [0.15, 2.09] |
| 5.1 Vaginal bleeding | 1 | 279 | Odds Ratio (M‐H, Fixed, 95% CI) | 1.35 [0.05, 33.43] |
| 5.2 Abdominal cramping | 1 | 279 | Odds Ratio (M‐H, Fixed, 95% CI) | 2.26 [0.11, 47.54] |
| 5.3 UTI | 1 | 279 | Odds Ratio (M‐H, Fixed, 95% CI) | 0.15 [0.01, 3.65] |
| 5.4 Severe pelvic pain | 1 | 279 | Odds Ratio (M‐H, Fixed, 95% CI) | 0.15 [0.01, 3.65] |
| 6 Requirement for further surgery Show forest plot | 1 | Risk Ratio (M‐H, Fixed, 95% CI) | Subtotals only | |
| 6.1 At 2 years' follow‐up (any surgery) | 1 | 279 | Risk Ratio (M‐H, Fixed, 95% CI) | 1.00 [0.45, 2.22] |
| 6.2 At 2 years' follow‐up (hysterectomy) | 1 | 279 | Risk Ratio (M‐H, Fixed, 95% CI) | 0.83 [0.34, 2.00] |
| Outcome or subgroup title | No. of studies | No. of participants | Statistical method | Effect size |
| 1 Bleeding ‐ amenorrhoea rate at 1 year follow‐up Show forest plot | 2 | 470 | Risk Ratio (M‐H, Fixed, 95% CI) | 1.02 [0.79, 1.31] |
| 1.1 Balloon system | 1 | 234 | Risk Ratio (M‐H, Fixed, 95% CI) | 0.89 [0.62, 1.29] |
| 1.2 Mesh system | 1 | 236 | Risk Ratio (M‐H, Fixed, 95% CI) | 1.16 [0.82, 1.64] |
| 2 Proportion with successful Rx (PBAC < 75) Show forest plot | 2 | 470 | Risk Ratio (M‐H, Fixed, 95% CI) | 1.06 [0.98, 1.15] |
| 2.1 Balloon system | 1 | 234 | Risk Ratio (M‐H, Fixed, 95% CI) | 1.05 [0.94, 1.17] |
| 2.2 Mesh system | 1 | 236 | Risk Ratio (M‐H, Fixed, 95% CI) | 1.08 [0.96, 1.22] |
| 3 PBAC score 12 months after treatment Show forest plot | Other data | No numeric data | ||
| 3.1 Balloon system | Other data | No numeric data | ||
| 3.2 Mesh system | Other data | No numeric data | ||
| 4 Rate of satisfaction with treatment at 1 year Show forest plot | 1 | 236 | Risk Ratio (M‐H, Fixed, 95% CI) | 0.99 [0.92, 1.06] |
| 4.1 Mesh system | 1 | 236 | Risk Ratio (M‐H, Fixed, 95% CI) | 0.99 [0.92, 1.06] |
| 5 Duration of operation (minutes) Show forest plot | 2 | 520 | Mean Difference (IV, Fixed, 95% CI) | ‐18.70 [‐20.66, ‐16.75] |
| 5.1 Balloon system | 1 | 255 | Mean Difference (IV, Fixed, 95% CI) | ‐16.20 [‐19.55, ‐12.85] |
| 5.2 Mesh system | 1 | 265 | Mean Difference (IV, Fixed, 95% CI) | ‐20.0 [‐22.41, ‐17.59] |
| 6 Procedure abandon Show forest plot | 1 | 267 | Odds Ratio (M‐H, Fixed, 95% CI) | 2.58 [0.10, 63.95] |
| 7 Proportion given local anaesthesia (%) Show forest plot | 2 | 520 | Risk Ratio (M‐H, Fixed, 95% CI) | 3.85 [2.94, 5.04] |
| 7.1 Balloon system | 1 | 255 | Risk Ratio (M‐H, Fixed, 95% CI) | 3.66 [2.65, 5.07] |
| 7.2 Mesh system | 1 | 265 | Risk Ratio (M‐H, Fixed, 95% CI) | 4.11 [2.61, 6.47] |
| 8 Complication rate: major complications Show forest plot | 2 | Risk Ratio (M‐H, Fixed, 95% CI) | Subtotals only | |
| 8.1 Cervical tear/stenosis | 2 | 532 | Risk Ratio (M‐H, Fixed, 95% CI) | 0.11 [0.01, 0.87] |
| 8.2 Perforation | 2 | 532 | Risk Ratio (M‐H, Fixed, 95% CI) | 0.13 [0.02, 1.01] |
| 8.3 Pelvic abscess | 1 | 265 | Risk Ratio (M‐H, Fixed, 95% CI) | 0.17 [0.01, 4.19] |
| 8.4 Haematometra | 2 | 532 | Risk Ratio (M‐H, Fixed, 95% CI) | 0.43 [0.08, 2.23] |
| 8.5 Fluid overload | 1 | 267 | Risk Ratio (M‐H, Fixed, 95% CI) | 0.29 [0.01, 6.93] |
| 8.6 Myometritis | 1 | 267 | Risk Ratio (M‐H, Fixed, 95% CI) | 0.29 [0.01, 6.93] |
| 8.7 Urinary incontinence | 1 | 267 | Risk Ratio (M‐H, Fixed, 95% CI) | 0.29 [0.01, 6.93] |
| 8.8 PID | 1 | 265 | Risk Ratio (M‐H, Fixed, 95% CI) | 1.03 [0.09, 11.19] |
| 8.9 Endometritis | 1 | 265 | Risk Ratio (M‐H, Fixed, 95% CI) | 0.34 [0.06, 2.01] |
| 9 Complication rate: minor complications Show forest plot | 2 | Risk Ratio (M‐H, Fixed, 95% CI) | Subtotals only | |
| 9.1 Nausea/vomiting or severe pelvic pain | 2 | 532 | Risk Ratio (M‐H, Fixed, 95% CI) | 1.10 [0.37, 3.27] |
| 9.2 UTI | 2 | 532 | Risk Ratio (M‐H, Fixed, 95% CI) | 1.05 [0.39, 2.84] |
| 9.3 Fever | 1 | 267 | Risk Ratio (M‐H, Fixed, 95% CI) | 0.85 [0.05, 13.51] |
| 9.4 Haemorrhage | 1 | 265 | Risk Ratio (M‐H, Fixed, 95% CI) | 0.51 [0.03, 8.13] |
| 9.5 Bradycardia | 1 | 265 | Risk Ratio (M‐H, Fixed, 95% CI) | 1.55 [0.06, 37.70] |
| 10 Requirement for further surgery at 2 years (hysterectomy) Show forest plot | 1 | 255 | Risk Ratio (M‐H, Fixed, 95% CI) | 0.52 [0.18, 1.50] |
| 10.1 Balloon system | 1 | 255 | Risk Ratio (M‐H, Fixed, 95% CI) | 0.52 [0.18, 1.50] |
| Outcome or subgroup title | No. of studies | No. of participants | Statistical method | Effect size |
| 1 Bleeding Show forest plot | 2 | Risk Ratio (M‐H, Fixed, 95% CI) | Subtotals only | |
| 1.1 PBAC < 75 or acceptable improvement at 1 year follow‐up | 2 | 562 | Risk Ratio (M‐H, Fixed, 95% CI) | 1.04 [0.96, 1.13] |
| 1.2 PBAC < 75 or acceptable improvement at 2 to 5 years' follow‐up | 1 | 236 | Risk Ratio (M‐H, Fixed, 95% CI) | 1.12 [0.97, 1.28] |
| 1.3 PBAC < 75 or acceptable improvement at > 5 years' follow‐up | 1 | 263 | Risk Ratio (M‐H, Fixed, 95% CI) | 1.08 [0.87, 1.34] |
| 1.4 Amenorrhoea at 1 year follow‐up | 2 | 562 | Risk Ratio (M‐H, Fixed, 95% CI) | 1.12 [0.93, 1.36] |
| 1.5 Amenorrhoea at 2 years' follow‐up | 1 | 249 | Risk Ratio (M‐H, Fixed, 95% CI) | 1.16 [0.87, 1.53] |
| 1.6 Amenorrhoea at 2 to 5 years' follow‐up | 1 | 236 | Risk Ratio (M‐H, Fixed, 95% CI) | 0.93 [0.78, 1.12] |
| 1.7 Amenorrhoea at > 5 years' follow‐up | 1 | 189 | Risk Ratio (M‐H, Fixed, 95% CI) | 0.94 [0.83, 1.05] |
| 2 Rate of satisfaction Show forest plot | 2 | Risk Ratio (M‐H, Fixed, 95% CI) | Subtotals only | |
| 2.1 At 1 year follow‐up | 2 | 533 | Risk Ratio (M‐H, Fixed, 95% CI) | 1.01 [0.95, 1.07] |
| 2.2 At 2 years' follow‐up | 1 | 249 | Risk Ratio (M‐H, Fixed, 95% CI) | 1.19 [1.02, 1.38] |
| 2.3 At 2 to 5 years' follow‐up | 1 | 236 | Risk Ratio (M‐H, Fixed, 95% CI) | 1.19 [1.04, 1.36] |
| 2.4 At 10 years' follow‐up | 1 | 189 | Risk Ratio (M‐H, Fixed, 95% CI) | 1.11 [0.95, 1.30] |
| 3 Duration of operation (minutes) Show forest plot | Other data | No numeric data | ||
| 4 Operative difficulties Show forest plot | 1 | Risk Ratio (M‐H, Fixed, 95% CI) | Subtotals only | |
| 4.1 Equipment failure | 1 | 263 | Risk Ratio (M‐H, Fixed, 95% CI) | 3.81 [1.09, 13.34] |
| 4.2 Procedure abandoned | 1 | 263 | Risk Ratio (M‐H, Fixed, 95% CI) | 1.04 [0.31, 3.50] |
| 5 Proportion given local anaesthesia Show forest plot | 1 | 315 | Risk Ratio (M‐H, Fixed, 95% CI) | 2.54 [1.73, 3.72] |
| 6 Duration of hospital stay (hours) Show forest plot | Other data | No numeric data | ||
| 7 Inability to work (proportion of women) Show forest plot | 1 | Risk Ratio (M‐H, Fixed, 95% CI) | Subtotals only | |
| 7.1 At 12 months' follow‐up | 1 | 240 | Risk Ratio (M‐H, Fixed, 95% CI) | 0.53 [0.17, 1.73] |
| 7.2 At > 5 years' follow‐up | 1 | 189 | Risk Ratio (M‐H, Fixed, 95% CI) | 1.52 [0.26, 8.87] |
| 8 Quality of life ‐ change in SF‐36 score after treatment Show forest plot | Other data | No numeric data | ||
| 8.1 Physical functioning | Other data | No numeric data | ||
| 8.2 Social functioning | Other data | No numeric data | ||
| 8.3 Physical role | Other data | No numeric data | ||
| 8.4 Emotional role | Other data | No numeric data | ||
| 8.5 Mental health | Other data | No numeric data | ||
| 8.6 Energy/fatigue | Other data | No numeric data | ||
| 8.7 Pain | Other data | No numeric data | ||
| 8.8 General health | Other data | No numeric data | ||
| 9 Improvement in other menstrual symptoms: PMS Show forest plot | 1 | Risk Ratio (M‐H, Fixed, 95% CI) | Subtotals only | |
| 9.1 At 1 year follow‐up | 1 | 240 | Risk Ratio (M‐H, Fixed, 95% CI) | 1.03 [0.90, 1.19] |
| 9.2 At 2 to 5 years' follow‐up | 1 | 236 | Risk Ratio (M‐H, Fixed, 95% CI) | 1.12 [0.97, 1.28] |
| 10 Improvement in other menstrual symptoms Show forest plot | 2 | Risk Ratio (M‐H, Fixed, 95% CI) | Subtotals only | |
| 10.1 Improvement in dysmenorrhoea at 1 year follow‐up | 2 | 533 | Risk Ratio (M‐H, Fixed, 95% CI) | 0.98 [0.89, 1.09] |
| 10.2 Improvement in dysmenorrhoea at 2 years' follow‐up | 1 | 249 | Risk Ratio (M‐H, Fixed, 95% CI) | 1.05 [0.93, 1.19] |
| 11 Reduction in pain score (points) Show forest plot | 1 | 189 | Mean Difference (IV, Fixed, 95% CI) | ‐0.80 [‐4.32, 2.72] |
| 11.1 At > 5 years' follow‐up | 1 | 189 | Mean Difference (IV, Fixed, 95% CI) | ‐0.80 [‐4.32, 2.72] |
| 12 Postoperative analgesia rate Show forest plot | 1 | 263 | Risk Ratio (M‐H, Fixed, 95% CI) | 0.94 [0.81, 1.10] |
| 13 Complication rate: major complications Show forest plot | 2 | Risk Ratio (M‐H, Fixed, 95% CI) | Subtotals only | |
| 13.1 Perforation | 2 | 585 | Risk Ratio (M‐H, Fixed, 95% CI) | 1.63 [0.22, 12.12] |
| 13.2 Cervical laceration | 1 | 322 | Risk Ratio (M‐H, Fixed, 95% CI) | 0.50 [0.07, 3.48] |
| 13.3 Cervical stenosis | 1 | 322 | Risk Ratio (M‐H, Fixed, 95% CI) | 1.5 [0.06, 36.52] |
| 13.4 Endometritis | 1 | 322 | Risk Ratio (M‐H, Fixed, 95% CI) | 6.5 [0.37, 114.31] |
| 14 Complication rate: minor complications Show forest plot | 2 | Risk Ratio (M‐H, Fixed, 95% CI) | Subtotals only | |
| 14.1 Chills | 1 | 322 | Risk Ratio (M‐H, Fixed, 95% CI) | 1.35 [0.59, 3.11] |
| 14.2 Bloating | 1 | 322 | Risk Ratio (M‐H, Fixed, 95% CI) | 0.83 [0.38, 1.83] |
| 14.3 Dysuria | 1 | 322 | Risk Ratio (M‐H, Fixed, 95% CI) | 0.77 [0.37, 1.58] |
| 14.4 Fever | 1 | 322 | Risk Ratio (M‐H, Fixed, 95% CI) | 2.5 [0.12, 51.62] |
| 14.5 Headache | 1 | 322 | Risk Ratio (M‐H, Fixed, 95% CI) | 0.75 [0.22, 2.59] |
| 14.6 Nausea | 1 | 322 | Risk Ratio (M‐H, Fixed, 95% CI) | 1.35 [0.83, 2.21] |
| 14.7 Vomiting | 1 | 322 | Risk Ratio (M‐H, Fixed, 95% CI) | 3.61 [1.30, 10.00] |
| 14.8 UTI | 1 | 322 | Risk Ratio (M‐H, Fixed, 95% CI) | 0.50 [0.03, 7.88] |
| 14.9 Vaginal infection | 1 | 322 | Risk Ratio (M‐H, Fixed, 95% CI) | 1.5 [0.06, 36.52] |
| 14.10 Uterine cramping | 1 | 322 | Risk Ratio (M‐H, Fixed, 95% CI) | 1.21 [1.01, 1.44] |
| 14.11 Abdominal tenderness | 1 | 322 | Risk Ratio (M‐H, Fixed, 95% CI) | 0.61 [0.26, 1.42] |
| 14.12 Haemorrhage | 1 | 263 | Risk Ratio (M‐H, Fixed, 95% CI) | 0.09 [0.01, 1.69] |
| 15 Requirement for further surgery Show forest plot | 2 | Risk Ratio (M‐H, Fixed, 95% CI) | Subtotals only | |
| 15.1 At 1 year follow‐up (any surgery) | 1 | 240 | Risk Ratio (M‐H, Fixed, 95% CI) | 0.82 [0.38, 1.80] |
| 15.2 At 1 year follow‐up (hysterectomy only) | 2 | 562 | Risk Ratio (M‐H, Fixed, 95% CI) | 0.77 [0.35, 1.70] |
| 15.3 At 2 years' follow‐up (any surgery) | 1 | 249 | Risk Ratio (M‐H, Fixed, 95% CI) | 0.97 [0.55, 1.72] |
| 15.4 At 2 years' follow‐up (hysterectomy only) | 1 | 249 | Risk Ratio (M‐H, Fixed, 95% CI) | 0.95 [0.50, 1.81] |
| 15.5 At 5 years' follow‐up (ablation or hysterectomy) | 1 | 263 | Risk Ratio (M‐H, Fixed, 95% CI) | 0.85 [0.56, 1.27] |
| 15.6 At 5 years' follow‐up (hysterectomy only) | 1 | 263 | Risk Ratio (M‐H, Fixed, 95% CI) | 0.63 [0.38, 1.04] |
| 15.7 At 10 years' follow‐up (ablation or hysterectomy) | 1 | 263 | Risk Ratio (M‐H, Fixed, 95% CI) | 0.84 [0.57, 1.23] |
| 15.8 At 10 years' follow‐up (hysterectomy only) | 1 | 263 | Risk Ratio (M‐H, Fixed, 95% CI) | 0.60 [0.38, 0.96] |
| Outcome or subgroup title | No. of studies | No. of participants | Statistical method | Effect size |
| 1 Bleeding Show forest plot | 2 | Risk Ratio (M‐H, Fixed, 95% CI) | Subtotals only | |
| 1.1 Amenorrhoea at 1 year follow‐up | 2 | 259 | Risk Ratio (M‐H, Fixed, 95% CI) | 0.62 [0.39, 1.00] |
| 1.2 Amenorrhoea at 2 years' follow‐up | 1 | 227 | Risk Ratio (M‐H, Fixed, 95% CI) | 0.60 [0.33, 1.07] |
| 1.3 Amenorrhoea at 2 to 5 years' follow‐up | 1 | 122 | Risk Ratio (M‐H, Fixed, 95% CI) | 0.7 [0.39, 1.25] |
| 1.4 Amenorrhoea/eumenorrhoea rate at 1 year follow‐up | 2 | 259 | Risk Ratio (M‐H, Fixed, 95% CI) | 0.95 [0.86, 1.06] |
| 1.5 Amenorrhoea/eumenorrhoea rate at 2 years' follow‐up | 1 | 227 | Risk Ratio (M‐H, Fixed, 95% CI) | 0.99 [0.91, 1.08] |
| 1.6 Amenorrhoea/eumenorrhoea rate at 2 to 5 years' follow‐up | 1 | 122 | Risk Ratio (M‐H, Fixed, 95% CI) | 0.98 [0.91, 1.06] |
| 2 PBAC score after treatment Show forest plot | Other data | No numeric data | ||
| 2.1 At 1 year follow‐up | Other data | No numeric data | ||
| 2.2 At 2 years' follow‐up | Other data | No numeric data | ||
| 3 Success of treatment (lighter periods and no further surgery) Show forest plot | 1 | Risk Ratio (M‐H, Fixed, 95% CI) | Subtotals only | |
| 3.1 At 2 to 5 years' follow‐up | 1 | 170 | Risk Ratio (M‐H, Fixed, 95% CI) | 0.98 [0.80, 1.20] |
| 4 Success of treatment (menstrual score < 185) Show forest plot | 1 | Risk Ratio (M‐H, Fixed, 95% CI) | Subtotals only | |
| 4.1 At 1 year follow‐up | 1 | 129 | Risk Ratio (M‐H, Fixed, 95% CI) | 1.00 [0.83, 1.20] |
| 4.2 At 2 years' follow‐up | 1 | 121 | Risk Ratio (M‐H, Fixed, 95% CI) | 1.01 [0.83, 1.23] |
| 5 Rate of satisfaction Show forest plot | 3 | Risk Ratio (M‐H, Fixed, 95% CI) | Subtotals only | |
| 5.1 At 1 year follow‐up | 2 | 259 | Risk Ratio (M‐H, Fixed, 95% CI) | 0.97 [0.93, 1.01] |
| 5.2 At 2 years' follow‐up | 2 | 348 | Risk Ratio (M‐H, Fixed, 95% CI) | 1.02 [0.93, 1.12] |
| 5.3 At 2 to 5 years' follow‐up | 1 | 122 | Risk Ratio (M‐H, Fixed, 95% CI) | 0.93 [0.87, 1.01] |
| 6 Duration of operation (minutes) Show forest plot | 2 | 378 | Mean Difference (IV, Fixed, 95% CI) | ‐14.58 [‐15.00, ‐12.17] |
| 7 Operative difficulties Show forest plot | 1 | 139 | Risk Ratio (M‐H, Fixed, 95% CI) | 1.05 [0.49, 2.22] |
| 7.1 Technical complication rate | 1 | 139 | Risk Ratio (M‐H, Fixed, 95% CI) | 1.05 [0.49, 2.22] |
| 8 Inability to work (proportion of women) Show forest plot | 1 | Risk Ratio (M‐H, Fixed, 95% CI) | Subtotals only | |
| 8.1 At 1 year follow‐up | 1 | 239 | Risk Ratio (M‐H, Fixed, 95% CI) | 1.52 [0.37, 6.22] |
| 8.2 At 2 years' follow‐up | 1 | 227 | Risk Ratio (M‐H, Fixed, 95% CI) | 0.29 [0.03, 2.72] |
| 8.3 At 2 to 5 years' follow‐up | 1 | 210 | Risk Ratio (M‐H, Fixed, 95% CI) | 0.87 [0.26, 2.93] |
| 9 Improvement in other menstrual symptoms Show forest plot | 1 | Risk Ratio (M‐H, Fixed, 95% CI) | Subtotals only | |
| 9.1 Improvement in dysmenorrhoea at 12 months | 1 | 239 | Risk Ratio (M‐H, Fixed, 95% CI) | 0.93 [0.80, 1.09] |
| 9.2 Improvement in premenstrual symptoms (from moderate/severe) at 1 year follow‐up | 1 | 185 | Risk Ratio (M‐H, Fixed, 95% CI) | 0.94 [0.74, 1.19] |
| 9.3 Improvement in premenstrual symptoms (from moderate/severe) at 2 years follow up | 1 | 177 | Risk Ratio (M‐H, Fixed, 95% CI) | 1.03 [0.82, 1.29] |
| 9.4 Improvement in premenstrual symptoms (from moderate/severe) at 2 to 5 years' follow‐up | 1 | 166 | Risk Ratio (M‐H, Fixed, 95% CI) | 0.99 [0.75, 1.30] |
| 10 Complication rate: major complications Show forest plot | 2 | Risk Ratio (M‐H, Fixed, 95% CI) | Subtotals only | |
| 10.1 Fluid overload | 1 | 239 | Risk Ratio (M‐H, Fixed, 95% CI) | 0.18 [0.01, 3.76] |
| 10.2 Perforation | 2 | 378 | Risk Ratio (M‐H, Fixed, 95% CI) | 0.17 [0.02, 1.42] |
| 10.3 Cervical lacerations | 2 | 378 | Risk Ratio (M‐H, Fixed, 95% CI) | 0.17 [0.02, 1.42] |
| 10.4 Endometritis | 1 | 239 | Risk Ratio (M‐H, Fixed, 95% CI) | 2.74 [0.29, 25.93] |
| 10.5 Haematometra | 1 | 239 | Risk Ratio (M‐H, Fixed, 95% CI) | 0.30 [0.01, 7.39] |
| 11 Complication rate: minor complications Show forest plot | 2 | 895 | Odds Ratio (M‐H, Fixed, 95% CI) | 0.99 [0.32, 3.12] |
| 11.1 UTI | 1 | 239 | Odds Ratio (M‐H, Fixed, 95% CI) | 2.76 [0.11, 68.41] |
| 11.2 Hydrosalpinx | 1 | 239 | Odds Ratio (M‐H, Fixed, 95% CI) | 0.30 [0.01, 7.47] |
| 11.3 Pain | 1 | 139 | Odds Ratio (M‐H, Fixed, 95% CI) | 5.87 [0.30, 115.87] |
| 11.4 Nausea | 1 | 139 | Odds Ratio (M‐H, Fixed, 95% CI) | 0.26 [0.01, 6.61] |
| 11.5 Infection | 1 | 139 | Odds Ratio (M‐H, Fixed, 95% CI) | 0.26 [0.01, 6.61] |
| 12 Requirement for further surgery Show forest plot | 2 | Risk Ratio (M‐H, Fixed, 95% CI) | Subtotals only | |
| 12.1 At 1 year follow‐up (any surgery) | 1 | 239 | Risk Ratio (M‐H, Fixed, 95% CI) | 0.61 [0.10, 3.57] |
| 12.2 At 2 years' follow‐up (any surgery) | 2 | 392 | Risk Ratio (M‐H, Fixed, 95% CI) | 0.67 [0.35, 1.28] |
| 12.3 At 2 to 5 years' follow‐up (any surgery) | 1 | 122 | Risk Ratio (M‐H, Fixed, 95% CI) | 1.0 [0.64, 1.55] |
| 12.4 At 2 years' follow‐up (hysterectomy) | 1 | 137 | Risk Ratio (M‐H, Fixed, 95% CI) | 1.04 [0.38, 2.83] |
| 12.5 At 2 to 5 years' follow‐up (hysterectomy) | 1 | 122 | Risk Ratio (M‐H, Fixed, 95% CI) | 1.0 [0.61, 1.63] |
| Outcome or subgroup title | No. of studies | No. of participants | Statistical method | Effect size |
| 1 Bleeding Show forest plot | 1 | Risk Ratio (M‐H, Fixed, 95% CI) | Subtotals only | |
| 1.1 Amenorrhoea at 6 months' follow‐up | 1 | 70 | Risk Ratio (M‐H, Fixed, 95% CI) | 1.11 [0.61, 2.02] |
| 1.2 Amenorrhoea at 12 months' follow‐up | 1 | 67 | Risk Ratio (M‐H, Fixed, 95% CI) | 0.75 [0.38, 1.46] |
| 2 PBAC score after treatment Show forest plot | Other data | No numeric data | ||
| 2.1 At 6 months' follow‐up | Other data | No numeric data | ||
| 3 Rate of satisfaction Show forest plot | 1 | Risk Ratio (M‐H, Fixed, 95% CI) | Subtotals only | |
| 3.1 At 6 months' follow‐up | 1 | 69 | Risk Ratio (M‐H, Fixed, 95% CI) | 1.04 [0.91, 1.20] |
| 3.2 At 12 months' follow‐up | 1 | 57 | Risk Ratio (M‐H, Fixed, 95% CI) | 0.97 [0.86, 1.09] |
| 4 Operative difficulties Show forest plot | 1 | 70 | Risk Ratio (M‐H, Fixed, 95% CI) | 4.47 [0.22, 89.94] |
| 4.1 Failure of equipment | 1 | 70 | Risk Ratio (M‐H, Fixed, 95% CI) | 4.47 [0.22, 89.94] |
| 5 Pain score 4 hours post procedure Show forest plot | 1 | 70 | Mean Difference (IV, Fixed, 95% CI) | 32.7 [23.72, 41.68] |
| 6 Quality of life Show forest plot | 1 | Mean Difference (IV, Fixed, 95% CI) | Subtotals only | |
| 6.1 EQ‐5D at 6 months' follow‐up | 1 | 70 | Mean Difference (IV, Fixed, 95% CI) | 0.01 [‐0.11, 0.13] |
| 6.2 EQ‐5D VAS at 6 months' follow‐up | 1 | 70 | Mean Difference (IV, Fixed, 95% CI) | 1.20 [‐5.95, 8.35] |
| 6.3 SF‐12 physical scale at 6 months' follow‐up | 1 | 70 | Mean Difference (IV, Fixed, 95% CI) | 1.70 [‐2.18, 5.58] |
| 6.4 SF‐12 mental scale at 6 months' follow‐up | 1 | 70 | Mean Difference (IV, Fixed, 95% CI) | 3.40 [‐0.42, 7.22] |
| 6.5 SAQ pleasure scale at 6 months' follow‐up | 1 | 70 | Mean Difference (IV, Fixed, 95% CI) | 0.5 [‐1.30, 2.30] |
| 6.6 SAQ habit scale at 6 months' follow‐up | 1 | 70 | Mean Difference (IV, Fixed, 95% CI) | ‐0.16 [‐0.42, 0.10] |
| 6.7 SAQ discomfort scale at 6 months' follow‐up | 1 | 70 | Mean Difference (IV, Fixed, 95% CI) | ‐0.14 [‐0.98, 0.70] |
| 6.8 EQ‐5D at 12 months' follow‐up | 1 | 67 | Mean Difference (IV, Fixed, 95% CI) | ‐0.01 [‐0.13, 0.11] |
| 6.9 EQ‐5D VAS at 12 months' follow‐up | 1 | 67 | Mean Difference (IV, Fixed, 95% CI) | 10.10 [2.43, 17.77] |
| 6.10 SF‐12 physical scale at 12 months' follow‐up | 1 | 67 | Mean Difference (IV, Fixed, 95% CI) | ‐0.20 [‐3.89, 3.49] |
| 6.11 SF‐12 mental scale at 12 months' follow‐up | 1 | 67 | Mean Difference (IV, Fixed, 95% CI) | 2.10 [‐2.04, 6.24] |
| 6.12 SAQ pleasure scale at 12 months' follow‐up | 1 | 67 | Mean Difference (IV, Fixed, 95% CI) | ‐0.60 [‐2.68, 1.48] |
| 6.13 SAQ habit scale at 12 months' follow‐up | 1 | 67 | Mean Difference (IV, Fixed, 95% CI) | ‐0.09 [‐0.27, 0.09] |
| 6.14 SAQ discomfort scale at 12 months' follow‐up | 1 | 67 | Mean Difference (IV, Fixed, 95% CI) | 0.10 [‐0.67, 0.87] |
| 7 Improvement in other menstrual symptoms Show forest plot | Other data | No numeric data | ||
| 7.1 PMS at 6 months' follow‐up | Other data | No numeric data | ||
| 7.2 PMS at 12 months' follow‐up | Other data | No numeric data | ||
| 8 Improvement in other menstrual symptoms: dysmenorrhoea (visual analogue) Show forest plot | Other data | No numeric data | ||
| 8.1 Dysmenorrhoea at 6 months' follow‐up | Other data | No numeric data | ||
| 8.2 Dysmenorrhoea at 12 months' follow‐up | Other data | No numeric data | ||
| 9 Requirement for further surgery Show forest plot | 1 | Risk Ratio (M‐H, Fixed, 95% CI) | Subtotals only | |
| 9.1 At 12 months' follow‐up | 1 | 67 | Risk Ratio (M‐H, Fixed, 95% CI) | 0.78 [0.23, 2.64] |
| Outcome or subgroup title | No. of studies | No. of participants | Statistical method | Effect size |
| 1 Bleeding Show forest plot | 1 | Risk Ratio (M‐H, Fixed, 95% CI) | Subtotals only | |
| 1.1 Amenorrhoea at 6 months' follow‐up | 1 | 49 | Risk Ratio (M‐H, Fixed, 95% CI) | 0.95 [0.31, 2.93] |
| 1.2 Amenorrhoea at 12 months' follow‐up | 1 | 45 | Risk Ratio (M‐H, Fixed, 95% CI) | 1.21 [0.50, 2.95] |
| 2 Rate of satisfaction Show forest plot | 2 | Risk Ratio (M‐H, Fixed, 95% CI) | Subtotals only | |
| 2.1 At 6 months' follow‐up | 1 | 50 | Risk Ratio (M‐H, Fixed, 95% CI) | 1.06 [0.93, 1.20] |
| 2.2 At 12 months' follow‐up | 2 | 122 | Risk Ratio (M‐H, Fixed, 95% CI) | 1.06 [0.96, 1.18] |
| 2.3 At 2 years' follow‐up | 1 | 68 | Risk Ratio (M‐H, Fixed, 95% CI) | 1.35 [1.06, 1.72] |
| 3 Duration of operation (minutes) Show forest plot | 1 | 82 | Mean Difference (IV, Fixed, 95% CI) | ‐13.0 [‐15.20, ‐10.80] |
| 4 Duration of operation (minutes) Show forest plot | Other data | No numeric data | ||
| 5 Operative difficulties Show forest plot | 1 | 51 | Risk Ratio (M‐H, Fixed, 95% CI) | 7.22 [0.42, 123.83] |
| 5.1 Equipment failure | 1 | 51 | Risk Ratio (M‐H, Fixed, 95% CI) | 7.22 [0.42, 123.83] |
| 6 Postoperative pain (continuous data) Show forest plot | 1 | 82 | Mean Difference (IV, Fixed, 95% CI) | ‐0.60 [‐0.88, ‐0.32] |
| 7 Postoperative pain (descriptive data) Show forest plot | Other data | No numeric data | ||
| 8 Hospital stay (days) Show forest plot | 1 | 82 | Mean Difference (IV, Fixed, 95% CI) | ‐0.30 [‐0.52, ‐0.08] |
| 9 Duration of hospital stay (hours) Show forest plot | Other data | No numeric data | ||
| 10 Return to normal activities (days) Show forest plot | 1 | 82 | Mean Difference (IV, Fixed, 95% CI) | ‐2.10 [‐3.38, ‐0.82] |
| 11 Return to normal activities (days) Show forest plot | Other data | No numeric data | ||
| 12 Complication rate: major complications Show forest plot | 1 | Risk Ratio (M‐H, Fixed, 95% CI) | Subtotals only | |
| 12.1 Fluid overload | 1 | 82 | Risk Ratio (M‐H, Fixed, 95% CI) | 0.10 [0.01, 1.67] |
| 12.2 Cervical tear | 1 | 82 | Risk Ratio (M‐H, Fixed, 95% CI) | 0.35 [0.01, 8.34] |
| 12.3 Conversion to hysterectomy | 1 | 88 | Risk Ratio (M‐H, Fixed, 95% CI) | 0.24 [0.01, 4.84] |
| 12.4 Blood transfusion | 1 | 82 | Risk Ratio (M‐H, Fixed, 95% CI) | 5.24 [0.26, 105.97] |
| 13 Complication rate: minor complications Show forest plot | 1 | 82 | Mean Difference (IV, Fixed, 95% CI) | ‐81.8 [‐93.33, ‐70.27] |
| 13.1 Blood loss | 1 | 82 | Mean Difference (IV, Fixed, 95% CI) | ‐81.8 [‐93.33, ‐70.27] |
| 14 Complication rate: minor complications (dichotomous) Show forest plot | 1 | Risk Ratio (M‐H, Fixed, 95% CI) | Subtotals only | |
| 14.1 Fever | 1 | 82 | Risk Ratio (M‐H, Fixed, 95% CI) | 0.53 [0.05, 5.57] |
| 14.2 Urinary infection or retention | 1 | 82 | Risk Ratio (M‐H, Fixed, 95% CI) | 0.35 [0.01, 8.34] |
| 14.3 Haemorrhage | 1 | 82 | Risk Ratio (M‐H, Fixed, 95% CI) | 1.31 [0.38, 4.54] |
| 15 Requirement for further surgery Show forest plot | 2 | Risk Ratio (M‐H, Fixed, 95% CI) | Subtotals only | |
| 15.1 At 12 months' follow‐up (ablation and hysterectomy) | 1 | 75 | Risk Ratio (M‐H, Fixed, 95% CI) | 0.51 [0.10, 2.64] |
| 15.2 At 2 years' follow‐up (ablation and hysterectomy) | 1 | 68 | Risk Ratio (M‐H, Fixed, 95% CI) | 0.38 [0.08, 1.81] |
| 15.3 At 12 months' follow‐up (hysterectomy only) | 1 | 45 | Risk Ratio (M‐H, Fixed, 95% CI) | 0.12 [0.01, 2.44] |
| Outcome or subgroup title | No. of studies | No. of participants | Statistical method | Effect size |
| 1 Bleeding Show forest plot | 4 | Risk Ratio (M‐H, Fixed, 95% CI) | Subtotals only | |
| 1.1 Amenorrhoea at 6 months' follow‐up | 3 | 283 | Risk Ratio (M‐H, Fixed, 95% CI) | 3.37 [2.09, 5.44] |
| 1.2 Amenorrhoea at 12 months' follow‐up | 4 | 335 | Risk Ratio (M‐H, Fixed, 95% CI) | 3.12 [2.06, 4.72] |
| 1.3 Amenorrhoea at 2 to 5 years' follow‐up | 1 | 120 | Risk Ratio (M‐H, Fixed, 95% CI) | 1.56 [0.93, 2.64] |
| 1.4 Amenorrhoea at 10 years' follow‐up | 1 | 104 | Risk Ratio (M‐H, Fixed, 95% CI) | 1.10 [0.83, 1.46] |
| 2 PBAC score after treatment Show forest plot | Other data | No numeric data | ||
| 2.1 At 6 months' follow‐up | Other data | No numeric data | ||
| 2.2 At 12 months' follow‐up | Other data | No numeric data | ||
| 3 Rate of satisfaction Show forest plot | 4 | Risk Ratio (M‐H, Fixed, 95% CI) | Subtotals only | |
| 3.1 At 6 months' follow‐up | 2 | 181 | Risk Ratio (M‐H, Fixed, 95% CI) | 1.08 [0.94, 1.24] |
| 3.2 At 12 months' follow‐up | 4 | 334 | Risk Ratio (M‐H, Fixed, 95% CI) | 1.14 [1.04, 1.26] |
| 3.3 At 10 years' follow‐up | 1 | 104 | Risk Ratio (M‐H, Fixed, 95% CI) | 1.05 [0.85, 1.30] |
| 4 Duration of operation Show forest plot | Other data | No numeric data | ||
| 5 Operative difficulties Show forest plot | 1 | Risk Ratio (M‐H, Fixed, 95% CI) | Subtotals only | |
| 5.1 Technical complication rate | 1 | 55 | Risk Ratio (M‐H, Fixed, 95% CI) | 0.73 [0.13, 3.99] |
| 6 Completion of procedure Show forest plot | 1 | 81 | Risk Ratio (M‐H, Fixed, 95% CI) | 1.05 [0.97, 1.15] |
| 7 Time taken off work (days) Show forest plot | Other data | No numeric data | ||
| 8 Time to resume normal activities (days) Show forest plot | Other data | No numeric data | ||
| 9 Quality of life Show forest plot | 3 | 3221 | Mean Difference (IV, Fixed, 95% CI) | 0.00 [‐0.18, 0.19] |
| 9.1 SF‐12 physical scale score at 12 months' follow‐up | 1 | 55 | Mean Difference (IV, Fixed, 95% CI) | 1.60 [‐4.27, 7.47] |
| 9.2 SF‐12 mental scale score at 12 months' follow‐up | 1 | 55 | Mean Difference (IV, Fixed, 95% CI) | 7.5 [‐0.52, 15.52] |
| 9.3 SF‐36 physical function scale score at 6 months' follow‐up | 1 | 90 | Mean Difference (IV, Fixed, 95% CI) | 2.0 [‐6.55, 10.55] |
| 9.4 SF‐36 physical function scale score at 12 months' follow‐up | 1 | 78 | Mean Difference (IV, Fixed, 95% CI) | 3.0 [‐6.44, 12.44] |
| 9.5 SF‐36 physical function scale score at 2 to 5 years' follow‐up | 1 | 98 | Mean Difference (IV, Fixed, 95% CI) | 2.0 [‐8.26, 12.26] |
| 9.6 SF‐36 role physical at 6 months' follow‐up | 1 | 90 | Mean Difference (IV, Fixed, 95% CI) | 5.0 [‐7.67, 17.67] |
| 9.7 SF‐36 role physical at 12 months' follow‐up | 1 | 78 | Mean Difference (IV, Fixed, 95% CI) | 5.0 [‐6.96, 16.96] |
| 9.8 SF‐36 role physical at 2 to 5 years' follow‐up | 1 | 98 | Mean Difference (IV, Fixed, 95% CI) | 8.0 [‐2.66, 18.66] |
| 9.9 SF‐36 role emotional at 6 months' follow‐up | 1 | 90 | Mean Difference (IV, Fixed, 95% CI) | ‐6.0 [‐18.64, 6.64] |
| 9.10 SF‐36 role emotional at 12 months' follow‐up | 1 | 78 | Mean Difference (IV, Fixed, 95% CI) | 4.0 [‐1.92, 9.92] |
| 9.11 SF‐36 role emotional at 2 to 5 years' follow‐up | 1 | 98 | Mean Difference (IV, Fixed, 95% CI) | ‐9.0 [‐14.45, ‐3.55] |
| 9.12 SF‐36 social functioning at 6 months' follow‐up | 1 | 90 | Mean Difference (IV, Fixed, 95% CI) | ‐1.0 [‐9.98, 7.98] |
| 9.13 SF‐36 social functioning at 12 months' follow‐up | 1 | 78 | Mean Difference (IV, Fixed, 95% CI) | 3.0 [‐6.17, 12.17] |
| 9.14 SF‐36 social functioning at 2 to 5 years' follow‐up | 1 | 98 | Mean Difference (IV, Fixed, 95% CI) | 4.0 [‐5.60, 13.60] |
| 9.15 SF‐36 mental health at 6 months' follow‐up | 1 | 90 | Mean Difference (IV, Fixed, 95% CI) | ‐3.0 [‐10.84, 4.84] |
| 9.16 SF‐36 mental health at 12 months' follow‐up | 1 | 78 | Mean Difference (IV, Fixed, 95% CI) | 0.0 [‐8.03, 8.03] |
| 9.17 SF‐36 mental health at 2 to 5 years' follow‐up | 1 | 98 | Mean Difference (IV, Fixed, 95% CI) | ‐5.0 [‐11.39, 1.39] |
| 9.18 SF‐36 energy/vitality at 6 months' follow‐up | 1 | 90 | Mean Difference (IV, Fixed, 95% CI) | ‐6.0 [‐13.54, 1.54] |
| 9.19 SF‐36 energy/vitality at 12 months' follow‐up | 1 | 78 | Mean Difference (IV, Fixed, 95% CI) | 9.0 [‐0.44, 18.44] |
| 9.20 SF‐36 energy/vitality at 2 to 5 years' follow‐up | 1 | 98 | Mean Difference (IV, Fixed, 95% CI) | ‐3.0 [‐10.39, 4.39] |
| 9.21 SF‐36 pain at 6 months' follow‐up | 1 | 90 | Mean Difference (IV, Fixed, 95% CI) | 2.0 [‐6.00, 12.00] |
| 9.22 SF‐36 pain at 12 months' follow‐up | 1 | 78 | Mean Difference (IV, Fixed, 95% CI) | ‐1.0 [‐12.61, 10.61] |
| 9.23 SF‐36 pain at 2 to 5 years' follow‐up | 1 | 98 | Mean Difference (IV, Fixed, 95% CI) | ‐5.0 [‐14.79, 4.79] |
| 9.24 SF‐36 general health at 6 months' follow‐up | 1 | 90 | Mean Difference (IV, Fixed, 95% CI) | ‐5.0 [‐13.30, 3.30] |
| 9.25 SF‐36 general health at 12 months' follow‐up | 1 | 78 | Mean Difference (IV, Fixed, 95% CI) | 6.0 [‐4.10, 16.10] |
| 9.26 SF‐36 general health at 2 to 5 years' follow‐up | 1 | 98 | Mean Difference (IV, Fixed, 95% CI) | 6.0 [‐5.72, 17.72] |
| 9.27 RSCL physical symptoms at 6 months' follow‐up | 1 | 90 | Mean Difference (IV, Fixed, 95% CI) | 1.0 [‐3.94, 5.94] |
| 9.28 RSCL physical symptoms at 12 months' follow‐up | 1 | 78 | Mean Difference (IV, Fixed, 95% CI) | ‐4.0 [‐8.56, 0.56] |
| 9.29 RSCL psychological distress at 6 months' follow‐up | 1 | 90 | Mean Difference (IV, Fixed, 95% CI) | ‐1.0 [‐10.14, 8.14] |
| 9.30 RSCL psychological distress at 12 months' follow‐up | 1 | 78 | Mean Difference (IV, Fixed, 95% CI) | ‐1.0 [‐7.92, 5.92] |
| 9.31 RSCL activity level at 6 months' follow‐up | 1 | 90 | Mean Difference (IV, Fixed, 95% CI) | ‐1.0 [‐3.35, 1.35] |
| 9.32 RSCL activity level at 12 months' follow‐up | 1 | 78 | Mean Difference (IV, Fixed, 95% CI) | ‐2.0 [‐4.32, 0.32] |
| 9.33 RSCL overall quality of life at 6 months' follow‐up | 1 | 90 | Mean Difference (IV, Fixed, 95% CI) | ‐2.0 [‐12.29, 8.29] |
| 9.34 RSCL overall quality of life at 12 months' follow‐up | 1 | 78 | Mean Difference (IV, Fixed, 95% CI) | ‐9.0 [‐18.77, 0.77] |
| 9.35 SDS depression at 6 months' follow‐up | 1 | 90 | Mean Difference (IV, Fixed, 95% CI) | 2.0 [‐1.55, 5.55] |
| 9.36 SDS depression at 12 months' follow‐up | 1 | 78 | Mean Difference (IV, Fixed, 95% CI) | ‐1.0 [‐5.24, 3.24] |
| 9.37 Multi‐attribute utility tool at 12 months' follow‐up | 1 | 51 | Mean Difference (IV, Fixed, 95% CI) | 8.80 [‐6.08, 23.68] |
| 9.38 EQ‐5D utility at 12 months' follow‐up | 1 | 49 | Mean Difference (IV, Fixed, 95% CI) | 0.03 [‐0.16, 0.22] |
| 9.39 EQ‐5D health thermometer at 12 months' follow‐up | 1 | 43 | Mean Difference (IV, Fixed, 95% CI) | 4.8 [‐10.07, 19.67] |
| 10 Menorrhagia Outcome Questionnaire Show forest plot | 1 | 51 | Mean Difference (IV, Fixed, 95% CI) | ‐0.60 [‐3.87, 2.67] |
| 10.1 At 12 months' follow‐up | 1 | 51 | Mean Difference (IV, Fixed, 95% CI) | ‐0.60 [‐3.87, 2.67] |
| 11 Dysmenorrhoea rate (VAS score) Show forest plot | Other data | No numeric data | ||
| 11.1 At 12 months' follow‐up | Other data | No numeric data | ||
| 12 Improvement in other menstrual symptoms Show forest plot | 2 | 465 | Risk Ratio (M‐H, Fixed, 95% CI) | 0.91 [0.70, 1.20] |
| 12.1 Improvement in dysmenorrhoea at 12 months' follow‐up | 1 | 44 | Risk Ratio (M‐H, Fixed, 95% CI) | 1.37 [0.89, 2.10] |
| 12.2 Improvement in PMS (emotional) at 12 months' follow‐up | 1 | 36 | Risk Ratio (M‐H, Fixed, 95% CI) | 0.8 [0.45, 1.43] |
| 12.3 Improvement in PMS (physical) at 12 months' follow‐up | 1 | 36 | Risk Ratio (M‐H, Fixed, 95% CI) | 1.3 [0.72, 2.34] |
| 12.4 Dysmenorrhoea rate at 6 months' follow‐up | 1 | 126 | Risk Ratio (M‐H, Fixed, 95% CI) | 0.69 [0.26, 1.86] |
| 12.5 Dysmenorrhoea rate at 12 months' follow‐up | 1 | 126 | Risk Ratio (M‐H, Fixed, 95% CI) | 0.52 [0.18, 1.51] |
| 12.6 Dysmenorrhoea rate at 2 to 5 years' follow‐up | 1 | 97 | Risk Ratio (M‐H, Fixed, 95% CI) | 0.61 [0.26, 1.44] |
| 13 PMS rate (VAS score) Show forest plot | Other data | No numeric data | ||
| 13.1 At 12 months' follow‐up | Other data | No numeric data | ||
| 14 Complication rate: major complications Show forest plot | 1 | Risk Ratio (M‐H, Fixed, 95% CI) | Subtotals only | |
| 14.1 Infection (endometritis) | 1 | 73 | Risk Ratio (M‐H, Fixed, 95% CI) | 0.30 [0.06, 1.42] |
| 15 Requirement for further surgery Show forest plot | 4 | Risk Ratio (M‐H, Fixed, 95% CI) | Subtotals only | |
| 15.1 At 6 months' follow‐up (ablation or hysterectomy) | 1 | 53 | Risk Ratio (M‐H, Fixed, 95% CI) | 0.0 [0.0, 0.0] |
| 15.2 At 12 months' follow‐up (ablation or hysterectomy) | 3 | 239 | Risk Ratio (M‐H, Fixed, 95% CI) | 1.35 [0.49, 3.67] |
| 15.3 At 12 months' follow‐up (hysterectomy only) | 3 | 311 | Risk Ratio (M‐H, Fixed, 95% CI) | 0.72 [0.28, 1.84] |
| 15.4 At 2 to 5 years' follow‐up (ablation or hysterectomy) | 1 | 120 | Risk Ratio (M‐H, Fixed, 95% CI) | 0.72 [0.28, 1.89] |
| 15.5 At 2 to 5 years' follow‐up (hysterectomy only) | 1 | 120 | Risk Ratio (M‐H, Fixed, 95% CI) | 0.77 [0.27, 2.20] |
| 15.6 At 10 years' follow‐up (hysterectomy only) | 1 | 104 | Risk Ratio (M‐H, Fixed, 95% CI) | 1.01 [0.38, 2.74] |
| Outcome or subgroup title | No. of studies | No. of participants | Statistical method | Effect size |
| 1 Bleeding Show forest plot | 1 | Risk Ratio (M‐H, Fixed, 95% CI) | Subtotals only | |
| 1.1 Amenorrhoea at 6 months' follow‐up | 1 | 277 | Risk Ratio (M‐H, Fixed, 95% CI) | 1.50 [1.07, 2.12] |
| 1.2 Amenorrhoea at 12 months' follow‐up | 1 | 282 | Risk Ratio (M‐H, Fixed, 95% CI) | 1.10 [0.82, 1.47] |
| 1.3 Amenorrhoea at 5 years' follow‐up | 1 | 217 | Risk Ratio (M‐H, Fixed, 95% CI) | 1.03 [0.86, 1.23] |
| 2 PBAC score at 12 months' follow‐up Show forest plot | Other data | No numeric data | ||
| 3 Rate of satisfaction Show forest plot | 1 | Risk Ratio (M‐H, Fixed, 95% CI) | Subtotals only | |
| 3.1 At 12 months' follow‐up | 1 | 278 | Risk Ratio (M‐H, Fixed, 95% CI) | 1.00 [0.88, 1.14] |
| 3.2 At 5 years' follow‐up | 1 | 217 | Risk Ratio (M‐H, Fixed, 95% CI) | 0.99 [0.87, 1.13] |
| 4 Operation time (minutes) Show forest plot | 1 | 314 | Mean Difference (IV, Fixed, 95% CI) | ‐6.60 [‐7.36, ‐5.84] |
| 5 Operative difficulties causing failure Show forest plot | 1 | Risk Ratio (M‐H, Fixed, 95% CI) | Subtotals only | |
| 5.1 Failure of device | 1 | 314 | Risk Ratio (M‐H, Fixed, 95% CI) | 0.09 [0.01, 0.70] |
| 5.2 Unsuitable cavity | 1 | 314 | Risk Ratio (M‐H, Fixed, 95% CI) | 0.75 [0.17, 3.30] |
| 5.3 Device not sterile | 1 | 314 | Risk Ratio (M‐H, Fixed, 95% CI) | 5.0 [0.24, 103.32] |
| 6 Proportion choosing local anaesthesia Show forest plot | 1 | 314 | Risk Ratio (M‐H, Fixed, 95% CI) | 1.01 [0.79, 1.31] |
| 7 Proportion requiring opiate analgesia Show forest plot | 1 | 314 | Risk Ratio (M‐H, Fixed, 95% CI) | 0.92 [0.83, 1.01] |
| 8 Recovery: proportion requiring overnight stay Show forest plot | 1 | 314 | Risk Ratio (M‐H, Fixed, 95% CI) | 0.66 [0.42, 1.04] |
| 9 Quality of life scores Show forest plot | 1 | Mean Difference (IV, Fixed, 95% CI) | Subtotals only | |
| 9.1 EQ‐5D at 12 months' follow‐up | 1 | 285 | Mean Difference (IV, Fixed, 95% CI) | 0.02 [‐0.04, 0.08] |
| 9.2 EQ‐5D at 5 years' follow‐up | 1 | 217 | Mean Difference (IV, Fixed, 95% CI) | 0.0 [‐0.07, 0.07] |
| 9.3 SF‐12 physical scores at 12 months' follow‐up | 1 | 285 | Mean Difference (IV, Fixed, 95% CI) | ‐0.70 [‐2.64, 1.24] |
| 9.4 SF‐12 physical scores at 5 years' follow‐up | 1 | 217 | Mean Difference (IV, Fixed, 95% CI) | ‐1.5 [‐3.99, 0.99] |
| 9.5 SF‐12 mental scores at 12 months' follow‐up | 1 | 285 | Mean Difference (IV, Fixed, 95% CI) | ‐1.20 [‐3.67, 1.27] |
| 9.6 SF‐12 mental scores at 5 years' follow‐up | 1 | 217 | Mean Difference (IV, Fixed, 95% CI) | ‐0.30 [‐2.90, 2.30] |
| 10 Requirement for further surgery (hysterectomy) Show forest plot | 1 | Risk Ratio (M‐H, Fixed, 95% CI) | Subtotals only | |
| 10.1 At 12 months' follow‐up | 1 | 285 | Risk Ratio (M‐H, Fixed, 95% CI) | 0.94 [0.31, 2.84] |
| 10.2 At 5 years' follow‐up | 1 | 217 | Risk Ratio (M‐H, Fixed, 95% CI) | 1.29 [0.51, 3.27] |
| Outcome or subgroup title | No. of studies | No. of participants | Statistical method | Effect size |
| 1 Bleeding Show forest plot | 1 | Risk Ratio (M‐H, Fixed, 95% CI) | Subtotals only | |
| 1.1 Amenorrhoea at 6 months' follow‐up | 1 | 150 | Risk Ratio (M‐H, Fixed, 95% CI) | 2.27 [1.25, 4.12] |
| 1.2 Amenorrhoea at 12 months' follow‐up | 1 | 146 | Risk Ratio (M‐H, Fixed, 95% CI) | 1.95 [1.21, 3.15] |
| 1.3 Amenorrhoea at 2 to 5 years' follow‐up | 1 | 139 | Risk Ratio (M‐H, Fixed, 95% CI) | 1.57 [1.06, 2.31] |
| 2 Rate of satisfaction Show forest plot | 1 | Risk Ratio (M‐H, Fixed, 95% CI) | Subtotals only | |
| 2.1 At 6 months' follow‐up | 1 | 150 | Risk Ratio (M‐H, Fixed, 95% CI) | 1.44 [1.17, 1.77] |
| 2.2 At 12 months' follow‐up | 1 | 146 | Risk Ratio (M‐H, Fixed, 95% CI) | 1.11 [1.02, 1.21] |
| 2.3 At 2 to 5 years' follow‐up | 1 | 139 | Risk Ratio (M‐H, Fixed, 95% CI) | 1.62 [1.23, 2.13] |
| 3 Duration of procedure (minutes) Show forest plot | Other data | No numeric data | ||
| 4 Improvement in other menstrual symptoms Show forest plot | 1 | Risk Ratio (M‐H, Fixed, 95% CI) | Subtotals only | |
| 4.1 Absence of dysmenorrhoea at 12 months' follow‐up | 1 | 146 | Risk Ratio (M‐H, Fixed, 95% CI) | 0.92 [0.79, 1.06] |
| 4.2 Absence of dysmenorrhoea at 2 to 5 years' follow‐up | 1 | 139 | Risk Ratio (M‐H, Fixed, 95% CI) | 1.32 [1.00, 1.74] |
| 5 Complication rate: major complications Show forest plot | 1 | Risk Ratio (M‐H, Fixed, 95% CI) | Subtotals only | |
| 5.1 Uterine perforation | 1 | 156 | Risk Ratio (M‐H, Fixed, 95% CI) | 2.71 [0.11, 65.54] |
| 5.2 Saline leakage | 1 | 156 | Risk Ratio (M‐H, Fixed, 95% CI) | 0.13 [0.01, 2.46] |
| 6 Requirement for further surgery Show forest plot | 1 | Risk Ratio (M‐H, Fixed, 95% CI) | Subtotals only | |
| 6.1 At 12 months' follow‐up (ablation or hysterectomy) | 1 | 160 | Risk Ratio (M‐H, Fixed, 95% CI) | 0.28 [0.11, 0.72] |
| 6.2 At 12 months' follow‐up (hysterectomy) | 1 | 160 | Risk Ratio (M‐H, Fixed, 95% CI) | 0.42 [0.14, 1.32] |
| 6.3 At 2 to 5 years' follow‐up (ablation or hysterectomy) | 1 | 136 | Risk Ratio (M‐H, Fixed, 95% CI) | 0.44 [0.23, 0.83] |
| 6.4 At 2 to 5 years' follow‐up (hysterectomy) | 1 | 136 | Risk Ratio (M‐H, Fixed, 95% CI) | 0.63 [0.29, 1.38] |
| Outcome or subgroup title | No. of studies | No. of participants | Statistical method | Effect size |
| 1 Bleeding Show forest plot | 1 | 200 | Risk Ratio (M‐H, Fixed, 95% CI) | 2.59 [1.87, 3.58] |
| 1.1 Amenorrhoea at 3 years' follow‐up | 1 | 100 | Risk Ratio (M‐H, Fixed, 95% CI) | 4.5 [2.33, 8.69] |
| 1.2 Amenorrhoea and eumenorrhoea at 3 years' follow‐up | 1 | 100 | Risk Ratio (M‐H, Fixed, 95% CI) | 1.86 [1.30, 2.66] |
| 2 Surgery difficulties: failure rate of procedure Show forest plot | 1 | 100 | Risk Ratio (M‐H, Fixed, 95% CI) | 0.29 [0.12, 0.74] |
| 3 Recovery: hospital stay (days) Show forest plot | 1 | 100 | Mean Difference (IV, Fixed, 95% CI) | 1.6 [1.18, 2.02] |
| 4 Complication rate: major complications Show forest plot | 1 | Risk Ratio (M‐H, Fixed, 95% CI) | Subtotals only | |
| 4.1 Uterine perforation | 1 | 100 | Risk Ratio (M‐H, Fixed, 95% CI) | 0.14 [0.01, 2.70] |
| 5 Complication rate: minor complications Show forest plot | 1 | 200 | Risk Ratio (M‐H, Fixed, 95% CI) | 0.37 [0.16, 0.84] |
| 5.1 Bleeding | 1 | 100 | Risk Ratio (M‐H, Fixed, 95% CI) | 0.21 [0.07, 0.70] |
| 5.2 Infection/leucorrhoea | 1 | 100 | Risk Ratio (M‐H, Fixed, 95% CI) | 0.8 [0.23, 2.81] |
| 6 Requirement for further surgery Show forest plot | 1 | 100 | Risk Ratio (M‐H, Fixed, 95% CI) | 0.42 [0.16, 1.10] |
| 6.1 Within 3 years (hysterectomy) | 1 | 100 | Risk Ratio (M‐H, Fixed, 95% CI) | 0.42 [0.16, 1.10] |
| Outcome or subgroup title | No. of studies | No. of participants | Statistical method | Effect size |
| 1 Bleeding Show forest plot | 1 | 132 | Odds Ratio (M‐H, Fixed, 95% CI) | 7.07 [3.29, 15.22] |
| 1.1 Amenorrhoea at 3 months' follow‐up | 1 | 66 | Odds Ratio (M‐H, Fixed, 95% CI) | 5.33 [1.86, 15.30] |
| 1.2 Amenorrhoea at 12 months' follow‐up | 1 | 66 | Odds Ratio (M‐H, Fixed, 95% CI) | 9.77 [3.17, 30.11] |
| 2 Bleeding PBAC at 12 months' follow‐up Show forest plot | 1 | Mean Difference (IV, Fixed, 95% CI) | Subtotals only | |
| 3 Rate of satisfaction Show forest plot | 1 | Risk Ratio (M‐H, Fixed, 95% CI) | Subtotals only | |
| 3.1 Satisfaction ‐ with treatment at 3 months' follow‐up | 1 | 66 | Risk Ratio (M‐H, Fixed, 95% CI) | 0.97 [0.89, 1.05] |
| 3.2 Satisfaction ‐ with treatment at 12 months' follow‐up | 1 | 66 | Risk Ratio (M‐H, Fixed, 95% CI) | 0.85 [0.73, 0.99] |
| 3.3 Satisfaction ‐ improvement in everyday life at 12 months' follow‐up | 1 | 66 | Risk Ratio (M‐H, Fixed, 95% CI) | 0.91 [0.81, 1.03] |
| 4 Duration of treatment (seconds) Show forest plot | 1 | 66 | Mean Difference (IV, Fixed, 95% CI) | 9.80 [2.63, 16.97] |
| 5 Improvement in other menstrual symptoms: dysmenorrhoea Show forest plot | 1 | Risk Ratio (M‐H, Fixed, 95% CI) | Subtotals only | |
| 5.1 Dysmenorrhoea at 3 months' follow‐up | 1 | 66 | Risk Ratio (M‐H, Fixed, 95% CI) | 2.0 [0.39, 10.18] |
| 5.2 Dysmenorrhoea at 12 months' follow‐up | 1 | 66 | Risk Ratio (M‐H, Fixed, 95% CI) | 4.0 [0.92, 17.44] |
| 6 Complication rate Show forest plot | 1 | 198 | Odds Ratio (M‐H, Fixed, 95% CI) | 25.98 [1.44, 468.00] |
| 6.1 Minor complications | 1 | 66 | Odds Ratio (M‐H, Fixed, 95% CI) | 0.0 [0.0, 0.0] |
| 6.2 Major complications | 1 | 66 | Odds Ratio (M‐H, Fixed, 95% CI) | 0.0 [0.0, 0.0] |
| 6.3 Requirement for post‐procedure analgesia | 1 | 66 | Odds Ratio (M‐H, Fixed, 95% CI) | 25.98 [1.44, 468.00] |
| 7 Requirement for further surgery Show forest plot | 1 | Risk Ratio (M‐H, Fixed, 95% CI) | Subtotals only | |
| 7.1 At 12 months' follow‐up (hysterectomy) | 1 | 66 | Risk Ratio (M‐H, Fixed, 95% CI) | 5.0 [0.25, 100.32] |
| Outcome or subgroup title | No. of studies | No. of participants | Statistical method | Effect size |
| 1 Bleeding Show forest plot | 1 | Risk Ratio (M‐H, Fixed, 95% CI) | Subtotals only | |
| 1.1 Haematin alkaline < 80 mL/cycle at 12 months' follow‐up | 1 | 153 | Risk Ratio (M‐H, Fixed, 95% CI) | 1.16 [1.00, 1.34] |
| 1.2 Amenorrhoea at 12 months' follow‐up | 1 | 153 | Risk Ratio (M‐H, Fixed, 95% CI) | 1.46 [1.08, 1.98] |
| 2 Rate of satisfaction Show forest plot | 1 | Risk Ratio (M‐H, Fixed, 95% CI) | Subtotals only | |
| 2.1 At 12 months' follow‐up | 1 | 153 | Risk Ratio (M‐H, Fixed, 95% CI) | 1.15 [0.99, 1.33] |
| 3 Duration of surgery Show forest plot | 1 | 153 | Mean Difference (IV, Fixed, 95% CI) | ‐14.1 [‐15.94, ‐12.26] |
| 4 Improvement in other menstrual symptoms: dysmenorrhoea Show forest plot | 1 | 153 | Risk Ratio (M‐H, Fixed, 95% CI) | 1.02 [0.71, 1.48] |
| 5 Improvement in other menstrual symptoms: PMS at 12 months' follow‐up Show forest plot | 1 | Risk Ratio (M‐H, Fixed, 95% CI) | Subtotals only | |
| 6 Complication rate: major complications Show forest plot | 1 | Risk Ratio (M‐H, Fixed, 95% CI) | Subtotals only | |
| 6.1 Endometritis or endomyometritis | 1 | 153 | Risk Ratio (M‐H, Fixed, 95% CI) | 0.25 [0.02, 2.69] |
| 6.2 Pelvic inflammatory disease | 1 | 153 | Risk Ratio (M‐H, Fixed, 95% CI) | 1.51 [0.06, 36.54] |
| 6.3 Haematometra | 1 | 153 | Risk Ratio (M‐H, Fixed, 95% CI) | 1.51 [0.06, 36.54] |
| 7 Complication rate: minor complications Show forest plot | 1 | 2142 | Risk Ratio (M‐H, Fixed, 95% CI) | 0.62 [0.30, 1.26] |
| 7.1 Intraoperative skin rash and/or itching or burning sensation | 1 | 153 | Risk Ratio (M‐H, Fixed, 95% CI) | 1.51 [0.06, 36.54] |
| 7.2 Bleeding or spotting first 24 hours | 1 | 153 | Risk Ratio (M‐H, Fixed, 95% CI) | 0.17 [0.01, 4.06] |
| 7.3 Nausea or vomiting first 24 hours | 1 | 153 | Risk Ratio (M‐H, Fixed, 95% CI) | 0.17 [0.01, 4.06] |
| 7.4 Weakness, fatigue, sleepiness, lack of concentration, dizziness first 24 hours | 1 | 153 | Risk Ratio (M‐H, Fixed, 95% CI) | 1.51 [0.06, 36.54] |
| 7.5 Backache first 24 hours | 1 | 153 | Risk Ratio (M‐H, Fixed, 95% CI) | 1.51 [0.06, 36.54] |
| 7.6 Fever first 24 hours | 1 | 153 | Risk Ratio (M‐H, Fixed, 95% CI) | 1.51 [0.06, 36.54] |
| 7.7 Abdominal pain or bloating (> 24 hours to 2 weeks) | 1 | 153 | Risk Ratio (M‐H, Fixed, 95% CI) | 1.5 [0.16, 14.06] |
| 7.8 Abdominal pain and/or bloating > 2 weeks | 1 | 153 | Risk Ratio (M‐H, Fixed, 95% CI) | 0.17 [0.01, 4.06] |
| 7.9 Pelvic pain (> 24 hours to 2 weeks) | 1 | 153 | Risk Ratio (M‐H, Fixed, 95% CI) | 1.51 [0.06, 36.54] |
| 7.10 Vaginal discharge and/or unpleasant vaginal smell or other abnormal sensation (> 24 hours to 2 weeks) | 1 | 153 | Risk Ratio (M‐H, Fixed, 95% CI) | 1.51 [0.06, 36.54] |
| 7.11 Weakness, fatigue, sleepiness, lack of concentration, dizziness (> 24 hours to 2 weeks) | 1 | 153 | Risk Ratio (M‐H, Fixed, 95% CI) | 0.5 [0.03, 7.83] |
| 7.12 Constipation (> 24 hours to 2 weeks) | 1 | 153 | Risk Ratio (M‐H, Fixed, 95% CI) | 0.17 [0.01, 4.06] |
| 7.13 Skin rash and/or itching or burning sensation (> 24 hours to 2 weeks) | 1 | 153 | Risk Ratio (M‐H, Fixed, 95% CI) | 0.5 [0.03, 7.83] |
| 7.14 Dysmenorrhoea (2 weeks to 1 year) | 1 | 153 | Risk Ratio (M‐H, Fixed, 95% CI) | 0.17 [0.01, 4.06] |
| 8 Requirement for further surgery Show forest plot | 1 | 153 | Risk Ratio (M‐H, Fixed, 95% CI) | 0.33 [0.06, 1.93] |
| 8.1 Hysterectomy at 12 months' follow‐up | 1 | 153 | Risk Ratio (M‐H, Fixed, 95% CI) | 0.33 [0.06, 1.93] |
| Outcome or subgroup title | No. of studies | No. of participants | Statistical method | Effect size |
| 1 Bleeding Show forest plot | 12 | Risk Ratio (M‐H, Random, 95% CI) | Subtotals only | |
| 1.1 Amenorrhoea at 6 months' follow‐up | 1 | 49 | Risk Ratio (M‐H, Random, 95% CI) | 1.27 [0.91, 1.77] |
| 1.2 Amenorrhoea at 1 year follow‐up | 12 | 2145 | Risk Ratio (M‐H, Random, 95% CI) | 0.99 [0.78, 1.27] |
| 1.3 Amenorrhoea at 2 years' follow‐up | 3 | 701 | Risk Ratio (M‐H, Random, 95% CI) | 0.97 [0.72, 1.30] |
| 1.4 Amenorrhoea at 2 to 5 years' follow‐up | 4 | 672 | Risk Ratio (M‐H, Random, 95% CI) | 1.16 [0.78, 1.72] |
| 1.5 Amenorrhoea > 5 years' follow‐up | 1 | 189 | Risk Ratio (M‐H, Random, 95% CI) | 0.94 [0.83, 1.05] |
| 1.6 PBAC < 75 or acceptable improvement at 12 months' follow‐up | 5 | 1282 | Risk Ratio (M‐H, Random, 95% CI) | 1.03 [0.98, 1.09] |
| 1.7 PBAC < 75 or acceptable improvement at 2 to 5 years' follow‐up | 1 | 236 | Risk Ratio (M‐H, Random, 95% CI) | 1.12 [0.97, 1.28] |
| 1.8 PBAC < 75 or acceptable improvement at > 5 years' follow‐up | 1 | 263 | Risk Ratio (M‐H, Random, 95% CI) | 1.08 [0.87, 1.34] |
| 2 Bleeding ‐ amenorrhoea at 12 months' follow‐up (final plot) Show forest plot | 12 | 2145 | Risk Ratio (M‐H, Random, 95% CI) | 0.99 [0.78, 1.27] |
| 3 Satisfaction rate Show forest plot | 13 | Risk Ratio (M‐H, Random, 95% CI) | Subtotals only | |
| 3.1 At 6 months' follow‐up | 1 | 50 | Risk Ratio (M‐H, Random, 95% CI) | 1.06 [0.93, 1.20] |
| 3.2 At 1 year follow‐up | 11 | 1750 | Risk Ratio (M‐H, Random, 95% CI) | 1.01 [0.98, 1.04] |
| 3.3 At 2 years' follow‐up | 5 | 802 | Risk Ratio (M‐H, Random, 95% CI) | 1.09 [0.99, 1.21] |
| 3.4 At 2 to 5 years' follow‐up | 4 | 672 | Risk Ratio (M‐H, Random, 95% CI) | 1.02 [0.93, 1.13] |
| 3.5 At 10 years' follow‐up | 1 | 189 | Risk Ratio (M‐H, Random, 95% CI) | 1.11 [0.95, 1.30] |
| 4 Satisfaction rate at 1 year follow‐up (final plot) Show forest plot | 11 | 1750 | Risk Ratio (M‐H, Fixed, 95% CI) | 1.02 [0.99, 1.05] |
| 5 Duration of operation (minutes) Show forest plot | 9 | Mean Difference (IV, Random, 95% CI) | Totals not selected | |
| 6 Operative difficulties Show forest plot | 5 | Risk Ratio (M‐H, Random, 95% CI) | Subtotals only | |
| 6.1 Equipment failure | 3 | 384 | Risk Ratio (M‐H, Random, 95% CI) | 4.26 [1.46, 12.43] |
| 6.2 Procedure abandoned | 3 | 629 | Risk Ratio (M‐H, Random, 95% CI) | 1.18 [0.38, 3.67] |
| 7 Proportion given local anaesthesia (%) Show forest plot | 6 | 1434 | Risk Ratio (M‐H, Random, 95% CI) | 2.78 [1.76, 4.40] |
| 8 Inability to work Show forest plot | 2 | 479 | Risk Ratio (M‐H, Random, 95% CI) | 0.84 [0.30, 2.30] |
| 9 Complication rate: major complications Show forest plot | 11 | Risk Ratio (M‐H, Random, 95% CI) | Subtotals only | |
| 9.1 Perforation | 8 | 1885 | Risk Ratio (M‐H, Random, 95% CI) | 0.32 [0.10, 1.01] |
| 9.2 Endometritis | 4 | 1095 | Risk Ratio (M‐H, Random, 95% CI) | 1.19 [0.33, 4.37] |
| 9.3 Myometritis | 1 | 267 | Risk Ratio (M‐H, Random, 95% CI) | 0.29 [0.01, 6.93] |
| 9.4 Cervical lacerations | 7 | 1583 | Risk Ratio (M‐H, Random, 95% CI) | 0.21 [0.07, 0.61] |
| 9.5 Cervical stenosis | 1 | 322 | Risk Ratio (M‐H, Random, 95% CI) | 1.5 [0.06, 36.52] |
| 9.6 Pelvic abscess | 1 | 265 | Risk Ratio (M‐H, Random, 95% CI) | 0.17 [0.01, 4.19] |
| 9.7 Pelvic inflammatory disease | 2 | 418 | Risk Ratio (M‐H, Random, 95% CI) | 1.18 [0.18, 7.98] |
| 9.8 Haematometra | 5 | 1193 | Risk Ratio (M‐H, Random, 95% CI) | 0.34 [0.12, 0.95] |
| 9.9 Blood transfusion | 1 | 82 | Risk Ratio (M‐H, Random, 95% CI) | 5.24 [0.26, 105.97] |
| 9.10 Fluid overload | 3 | 588 | Risk Ratio (M‐H, Random, 95% CI) | 0.16 [0.03, 0.94] |
| 10 Complication rate: minor complications Show forest plot | 10 | 6450 | Risk Ratio (M‐H, Fixed, 95% CI) | 1.31 [1.11, 1.54] |
| 10.1 Nausea/vomiting | 4 | 997 | Risk Ratio (M‐H, Fixed, 95% CI) | 2.01 [1.40, 2.88] |
| 10.2 Uterine cramping | 2 | 601 | Risk Ratio (M‐H, Fixed, 95% CI) | 1.21 [1.02, 1.45] |
| 10.3 Urinary tract infection | 8 | 1834 | Risk Ratio (M‐H, Fixed, 95% CI) | 0.88 [0.45, 1.73] |
| 10.4 Fever | 3 | 671 | Risk Ratio (M‐H, Fixed, 95% CI) | 0.98 [0.22, 4.26] |
| 10.5 Haemorrhage | 4 | 889 | Risk Ratio (M‐H, Fixed, 95% CI) | 0.64 [0.26, 1.58] |
| 10.6 Muscle fasciculation | 1 | 267 | Risk Ratio (M‐H, Fixed, 95% CI) | 2.57 [0.11, 62.41] |
| 10.7 External burns (first degree) | 1 | 269 | Risk Ratio (M‐H, Fixed, 95% CI) | 2.32 [0.11, 47.89] |
| 10.8 Hydrosalpinx | 1 | 239 | Risk Ratio (M‐H, Fixed, 95% CI) | 0.30 [0.01, 7.39] |
| 10.9 Severe pelvic pain | 3 | 683 | Risk Ratio (M‐H, Fixed, 95% CI) | 0.95 [0.36, 2.48] |
| 11 Requirement for additional surgery Show forest plot | 12 | Risk Ratio (M‐H, Random, 95% CI) | Subtotals only | |
| 11.1 At 1 year follow‐up (ablation or hysterectomy) | 6 | 935 | Risk Ratio (M‐H, Random, 95% CI) | 0.72 [0.41, 1.26] |
| 11.2 At 1 year follow‐up (hysterectomy) | 5 | 925 | Risk Ratio (M‐H, Random, 95% CI) | 0.66 [0.35, 1.21] |
| 11.3 At 2 years' follow‐up (ablation or hysterectomy) | 5 | 988 | Risk Ratio (M‐H, Random, 95% CI) | 0.83 [0.52, 1.32] |
| 11.4 At 2 years' follow‐up (hysterectomy) | 4 | 920 | Risk Ratio (M‐H, Random, 95% CI) | 0.86 [0.52, 1.42] |
| 11.5 At 2 to 5 years' follow‐up (ablation or hysterectomy) | 3 | 647 | Risk Ratio (M‐H, Random, 95% CI) | 0.95 [0.72, 1.26] |
| 11.6 At 2 to 5 years' follow‐up (hysterectomy) | 4 | 758 | Risk Ratio (M‐H, Random, 95% CI) | 0.85 [0.59, 1.22] |
| 11.7 At 10 years' follow‐up (ablation or hysterectomy) | 1 | 189 | Risk Ratio (M‐H, Random, 95% CI) | 0.57 [0.37, 0.87] |
| 11.8 At 10 years' follow‐up (hysterectomy) | 1 | 189 | Risk Ratio (M‐H, Random, 95% CI) | 0.59 [0.38, 0.91] |