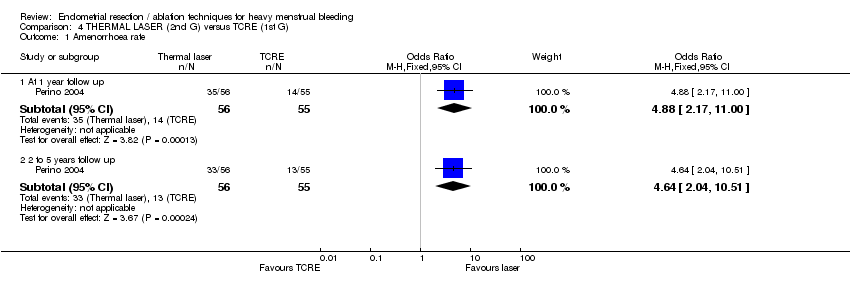
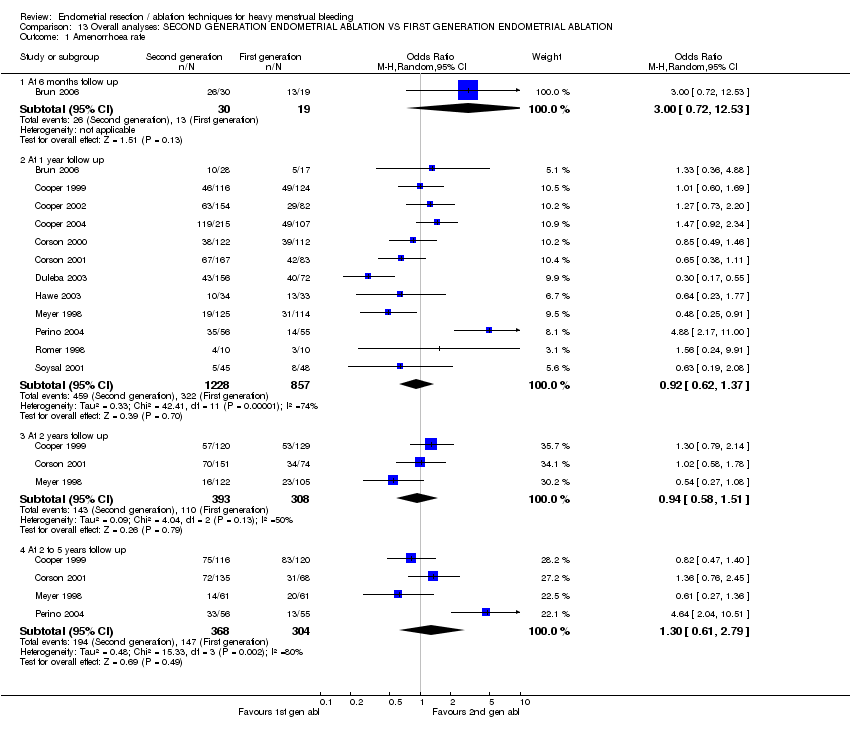
| 1 Amenorrhoea rate Show forest plot | 2 | | Odds Ratio (M‐H, Fixed, 95% CI) | Subtotals only |
|
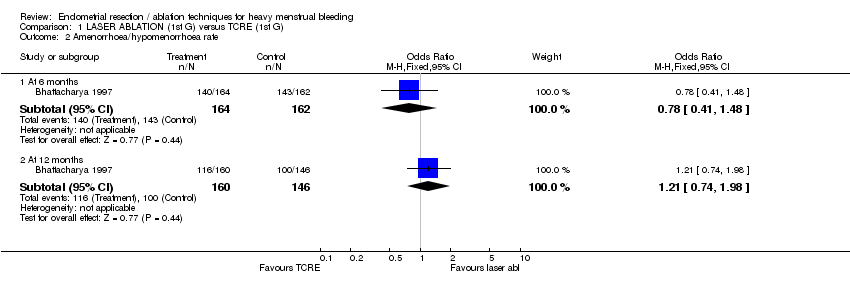
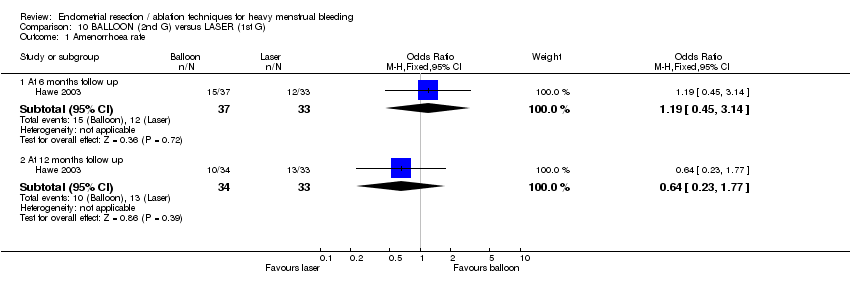
| 1.1 At 6 months follow up | 2 | 179 | Odds Ratio (M‐H, Fixed, 95% CI) | 6.97 [2.79, 17.47] |
| 1.2 At 12 months follow up | 2 | 180 | Odds Ratio (M‐H, Fixed, 95% CI) | 7.84 [2.92, 21.00] |
| 1.3 At 2 to 5 years follow up | 1 | 120 | Odds Ratio (M‐H, Fixed, 95% CI) | 2.09 [0.93, 4.69] |
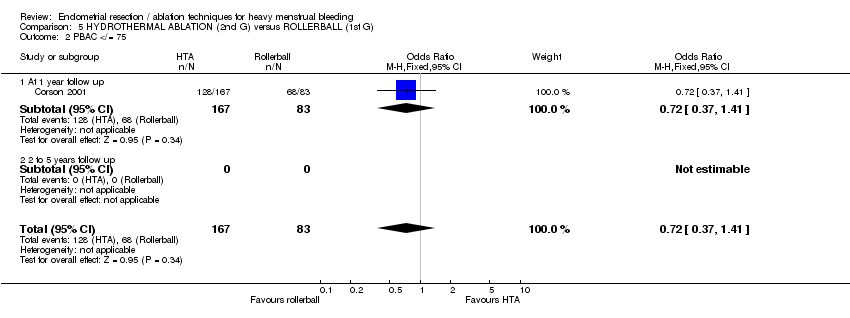
| 2 PBAC score after treatment Show forest plot | | | Other data | No numeric data |
|
| 2.1 At 12 months follow up | | | Other data | No numeric data |
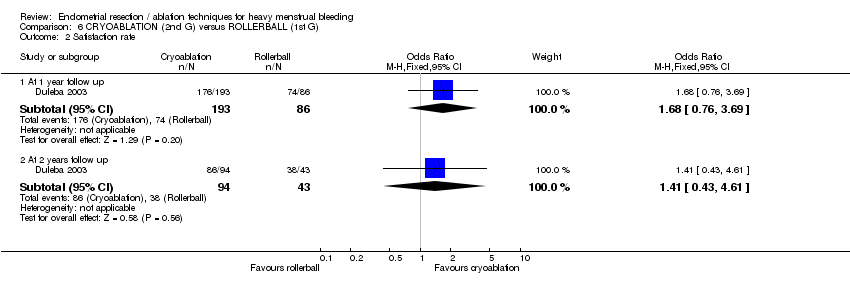
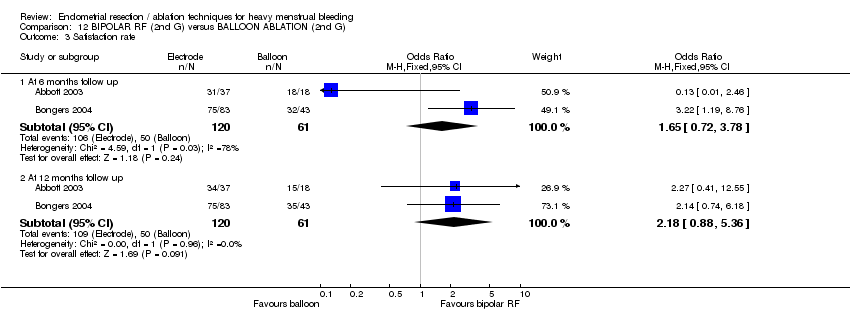
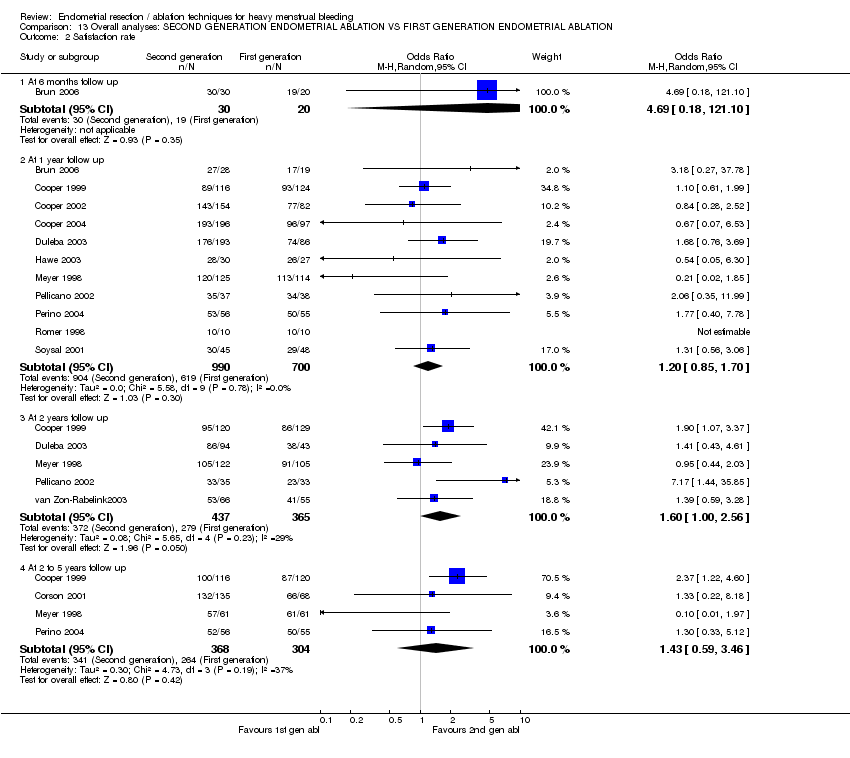
| 3 Satisfaction rate Show forest plot | 2 | | Odds Ratio (M‐H, Fixed, 95% CI) | Subtotals only |
|
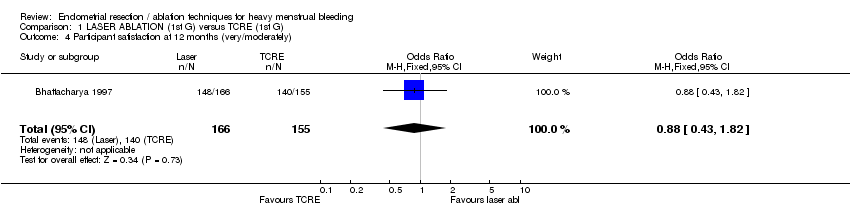
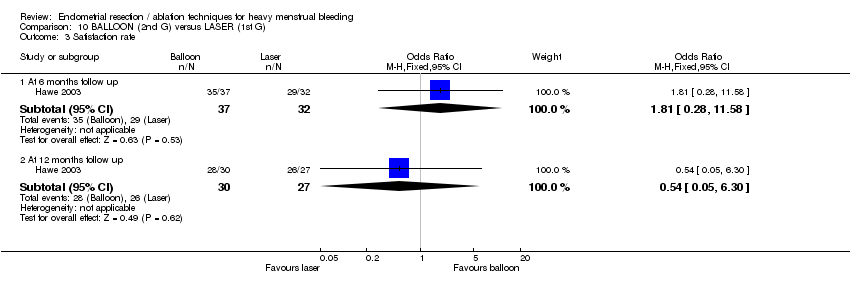
| 3.1 At 6 months follow up | 2 | 181 | Odds Ratio (M‐H, Fixed, 95% CI) | 1.65 [0.72, 3.78] |
| 3.2 At 12 months follow up | 2 | 181 | Odds Ratio (M‐H, Fixed, 95% CI) | 2.18 [0.88, 5.36] |
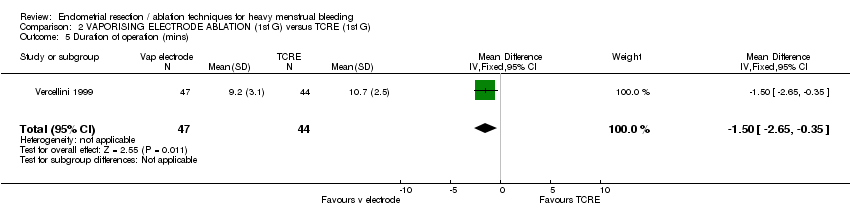
| 4 Duration of operation Show forest plot | | | Other data | No numeric data |
|
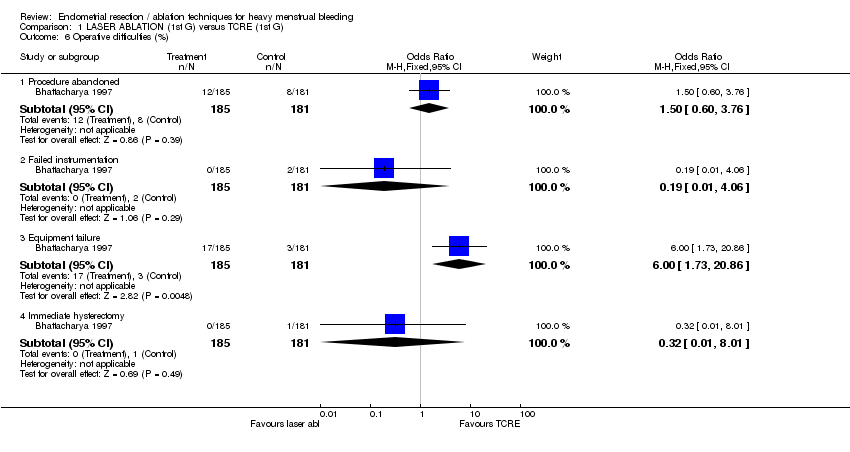
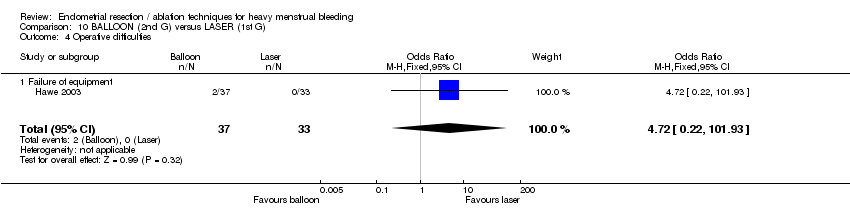
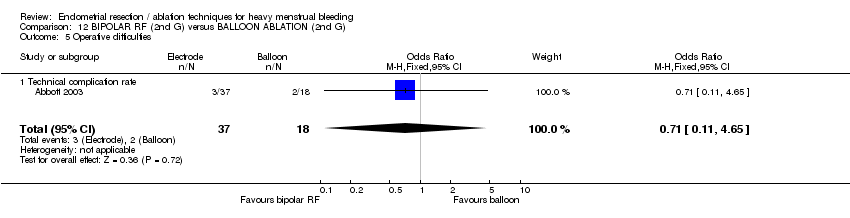
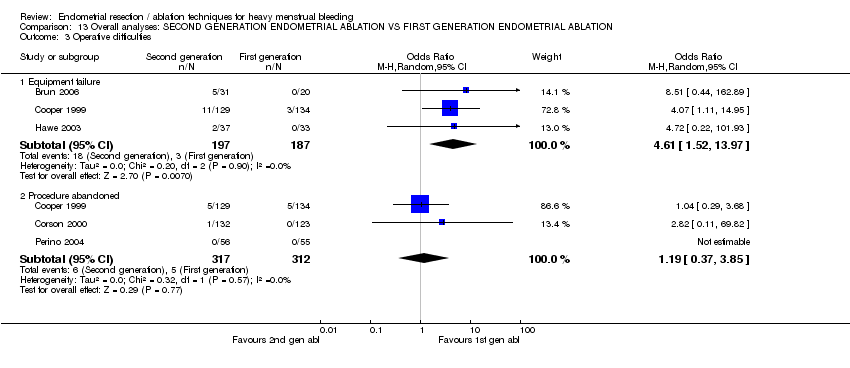
| 5 Operative difficulties Show forest plot | 1 | 55 | Odds Ratio (M‐H, Fixed, 95% CI) | 0.71 [0.11, 4.65] |
|
| 5.1 Technical complication rate | 1 | 55 | Odds Ratio (M‐H, Fixed, 95% CI) | 0.71 [0.11, 4.65] |
| 6 SF12 physical score Show forest plot | 1 | 55 | Mean Difference (IV, Fixed, 95% CI) | 1.60 [‐4.27, 7.47] |
|
| 6.1 At 12 months follow up | 1 | 55 | Mean Difference (IV, Fixed, 95% CI) | 1.60 [‐4.27, 7.47] |
| 7 SF12 mental score Show forest plot | 1 | 55 | Mean Difference (IV, Fixed, 95% CI) | 7.5 [‐0.52, 15.52] |
|
| 7.1 At 12 months follow up | 1 | 55 | Mean Difference (IV, Fixed, 95% CI) | 7.5 [‐0.52, 15.52] |
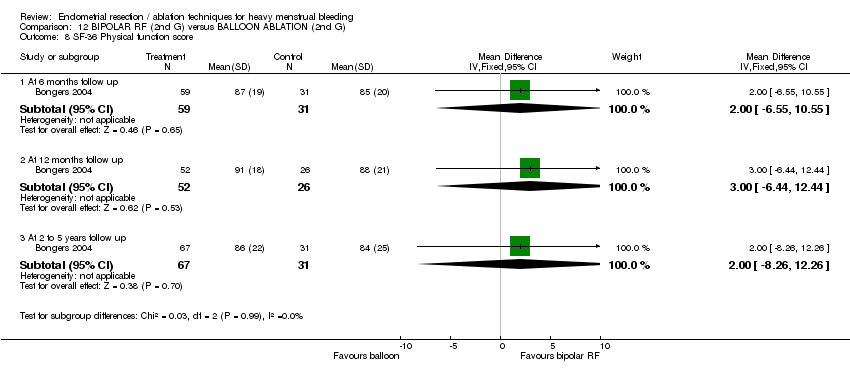
| 8 SF‐36 Physical function score Show forest plot | 1 | | Mean Difference (IV, Fixed, 95% CI) | Subtotals only |
|
| 8.1 At 6 months follow up | 1 | 90 | Mean Difference (IV, Fixed, 95% CI) | 2.0 [‐6.55, 10.55] |
| 8.2 At 12 months follow up | 1 | 78 | Mean Difference (IV, Fixed, 95% CI) | 3.0 [‐6.44, 12.44] |
| 8.3 At 2 to 5 years follow up | 1 | 98 | Mean Difference (IV, Fixed, 95% CI) | 2.0 [‐8.26, 12.26] |
| 9 SF‐36 Role physical Show forest plot | 1 | | Mean Difference (IV, Fixed, 95% CI) | Subtotals only |
|
| 9.1 At 6 months follow up | 1 | 90 | Mean Difference (IV, Fixed, 95% CI) | 5.0 [‐7.67, 17.67] |
| 9.2 At 12 months follow up | 1 | 78 | Mean Difference (IV, Fixed, 95% CI) | 5.0 [‐6.96, 16.96] |
| 9.3 At 2 to 5 years follow up | 1 | 98 | Mean Difference (IV, Fixed, 95% CI) | 8.0 [‐2.66, 18.66] |
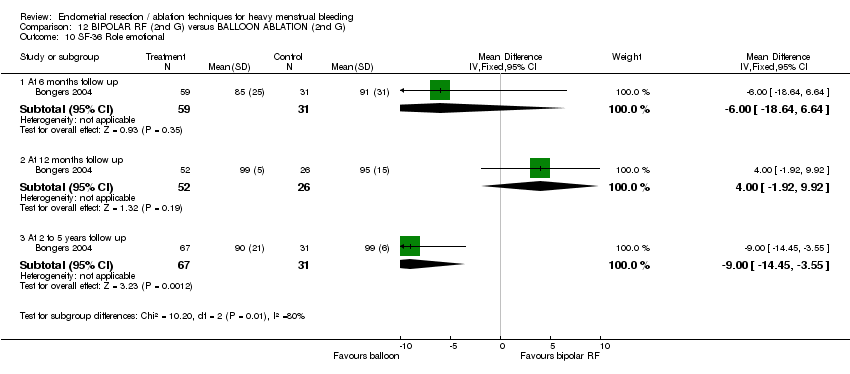
| 10 SF‐36 Role emotional Show forest plot | 1 | | Mean Difference (IV, Fixed, 95% CI) | Subtotals only |
|
| 10.1 At 6 months follow up | 1 | 90 | Mean Difference (IV, Fixed, 95% CI) | ‐6.0 [‐18.64, 6.64] |
| 10.2 At 12 months follow up | 1 | 78 | Mean Difference (IV, Fixed, 95% CI) | 4.0 [‐1.92, 9.92] |
| 10.3 At 2 to 5 years follow up | 1 | 98 | Mean Difference (IV, Fixed, 95% CI) | ‐9.0 [‐14.45, ‐3.55] |
| 11 SF‐36 Social functioning Show forest plot | 1 | | Mean Difference (IV, Fixed, 95% CI) | Subtotals only |
|
| 11.1 At 6 months follow up | 1 | 90 | Mean Difference (IV, Fixed, 95% CI) | ‐1.0 [‐9.98, 7.98] |
| 11.2 At 12 months follow up | 1 | 78 | Mean Difference (IV, Fixed, 95% CI) | 3.0 [‐6.17, 12.17] |
| 11.3 At 2 to 5 years follow up | 1 | 98 | Mean Difference (IV, Fixed, 95% CI) | 4.0 [‐5.60, 13.60] |
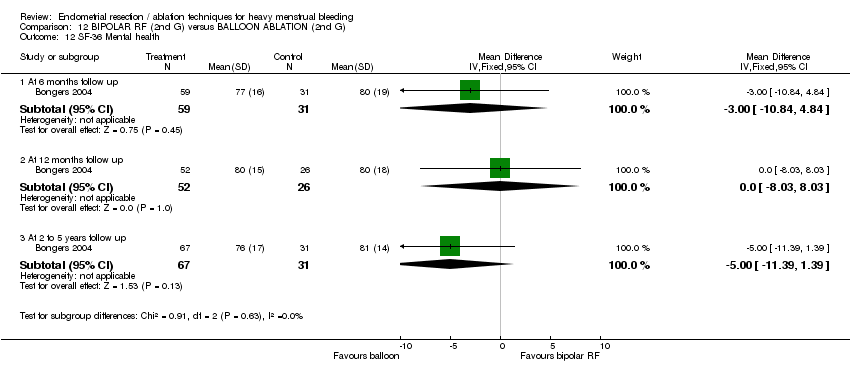
| 12 SF‐36 Mental health Show forest plot | 1 | | Mean Difference (IV, Fixed, 95% CI) | Subtotals only |
|
| 12.1 At 6 months follow up | 1 | 90 | Mean Difference (IV, Fixed, 95% CI) | ‐3.0 [‐10.84, 4.84] |
| 12.2 At 12 months follow up | 1 | 78 | Mean Difference (IV, Fixed, 95% CI) | 0.0 [‐8.03, 8.03] |
| 12.3 At 2 to 5 years follow up | 1 | 98 | Mean Difference (IV, Fixed, 95% CI) | ‐5.0 [‐11.39, 1.39] |
| 13 SF‐36 Energy/vitality Show forest plot | 1 | | Mean Difference (IV, Fixed, 95% CI) | Subtotals only |
|
| 13.1 At 6 months follow up | 1 | 90 | Mean Difference (IV, Fixed, 95% CI) | ‐6.0 [‐13.54, 1.54] |
| 13.2 At 12 months follow up | 1 | 78 | Mean Difference (IV, Fixed, 95% CI) | 9.0 [‐0.44, 18.44] |
| 13.3 At 2 to 5 years follow up | 1 | 98 | Mean Difference (IV, Fixed, 95% CI) | ‐3.0 [‐10.39, 4.39] |
| 14 SF‐36 Pain Show forest plot | 1 | | Mean Difference (IV, Fixed, 95% CI) | Subtotals only |
|
| 14.1 At 6 months follow up | 1 | 90 | Mean Difference (IV, Fixed, 95% CI) | 2.0 [‐6.00, 12.00] |
| 14.2 At 12 months follow up | 1 | 78 | Mean Difference (IV, Fixed, 95% CI) | ‐1.0 [‐12.61, 10.61] |
| 14.3 At 2 to 5 years follow up | 1 | 98 | Mean Difference (IV, Fixed, 95% CI) | ‐5.0 [‐14.79, 4.79] |
| 15 SF‐36 General health Show forest plot | 1 | | Mean Difference (IV, Fixed, 95% CI) | Subtotals only |
|
| 15.1 At 6 months follow up | 1 | 90 | Mean Difference (IV, Fixed, 95% CI) | ‐5.0 [‐13.30, 3.30] |
| 15.2 At 12 months follow up | 1 | 78 | Mean Difference (IV, Fixed, 95% CI) | 6.0 [‐4.10, 16.10] |
| 15.3 At 2 to 5 years follow up | 1 | 98 | Mean Difference (IV, Fixed, 95% CI) | 6.0 [‐5.72, 17.72] |
| 16 RSCL Physical symptoms Show forest plot | 1 | | Mean Difference (IV, Fixed, 95% CI) | Subtotals only |
|
| 16.1 At 6 months follow up | 1 | 90 | Mean Difference (IV, Fixed, 95% CI) | 1.0 [‐3.94, 5.94] |
| 16.2 At 12 months follow up | 1 | 78 | Mean Difference (IV, Fixed, 95% CI) | ‐4.0 [‐8.56, 0.56] |
| 17 RSCL Psychological distress Show forest plot | 1 | | Mean Difference (IV, Fixed, 95% CI) | Subtotals only |
|
| 17.1 At 6 months follow up | 1 | 90 | Mean Difference (IV, Fixed, 95% CI) | ‐1.0 [‐10.14, 8.14] |
| 17.2 At 12 months follow up | 1 | 78 | Mean Difference (IV, Fixed, 95% CI) | ‐1.0 [‐7.92, 5.92] |
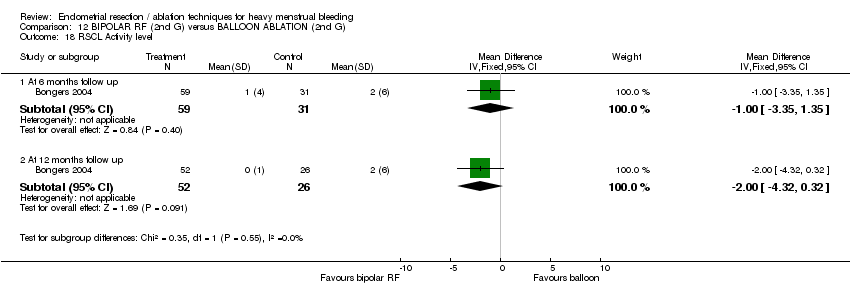
| 18 RSCL Activity level Show forest plot | 1 | | Mean Difference (IV, Fixed, 95% CI) | Subtotals only |
|
| 18.1 At 6 months follow up | 1 | 90 | Mean Difference (IV, Fixed, 95% CI) | ‐1.0 [‐3.35, 1.35] |
| 18.2 At 12 months follow up | 1 | 78 | Mean Difference (IV, Fixed, 95% CI) | ‐2.0 [‐4.32, 0.32] |
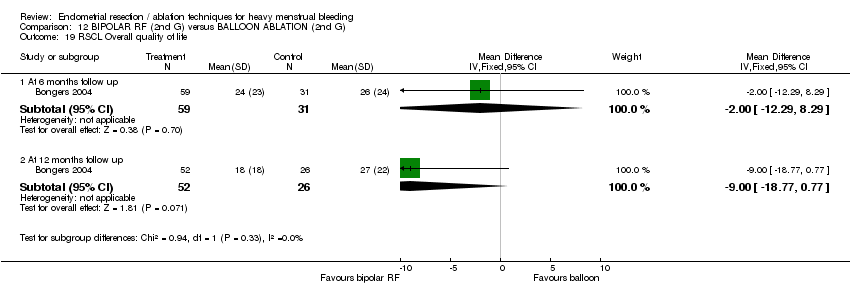
| 19 RSCL Overall quality of life Show forest plot | 1 | | Mean Difference (IV, Fixed, 95% CI) | Subtotals only |
|
| 19.1 At 6 months follow up | 1 | 90 | Mean Difference (IV, Fixed, 95% CI) | ‐2.0 [‐12.29, 8.29] |
| 19.2 At 12 months follow up | 1 | 78 | Mean Difference (IV, Fixed, 95% CI) | ‐9.0 [‐18.77, 0.77] |
| 20 SDS Depression Show forest plot | 1 | | Mean Difference (IV, Fixed, 95% CI) | Subtotals only |
|
| 20.1 At 6 months follow up | 1 | 90 | Mean Difference (IV, Fixed, 95% CI) | 2.0 [‐1.55, 5.55] |
| 20.2 At 12 months follow up | 1 | 78 | Mean Difference (IV, Fixed, 95% CI) | ‐1.0 [‐5.24, 3.24] |
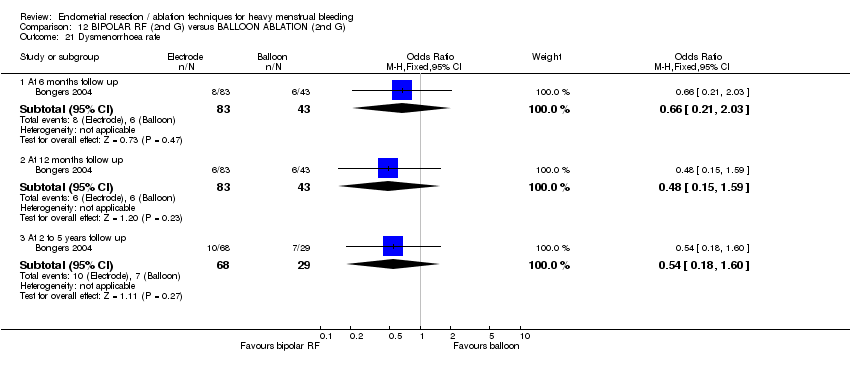
| 21 Dysmenorrhoea rate Show forest plot | 1 | | Odds Ratio (M‐H, Fixed, 95% CI) | Subtotals only |
|
| 21.1 At 6 months follow up | 1 | 126 | Odds Ratio (M‐H, Fixed, 95% CI) | 0.66 [0.21, 2.03] |
| 21.2 At 12 months follow up | 1 | 126 | Odds Ratio (M‐H, Fixed, 95% CI) | 0.48 [0.15, 1.59] |
| 21.3 At 2 to 5 years follow up | 1 | 97 | Odds Ratio (M‐H, Fixed, 95% CI) | 0.54 [0.18, 1.60] |
| 22 Dysmenorrhoea rate (VAS score) Show forest plot | | | Other data | No numeric data |
|
| 22.1 At 12 months follow up | | | Other data | No numeric data |
| 23 PMS rate (VAS score) Show forest plot | | | Other data | No numeric data |
|
| 23.1 At 12 months follow up | | | Other data | No numeric data |
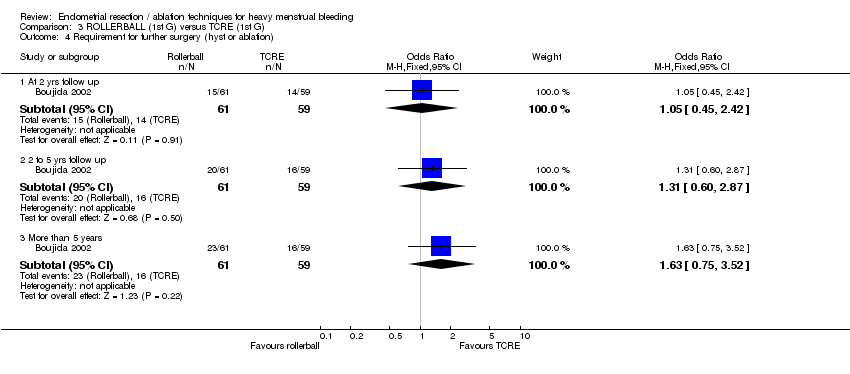
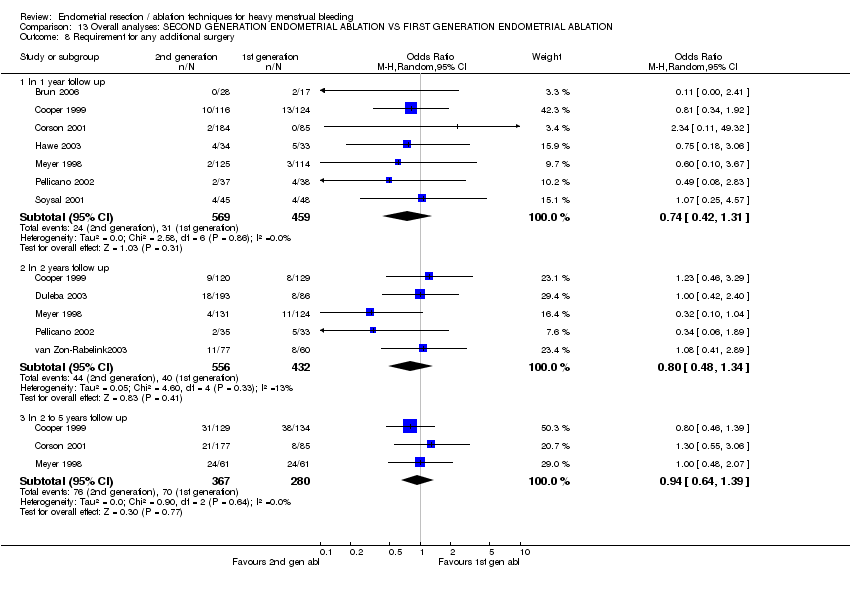
| 24 Requirement for further surgery (ablation or hyst) Show forest plot | 2 | | Odds Ratio (M‐H, Fixed, 95% CI) | Subtotals only |
|
| 24.1 At 6 months follow up | 1 | 53 | Odds Ratio (M‐H, Fixed, 95% CI) | 0.0 [0.0, 0.0] |
| 24.2 At 12 months follow up | 1 | 54 | Odds Ratio (M‐H, Fixed, 95% CI) | 7.22 [0.38, 135.96] |
| 24.3 At 2 to 5 years follow up | 1 | 120 | Odds Ratio (M‐H, Fixed, 95% CI) | 0.69 [0.23, 2.09] |
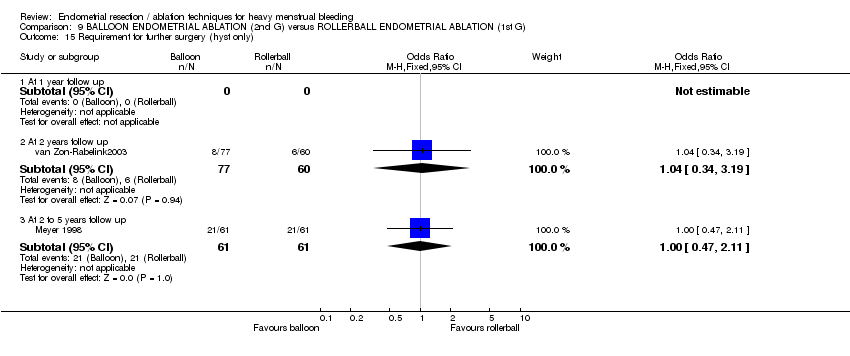
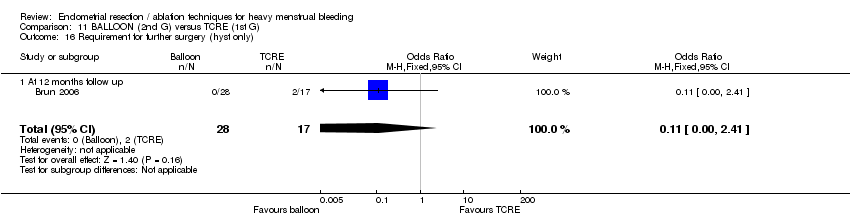
| 25 Requirement for further surgery (hyst only) Show forest plot | 1 | | Odds Ratio (M‐H, Fixed, 95% CI) | Subtotals only |
|
| 25.1 At 12 months follow up | 1 | 126 | Odds Ratio (M‐H, Fixed, 95% CI) | 0.49 [0.12, 2.08] |
| 25.2 At 2 to 5 years follow up | 1 | 120 | Odds Ratio (M‐H, Fixed, 95% CI) | 0.75 [0.23, 2.45] |