| Study ID | Primary outcomes | Secondary outcomes |
| Barth 1991 | No primary outcomes reported | Foot problems requiring treatment:
Significant reduction in intervention after 1 month (P < 0.001), maintained until final follow‐up at 6 months
Reduction was significantly smaller in control than in intervention after 1 month (P < 0.006), but not after 6 months (P = 0.216) Foot care knowledge:
Significant increase in both groups at 1 month (P < 0.001), but more in intervention than in control (P < 0.001). Changes were maintained until final follow‐up at 6 months Foot care routine compliance:
Significant increase in intervention after 1 month (P < 0.001), maintained until final follow‐up
Increase was significantly greater in intervention than in control after 1 month (P = 0.012) |
| Bloomgarden 1987 | Ulcer or amputation:
people with no foot lesions at baseline:
intervention 2/83 vs control 2/63 people with callus, nail dystrophy or fungal infection at baseline: intervention 2/37 vs control 3/63 people with an ulcer or amputation at baseline: intervention 6/7 vs control 11/13 | Callus, nail dystrophy and fungal infection:
people with no foot lesions at baseline: intervention 31/83 vs control 28/63 (ns)
people with callus, nail dystrophy or fungal infection at baseline: intervention 24/37 vs control 46/63 (ns)
people with an ulcer or amputation at baseline: intervention 1/7 vs control 1/13 (ns) Behaviour assessment scores:
intervention from 3.4 to 4.3. Control from 3.6 to 4.1 (P = 0.10). Separate data for foot care not provided |
| Borges 2004 | No primary outcomes reported | Patients' self‐reported behaviour assessment scores:
intervention from 4.7 to 5.6 (P < 0.01). RA from 4.8 to 5.2 (P = 0.06). C from 5.1 to 5.4 (P < 0.05) Observed self‐care behaviour:
4 of 16 items significantly (P < 0.05) more observed in intervention than in control Foot care knowledge scores:
Increased within the control group, but not in the intervention or RA groups |
| Cisneros 2010 | Ulcer incidence: people without a history of foot ulceration: intervention 8/21 vs control 8/14 (P = 0.317) Patient with a history of foot ulceration: intervention 1/8 vs control 5/8 (P = 0.119) All people: difference between the survival curves of intervention and control (P = 0.362) (HR not reported) | No secondary outcomes reported |
| Corbett 2003 | No primary outcomes reported | Foot care knowledge scores:
intervention from 4.9 to 6.1 vs control from 4.6 to 5.2 (P = 0.03) Foot care practice scores:
intervention from 4.3 to 5.6 vs control from 4.1 to 4.3 (P = 0.007) |
| Frank 2003 | No primary outcomes reported | Foot care knowledge scores:
Means: intervention 20.98 (SD 2.46) vs control 18.60 (SD 2.93), (P < 0.001)
Mean differences: intervention 2.33 (SD 2.49) vs control 1.10 (SD 2.89), (P = 0.028) Patients' behaviour assessment:
(mean number of days per week)
Checking feet: intervention 6.33 vs control 5.88 (P = 0.203). Mean differences: intervention 1.13 vs control 1.35 (P = 0.708)
Washing feet: intervention 5.75 vs control 5.94 (P = 0.573). Mean differences: intervention 0.58 vs control 0.52 (P = 0.863)
Applying lotion: intervention 5.96 vs control 4.94 (P = 0.044). Mean differences: intervention 1.42 vs control 0.75 (,P = 0.191)
Wearing shoes and socks: intervention 5.60 vs control 5.42 (P = 0.705). Mean differences: intervention 1.90 vs control 0.50 (P = 0.036) |
| Kruger 1992 | No primary outcomes reported | Foot status:
No significant difference. Foot care knowledge scores:
intervention from 9.1 to 10.0 vs control from 8.66 to 9.86, statistically significant increase in control group (P = 0.02), but not in the intervention group (P = 0.078) Behaviour assessment:
Daily foot inspection: intervention from 52.5% to 66.7% vs control from 34.8% to 66.7% (ns)
Daily foot washing: intervention from 82.6% to 86.7% vs control from 74.1% to 73.3% (statistically significant increase in intervention group)
Use of pumice stones for corns: intervention from 4.3% to 26.7% vs control from 3.7% to 26.7% (ns)
Trimming toenails regularly: intervention from 34.8% to 80.0% vs control from 66.7% to 66.7% (statistically significant increase in intervention group)
Improvement in keeping toenails shorter: intervention from 30.4% to 80.0% vs control from 66.7% to 86.7% (ns) |
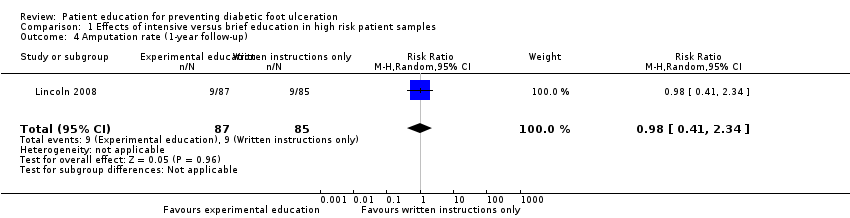
| Lincoln 2008 | Ulcer incidence:
After 6 months: intervention 26 vs control 18, RR 1.41 (95% CI 0.84 to 2.38)
After 12 months: intervention 36 vs control 35, RR 1.00 (95% CI 0.70 to 1.44) Amputation rate:
After 6 months: intervention 3 vs control 0, RR not estimable
After 12 months: intervention 9 vs control 9, RR 0.98 (95% CI 0.41 to 2.34) | Behaviour assessment scores:
intervention 42.0 vs control 38.7 (P = 0.03) |
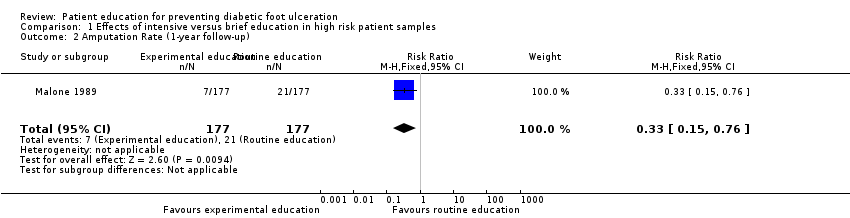
| Malone 1989 | Ulcer incidence:
intervention 8 vs control 26; significantly lower in intervention group (P ≤ 0.005) Amputation rate:
intervention 7 vs control 21; significantly lower in intervention group (P < 0.025) | No secondary outcomes reported |
| Mazzuca 1986 | No primary outcomes reported | Foot care knowledge scores:
No significant difference |
| Rettig 1986 | No primary outcomes reported | Foot appearance scores (mean ±standard error):
intervention 70.2 ± 0.7 vs control 68.8 ±0.7 (ns) Foot care knowledge scores:
intervention 62.2 ±1.7 vs control 53.1 ± 1.8 (P = 0.001). Significant increase in intervention group Foot care skills scores:
intervention 71.8 ±2.0 vs control 68.9 ± 1.8 (ns) |
| Rönnemaa 1997 | Amputation:
1‐year follow‐up: intervention 0 vs control 0 7‐year follow‐up: intervention 1 vs control 0 Foot ulceration:
1‐year follow‐up: intervention 1 vs control 0 7‐year follow‐up: intervention 1 vs control 1 | Callus development:
1‐year follow‐up: Calcaneal region: -
presence of callus: intervention from 18.5% to 12.0% vs control from 16.8% to 15.5% (ns) -
mean diameter: intervention from 40.5 mm (SD 30.8 mm) to 25.5 mm (SD 28.8 mm) vs control from 30.6 mm (SD 28.5 mm) to 28.3 mm (SD 26.8 mm); statistically significant decrease in area of callosities at calcaneal region in intervention group (P = 0.065) Other regions: -
presence of callus: intervention from 54.5% to 39.5% vs control from 51.3% to 48.2%; significant decrease in callosities in intervention group (P < 0.009) -
mean diameter: intervention from 16.6 mm (SD 10.2 mm) to 11.4 mm (SD 10.3 mm) vs control from 15.2 mm (SD 9.8 mm) to 14.4 mm (SD 9.9 mm); statistically significant decrease in area of callosities in intervention group (P < 0.001) 7‐year follow‐up: Calcaneal region: Other regions: Foot care knowledge scores:
1‐year follow‐up: 7‐year follow‐up: Patients' behaviour assessment scores:
1‐year follow‐up: 7‐year follow‐up: |
| Abbreviations: CI = confidence interval, ns = no statistical significance, RA = group that received risk assessment only, RR = risk ratio, SD = standard deviation. |