Educación del paciente para la prevención de la úlcera del pie diabético
Información
- DOI:
- https://doi.org/10.1002/14651858.CD001488.pub5Copiar DOI

- Base de datos:
-
- Cochrane Database of Systematic Reviews
- Versión publicada:
-
- 16 diciembre 2014see what's new
- Tipo:
-
- Intervention
- Etapa:
-
- Review
- Grupo Editorial Cochrane:
-
Grupo Cochrane de Heridas
- Copyright:
-
- Copyright © 2014 The Cochrane Collaboration. Published by John Wiley & Sons, Ltd.
Cifras del artículo
Altmetric:
Citado por:
Autores
Contributions of authors
JAN Dorresteijn extracted, checked and analysed data, undertook and checked quality assessment, completed the first draft of the review update, made an intellectual contribution to the review update, approved review update prior to submission and performed previous work that was the foundation of the current review.
DMW Kriegsman performed part of the writing and editing of the review update, made an intellectual contribution, approved final review update prior to submission and performed previous work that was the foundation of the current review.
WJJ Assendelft performed part of the writing and editing of the review update, made an intellectual contribution, approved final review update prior to submission and performed previous work that was the foundation of the current review.
GD Valk coordinated the review update, extracted, checked and analysed data, undertook and checked quality assessment, performed part of the writing and editing of the review update, made an intellectual contribution, approved final review update prior to submission, performed previous work that was the foundation of the current update and is guarantor of the review update.
Contributions of editorial base:
Nicky Cullum: edited the review, advised on methodology, interpretation and review content; approved the final review and review updates prior to submission.
Sally Bell‐Syer: coordinated the editorial process, advised on methodology, interpretation and content; edited the updates of the review.
Ruth Foxlee and Amanda Briant: designed the search strategy, ran the searches and edited the search methods section for the updates.
Sources of support
Internal sources
-
Dutch Cochrane Centre, Netherlands.
-
Leiden University Medical Center, Department of Public Health and Primary Care, Netherlands.
-
University Medical Center Utrecht, Department of Internal Medicine, Netherlands.
External sources
-
NIHR/Department of Health (England), (Cochrane Wounds Group), UK.
Declarations of interest
None known.
Acknowledgements
The authors would like to thank:
-
Nicky Cullum for putting her existing work on education for the diabetic foot at our disposal,
-
The Cochrane Wounds Group referees (Neil Baker, Althea Foster, Sue O'Meara, Jude Smith) and editors (Nicky Cullum, Andrew Jull) who commented on the original review
-
Anne Lawson, copy editor.
Version history
| Published | Title | Stage | Authors | Version |
| 2014 Dec 16 | Patient education for preventing diabetic foot ulceration | Review | Johannes AN Dorresteijn, Didi MW Kriegsman, Willem JJ Assendelft, Gerlof D Valk | |
| 2012 Oct 17 | Patient education for preventing diabetic foot ulceration | Review | Johannes AN Dorresteijn, Didi MW Kriegsman, Willem JJ Assendelft, Gerlof D Valk | |
| 2010 May 12 | Patient education for preventing diabetic foot ulceration | Review | Johannes A N Dorresteijn, Didi M W Kriegsman, Willem JJ Assendelft, Gerlof D Valk | |
| 2001 Oct 23 | Patient education for preventing diabetic foot ulceration | Review | Gerlof D Valk, Didi M W Kriegsman, Willem JJ Assendelft | |
| 1998 Jul 27 | Educational interventions for patients in the prevention of diabetic foot ulceration | Protocol | Gerlof Valk, W JJ Assendelft | |
Differences between protocol and review
In this updated review, we have excluded studies in which the intervention consisted of multiple combined strategies for the prevention of diabetic foot ulceration, where patient education was not the main comparator with the control intervention (Litzelman 1993). We have developed and published a further Cochrane review that provides a more comprehensive overview of the effects of such integrated prevention strategies (complex interventions) (Dorresteijn 2010a). In addition, we have redefined the previously used primary outcome 'infection' into the secondary outcome 'fungal infection'. Furthermore, while the Amsterdam‐Maastricht consensus list was used to score risk of bias in previous versions of this review (van Tulder 1997), we have adopted The Cochrane Collaboration's recommended tool for assessing risk of bias in this update (Higgins 2011).
Keywords
MeSH
Medical Subject Headings (MeSH) Keywords
Medical Subject Headings Check Words
Humans;
PICO

Methodological quality summary: review authors' judgements about each methodological quality item for each included study.

Comparison 1 Effects of intensive versus brief education in high risk patient samples, Outcome 1 Foot ulcer incidence (1‐year follow‐up).
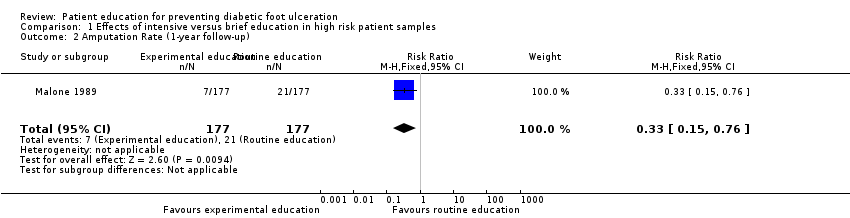
Comparison 1 Effects of intensive versus brief education in high risk patient samples, Outcome 2 Amputation Rate (1‐year follow‐up).

Comparison 1 Effects of intensive versus brief education in high risk patient samples, Outcome 3 Foot ulcer incidence (1‐year follow‐up).
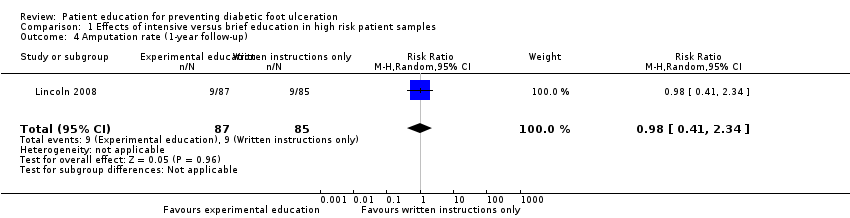
Comparison 1 Effects of intensive versus brief education in high risk patient samples, Outcome 4 Amputation rate (1‐year follow‐up).
| Study ID | Primary outcomes | Secondary outcomes |
| No primary outcomes reported | Foot problems requiring treatment: Foot care knowledge: Foot care routine compliance: | |
| Ulcer or amputation: people with callus, nail dystrophy or fungal infection at baseline: intervention 2/37 vs control 3/63 people with an ulcer or amputation at baseline: intervention 6/7 vs control 11/13 | Callus, nail dystrophy and fungal infection: Behaviour assessment scores: | |
| No primary outcomes reported | Patients' self‐reported behaviour assessment scores: Observed self‐care behaviour: Foot care knowledge scores: | |
| Ulcer incidence: people without a history of foot ulceration: intervention 8/21 vs control 8/14 (P = 0.317) Patient with a history of foot ulceration: intervention 1/8 vs control 5/8 (P = 0.119) All people: difference between the survival curves of intervention and control (P = 0.362) (HR not reported) | No secondary outcomes reported | |
| No primary outcomes reported | Foot care knowledge scores: Foot care practice scores: | |
| No primary outcomes reported | Foot care knowledge scores: Patients' behaviour assessment: | |
| No primary outcomes reported | Foot status: Foot care knowledge scores: Behaviour assessment: | |
| Ulcer incidence: Amputation rate: | Behaviour assessment scores: | |
| Ulcer incidence: Amputation rate: | No secondary outcomes reported | |
| No primary outcomes reported | Foot care knowledge scores: | |
| No primary outcomes reported | Foot appearance scores (mean ±standard error): Foot care knowledge scores: Foot care skills scores: | |
| Amputation: 7‐year follow‐up: intervention 1 vs control 0 Foot ulceration: 7‐year follow‐up: intervention 1 vs control 1 | Callus development: Calcaneal region:
Other regions:
7‐year follow‐up: Calcaneal region:
Other regions:
Foot care knowledge scores:
7‐year follow‐up:
Patients' behaviour assessment scores:
7‐year follow‐up:
| |
| Abbreviations: CI = confidence interval, ns = no statistical significance, RA = group that received risk assessment only, RR = risk ratio, SD = standard deviation. | ||
| Outcome or subgroup title | No. of studies | No. of participants | Statistical method | Effect size |
| 1 Foot ulcer incidence (1‐year follow‐up) Show forest plot | 1 | 354 | Risk Ratio (M‐H, Fixed, 95% CI) | 0.31 [0.14, 0.66] |
| 2 Amputation Rate (1‐year follow‐up) Show forest plot | 1 | 354 | Risk Ratio (M‐H, Fixed, 95% CI) | 0.33 [0.15, 0.76] |
| 3 Foot ulcer incidence (1‐year follow‐up) Show forest plot | 1 | 172 | Risk Ratio (M‐H, Random, 95% CI) | 1.00 [0.70, 1.44] |
| 4 Amputation rate (1‐year follow‐up) Show forest plot | 1 | 172 | Risk Ratio (M‐H, Random, 95% CI) | 0.98 [0.41, 2.34] |