Educación del paciente para la prevención de la úlcera del pie diabético
Appendices
Appendix 1. 'Risk of bias' table judgement criteria
1. Was the allocation sequence randomly generated?
Low risk of bias
The investigators describe a random component in the sequence generation process such as: referring to a random number table; using a computer random number generator; coin tossing; shuffling cards or envelopes; throwing dice; drawing of lots.
High risk of bias
The investigators describe a non‐random component in the sequence generation process. Usually, the description would involve some systematic, non‐random approach, for example: sequence generated by odd or even date of birth; sequence generated by some rule based on date (or day) of admission; sequence generated by some rule based on hospital or clinic record number.
Unclear
Insufficient information about the sequence generation process to permit judgement of low or high risk of bias.
2. Was the treatment allocation adequately concealed?
Low risk of bias
Participants and investigators enrolling participants could not foresee assignment because one of the following, or an equivalent method, was used to conceal allocation: central allocation (including telephone, web‐based and pharmacy‐controlled randomisation); sequentially‐numbered drug containers of identical appearance; sequentially‐numbered, opaque, sealed envelopes.
High risk of bias
Participants or investigators enrolling participants could possibly foresee assignments and thus introduce selection bias, such as allocation based on: using an open random allocation schedule (e.g. a list of random numbers); assignment envelopes were used without appropriate safeguards (e.g. if envelopes were unsealed or non opaque or not sequentially numbered); alternation or rotation; date of birth; case record number; any other explicitly unconcealed procedure.
Unclear
Insufficient information to permit judgement of low or high risk of bias. This is usually the case if the method of concealment is not described or not described in sufficient detail to allow a definite judgement, for example if the use of assignment envelopes is described, but it remains unclear whether envelopes were sequentially numbered, opaque and sealed.
3. Blinding ‐ was knowledge of the allocated interventions adequately prevented during the study?
Low risk of bias
Any one of the following.
-
No blinding, but the review authors judge that the outcome and the outcome measurement are not likely to be influenced by lack of blinding.
-
Blinding of participants and key study personnel ensured, and unlikely that the blinding could have been broken.
-
Either participants or some key study personnel were not blinded, but outcome assessment was blinded and the non‐blinding of others unlikely to introduce bias.
High risk of bias
Any one of the following.
-
No blinding or incomplete blinding, and the outcome or outcome measurement is likely to be influenced by lack of blinding.
-
Blinding of key study participants and personnel attempted, but likely that the blinding could have been broken.
-
Either participants or some key study personnel were not blinded, and the non‐blinding of others likely to introduce bias.
Unclear
Any one of the following.
-
Insufficient information to permit judgement of low or high risk of bias.
-
The study did not address this outcome.
4. Were incomplete outcome data adequately addressed?
Low risk of bias
Any one of the following.
-
No missing outcome data.
-
Reasons for missing outcome data unlikely to be related to true outcome (for survival data, censoring unlikely to be introducing bias).
-
Missing outcome data balanced in numbers across intervention groups, with similar reasons for missing data across groups.
-
For dichotomous outcome data, the proportion of missing outcomes compared with observed event risk not enough to have a clinically relevant impact on the intervention effect estimate.
-
For continuous outcome data, plausible effect size (difference in means or standardised difference in means) among missing outcomes not enough to have a clinically relevant impact on observed effect size.
-
Missing data have been imputed using appropriate methods.
High risk of bias
Any one of the following.
-
Reason for missing outcome data likely to be related to true outcome, with either imbalance in numbers or reasons for missing data across intervention groups.
-
For dichotomous outcome data, the proportion of missing outcomes compared with observed event risk enough to induce clinically relevant bias in intervention effect estimate.
-
For continuous outcome data, plausible effect size (difference in means or standardised difference in means) among missing outcomes enough to induce clinically relevant bias in observed effect size.
-
‘As‐treated’ analysis done with substantial departure of the intervention received from that assigned at randomisation.
-
Potentially inappropriate application of simple imputation.
Unclear
Any one of the following.
-
Insufficient reporting of attrition/exclusions to permit judgement of low or high risk of bias (e.g. number randomised not stated, no reasons for missing data provided).
-
The study did not address this outcome.
5. Are reports of the study free of suggestion of selective outcome reporting?
Low risk of bias
Any of the following.
-
The study protocol is available and all of the study’s pre‐specified (primary and secondary) outcomes that are of interest in the review have been reported in the pre‐specified way.
-
The study protocol is not available but it is clear that the published reports include all expected outcomes, including those that were pre‐specified (convincing text of this nature may be uncommon)
High risk of bias
Any one of the following.
-
Not all of the study’s pre‐specified primary outcomes have been reported.
-
One or more primary outcomes is reported using measurements, analysis methods or subsets of the data (e.g. subscales) that were not pre‐specified.
-
One or more reported primary outcomes were not pre‐specified (unless clear justification for their reporting is provided, such as an unexpected adverse effect).
-
One or more outcomes of interest in the review are reported incompletely so that they cannot be entered in a meta‐analysis.
-
The study report fails to include results for a key outcome that would be expected to have been reported for such a study.
Unclear
Insufficient information to permit judgement of low or high risk of bias. It is likely that the majority of studies will fall into this category.
6. Other sources of potential bias
Low risk of bias
The study appears to be free of other sources of bias.
High risk of bias
There is at least one important risk of bias. For example, the study:
-
had a potential source of bias related to the specific study design used; or
-
has been claimed to have been fraudulent; or
-
had some other problem.
Unclear
There may be a risk of bias, but there is either:
-
insufficient information to assess whether an important risk of bias exists; or
-
insufficient rationale or evidence that an identified problem will introduce bias.
Appendix 2. Electronic searches
For the third update the search strings were run in the following electronic databases:
-
The Cochrane Wounds Group Specialised Register (searched 1 August 2012);
-
The Cochrane Central Register of Controlled Trials (CENTRAL) (The Cochrane Library 2012, Issue 7);
-
Ovid MEDLINE (2009 to July Week 3 2012);
-
Ovid MEDLINE (In‐Process & Other Non‐Indexed Citations, July 31, 2012);
-
Ovid EMBASE (2009 to 2012 Week 30);
-
EBSCO CINAHL (2009 to 26 July 2012).
The following search strategy was used for CENTRAL:
#1 MeSH descriptor Education explode all trees
#2 patient NEAR/3 education*
#3 diabetes NEAR/3 education*
#4 patient NEAR/3 information
#5 education* NEAR/2 program*
#6 (foot NEXT care) or footcare
#7 leaflet* or booklet* or pamphlet* or "poster" or "posters"
#8 (written or printed or oral) NEAR/3 information
#9 academic NEXT detailing
#10 training NEXT program*
#11 algorithm* or (decision NEXT tree*)
#12 (#1 OR #2 OR #3 OR #4 OR #5 OR #6 OR #7 OR #8 OR #9 OR #10 OR #11)
#13 MeSH descriptor Foot Ulcer explode all trees
#14 MeSH descriptor Diabetic Foot explode all trees
#15 diabet* NEAR/3 ulcer*
#16 diabet* NEAR/3 (foot or feet)
#17 diabet* NEAR/3 infection*
#18 diabet* NEAR/3 wound*
#19 (#13 OR #14 OR #15 OR #16 OR #17 OR #18)
#20 (#12 AND #19)
The search strategies for Ovid MEDLINE, Ovid EMBASE and EBSCO CINAHL can be found in Appendix 2, Appendix 3 and Appendix 4 respectively. The Ovid MEDLINE search was combined with the Cochrane Highly Sensitive Search Strategy for identifying randomised trials in MEDLINE: sensitivity‐ and precision‐maximizing version (2008 revision); Ovid format. The EMBASE and CINAHL searches were combined with the trial filters developed by the Scottish Intercollegiate Guidelines Network (SIGN). No date or language restrictions were applied.
Appendix 3. Ovid MEDLINE search strategy
1 exp Education/
2 (patient adj3 education).ti,ab.
3 (diabetes adj3 education).ti,ab.
4 (patient adj3 information).ti,ab.
5 (education adj2 program$).ti,ab.
6 (foot care or footcare).ti,ab.
7 (leaflet$ or booklet$ or pamphlet$ or poster$).ti,ab.
8 ((written or printed or oral) adj3 information).ti,ab.
9 academic detailing.ti,ab.
10 training program$.ti,ab.
11 (algorithm$ or decision tree$).ti,ab.
12 or/1‐11
13 exp Foot Ulcer/
14 exp Diabetic Foot/
15 (diabet$ adj3 ulcer$).ti,ab.
16 (diabet$ adj3 (foot or feet)).ti,ab.
17 or/13‐16
18 12 and 17
Appendix 4. Ovid EMBASE search strategy
1 exp Education/
2 (patient adj3 education).ti,ab.
3 (diabetes adj3 education).ti,ab.
4 (patient adj3 information).ti,ab.
5 (education adj2 program$).ti,ab.
6 (foot care or footcare).ti,ab.
7 (leaflet$ or booklet$ or pamphlet$ or poster$).ti,ab.
8 ((written or printed or oral) adj3 information).ti,ab.
9 academic detailing.ti,ab.
10 training program$.ti,ab.
11 (algorithm$ or decision tree$).ti,ab.
12 or/1‐11
13 exp Foot Ulcer/
14 exp Diabetic Foot/
15 (diabet$ adj3 ulcer$).ti,ab.
16 (diabet$ adj3 (foot or feet)).ti,ab.
17 or/13‐16
18 12 and 17
Appendix 5. EBSCO CINAHL search strategy
S21 S13 and S20
S20 S14 or S15 or S16 or S17 or S18 or S19
S19 TI diabet* N3 wound* or AB diabet* N3 wound*
S18 TI diabet* N3 infection* or AB diabet* N3 infection*
S17 TI ( diabet* N3 foot or diabet* N3 feet ) or AB ( diabet* N3 foot or diabet* N3 feet )
S16 TI diabet* N3 ulcer* or AB diabet* N3 ulcer*
S15 (MH "Diabetic Foot")
S14 (MH "Foot Ulcer+")
S13 S1 or S2 or S3 or S4 or S5 or S6 or S7 or S8 or S9 or S10 or S11 or S12
S12 TI ( algorithm* or decision tree* ) or AB ( algorithm* or decision tree* )
S11 TI training program* or AB training program*
S10 TI academic detailing or AB academic detailing
S9 TI ( written N3 information or printed N3 information or oral N3 information ) or AB ( written N3 information or printed N3 information or oral N3 information )
S8 TI ( leaflet* or booklet* or pamphlet* or poster or posters ) or AB ( leaflet* or booklet* or pamphlet* or poster or posters )
S7 TI ( foot care or footcare ) or AB ( foot care or footcare )
S6 (MH "Foot Care")
S5 TI education* N3 program* or AB education* N3 program*
S4 TI diabetes N3 information or AB diabetes N3 information
S3 TI diabetes N3 education* or AB diabetes N3 education*
S2 TI patient N3 education* or AB patient N3 education*
S1 (MH "Patient Education+")

Methodological quality summary: review authors' judgements about each methodological quality item for each included study.

Comparison 1 Effects of intensive versus brief education in high risk patient samples, Outcome 1 Foot ulcer incidence (1‐year follow‐up).
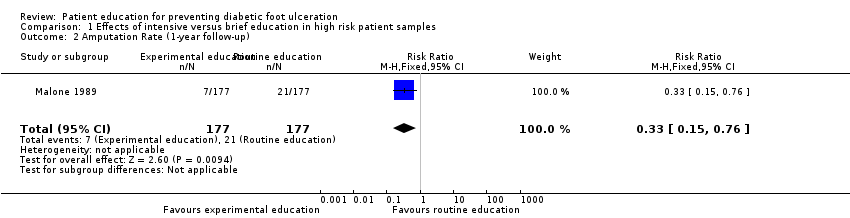
Comparison 1 Effects of intensive versus brief education in high risk patient samples, Outcome 2 Amputation Rate (1‐year follow‐up).

Comparison 1 Effects of intensive versus brief education in high risk patient samples, Outcome 3 Foot ulcer incidence (1‐year follow‐up).
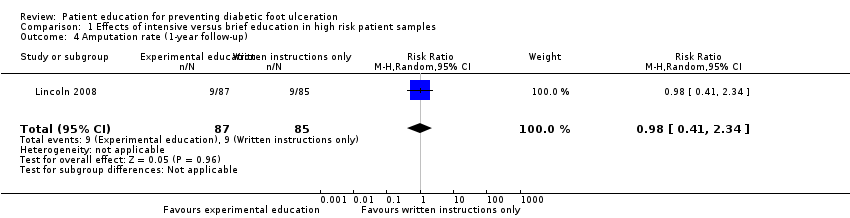
Comparison 1 Effects of intensive versus brief education in high risk patient samples, Outcome 4 Amputation rate (1‐year follow‐up).
| Study ID | Primary outcomes | Secondary outcomes |
| No primary outcomes reported | Foot problems requiring treatment: Foot care knowledge: Foot care routine compliance: | |
| Ulcer or amputation: people with callus, nail dystrophy or fungal infection at baseline: intervention 2/37 vs control 3/63 people with an ulcer or amputation at baseline: intervention 6/7 vs control 11/13 | Callus, nail dystrophy and fungal infection: Behaviour assessment scores: | |
| No primary outcomes reported | Patients' self‐reported behaviour assessment scores: Observed self‐care behaviour: Foot care knowledge scores: | |
| Ulcer incidence: people without a history of foot ulceration: intervention 8/21 vs control 8/14 (P = 0.317) Patient with a history of foot ulceration: intervention 1/8 vs control 5/8 (P = 0.119) All people: difference between the survival curves of intervention and control (P = 0.362) (HR not reported) | No secondary outcomes reported | |
| No primary outcomes reported | Foot care knowledge scores: Foot care practice scores: | |
| No primary outcomes reported | Foot care knowledge scores: Patients' behaviour assessment: | |
| No primary outcomes reported | Foot status: Foot care knowledge scores: Behaviour assessment: | |
| Ulcer incidence: Amputation rate: | Behaviour assessment scores: | |
| Ulcer incidence: Amputation rate: | No secondary outcomes reported | |
| No primary outcomes reported | Foot care knowledge scores: | |
| No primary outcomes reported | Foot appearance scores (mean ±standard error): Foot care knowledge scores: Foot care skills scores: | |
| Amputation: 7‐year follow‐up: intervention 1 vs control 0 Foot ulceration: 7‐year follow‐up: intervention 1 vs control 1 | Callus development: Calcaneal region:
Other regions:
7‐year follow‐up: Calcaneal region:
Other regions:
Foot care knowledge scores:
7‐year follow‐up:
Patients' behaviour assessment scores:
7‐year follow‐up:
| |
| Abbreviations: CI = confidence interval, ns = no statistical significance, RA = group that received risk assessment only, RR = risk ratio, SD = standard deviation. | ||
| Outcome or subgroup title | No. of studies | No. of participants | Statistical method | Effect size |
| 1 Foot ulcer incidence (1‐year follow‐up) Show forest plot | 1 | 354 | Risk Ratio (M‐H, Fixed, 95% CI) | 0.31 [0.14, 0.66] |
| 2 Amputation Rate (1‐year follow‐up) Show forest plot | 1 | 354 | Risk Ratio (M‐H, Fixed, 95% CI) | 0.33 [0.15, 0.76] |
| 3 Foot ulcer incidence (1‐year follow‐up) Show forest plot | 1 | 172 | Risk Ratio (M‐H, Random, 95% CI) | 1.00 [0.70, 1.44] |
| 4 Amputation rate (1‐year follow‐up) Show forest plot | 1 | 172 | Risk Ratio (M‐H, Random, 95% CI) | 0.98 [0.41, 2.34] |