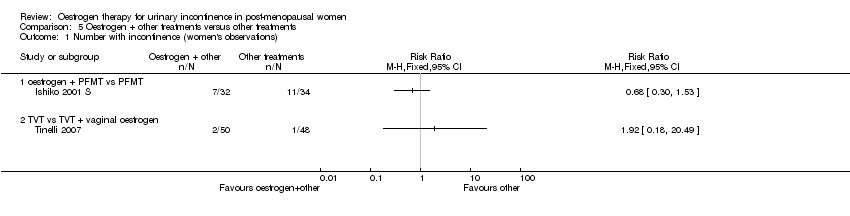
| 1 Number with incontinence (women's observations) Show forest plot | 6 | 341 | Risk Ratio (M‐H, Fixed, 95% CI) | 0.79 [0.70, 0.90] |
|
| 1.1 Systemic administration | 4 | 197 | Risk Ratio (M‐H, Fixed, 95% CI) | 0.83 [0.70, 0.98] |
| 1.2 Local administration | 2 | 144 | Risk Ratio (M‐H, Fixed, 95% CI) | 0.73 [0.62, 0.87] |
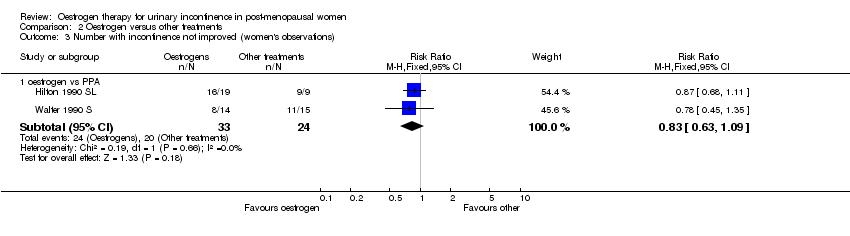
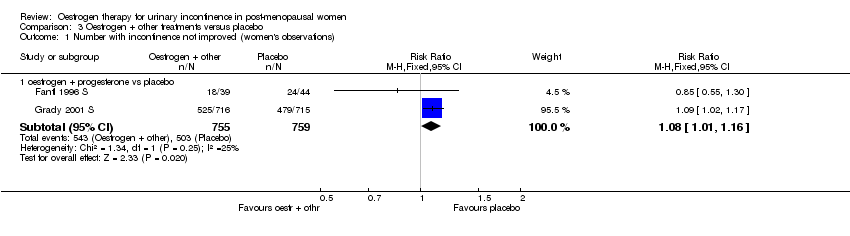
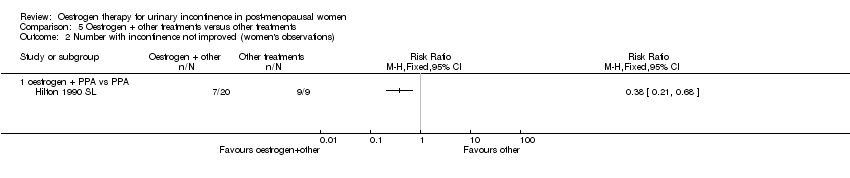
| 2 Number with incontinence not improved (women's observations) Show forest plot | 9 | 444 | Risk Ratio (M‐H, Fixed, 95% CI) | 0.62 [0.53, 0.72] |
|
| 2.1 Systemic administration | 5 | 231 | Risk Ratio (M‐H, Fixed, 95% CI) | 0.74 [0.58, 0.93] |
| 2.2 Local administration | 4 | 213 | Risk Ratio (M‐H, Fixed, 95% CI) | 0.53 [0.43, 0.65] |
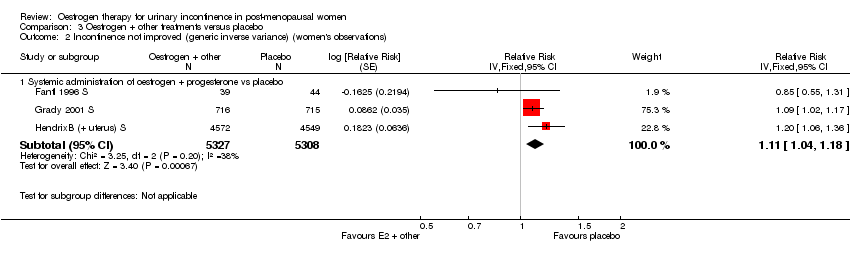
| 3 Incontinence not improved (generic inverse variance) (women's observations) Show forest plot | 10 | | RR (Fixed, 95% CI) | Subtotals only |
|
| 3.1 Systemic administration (any incontinence) | 6 | 6151 | RR (Fixed, 95% CI) | 1.32 [1.17, 1.48] |
| 3.2 Local administration (any incontinence) | 4 | 213 | RR (Fixed, 95% CI) | 0.74 [0.64, 0.86] |
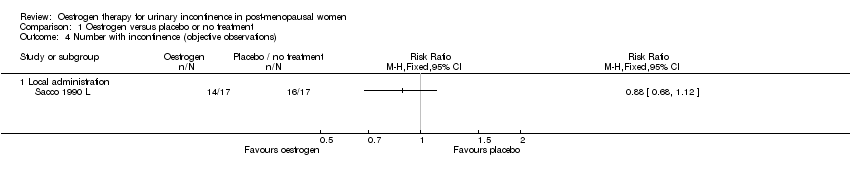
| 4 Number with incontinence (objective observations) Show forest plot | 1 | | Risk Ratio (M‐H, Fixed, 95% CI) | Totals not selected |
|
| 4.1 Local administration | 1 | | Risk Ratio (M‐H, Fixed, 95% CI) | 0.0 [0.0, 0.0] |
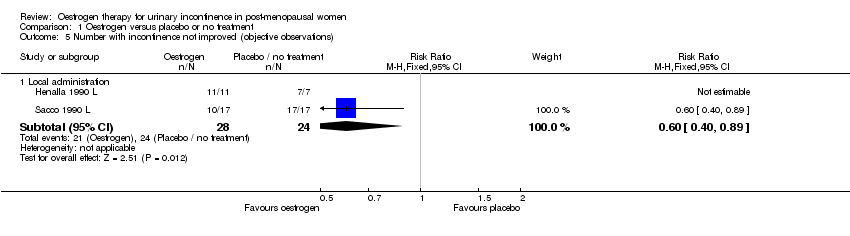
| 5 Number with incontinence not improved (objective observations) Show forest plot | 2 | | Risk Ratio (M‐H, Fixed, 95% CI) | Subtotals only |
|
| 5.1 Local administration | 2 | 52 | Risk Ratio (M‐H, Fixed, 95% CI) | 0.6 [0.40, 0.89] |
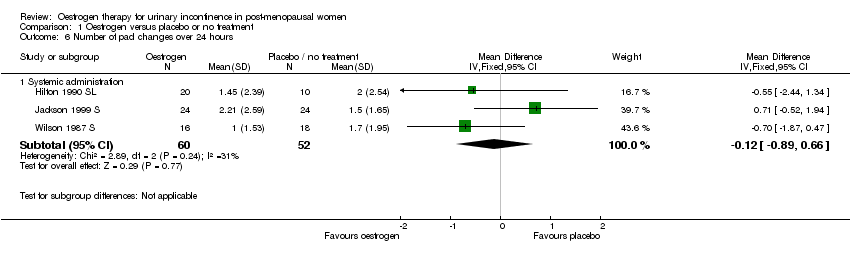
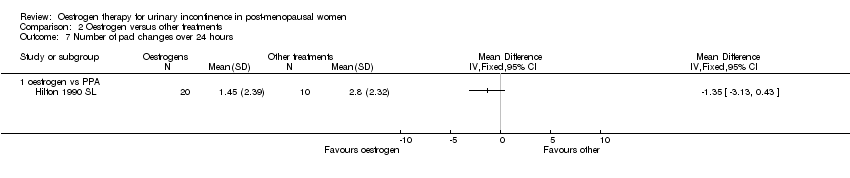
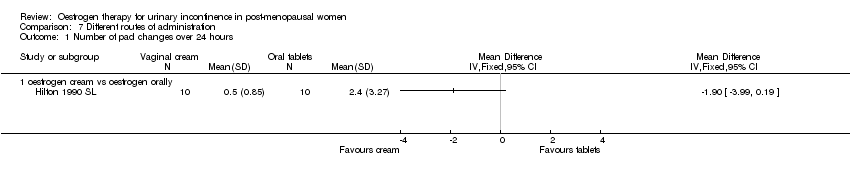
| 6 Number of pad changes over 24 hours Show forest plot | 3 | | Mean Difference (IV, Fixed, 95% CI) | Subtotals only |
|
| 6.1 Systemic administration | 3 | 112 | Mean Difference (IV, Fixed, 95% CI) | ‐0.12 [‐0.89, 0.66] |
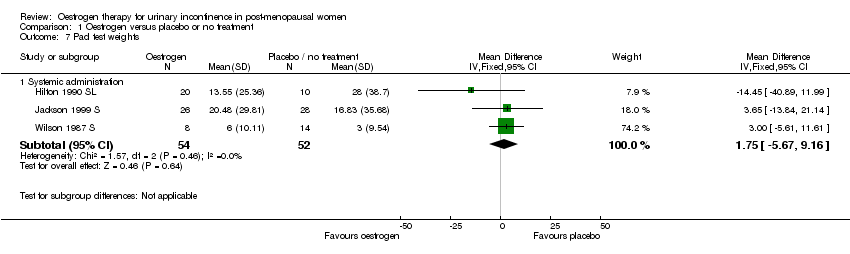
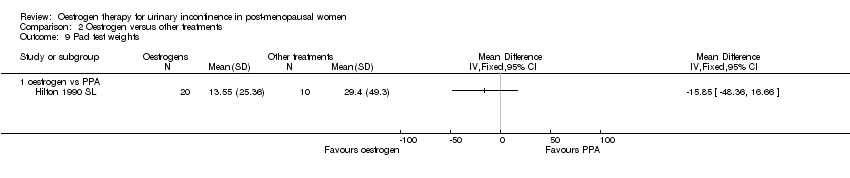
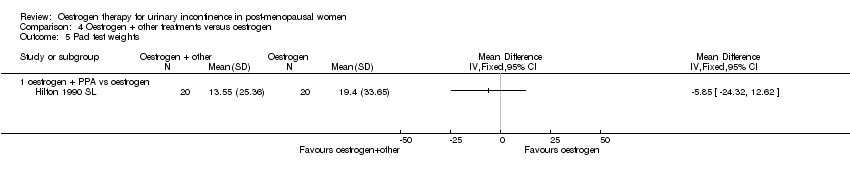
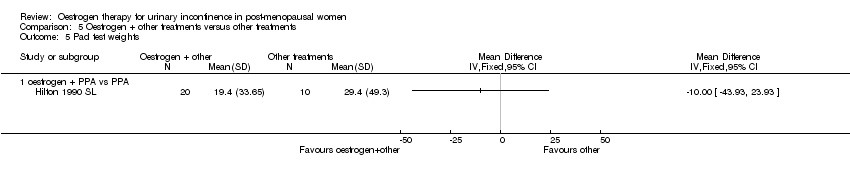
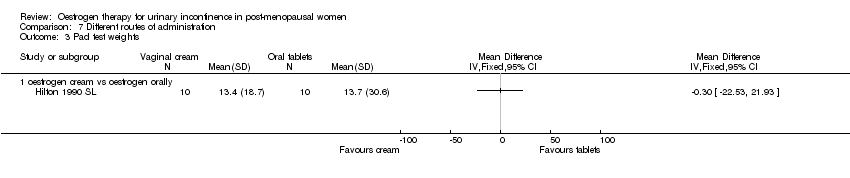
| 7 Pad test weights Show forest plot | 3 | | Mean Difference (IV, Fixed, 95% CI) | Subtotals only |
|
| 7.1 Systemic administration | 3 | 106 | Mean Difference (IV, Fixed, 95% CI) | 1.75 [‐5.67, 9.16] |
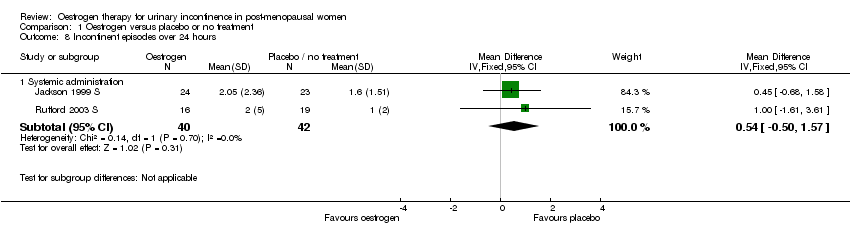
| 8 Incontinent episodes over 24 hours Show forest plot | 2 | | Mean Difference (IV, Fixed, 95% CI) | Subtotals only |
|
| 8.1 Systemic administration | 2 | 82 | Mean Difference (IV, Fixed, 95% CI) | 0.54 [‐0.50, 1.57] |
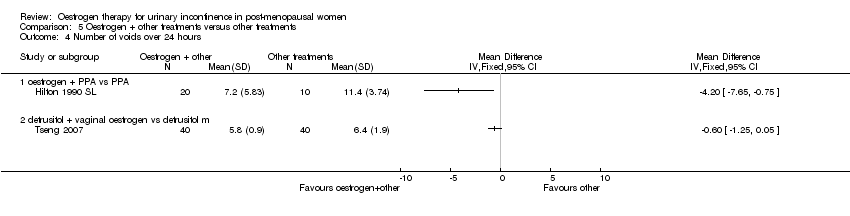
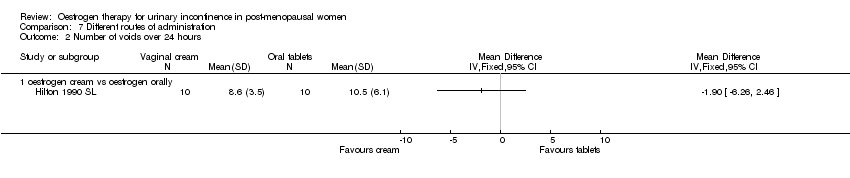
| 9 Number of voids over 24 hours Show forest plot | 7 | 237 | Mean Difference (IV, Fixed, 95% CI) | ‐1.20 [‐1.81, ‐0.60] |
|
| 9.1 Systemic administration | 3 | 125 | Mean Difference (IV, Fixed, 95% CI) | ‐0.25 [‐1.22, 0.73] |
| 9.2 Local administration | 4 | 112 | Mean Difference (IV, Fixed, 95% CI) | ‐1.80 [‐2.58, ‐1.03] |
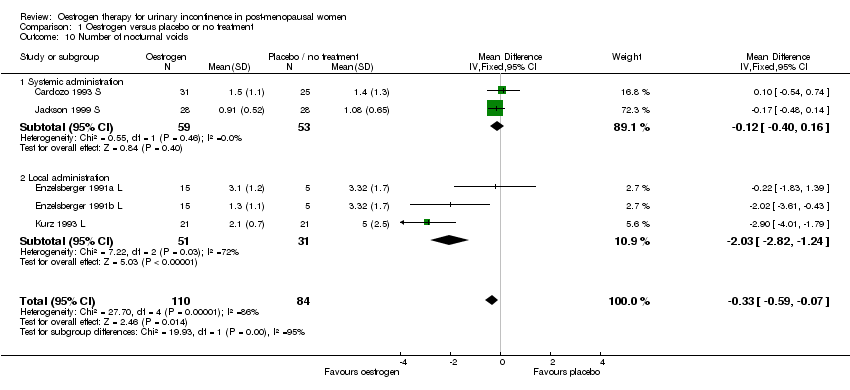
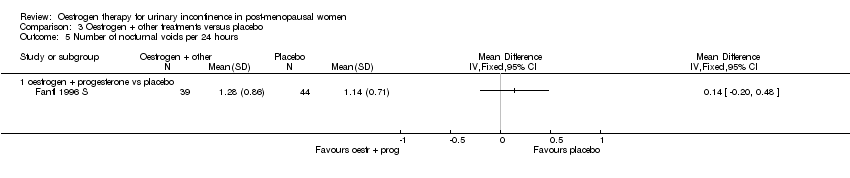
| 10 Number of nocturnal voids Show forest plot | 5 | 194 | Mean Difference (IV, Fixed, 95% CI) | ‐0.33 [‐0.59, ‐0.07] |
|
| 10.1 Systemic administration | 2 | 112 | Mean Difference (IV, Fixed, 95% CI) | ‐0.12 [‐0.40, 0.16] |
| 10.2 Local administration | 3 | 82 | Mean Difference (IV, Fixed, 95% CI) | ‐2.03 [‐2.82, ‐1.24] |
| 11 Number of women with frequency Show forest plot | 3 | 136 | Risk Ratio (M‐H, Fixed, 95% CI) | 0.88 [0.59, 1.33] |
|
| 11.1 Systemic administration | 1 | 46 | Risk Ratio (M‐H, Fixed, 95% CI) | 1.40 [0.89, 2.19] |
| 11.2 Local administration | 2 | 90 | Risk Ratio (M‐H, Fixed, 95% CI) | 0.43 [0.19, 0.98] |
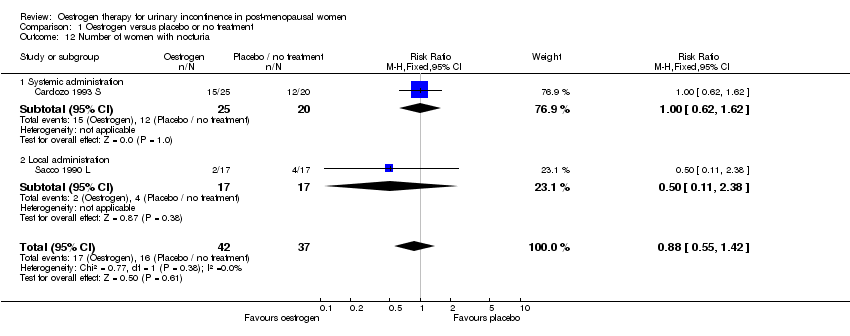
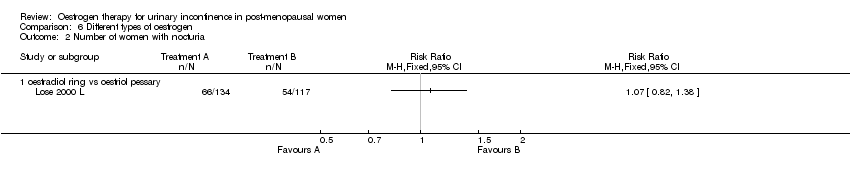
| 12 Number of women with nocturia Show forest plot | 2 | 79 | Risk Ratio (M‐H, Fixed, 95% CI) | 0.88 [0.55, 1.42] |
|
| 12.1 Systemic administration | 1 | 45 | Risk Ratio (M‐H, Fixed, 95% CI) | 1.0 [0.62, 1.62] |
| 12.2 Local administration | 1 | 34 | Risk Ratio (M‐H, Fixed, 95% CI) | 0.5 [0.11, 2.38] |
| 13 Number of women with urgency Show forest plot | 4 | 179 | Risk Ratio (M‐H, Fixed, 95% CI) | 0.86 [0.67, 1.12] |
|
| 13.1 Systemic administration | 2 | 89 | Risk Ratio (M‐H, Fixed, 95% CI) | 1.05 [0.83, 1.33] |
| 13.2 Local administration | 2 | 90 | Risk Ratio (M‐H, Fixed, 95% CI) | 0.38 [0.15, 0.99] |
| 14 Maximum urethral closure pressure (MUCP) Show forest plot | 7 | 291 | Mean Difference (IV, Fixed, 95% CI) | 3.61 [1.87, 5.35] |
|
| 14.1 Systemic administration | 2 | 89 | Mean Difference (IV, Fixed, 95% CI) | ‐1.41 [‐6.24, 3.43] |
| 14.2 Local administration | 5 | 202 | Mean Difference (IV, Fixed, 95% CI) | 4.35 [2.49, 6.22] |
| 15 Volume at first urge to void Show forest plot | 7 | 269 | Mean Difference (IV, Fixed, 95% CI) | 18.80 [13.01, 24.60] |
|
| 15.1 Systemic administration | 3 | 153 | Mean Difference (IV, Fixed, 95% CI) | 9.09 [‐25.45, 43.62] |
| 15.2 Local administration | 4 | 116 | Mean Difference (IV, Fixed, 95% CI) | 19.09 [13.21, 24.96] |
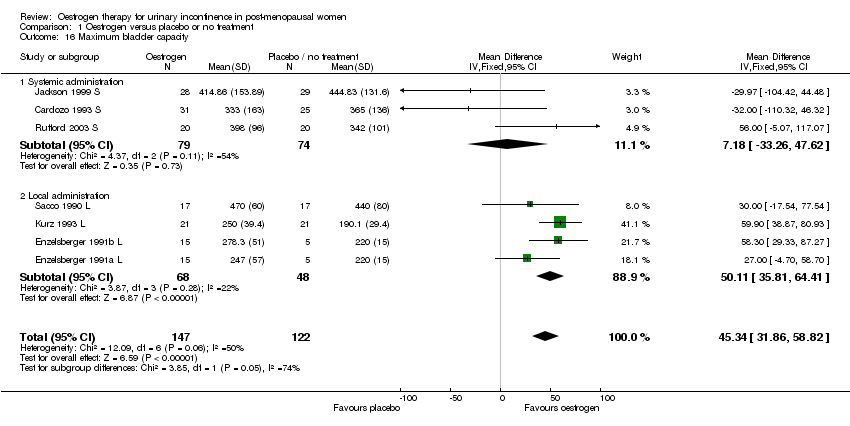
| 16 Maximum bladder capacity Show forest plot | 7 | 269 | Mean Difference (IV, Fixed, 95% CI) | 45.34 [31.86, 58.82] |
|
| 16.1 Systemic administration | 3 | 153 | Mean Difference (IV, Fixed, 95% CI) | 7.18 [‐33.26, 47.62] |
| 16.2 Local administration | 4 | 116 | Mean Difference (IV, Fixed, 95% CI) | 50.11 [35.81, 64.41] |
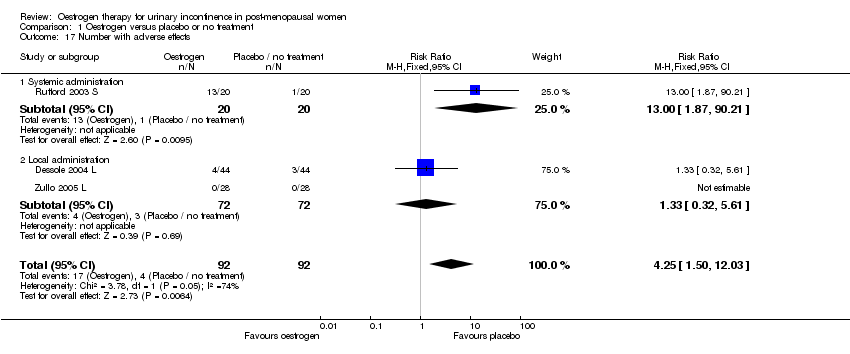
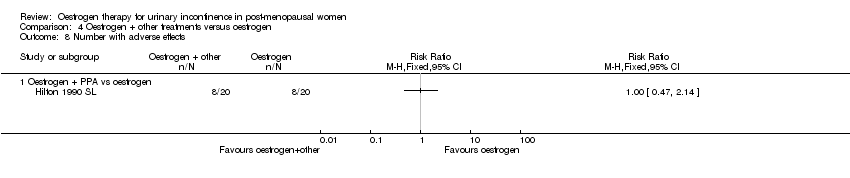
| 17 Number with adverse effects Show forest plot | 3 | 184 | Risk Ratio (M‐H, Fixed, 95% CI) | 4.25 [1.50, 12.03] |
|
| 17.1 Systemic administration | 1 | 40 | Risk Ratio (M‐H, Fixed, 95% CI) | 13.0 [1.87, 90.21] |
| 17.2 Local administration | 2 | 144 | Risk Ratio (M‐H, Fixed, 95% CI) | 1.33 [0.32, 5.61] |
| 18 Number with bacteriuria Show forest plot | 2 | 128 | Risk Ratio (M‐H, Fixed, 95% CI) | 0.45 [0.27, 0.76] |
|
| 18.1 Systemic administration | 1 | 40 | Risk Ratio (M‐H, Fixed, 95% CI) | 0.73 [0.37, 1.42] |
| 18.2 Local administration | 1 | 88 | Risk Ratio (M‐H, Fixed, 95% CI) | 0.3 [0.13, 0.68] |