Bisfosfonatos para la osteoporosis inducida por corticosteroides
Información
- DOI:
- https://doi.org/10.1002/14651858.CD001347.pub2Copiar DOI

- Base de datos:
-
- Cochrane Database of Systematic Reviews
- Versión publicada:
-
- 05 octubre 2016see what's new
- Tipo:
-
- Intervention
- Etapa:
-
- Review
- Grupo Editorial Cochrane:
-
Grupo Cochrane de Salud musculoesquelética
- Copyright:
-
- Copyright © 2016 The Cochrane Collaboration. Published by John Wiley & Sons, Ltd.
Cifras del artículo
Altmetric:
Citado por:
Autores
Contributions of authors
JH and CA wrote the review; JH, JY and CA screened initial search results and identified studies that fulfilled inclusion criteria; JH, CA and BV were involved in data extraction and management; JH, JY and CA performed ‘risk of bias’ assessment; JH and CA performed GRADE evaluation. All authors reviewed and approved the final draft prior to submission.
Sources of support
Internal sources
-
University of Alberta, Edmonton, Canada.
-
University of Ottawa, Ontario, Canada.
External sources
-
No sources of support supplied
Declarations of interest
Claire S Allen: none known
James HS Yeung: none known
Ben Vandermeer: none known
Joanne Homik: none known
Acknowledgements
The authors would like to thank the members of Cochrane Musculoskeletal for their guidance; Trish Chatterley and Marlene Dorgan, University of Alberta Health Sciences Librarians, for their assistance with literature searches. We also wish to acknowledge the work of Ann Cranney, Beverley Shea, Peter Tugwell, George Wells, Jonathan Adachi and Maria Suarez‐Almazor as authors of the original review.
Version history
| Published | Title | Stage | Authors | Version |
| 2016 Oct 05 | Bisphosphonates for steroid‐induced osteoporosis | Review | Claire S Allen, James HS Yeung, Ben Vandermeer, Joanne Homik | |
| 1999 Jan 25 | Bisphosphonates for steroid induced osteoporosis | Review | Joanne Homik, Ann Cranney, Beverley Shea, Peter Tugwell, George A Wells, Jonathan Adachi, Maria E Suarez‐Almazor | |
Differences between protocol and review
We have updated the methods in the review since the original review in accordance with current Cochrane and Cochrane Musculoskeletal recommendations. Due to the increased number of high‐quality studies that have been published since the original review, we have made our selection criteria more rigorous to include only RCTs that measured BMD by DEXA (and not quantitative CT). We have added four more outcomes: number of participants with new radiographic non‐vertebral fractures; quality of life; serious adverse events; and direct comparison of lumbar spine and femoral neck BMD change using low‐dose versus standard‐dose bisphosphonates.
We have changed the minimum steroid dose of 7.5 mg/day from the original review to include a minimum of 5 mg/day to reflect current literature on the effect of low‐dose steroids.
We have altered our time points for BMD analysis to reflect clinical relevance. Specifically, we have removed the six‐month time point and changed our two‐year time point to include data between 18 to 24 months.
In the original review, sensitivity analyses were performed for methodological quality, BMD technique and study duration. The sensitivity analyses in our updated review were performed to evaluate the effect of risk of bias in included studies, based on the exclusion of non‐blinded studies, and route of administration (oral and parenteral). This change reflects differences in the certainty of evidence and advances in therapy since the original review.
Keywords
MeSH
Medical Subject Headings (MeSH) Keywords
Medical Subject Headings Check Words
Adult; Humans;
PICO

Study flow diagram.

Risk of bias graph: review authors' judgements about each risk of bias item presented as percentages across all included studies.

Risk of bias summary: review authors' judgements about each risk of bias item for each included study.

Comparison 1 Bisphosphonates vs control: benefits ‐ fractures, Outcome 1 Incident radiographic vertebral fractures 12‐24 months.

Comparison 1 Bisphosphonates vs control: benefits ‐ fractures, Outcome 2 Incident radiographic nonvertebral fractures 12‐24 months.

Comparison 2 Bisphosphonates vs control: benefits ‐ bone mineral density (BMD) at lumbar spine (LS), Outcome 1 LS BMD change 12 months: all trials.

Comparison 2 Bisphosphonates vs control: benefits ‐ bone mineral density (BMD) at lumbar spine (LS), Outcome 2 LS BMD change 12 months: oral treatment.
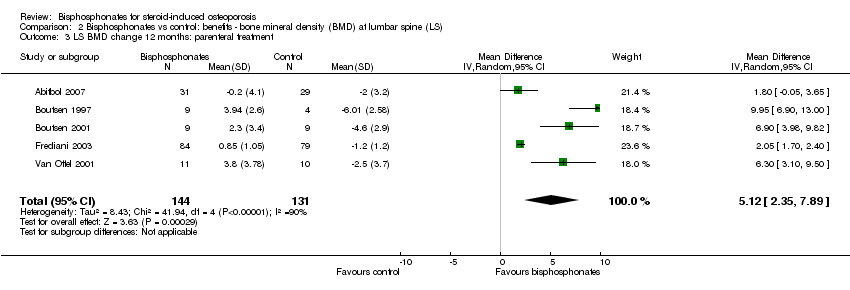
Comparison 2 Bisphosphonates vs control: benefits ‐ bone mineral density (BMD) at lumbar spine (LS), Outcome 3 LS BMD change 12 months: parenteral treatment.

Comparison 2 Bisphosphonates vs control: benefits ‐ bone mineral density (BMD) at lumbar spine (LS), Outcome 4 LS BMD change 12 months: low‐ vs standard‐dose.
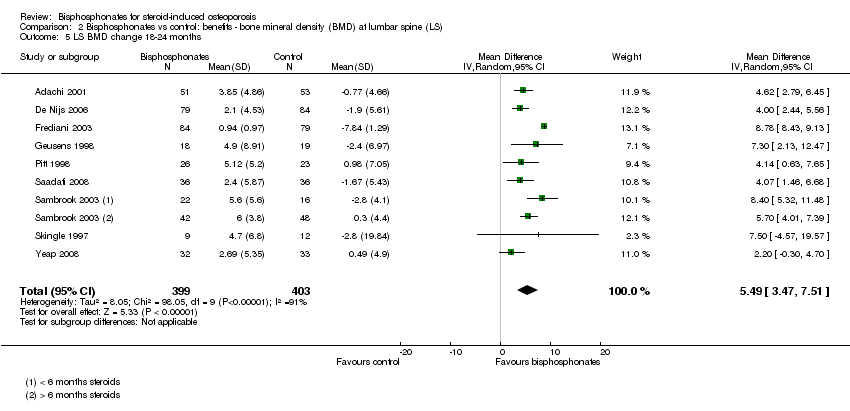
Comparison 2 Bisphosphonates vs control: benefits ‐ bone mineral density (BMD) at lumbar spine (LS), Outcome 5 LS BMD change 18‐24 months.
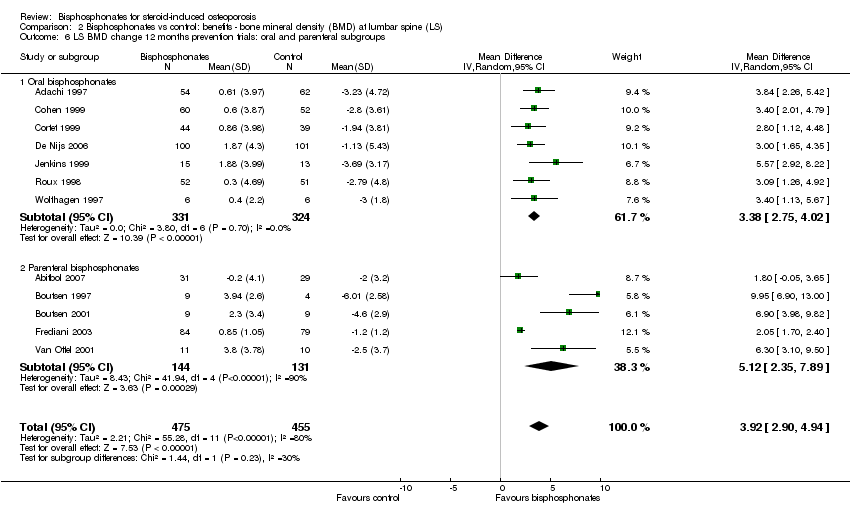
Comparison 2 Bisphosphonates vs control: benefits ‐ bone mineral density (BMD) at lumbar spine (LS), Outcome 6 LS BMD change 12 months prevention trials: oral and parenteral subgroups.

Comparison 2 Bisphosphonates vs control: benefits ‐ bone mineral density (BMD) at lumbar spine (LS), Outcome 7 LS BMD change 12 months: gender/menopausal status subgroups.
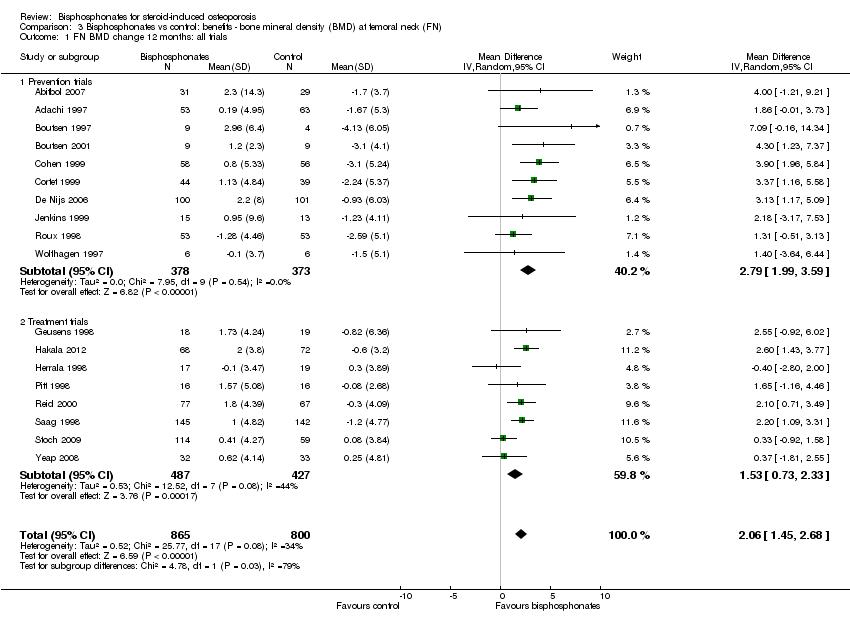
Comparison 3 Bisphosphonates vs control: benefits ‐ bone mineral density (BMD) at femoral neck (FN), Outcome 1 FN BMD change 12 months: all trials.
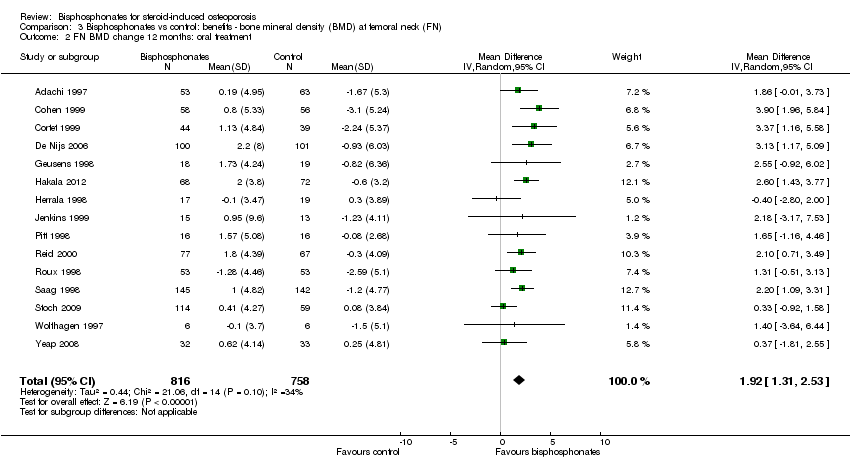
Comparison 3 Bisphosphonates vs control: benefits ‐ bone mineral density (BMD) at femoral neck (FN), Outcome 2 FN BMD change 12 months: oral treatment.

Comparison 3 Bisphosphonates vs control: benefits ‐ bone mineral density (BMD) at femoral neck (FN), Outcome 3 FN BMD change 12 months: parenteral treatment.
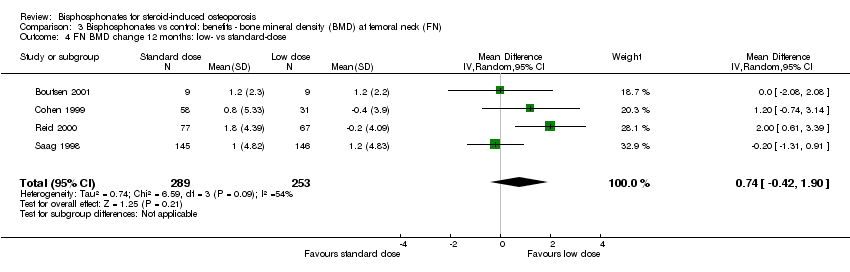
Comparison 3 Bisphosphonates vs control: benefits ‐ bone mineral density (BMD) at femoral neck (FN), Outcome 4 FN BMD change 12 months: low‐ vs standard‐dose.

Comparison 3 Bisphosphonates vs control: benefits ‐ bone mineral density (BMD) at femoral neck (FN), Outcome 5 FN BMD change 18‐24 months.

Comparison 3 Bisphosphonates vs control: benefits ‐ bone mineral density (BMD) at femoral neck (FN), Outcome 6 FN BMD change 12 months: gender/menopausal status subgroups.

Comparison 4 Bisphosphonates vs control: harms, Outcome 1 Serious adverse events 12‐24 months.
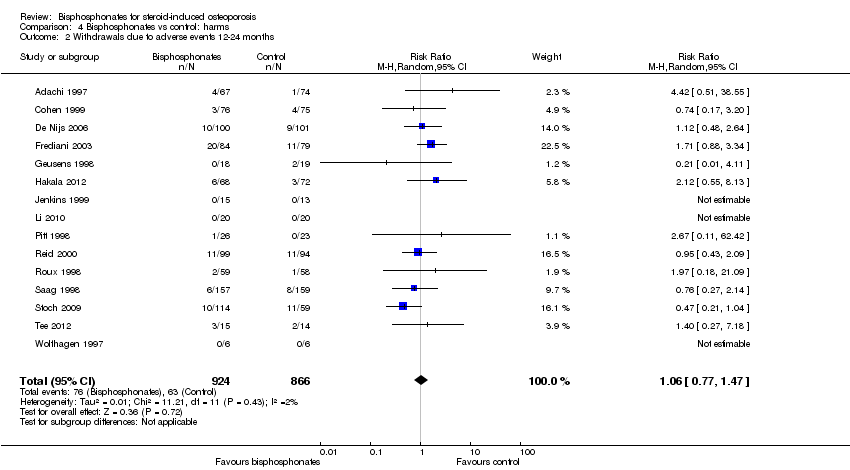
Comparison 4 Bisphosphonates vs control: harms, Outcome 2 Withdrawals due to adverse events 12‐24 months.
| Bisphosphonates (alone or with calcium and/or vitamin D) compared with control (calcium and/or vitamin D and/or placebo) for adults with GIOP | ||||||
| Patient or population: adults with GIOP Settings: ambulatory Intervention: bisphosphonates (alone or with calcium and/or vitamin D) Comparison: control (calcium and/or vitamin D and/or placebo) | ||||||
| Outcomes | Illustrative comparative risks* (95% CI) | Relative effect | No of Participants | Quality of the evidence | Comments | |
| Assumed risk | Corresponding risk | |||||
| Control (calcium and/or vitamin D and/or placebo) | Bisphosphonates (alone or with calcium and/or vitamin D) | |||||
| Incident vertebral fractures Radiographic follow‐up: 12‐24 months | 77 per 1000 | 44 per 1000 | RR 0.57 (0.35 to 0.91) RD ‐0.02 (‐0.05 to 0.01) | 1343 | ⊕⊕⊕⊕ | Absolute increased benefit 2% fewer people with fractures using bisphosphonates (95% CI 5.00% fewer to 1.00% more) Relative per cent change 43% improvement with bisphosphonates (95% CI 9.00% to 65.00% better) NNTB = 31 (95% CI 20 to 145) |
| Incident nonvertebral fractures Radiographic follow‐up: 12‐24 months | 55 per 1000 | 42 per 1000 | RR 0.79 (0.47 to 1.33) RD ‐0.01 (‐0.04 to 0.01) | 1245 | ⊕⊕⊝⊝ due to risk of bias and imprecision | Absolute increased benefit 1% fewer people with fractures using bisphosphonates (95% CI 4.00% fewer to 1.00% more) Relative per cent change 21% improvement with bisphosphonates (95% CI 33.00% worse to 53.00% better) NNTB = n/a4 |
| Lumbar spine BMD DEXA follow‐up: 12 months | Mean per cent change in BMD across control groups was ‐3.19% (‐8.08% to 1.70%) from baseline5 | Mean per cent change in BMD from baseline in bisphosphonate groups was 3.50% higher than control groups (2.90% to 4.10% higher) | ‐ | 2042 | ⊕⊕⊕⊝ due to indirectness | Absolute increased benefit 3.50% with bisphosphonates (95% CI 2.90 to 4.10) Relative per cent change 1.10% (95% CI 0.91 to 1.29) with bisphosphonates NNTB = 3 (95% CI 2 to 3) |
| Femoral neck BMD DEXA follow‐up: 12 months | Mean per cent change in BMD across control groups was ‐1.59% (‐10.49% to 7.31%) from baseline 5 | Mean per cent change in BMD from baseline in bisphosphonate groups was 2.06% higher than control groups (1.45% to 2.68% higher) | ‐ | 1665 | ⊕⊕⊕⊝ due to indirectness | Absolute increased benefit 2.06% with bisphosphonates (95% CI 1.45 to 2.68) Relative per cent change 1.29% with bisphosphonates (95% CI 0.91 to 1.69) NNTB = 5 (95% CI 4 to 7) |
| Serious adverse events follow‐up: 12‐24 months | 162 per 1000 | 147 per 1000 | RR 0.91 (0.74 to 1.12) RD 0.00 (‐0.02, 0.02) | 1703 | ⊕⊕⊕⊝ due to risk of bias and imprecision | Absolute increased harm 0% more adverse events with bisphosphonates (95% CI 2.00% fewer to 2.00% more) Relative per cent change 9% improvement with bisphosphonates (95% CI 12.00% worse to 26.00% better) NNTH = n/a4 |
| Withdrawals due to adverse events follow‐up: 12‐24 months | 73 per 1000 | 77 per 1000 | RR 1.06 (0.77 to 1.47) RD 0.01 (‐0.01 to 0.03) | 1790 | ⊕⊕⊕⊝ due to risk of bias and imprecision | Absolute increased harm 1% more withdrawals with bisphosphonates (95% CI 1.00% fewer to 3.00% more) Relative per cent change 6% worsening with bisphosphonates (95% CI 47.00% worse to 23.00% better) NNTH = n/a4 |
| Quality of life | 0 per 1000 | 0 per 1000 | Not estimable | (0 studies) | This outcome was not assessed by any of the trials | |
| *The basis for the assumed risk (e.g. the median control group risk across studies) is provided in footnotes. The corresponding risk (and its 95% confidence interval) is based on the assumed risk in the comparison group and the relative effect of the intervention (and its 95% CI). | ||||||
| GRADE Working Group grades of evidence | ||||||
| 1Vertebral fractures meet calculated OIS threshold of 1174 (calculation not shown ‐ Brant 2014) 2Downgraded for risk of bias: nonvertebral fractures were a patient‐reported, subjective outcome 3Downgraded for imprecision: total sample size is below calculated optimal information size (OIS) (calculations not shown ‐ Brant 2014) and the 95% confidence interval around the pooled estimate of effect includes both the possibility of no effect and appreciable benefit or harm 4Number needed to treat for an additional beneficial outcome (NNTB) or number needed to treat for an additional harmful outcome (NNTH) is not applicable when result is not statistically significant 5We calculated mean baseline risk for the control group in RevMan using generic inverse variance (calculations not shown) 6Most heterogeneity explained through sensitivity analyses 7Downgraded for indirectness: bone density is a surrogate marker for fracture risk 8Clinically relevant change in BMD: the natural history of participants starting steroid therapy based on control arms in our prevention trials is to see a 1%‐6% decrease in lumbar spine BMD and 1%‐4% decrease in femoral neck BMD in the first year of treatment. We have used an SMD of 0.5 as an estimate of the minimal clinically important difference for BMD change to calculate the NNTB (Schünemann 2011b) 9Downgraded for risk of bias: the protocols for the collection of harm data in a large number of trials were unclear | ||||||
| Outcome or subgroup title | No. of studies | No. of participants | Statistical method | Effect size |
| 1 Incident radiographic vertebral fractures 12‐24 months Show forest plot | 12 | 1343 | Risk Ratio (M‐H, Random, 95% CI) | 0.57 [0.35, 0.91] |
| 2 Incident radiographic nonvertebral fractures 12‐24 months Show forest plot | 9 | 1245 | Risk Ratio (M‐H, Random, 95% CI) | 0.79 [0.47, 1.33] |
| Outcome or subgroup title | No. of studies | No. of participants | Statistical method | Effect size |
| 1 LS BMD change 12 months: all trials Show forest plot | 23 | 2042 | Mean Difference (IV, Random, 95% CI) | 3.50 [2.90, 4.10] |
| 1.1 Prevention trials | 12 | 930 | Mean Difference (IV, Random, 95% CI) | 3.92 [2.90, 4.94] |
| 1.2 Treatment trials | 11 | 1112 | Mean Difference (IV, Random, 95% CI) | 3.19 [2.64, 3.73] |
| 2 LS BMD change 12 months: oral treatment Show forest plot | 18 | 1767 | Mean Difference (IV, Random, 95% CI) | 3.25 [2.88, 3.63] |
| 3 LS BMD change 12 months: parenteral treatment Show forest plot | 5 | 275 | Mean Difference (IV, Random, 95% CI) | 5.12 [2.35, 7.89] |
| 4 LS BMD change 12 months: low‐ vs standard‐dose Show forest plot | 5 | 642 | Mean Difference (IV, Random, 95% CI) | 0.95 [0.37, 1.53] |
| 5 LS BMD change 18‐24 months Show forest plot | 9 | 802 | Mean Difference (IV, Random, 95% CI) | 5.49 [3.47, 7.51] |
| 6 LS BMD change 12 months prevention trials: oral and parenteral subgroups Show forest plot | 12 | 930 | Mean Difference (IV, Random, 95% CI) | 3.92 [2.90, 4.94] |
| 6.1 Oral bisphosphonates | 7 | 655 | Mean Difference (IV, Random, 95% CI) | 3.38 [2.75, 4.02] |
| 6.2 Parenteral bisphosphonates | 5 | 275 | Mean Difference (IV, Random, 95% CI) | 5.12 [2.35, 7.89] |
| 7 LS BMD change 12 months: gender/menopausal status subgroups Show forest plot | 5 | 840 | Mean Difference (IV, Random, 95% CI) | 3.86 [2.03, 5.68] |
| 7.1 Men | 4 | 221 | Mean Difference (IV, Random, 95% CI) | 3.58 [2.68, 4.48] |
| 7.2 Premenopausal women | 5 | 154 | Mean Difference (IV, Random, 95% CI) | 3.51 [1.50, 5.53] |
| 7.3 Postmenopausal women | 5 | 465 | Mean Difference (IV, Random, 95% CI) | 4.41 [0.65, 8.18] |
| Outcome or subgroup title | No. of studies | No. of participants | Statistical method | Effect size |
| 1 FN BMD change 12 months: all trials Show forest plot | 18 | 1665 | Mean Difference (IV, Random, 95% CI) | 2.06 [1.45, 2.68] |
| 1.1 Prevention trials | 10 | 751 | Mean Difference (IV, Random, 95% CI) | 2.79 [1.99, 3.59] |
| 1.2 Treatment trials | 8 | 914 | Mean Difference (IV, Random, 95% CI) | 1.53 [0.73, 2.33] |
| 2 FN BMD change 12 months: oral treatment Show forest plot | 15 | 1574 | Mean Difference (IV, Random, 95% CI) | 1.92 [1.31, 2.53] |
| 3 FN BMD change 12 months: parenteral treatment Show forest plot | 3 | 91 | Mean Difference (IV, Random, 95% CI) | 4.56 [2.07, 7.05] |
| 4 FN BMD change 12 months: low‐ vs standard‐dose Show forest plot | 4 | 542 | Mean Difference (IV, Random, 95% CI) | 0.74 [‐0.42, 1.90] |
| 5 FN BMD change 18‐24 months Show forest plot | 9 | 802 | Mean Difference (IV, Random, 95% CI) | 3.28 [1.70, 4.87] |
| 6 FN BMD change 12 months: gender/menopausal status subgroups Show forest plot | 4 | 537 | Mean Difference (IV, Random, 95% CI) | 3.29 [1.65, 4.94] |
| 6.1 Men | 3 | 134 | Mean Difference (IV, Random, 95% CI) | 2.91 [1.15, 4.68] |
| 6.2 Premenopausal women | 4 | 88 | Mean Difference (IV, Random, 95% CI) | 2.70 [‐0.96, 6.35] |
| 6.3 Postmenopausal women | 4 | 315 | Mean Difference (IV, Random, 95% CI) | 3.62 [‐0.37, 7.61] |
| Outcome or subgroup title | No. of studies | No. of participants | Statistical method | Effect size |
| 1 Serious adverse events 12‐24 months Show forest plot | 15 | 1703 | Risk Ratio (M‐H, Random, 95% CI) | 0.91 [0.74, 1.12] |
| 2 Withdrawals due to adverse events 12‐24 months Show forest plot | 15 | 1790 | Risk Ratio (M‐H, Random, 95% CI) | 1.06 [0.77, 1.47] |