Scolaris Content Display Scolaris Content Display

Study flow diagram.
Figuras y tablas -
Figure 1

Study flow diagram.

Risk of bias graph: review authors' judgements about each risk of bias item presented as percentages across all included studies.
Figuras y tablas -
Figure 2

Risk of bias graph: review authors' judgements about each risk of bias item presented as percentages across all included studies.

Risk of bias summary: review authors' judgements about each risk of bias item for each included study.
Figuras y tablas -
Figure 3

Risk of bias summary: review authors' judgements about each risk of bias item for each included study.

Comparison 1 Bisphosphonates vs control: benefits ‐ fractures, Outcome 1 Incident radiographic vertebral fractures 12‐24 months.
Figuras y tablas -
Analysis 1.1

Comparison 1 Bisphosphonates vs control: benefits ‐ fractures, Outcome 1 Incident radiographic vertebral fractures 12‐24 months.

Comparison 1 Bisphosphonates vs control: benefits ‐ fractures, Outcome 2 Incident radiographic nonvertebral fractures 12‐24 months.
Figuras y tablas -
Analysis 1.2

Comparison 1 Bisphosphonates vs control: benefits ‐ fractures, Outcome 2 Incident radiographic nonvertebral fractures 12‐24 months.

Comparison 2 Bisphosphonates vs control: benefits ‐ bone mineral density (BMD) at lumbar spine (LS), Outcome 1 LS BMD change 12 months: all trials.
Figuras y tablas -
Analysis 2.1

Comparison 2 Bisphosphonates vs control: benefits ‐ bone mineral density (BMD) at lumbar spine (LS), Outcome 1 LS BMD change 12 months: all trials.

Comparison 2 Bisphosphonates vs control: benefits ‐ bone mineral density (BMD) at lumbar spine (LS), Outcome 2 LS BMD change 12 months: oral treatment.
Figuras y tablas -
Analysis 2.2

Comparison 2 Bisphosphonates vs control: benefits ‐ bone mineral density (BMD) at lumbar spine (LS), Outcome 2 LS BMD change 12 months: oral treatment.

Comparison 2 Bisphosphonates vs control: benefits ‐ bone mineral density (BMD) at lumbar spine (LS), Outcome 3 LS BMD change 12 months: parenteral treatment.
Figuras y tablas -
Analysis 2.3

Comparison 2 Bisphosphonates vs control: benefits ‐ bone mineral density (BMD) at lumbar spine (LS), Outcome 3 LS BMD change 12 months: parenteral treatment.

Comparison 2 Bisphosphonates vs control: benefits ‐ bone mineral density (BMD) at lumbar spine (LS), Outcome 4 LS BMD change 12 months: low‐ vs standard‐dose.
Figuras y tablas -
Analysis 2.4

Comparison 2 Bisphosphonates vs control: benefits ‐ bone mineral density (BMD) at lumbar spine (LS), Outcome 4 LS BMD change 12 months: low‐ vs standard‐dose.

Comparison 2 Bisphosphonates vs control: benefits ‐ bone mineral density (BMD) at lumbar spine (LS), Outcome 5 LS BMD change 18‐24 months.
Figuras y tablas -
Analysis 2.5

Comparison 2 Bisphosphonates vs control: benefits ‐ bone mineral density (BMD) at lumbar spine (LS), Outcome 5 LS BMD change 18‐24 months.

Comparison 2 Bisphosphonates vs control: benefits ‐ bone mineral density (BMD) at lumbar spine (LS), Outcome 6 LS BMD change 12 months prevention trials: oral and parenteral subgroups.
Figuras y tablas -
Analysis 2.6

Comparison 2 Bisphosphonates vs control: benefits ‐ bone mineral density (BMD) at lumbar spine (LS), Outcome 6 LS BMD change 12 months prevention trials: oral and parenteral subgroups.

Comparison 2 Bisphosphonates vs control: benefits ‐ bone mineral density (BMD) at lumbar spine (LS), Outcome 7 LS BMD change 12 months: gender/menopausal status subgroups.
Figuras y tablas -
Analysis 2.7

Comparison 2 Bisphosphonates vs control: benefits ‐ bone mineral density (BMD) at lumbar spine (LS), Outcome 7 LS BMD change 12 months: gender/menopausal status subgroups.

Comparison 3 Bisphosphonates vs control: benefits ‐ bone mineral density (BMD) at femoral neck (FN), Outcome 1 FN BMD change 12 months: all trials.
Figuras y tablas -
Analysis 3.1

Comparison 3 Bisphosphonates vs control: benefits ‐ bone mineral density (BMD) at femoral neck (FN), Outcome 1 FN BMD change 12 months: all trials.

Comparison 3 Bisphosphonates vs control: benefits ‐ bone mineral density (BMD) at femoral neck (FN), Outcome 2 FN BMD change 12 months: oral treatment.
Figuras y tablas -
Analysis 3.2

Comparison 3 Bisphosphonates vs control: benefits ‐ bone mineral density (BMD) at femoral neck (FN), Outcome 2 FN BMD change 12 months: oral treatment.

Comparison 3 Bisphosphonates vs control: benefits ‐ bone mineral density (BMD) at femoral neck (FN), Outcome 3 FN BMD change 12 months: parenteral treatment.
Figuras y tablas -
Analysis 3.3

Comparison 3 Bisphosphonates vs control: benefits ‐ bone mineral density (BMD) at femoral neck (FN), Outcome 3 FN BMD change 12 months: parenteral treatment.

Comparison 3 Bisphosphonates vs control: benefits ‐ bone mineral density (BMD) at femoral neck (FN), Outcome 4 FN BMD change 12 months: low‐ vs standard‐dose.
Figuras y tablas -
Analysis 3.4

Comparison 3 Bisphosphonates vs control: benefits ‐ bone mineral density (BMD) at femoral neck (FN), Outcome 4 FN BMD change 12 months: low‐ vs standard‐dose.

Comparison 3 Bisphosphonates vs control: benefits ‐ bone mineral density (BMD) at femoral neck (FN), Outcome 5 FN BMD change 18‐24 months.
Figuras y tablas -
Analysis 3.5

Comparison 3 Bisphosphonates vs control: benefits ‐ bone mineral density (BMD) at femoral neck (FN), Outcome 5 FN BMD change 18‐24 months.

Comparison 3 Bisphosphonates vs control: benefits ‐ bone mineral density (BMD) at femoral neck (FN), Outcome 6 FN BMD change 12 months: gender/menopausal status subgroups.
Figuras y tablas -
Analysis 3.6

Comparison 3 Bisphosphonates vs control: benefits ‐ bone mineral density (BMD) at femoral neck (FN), Outcome 6 FN BMD change 12 months: gender/menopausal status subgroups.

Comparison 4 Bisphosphonates vs control: harms, Outcome 1 Serious adverse events 12‐24 months.
Figuras y tablas -
Analysis 4.1

Comparison 4 Bisphosphonates vs control: harms, Outcome 1 Serious adverse events 12‐24 months.

Comparison 4 Bisphosphonates vs control: harms, Outcome 2 Withdrawals due to adverse events 12‐24 months.
Figuras y tablas -
Analysis 4.2

Comparison 4 Bisphosphonates vs control: harms, Outcome 2 Withdrawals due to adverse events 12‐24 months.

Summary of findings for the main comparison. Bisphosphonates versus control for adults with GIOP

Bisphosphonates (alone or with calcium and/or vitamin D) compared with control (calcium and/or vitamin D and/or placebo) for adults with GIOP

Patient or population: adults with GIOP

Settings: ambulatory

Intervention: bisphosphonates (alone or with calcium and/or vitamin D)

Comparison: control (calcium and/or vitamin D and/or placebo)

Outcomes

Illustrative comparative risks* (95% CI)

Relative effect
(95% CI)

No of Participants
(studies)

Quality of the evidence
(GRADE)

Comments

Assumed risk

Corresponding risk

Control (calcium and/or vitamin D and/or placebo)

Bisphosphonates (alone or with calcium and/or vitamin D)

Incident vertebral fractures

Radiographic follow‐up: 12‐24 months

77 per 1000

44 per 1000
(27 to 70)

RR 0.57 (0.35 to 0.91)

RD ‐0.02 (‐0.05 to

0.01)

1343
(12 RCTs)

⊕⊕⊕⊕
high1

Absolute increased benefit 2% fewer people with fractures using bisphosphonates (95% CI 5.00% fewer to 1.00% more)

Relative per cent change 43% improvement with bisphosphonates (95% CI 9.00% to 65.00% better)

NNTB = 31 (95% CI 20 to 145)

Incident nonvertebral fractures

Radiographic follow‐up: 12‐24 months

55 per 1000

42 per 1000
(25 to 69)

RR 0.79 (0.47 to 1.33)

RD ‐0.01 (‐0.04 to 0.01)

1245
(9 RCTs)

⊕⊕⊝⊝
low2,3

due to risk of bias and imprecision

Absolute increased benefit 1% fewer people with fractures using bisphosphonates (95% CI 4.00% fewer to 1.00% more)

Relative per cent change 21% improvement with bisphosphonates (95% CI 33.00% worse to 53.00% better)

NNTB = n/a4

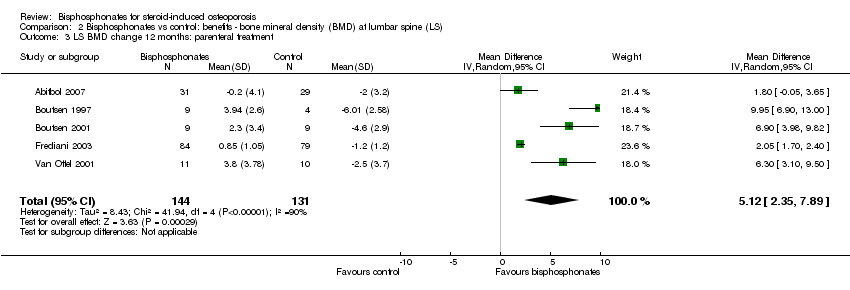
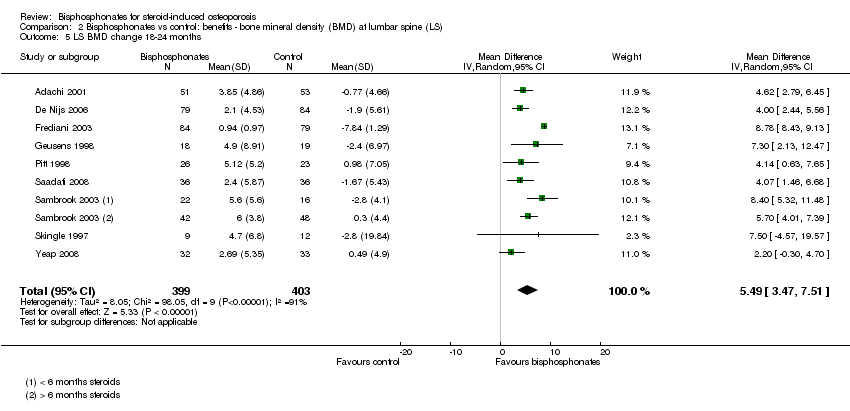
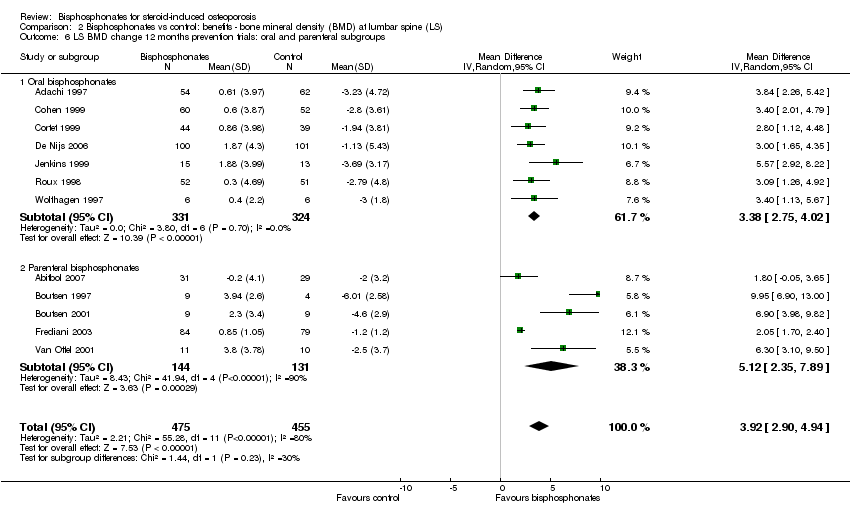
Lumbar spine BMD

DEXA follow‐up: 12 months

Mean per cent change in BMD across control groups was ‐3.19% (‐8.08% to 1.70%) from baseline5

Mean per cent change in BMD from baseline in bisphosphonate groups was 3.50% higher than control groups (2.90% to 4.10% higher)

2042
(23 RCTs)

⊕⊕⊕⊝
moderate6,7,8

due to indirectness

Absolute increased benefit 3.50% with bisphosphonates (95% CI 2.90 to 4.10)

Relative per cent change 1.10% (95% CI 0.91 to 1.29) with bisphosphonates

NNTB = 3 (95% CI 2 to 3)

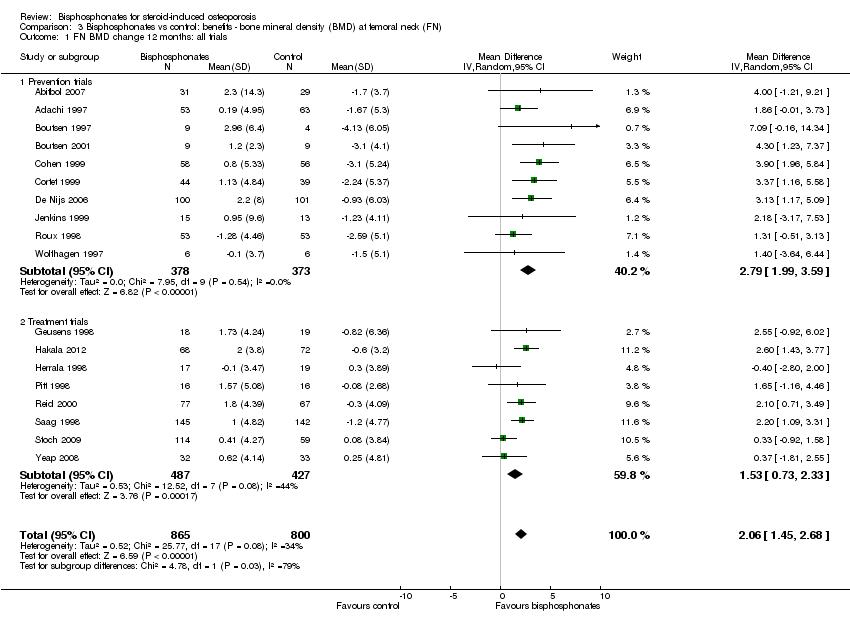
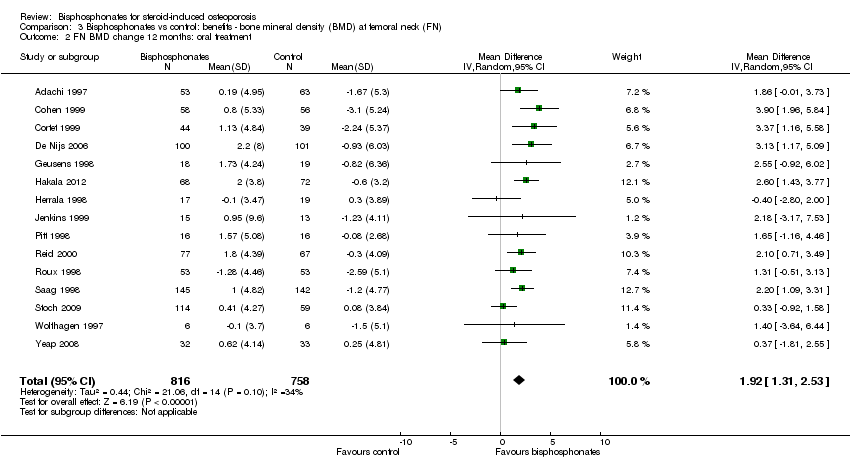
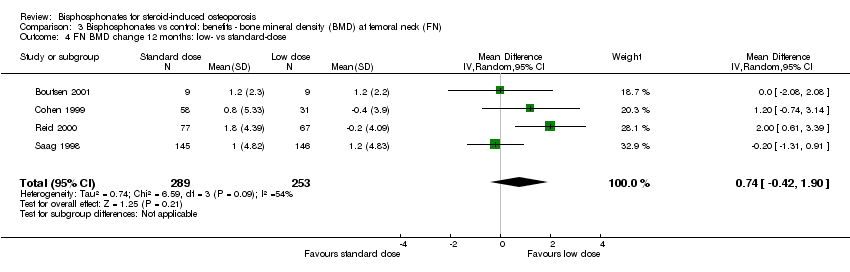
Femoral neck BMD

DEXA follow‐up: 12 months

Mean per cent change in BMD across control groups was ‐1.59% (‐10.49% to 7.31%) from baseline 5

Mean per cent change in BMD from baseline in bisphosphonate groups was 2.06% higher than control groups (1.45% to 2.68% higher)

1665
(18 RCTs)

⊕⊕⊕⊝
moderate7,8

due to indirectness

Absolute increased benefit 2.06% with bisphosphonates (95% CI 1.45 to 2.68)

Relative per cent change 1.29% with bisphosphonates (95% CI 0.91 to 1.69)

NNTB = 5 (95% CI 4 to 7)

Serious adverse events

follow‐up: 12‐24 months

162 per 1000

147 per 1000
(120 to 181)

RR 0.91 (0.74 to 1.12)

RD 0.00 (‐0.02, 0.02)

1703
(15 RCTs)

⊕⊕⊕⊝
low3,9

due to risk of bias and imprecision

Absolute increased harm 0% more adverse events with bisphosphonates (95% CI 2.00% fewer to 2.00% more)

Relative per cent change 9% improvement with bisphosphonates (95% CI 12.00% worse to 26.00% better)

NNTH = n/a4

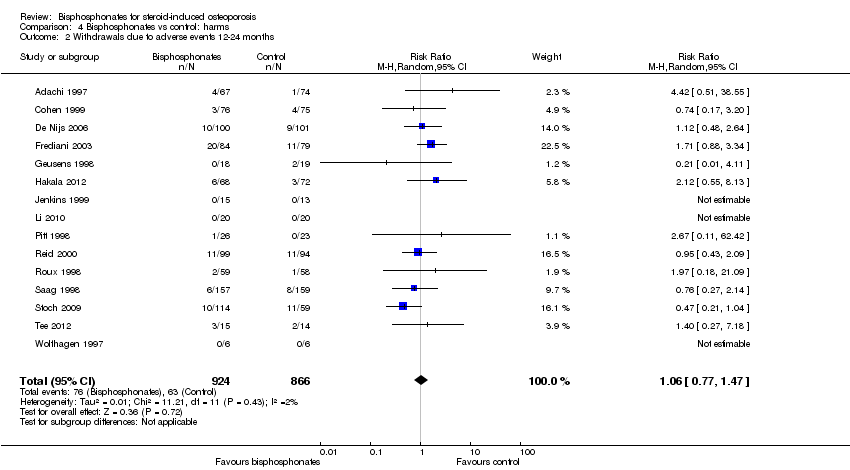
Withdrawals due to adverse events

follow‐up: 12‐24 months

73 per 1000

77 per 1000
(56 to 107)

RR 1.06 (0.77 to 1.47)

RD 0.01 (‐0.01 to 0.03)

1790
(15 RCTs)

⊕⊕⊕⊝
low3,9

due to risk of bias and imprecision

Absolute increased harm 1% more withdrawals with bisphosphonates (95% CI 1.00% fewer to 3.00% more)

Relative per cent change 6% worsening with bisphosphonates (95% CI 47.00% worse to 23.00% better)

NNTH = n/a4

Quality of life

0 per 1000

0 per 1000
(0 to 0)

Not estimable

(0 studies)

This outcome was not assessed by any of the trials

*The basis for the assumed risk (e.g. the median control group risk across studies) is provided in footnotes. The corresponding risk (and its 95% confidence interval) is based on the assumed risk in the comparison group and the relative effect of the intervention (and its 95% CI).
CI: Confidence interval; RR: Risk Ratio; RD: Risk Difference

GRADE Working Group grades of evidence
High quality: Further research is very unlikely to change our confidence in the estimate of effect.
Moderate quality: Further research is likely to have an important impact on our confidence in the estimate of effect and may change the estimate.
Low quality: Further research is very likely to have an important impact on our confidence in the estimate of effect and is likely to change the estimate.
Very low quality: We are very uncertain about the estimate.

1Vertebral fractures meet calculated OIS threshold of 1174 (calculation not shown ‐ Brant 2014)

2Downgraded for risk of bias: nonvertebral fractures were a patient‐reported, subjective outcome

3Downgraded for imprecision: total sample size is below calculated optimal information size (OIS) (calculations not shown ‐ Brant 2014) and the 95% confidence interval around the pooled estimate of effect includes both the possibility of no effect and appreciable benefit or harm

4Number needed to treat for an additional beneficial outcome (NNTB) or number needed to treat for an additional harmful outcome (NNTH) is not applicable when result is not statistically significant

5We calculated mean baseline risk for the control group in RevMan using generic inverse variance (calculations not shown)

6Most heterogeneity explained through sensitivity analyses

7Downgraded for indirectness: bone density is a surrogate marker for fracture risk

8Clinically relevant change in BMD: the natural history of participants starting steroid therapy based on control arms in our prevention trials is to see a 1%‐6% decrease in lumbar spine BMD and 1%‐4% decrease in femoral neck BMD in the first year of treatment. We have used an SMD of 0.5 as an estimate of the minimal clinically important difference for BMD change to calculate the NNTB (Schünemann 2011b)

9Downgraded for risk of bias: the protocols for the collection of harm data in a large number of trials were unclear

Figuras y tablas -
Summary of findings for the main comparison. Bisphosphonates versus control for adults with GIOP
Comparison 1. Bisphosphonates vs control: benefits ‐ fractures

Outcome or subgroup title

No. of studies

No. of participants

Statistical method

Effect size

1 Incident radiographic vertebral fractures 12‐24 months Show forest plot

12

1343

Risk Ratio (M‐H, Random, 95% CI)

0.57 [0.35, 0.91]

2 Incident radiographic nonvertebral fractures 12‐24 months Show forest plot

9

1245

Risk Ratio (M‐H, Random, 95% CI)

0.79 [0.47, 1.33]

Figuras y tablas -
Comparison 1. Bisphosphonates vs control: benefits ‐ fractures
Comparison 2. Bisphosphonates vs control: benefits ‐ bone mineral density (BMD) at lumbar spine (LS)

Outcome or subgroup title

No. of studies

No. of participants

Statistical method

Effect size

1 LS BMD change 12 months: all trials Show forest plot

23

2042

Mean Difference (IV, Random, 95% CI)

3.50 [2.90, 4.10]

1.1 Prevention trials

12

930

Mean Difference (IV, Random, 95% CI)

3.92 [2.90, 4.94]

1.2 Treatment trials

11

1112

Mean Difference (IV, Random, 95% CI)

3.19 [2.64, 3.73]

2 LS BMD change 12 months: oral treatment Show forest plot

18

1767

Mean Difference (IV, Random, 95% CI)

3.25 [2.88, 3.63]

3 LS BMD change 12 months: parenteral treatment Show forest plot

5

275

Mean Difference (IV, Random, 95% CI)

5.12 [2.35, 7.89]

4 LS BMD change 12 months: low‐ vs standard‐dose Show forest plot

5

642

Mean Difference (IV, Random, 95% CI)

0.95 [0.37, 1.53]

5 LS BMD change 18‐24 months Show forest plot

9

802

Mean Difference (IV, Random, 95% CI)

5.49 [3.47, 7.51]

6 LS BMD change 12 months prevention trials: oral and parenteral subgroups Show forest plot

12

930

Mean Difference (IV, Random, 95% CI)

3.92 [2.90, 4.94]

6.1 Oral bisphosphonates

7

655

Mean Difference (IV, Random, 95% CI)

3.38 [2.75, 4.02]

6.2 Parenteral bisphosphonates

5

275

Mean Difference (IV, Random, 95% CI)

5.12 [2.35, 7.89]

7 LS BMD change 12 months: gender/menopausal status subgroups Show forest plot

5

840

Mean Difference (IV, Random, 95% CI)

3.86 [2.03, 5.68]

7.1 Men

4

221

Mean Difference (IV, Random, 95% CI)

3.58 [2.68, 4.48]

7.2 Premenopausal women

5

154

Mean Difference (IV, Random, 95% CI)

3.51 [1.50, 5.53]

7.3 Postmenopausal women

5

465

Mean Difference (IV, Random, 95% CI)

4.41 [0.65, 8.18]

Figuras y tablas -
Comparison 2. Bisphosphonates vs control: benefits ‐ bone mineral density (BMD) at lumbar spine (LS)
Comparison 3. Bisphosphonates vs control: benefits ‐ bone mineral density (BMD) at femoral neck (FN)

Outcome or subgroup title

No. of studies

No. of participants

Statistical method

Effect size

1 FN BMD change 12 months: all trials Show forest plot

18

1665

Mean Difference (IV, Random, 95% CI)

2.06 [1.45, 2.68]

1.1 Prevention trials

10

751

Mean Difference (IV, Random, 95% CI)

2.79 [1.99, 3.59]

1.2 Treatment trials

8

914

Mean Difference (IV, Random, 95% CI)

1.53 [0.73, 2.33]

2 FN BMD change 12 months: oral treatment Show forest plot

15

1574

Mean Difference (IV, Random, 95% CI)

1.92 [1.31, 2.53]

3 FN BMD change 12 months: parenteral treatment Show forest plot

3

91

Mean Difference (IV, Random, 95% CI)

4.56 [2.07, 7.05]

4 FN BMD change 12 months: low‐ vs standard‐dose Show forest plot

4

542

Mean Difference (IV, Random, 95% CI)

0.74 [‐0.42, 1.90]

5 FN BMD change 18‐24 months Show forest plot

9

802

Mean Difference (IV, Random, 95% CI)

3.28 [1.70, 4.87]

6 FN BMD change 12 months: gender/menopausal status subgroups Show forest plot

4

537

Mean Difference (IV, Random, 95% CI)

3.29 [1.65, 4.94]

6.1 Men

3

134

Mean Difference (IV, Random, 95% CI)

2.91 [1.15, 4.68]

6.2 Premenopausal women

4

88

Mean Difference (IV, Random, 95% CI)

2.70 [‐0.96, 6.35]

6.3 Postmenopausal women

4

315

Mean Difference (IV, Random, 95% CI)

3.62 [‐0.37, 7.61]

Figuras y tablas -
Comparison 3. Bisphosphonates vs control: benefits ‐ bone mineral density (BMD) at femoral neck (FN)
Comparison 4. Bisphosphonates vs control: harms

Outcome or subgroup title

No. of studies

No. of participants

Statistical method

Effect size

1 Serious adverse events 12‐24 months Show forest plot

15

1703

Risk Ratio (M‐H, Random, 95% CI)

0.91 [0.74, 1.12]

2 Withdrawals due to adverse events 12‐24 months Show forest plot

15

1790

Risk Ratio (M‐H, Random, 95% CI)

1.06 [0.77, 1.47]

Figuras y tablas -
Comparison 4. Bisphosphonates vs control: harms