Scolaris Content Display Scolaris Content Display

Methodological quality summary: review authors' judgements about each methodological quality item for each included study.
Figuras y tablas -
Figure 1

Methodological quality summary: review authors' judgements about each methodological quality item for each included study.

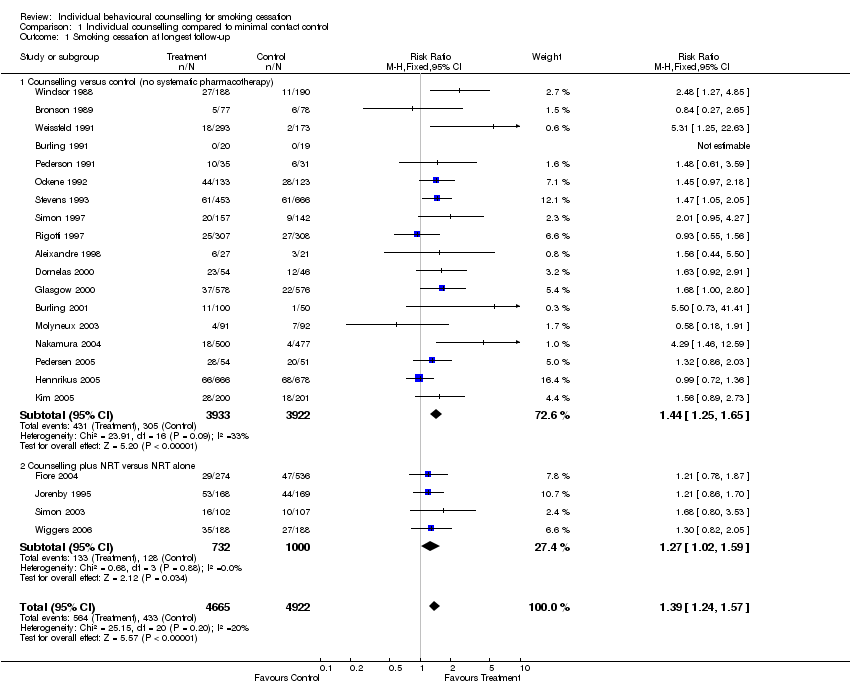
Forest plot of comparison: 1 Individual counselling compared to minimal contact control, outcome: 1.1 Smoking cessation at longest follow‐up.
Figuras y tablas -
Figure 2

Forest plot of comparison: 1 Individual counselling compared to minimal contact control, outcome: 1.1 Smoking cessation at longest follow‐up.

Comparison 1 Individual counselling compared to minimal contact control, Outcome 1 Smoking cessation at longest follow‐up.
Figuras y tablas -
Analysis 1.1

Comparison 1 Individual counselling compared to minimal contact control, Outcome 1 Smoking cessation at longest follow‐up.

Comparison 2 More intensive versus less intensive counselling, Outcome 1 Smoking cessation at longest follow‐up.
Figuras y tablas -
Analysis 2.1

Comparison 2 More intensive versus less intensive counselling, Outcome 1 Smoking cessation at longest follow‐up.

Comparison 2 More intensive versus less intensive counselling, Outcome 2 Sensitivity analyses for Alterman 2001 in intensive versus brief counselling comparison.
Figuras y tablas -
Analysis 2.2

Comparison 2 More intensive versus less intensive counselling, Outcome 2 Sensitivity analyses for Alterman 2001 in intensive versus brief counselling comparison.

Comparison 3 Comparisons between counselling approaches of similar intensity, Outcome 1 Smoking cessation at longest follow‐up.
Figuras y tablas -
Analysis 3.1

Comparison 3 Comparisons between counselling approaches of similar intensity, Outcome 1 Smoking cessation at longest follow‐up.

Comparison 1. Individual counselling compared to minimal contact control

Outcome or subgroup title

No. of studies

No. of participants

Statistical method

Effect size

1 Smoking cessation at longest follow‐up Show forest plot

22

9587

Risk Ratio (M‐H, Fixed, 95% CI)

1.39 [1.24, 1.57]

1.1 Counselling versus control (no systematic pharmacotherapy)

18

7855

Risk Ratio (M‐H, Fixed, 95% CI)

1.44 [1.25, 1.65]

1.2 Counselling plus NRT versus NRT alone

4

1732

Risk Ratio (M‐H, Fixed, 95% CI)

1.27 [1.02, 1.59]

Figuras y tablas -
Comparison 1. Individual counselling compared to minimal contact control
Comparison 2. More intensive versus less intensive counselling

Outcome or subgroup title

No. of studies

No. of participants

Statistical method

Effect size

1 Smoking cessation at longest follow‐up Show forest plot

5

1897

Risk Ratio (M‐H, Fixed, 95% CI)

0.96 [0.74, 1.25]

1.1 No pharmacotherapy

2

478

Risk Ratio (M‐H, Fixed, 95% CI)

1.08 [0.53, 2.22]

1.2 Adjunct to pharmacotherapy

4

1419

Risk Ratio (M‐H, Fixed, 95% CI)

0.94 [0.71, 1.25]

2 Sensitivity analyses for Alterman 2001 in intensive versus brief counselling comparison Show forest plot

5

Risk Ratio (M‐H, Fixed, 95% CI)

Subtotals only

2.1 Using Alterman high versus low

5

1817

Risk Ratio (M‐H, Fixed, 95% CI)

1.06 [0.81, 1.37]

2.2 Using Alterman high versus moderate

5

1817

Risk Ratio (M‐H, Fixed, 95% CI)

1.20 [0.91, 1.58]

Figuras y tablas -
Comparison 2. More intensive versus less intensive counselling
Comparison 3. Comparisons between counselling approaches of similar intensity

Outcome or subgroup title

No. of studies

No. of participants

Statistical method

Effect size

1 Smoking cessation at longest follow‐up Show forest plot

3

Risk Ratio (M‐H, Fixed, 95% CI)

Subtotals only

1.1 Relapse Prevention versus Health Belief model

1

160

Risk Ratio (M‐H, Fixed, 95% CI)

0.94 [0.45, 1.98]

1.2 Motivational Interviewing versus Health Education

1

755

Risk Ratio (M‐H, Fixed, 95% CI)

0.51 [0.34, 0.76]

1.3 Counselling versus equal sessions of psychoeducation

1

463

Risk Ratio (M‐H, Fixed, 95% CI)

0.93 [0.62, 1.39]

Figuras y tablas -
Comparison 3. Comparisons between counselling approaches of similar intensity