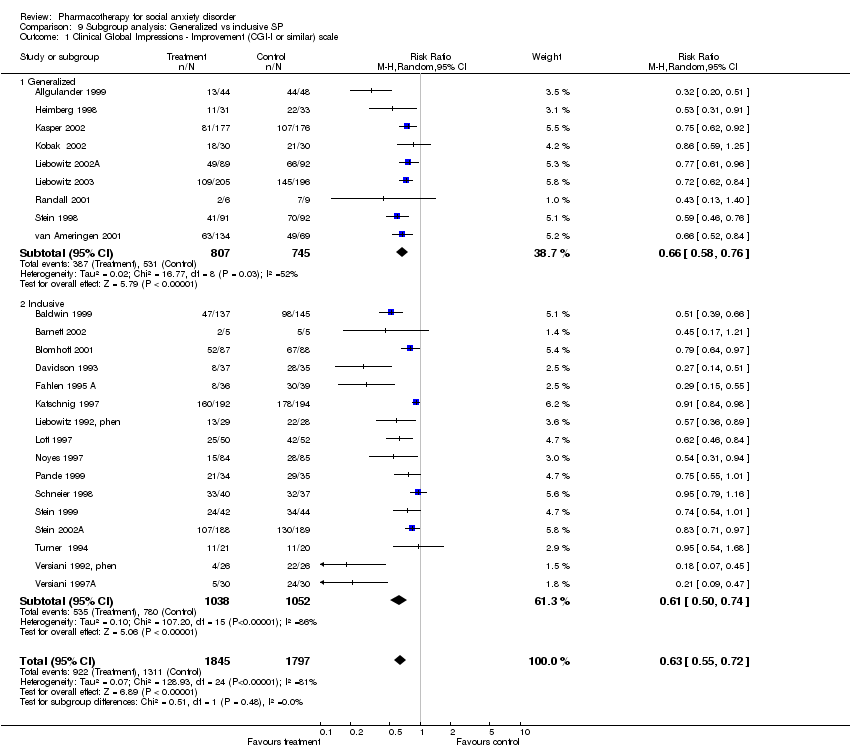
| 1 Global Impressions scale change item (CGI‐I) (or similar scale) non‐response Show forest plot | 26 | 3696 | Risk Ratio (M‐H, Random, 95% CI) | 0.64 [0.57, 0.73] |
|
| 1.1 Moclobemide | 5 | 1063 | Risk Ratio (M‐H, Random, 95% CI) | 0.89 [0.80, 0.98] |
| 1.2 Brofaromine | 2 | 177 | Risk Ratio (M‐H, Random, 95% CI) | 0.44 [0.20, 0.97] |
| 1.3 SSRI | 11 | 2031 | Risk Ratio (M‐H, Random, 95% CI) | 0.67 [0.59, 0.76] |
| 1.4 MAOI | 3 | 173 | Risk Ratio (M‐H, Random, 95% CI) | 0.43 [0.24, 0.76] |
| 1.5 Other medication | 5 | 252 | Risk Ratio (M‐H, Random, 95% CI) | 0.47 [0.26, 0.87] |
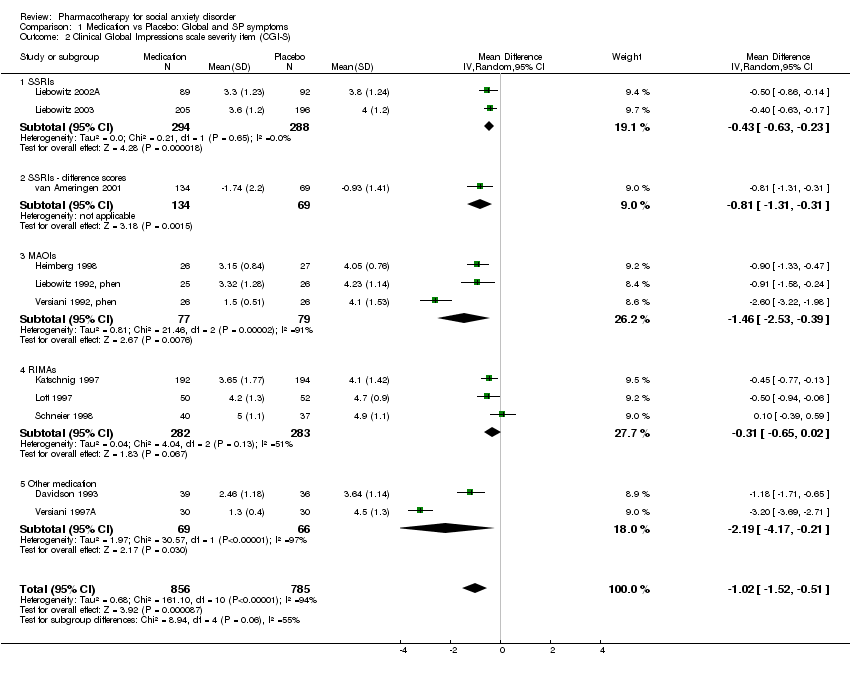
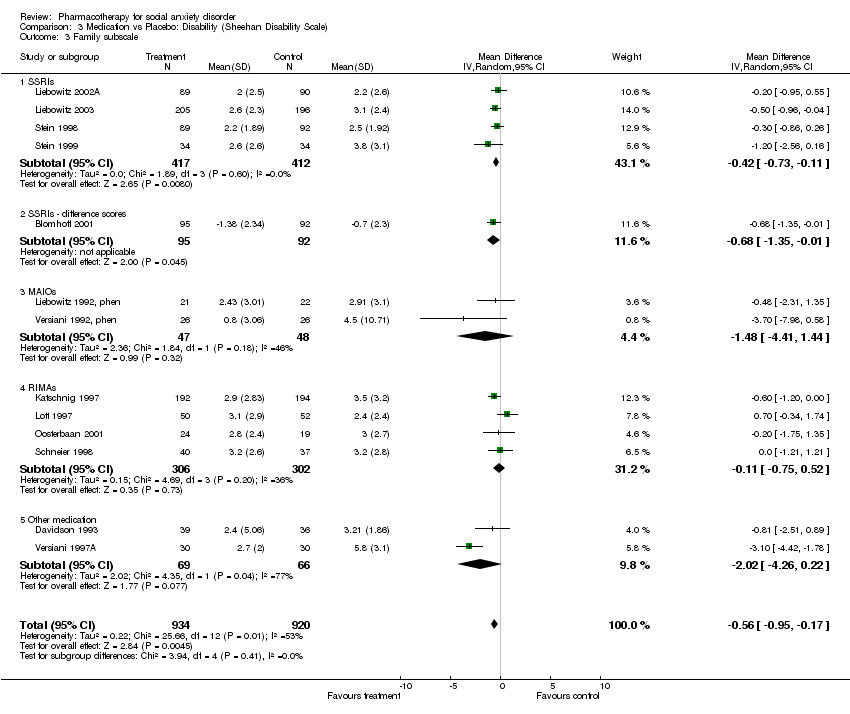
| 2 Clinical Global Impressions scale severity item (CGI‐S) Show forest plot | 11 | 1641 | Mean Difference (IV, Random, 95% CI) | ‐1.02 [‐1.52, ‐0.51] |
|
| 2.1 SSRIs | 2 | 582 | Mean Difference (IV, Random, 95% CI) | ‐0.43 [‐0.63, ‐0.23] |
| 2.2 SSRIs ‐ difference scores | 1 | 203 | Mean Difference (IV, Random, 95% CI) | ‐0.81 [‐1.31, ‐0.31] |
| 2.3 MAOIs | 3 | 156 | Mean Difference (IV, Random, 95% CI) | ‐1.46 [‐2.53, ‐0.39] |
| 2.4 RIMAs | 3 | 565 | Mean Difference (IV, Random, 95% CI) | ‐0.31 [‐0.65, 0.02] |
| 2.5 Other medication | 2 | 135 | Mean Difference (IV, Random, 95% CI) | ‐2.19 [‐4.17, ‐0.21] |
| 3 Other SP Symptom Severity Scale Show forest plot | 12 | 1143 | Std. Mean Difference (IV, Random, 95% CI) | ‐0.80 [‐1.16, ‐0.43] |
|
| 3.1 SSRIs | 4 | 655 | Std. Mean Difference (IV, Random, 95% CI) | ‐0.44 [‐0.79, ‐0.08] |
| 3.3 MAOIs | 2 | 96 | Std. Mean Difference (IV, Random, 95% CI) | ‐0.89 [‐2.20, 0.41] |
| 3.4 RIMAs | 2 | 179 | Std. Mean Difference (IV, Random, 95% CI) | ‐0.29 [‐0.92, 0.34] |
| 3.5 Other medication | 4 | 213 | Std. Mean Difference (IV, Random, 95% CI) | ‐1.51 [‐2.71, ‐0.32] |
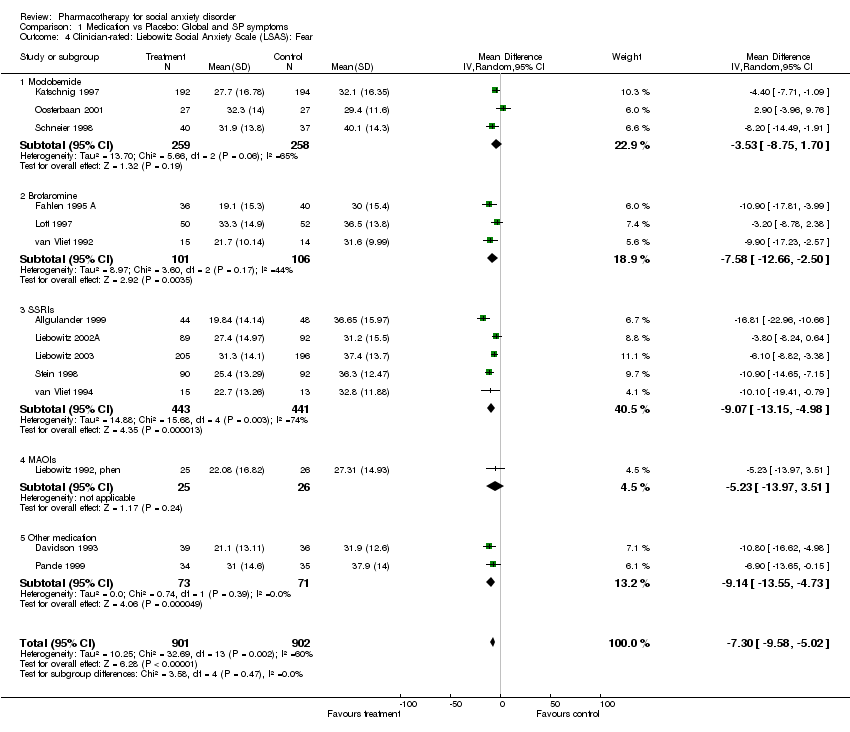
| 4 Clinician‐rated: Liebowitz Social Anxiety Scale (LSAS): Fear Show forest plot | 14 | 1803 | Mean Difference (IV, Random, 95% CI) | ‐7.30 [‐9.58, ‐5.02] |
|
| 4.1 Moclobemide | 3 | 517 | Mean Difference (IV, Random, 95% CI) | ‐3.53 [‐8.75, 1.70] |
| 4.2 Brofaromine | 3 | 207 | Mean Difference (IV, Random, 95% CI) | ‐7.58 [‐12.66, ‐2.50] |
| 4.3 SSRIs | 5 | 884 | Mean Difference (IV, Random, 95% CI) | ‐9.07 [‐13.15, ‐4.98] |
| 4.4 MAOIs | 1 | 51 | Mean Difference (IV, Random, 95% CI) | ‐5.23 [‐13.97, 3.51] |
| 4.5 Other medication | 2 | 144 | Mean Difference (IV, Random, 95% CI) | ‐9.14 [‐13.55, ‐4.73] |
| 5 Clinician‐rated: Liebowitz Social Anxiety Scale (LSAS): Avoidance Show forest plot | 14 | 1804 | Mean Difference (IV, Random, 95% CI) | ‐6.60 [‐8.68, ‐4.51] |
|
| 5.1 Moclobemide | 3 | 517 | Mean Difference (IV, Random, 95% CI) | ‐4.03 [‐9.02, 0.95] |
| 5.2 Brofaromine | 2 | 178 | Mean Difference (IV, Random, 95% CI) | ‐6.38 [‐10.63, ‐2.12] |
| 5.3 SSRIs | 5 | 884 | Mean Difference (IV, Random, 95% CI) | ‐8.12 [‐12.09, ‐4.15] |
| 5.4 MAOIs | 1 | 51 | Mean Difference (IV, Random, 95% CI) | ‐5.42 [‐14.69, 3.85] |
| 5.5 Other medication | 3 | 174 | Mean Difference (IV, Random, 95% CI) | ‐6.59 [‐11.77, ‐1.41] |
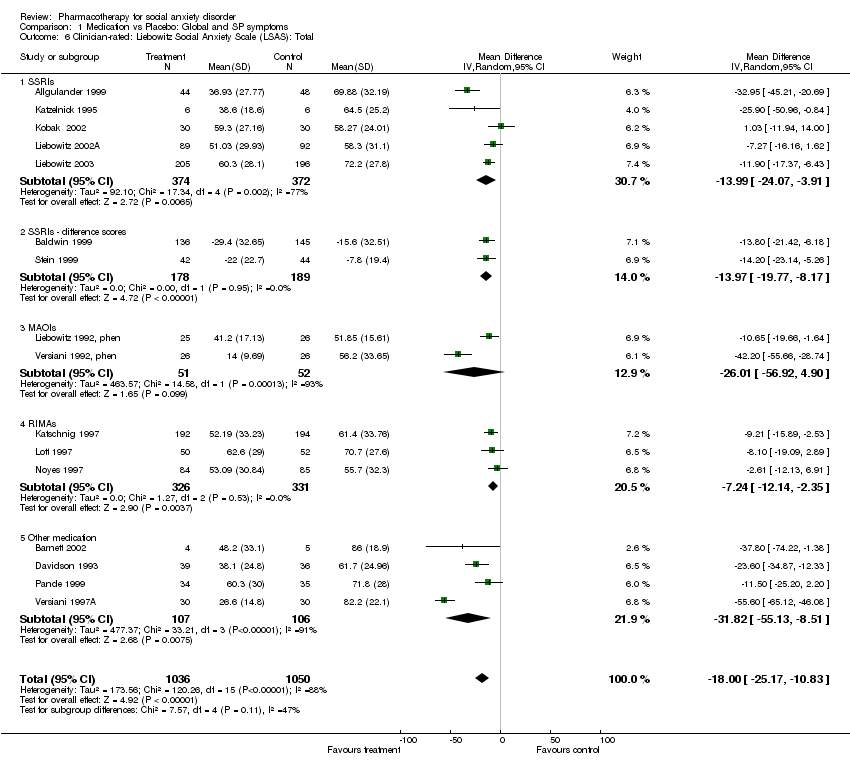
| 6 Clinician‐rated: Liebowitz Social Anxiety Scale (LSAS): Total Show forest plot | 16 | 2086 | Mean Difference (IV, Random, 95% CI) | ‐18.00 [‐25.17, ‐10.83] |
|
| 6.1 SSRIs | 5 | 746 | Mean Difference (IV, Random, 95% CI) | ‐13.99 [‐24.07, ‐3.91] |
| 6.2 SSRIs ‐ difference scores | 2 | 367 | Mean Difference (IV, Random, 95% CI) | ‐13.97 [‐19.77, ‐8.17] |
| 6.3 MAOIs | 2 | 103 | Mean Difference (IV, Random, 95% CI) | ‐26.01 [‐56.92, 4.90] |
| 6.4 RIMAs | 3 | 657 | Mean Difference (IV, Random, 95% CI) | ‐7.24 [‐12.14, ‐2.35] |
| 6.5 Other medication | 4 | 213 | Mean Difference (IV, Random, 95% CI) | ‐31.82 [‐55.13, ‐8.51] |