Intervenciones psicosociales y psicológicas para la prevención de la depresión posparto
Resumen
Antecedentes
Los estudios epidemiológicos y los metanálisis de los estudios predictivos han demostrado de manera consistente la importancia de las variables psicosociales y psicológicas como factores de riesgo de la depresión posparto. Aunque las intervenciones basadas en estas variables pueden ser estrategias de tratamiento efectivas, teóricamente también pueden ser utilizadas durante el embarazo y en el comienzo del período posparto para prevenir la depresión.
Objetivos
Primarios: evaluar el efecto de las diversas intervenciones psicosociales y psicológicas en comparación con la atención habitual antes, durante y después del parto para reducir el riesgo de contraer depresión posparto. Secundarios: examinar (1) la efectividad de tipos específicos de intervenciones psicosociales y psicológicas; (2) la efectividad de las intervenciones profesionales versus no profesionales; (3) la efectividad de las intervenciones individuales versus grupales; (4) los efectos del comienzo de la intervención y la duración ; y (5) si las intervenciones resultan más efectivas en mujeres seleccionadas con factores de riesgo específicos.
Métodos de búsqueda
Se hicieron búsquedas en el registro de ensayos del Grupo Cochrane de Embarazo y Parto (Cochrane Pregnancy and Childbirth Group) (30 de noviembre de 2011), se revisaron las referencias secundarias y se contactó con expertos en este ámbito. Se actualizó la búsqueda el 31 de diciembre de 2012 y se agregaron los resultados a la sección de clasificaciones en espera de la revisión para su evaluación en la próxima actualización.
Criterios de selección
Todos los ensayos controlados aleatorios, publicados o inéditos, de calidad aceptable, que comparaban una intervención psicosocial o psicológica con la atención habitual anterior, durante o posterior al parto.
Obtención y análisis de los datos
Los autores de revisiones y un coordinador investigador con experiencia en revisiones Cochrane participaron en la evaluación de la calidad metodológica y en la extracción de los datos. La información adicional se obtuvo de varios investigadores. Se presentaron los resultados mediante el cociente de riesgos (CR) para los datos categóricos y la diferencia de medias (DM) para los datos continuos.
Resultados principales
Veintiocho ensayos, con casi 17.000 mujeres, contribuyeron con datos para la revisión. En términos generales, las mujeres que recibieron una intervención psicosocial o psicológica presentaron menor probabilidad de contraer depresión posparto en comparación con las que recibieron atención estándar (CR promedio 0,78; intervalo de confianza [IC] del 95%: 0,66 a 0,93; 20 ensayos, 14.727 mujeres). Varias intervenciones prometedoras incluyen: (1) la provisión de visitas domiciliarias posparto intensivas e individuales a cargo de comadronas o enfermeras de salud pública (CR 0,56; IC del 95%: 0,43 a 0,73; dos ensayos, 1.262 mujeres); (2) asistencia telefónica no especializada (CR 0,54; IC del 95%: 0,38 a 0,77; un ensayo, 612 mujeres); y (3) psicoterapia interpersonal (diferencia de medias estandarizada ‐0,27; IC del 95%: ‐0,52 a ‐0,01; cinco ensayos, 366 mujeres). Las intervenciones profesionales y no profesionales fueron efectivas para reducir el riesgo de desarrollar sintomatología depresiva. Las intervenciones individuales redujeron la sintomatología depresiva durante la evaluación final (CR 0,75; IC del 95%: 0,61 a 0,92; 14 ensayos, 12.914 mujeres) como lo hicieron las intervenciones de contacto múltiple (CR 0,78; IC del 95%: 0,66 a 0,93; 16 ensayos, 11.850 mujeres). Las intervenciones que se iniciaron en el período posparto también redujeron de manera significativa el riesgo de desarrollar sintomatología depresiva (CR 0,73; IC del 95%: 0,59 a 0,90; 12 ensayos, 12.786 mujeres). La identificación de madres "en riesgo" colaboró con la prevención de la depresión posparto (CR 0,66; IC del 95%: 0,50 a 0,88; ocho ensayos, 1.853 mujeres).
Conclusiones de los autores
En términos generales, las intervenciones psicosociales y psicológicas reducen de manera significativa el número de mujeres que contraen depresión posparto. Las intervenciones alentadoras incluyen la provisión de visitas domiciliarias profesionales posparto, la asistencia telefónica no especializada y la psicoterapia interpersonal.
PICO
Resumen en términos sencillos
Intervenciones psicosociales y psicológicas para la prevención de la depresión posparto
La depresión posparto es un problema de salud serio e importante para la salud pública. La finalidad de esta revisión era examinar el efecto de las intervenciones psicosociales y psicológicas para reducir el riesgo de depresión posparto en comparación con la atención habitual. Esta revisión incluye datos de 28 ensayos controlados aleatorizados con casi 17.000 mujeres. Las intervenciones preventivas evaluadas en los ensayos incluidos fueron diversas y las variables de evaluación difirieron ampliamente, sin embargo, la calidad metodológica fue de buena a excelente. Un efecto beneficioso claro en la prevención de la depresión posparto se encontró de un rango de intervenciones psicosociales y psicológicas. Las intervenciones alentadoras incluyeron visitas domiciliarias profesionales posparto, la asistencia telefónica posparto no especializada o no especializada y la psicoterapia interpersonal. Las intervenciones proporcionadas por diversos profesionales de la salud e individuos no especialistas fueron beneficiosas. Las intervenciones individuales fueron beneficiosas como las que incluyeron contactos múltiples. Además, existen pruebas que demuestran que las intervenciones iniciadas luego del parto ayudaron en la prevención de la depresión posparto como lo hicieron aquellas que tenían como objetivo a madres “en riesgo”. Quedan muchas preguntas sin respuesta y se necesita investigación adicional.
Authors' conclusions
Background
Description of the condition
Depression is a major cause of disability for all ages and both sexes worldwide (WHO 2010). The public health significance of depression in women is undeniable, with lifetime rates between 10% and 25% (Kessler 2005; Weissman 1996). According to the World Health Organization, by 2020 depression is projected to carry the highest disease burden of all health conditions in women, accounting for 5.7% of the total disease burden measured in disability‐adjusted life years. Depression impairs social and physical functioning, is a major precipitating factor in suicide, and is associated with healthcare costs, morbidity, and mortality from medical illness. For women aged 15 to 44, depression is the leading cause of non‐obstetric hospitalisations among women in the United States (O'Hara 2009). Postpartum depression is often defined as depression occurring within the first year following childbirth. In most studies this includes those women for whom the depression may be a continuation of that experienced during pregnancy, as well as those for whom it is a new onset. The Diagnostic and Statistical Manual of Mental Disorders (DSM‐IV) does not recognise postpartum depression as diagnostically distinct from depression at other times, although does allow for the addition of a "postpartum‐onset specifier" in women with an onset within four weeks of birth. Results from a meta‐analysis of postpartum depression in 59 studies found an overall prevalence of 13% within the first 12 weeks following childbirth (n = 12,810; 95% confidence interval 12.3% to 13.4%)(O'Hara 1996). A more recent systematic review of postpartum depression found the period prevalence of all depression to be 19.2% in the first 12 weeks postnatally, with a period prevalence for major depression of 7.1% (Gaynes 2005). This review also identified depression to be common during pregnancy with a period prevalence of 18.4% across the nine months of pregnancy, with 12.7% having an episode of major depression during this time. Not surprisingly, antenatal depression is a strong risk factor of postpartum depression. For the majority of women, postpartum depression starts within the first 12 weeks postpartum and common symptoms include dysphoria, emotional lability, insomnia, confusion, guilt, and suicidal ideation. For about 8% of mothers, their depressive symptoms will continue past the first year postpartum (Dennis 2012). If left untreated, postpartum depression can develop into severe clinical depression and, in a small number of cases, lead to suicide, which is one of the leading causes of maternal deaths in the UK (Lewis 2007; Lindahl 2005).
How the intervention might work
The cause of postpartum depression suggests a multifactorial aetiology (Beck 2001; O'Hara 1996). Despite considerable research, no single causative factor has been isolated. However, meta‐analytic findings consistently highlight the importance of psychosocial variables such as stressful life events, marital conflict, and the lack of social support. To address this issue, a variety of psychosocial and psychological interventions have been developed to treat postpartum depression (Dennis 2007). For example, randomised controlled trials evaluating cognitive‐behavioural counselling with antidepressants (Appleby 1997), cognitive‐behavioural therapy and non‐directive counselling (Cooper 1997; Cooper 2003), health visitor‐led non‐directive counselling (Holden 1989; Wickberg 1996), peer support (Dennis 2003a), and interpersonal psychotherapy (O'Hara 2000) have all demonstrated the amenability of postpartum depression to treatment. It is theoretically plausible that psychosocial and psychological interventions may also prevent postpartum depression, as many of the known risk factors are present during pregnancy and the immediate postpartum period. As such, these interventions may be provided to women antenatally or initiated early in the postpartum period. They may be individually‐based focusing on specific maternal needs or provided in a group setting that could incorporate peer support from other women and social comparisons. Interventions may be intensive and include multiple contacts or be provided during a single session. Interventions may also be provided by a health professional, such as a midwife, nurse, psychologist, or lay individuals such as experienced mothers recruited from the community. The usefulness of any intervention to prevent postpartum depression, at a population level, depends on the proportion of depressed women who would have been identified to be at risk and offered the intervention (sensitivity of risk targeting). The cost‐effectiveness will depend crucially on the proportion of women who would have developed postpartum depression amongst those identified to be at risk (positive predictive value of risk targeting). One way to identify those at increased risk of developing postpartum depression is to use a risk screening tool. A simpler approach is to target individual risk groups. Although there are unique circumstances in the perinatal period that might increase risk of depression, such as obstetric and neonatal complications, the risk factors identified by most studies are similar to those for depression at other times such as a past history of psychopathology, antenatal depression or anxiety, a poor relationship with partner, low social support, and stressful life events (Beck 2001; O'Hara 1996). There are also specific subgroups of women who are at high risk, e.g. those with a history of abuse (emotional, physical, sexual) (Ross 2009), young mothers (Brown 2011), and migrant groups (Collins 2011).
It is anticipated that the psychosocial and psychological interventions may reduce the risk for postpartum depression via several mechanisms (Cohen 2000; Dennis 2003b). These interventions can directly influence the development of postpartum depression by: (1) decreasing isolation and feelings of loneliness, (2) swaying health practices and deterring maladaptive behaviours or responses, (3) promoting positive psychological states and individual motivation, and (4) providing information regarding access to medical services or the benefits of behaviours that positively influence health and well‐being. They may also buffer the influence of stress by: (1) redefining and reducing the potential for harm posed by the stressor, (2) broadening the number of coping resources, (3) discussing coping strategies, problem‐solving techniques, and counter‐responses thereby moderating the initial appraisals of the stressor, (4) highlighting norms through social comparison which prescribe adaptive behaviour, (5) inhibiting maladaptive responses, and (6) counteracting the propensity to blame oneself for causing the stressor or adversity thus preventing active coping efforts to be hampered by self‐recriminations. Lastly, psychosocial or psychological interventions may mediate the development of postpartum depression by: (1) assisting in the interpretation and positive reinforcement of performance accomplishments, (2) providing vicarious experience and observational learning through role modelling, (3) offering opportunities for social comparisons to promote self‐evaluations and motivation, (4) teaching coping strategies and conveying information about ability, (5) positively interpreting emotional arousal, and (6) encouraging cognitive restructuring through anticipatory guidance.
Why it is important to do this review
Postpartum depression occurs at a time when the infant is maximally dependent on parental care and is highly sensitive to the quality of the interaction. Concern for infant development is warranted as mood disorders can be incompatible with good parenting interactions and can cause significant stress for children (England 2009; Goodman 1999). There is a substantial body of evidence showing that maternal depression and subsequent poor maternal‐infant interactions adversely affect the developing child (Weinberg 1998; Weissman 2006). Observational research shows that children of depressed mothers, compared with those of non‐depressed mothers, are more fussy, receive lower scores on measures of intellectual and motor development, have more difficult temperaments and less secure attachments to their mothers, react more negatively to stress, show delayed development of self‐regulatory strategies, and exhibit poorer academic performance, fewer social competencies, lower levels of self‐esteem, and higher levels of behavioural problems (England 2009; Goodman 1999). A recent meta‐analysis, including 193 studies, reported that maternal depression (not restricted to the postnatal period), was associated with higher levels of internalising behaviour, externalising behaviour, general psychopathology and to lower levels of positive affect in the offspring (Goodman 2011). Of particular relevance is the observation that these effects were stronger if the child was exposed to maternal depression at an early age. Suggested mechanisms by which maternal‐interactions transmit risk from depressed mother to the child include maternal modelling of depressed affect, cognitions, and behaviours; reduced positive reinforcement for the child and inconsistent discipline practices; the development of an insecure child attachment, an indirect influence on maternal depression through its detrimental effects on the marital relationship and family functioning. Not surprisingly, international experts have clearly identified maternal depression as a major childhood adversity and that effective interventions to address this condition are one of the most important public health preventive strategies we can implement to reduce the long‐term negative developmental outcomes among children (England 2009). This review will assist in the development of effective postpartum depression interventions with the aim of reducing the number of women who develop postpartum depression and thus aid in preventing poor child developmental outcomes.
Objectives
The primary objective of this review was to assess the effects, on mothers and their families, of preventive psychosocial and psychological interventions compared with usual antepartum, intrapartum, or postpartum care to reduce the risk of postpartum depression. Secondary objectives were to examine:
-
the effectiveness of specific types of psychosocial interventions (e.g., a "talking therapy" which is theoretically based on the social environment such as enhancing supportive interactions or creating supportive relationships);
-
the effectiveness of specific types of psychological interventions (e.g., a "talking therapy" which is theoretically based in a specific psychological method such as cognitive behavioural therapy, interpersonal psychotherapy, psychological debriefing);
-
the effects of intervention provider (e.g., professionally‐based interventions, lay‐based interventions);
-
the effects of intervention mode (e.g., individually‐based interventions, group‐based interventions);
-
the effects of intervention duration (e.g., single‐contact interventions, multiple‐contact interventions);
-
the effects of intervention onset (e.g., antenatal only interventions, antenatal and postnatal interventions, and postnatal‐only interventions);
-
the effects of sample selection criteria (e.g., interventions targeting women with specific risk factors, interventions offered to the general population).
Methods
Criteria for considering studies for this review
Types of studies
All published, unpublished and ongoing randomised controlled trials of preventive psychosocial or psychological interventions in which the primary or secondary aim was reduction in the risk of developing postpartum depression. Quasi‐randomised trials (e.g., those randomised by delivery date, or odd versus even medical record numbers) were excluded from the analysis.
Types of participants
Pregnant women and new (less than six weeks postpartum) mothers, including those at no known risk and those identified as at‐risk of developing postpartum depression. Trials where more than 20% of participants were depressed at trial entry were excluded.
Types of interventions
Any form of standard or usual care compared with a variety of non‐pharmaceutical interventions ‐ including psycho educational strategies, cognitive behavioural therapy, interpersonal psychotherapy, non‐directive counselling, psychological debriefing, various supportive interactions, and tangible assistance ‐ delivered via telephone, home or clinic visits, or individual or group sessions antenatally and/or within the first month postpartum by a professional (e.g., nurse, midwife, childbirth educator, physician, psychiatrist, psychologist) or lay person (e.g., specially trained woman from the community, student, research assistant).
Types of outcome measures
Primary outcome
Maternal
1. Postpartum depression (as variously defined and measured by trialists).
Secondary outcomes
Maternal
2. Maternal mortality and serious morbidity including self‐harm, suicide attempts.
3. Maternal‐infant attachment.
4. Anxiety.
5. Maternal stress.
6. Parental stress (e.g. measured using a tool such as the parenting stress index, Abidin 1995).
7. Maternal perceived social support.
8. Maternal dissatisfaction with care provided.
Infant
9. Infant health parameters including no immunisation or having accidental injury or non accidental injury.
10. Infant developmental assessments (variously defined).
11. Child abuse and/or neglect.
Family outcomes
12. Marital discord
The outcomes were assessed at four time points across the postpartum period:
-
immediate (zero to eight weeks postpartum);
-
short term (nine to 16 weeks postpartum);
-
intermediate (17 to 24 weeks postpartum);
-
long term (greater than 24 weeks postpartum).
Search methods for identification of studies
Electronic searches
We searched the Cochrane Pregnancy and Childbirth Group trials register by contacting the Trials Search Co‐ordinator (30 November 2011). We updated the search on 31 December 2012 and added the results to Characteristics of studies awaiting classification for consideration at the next update.
The Cochrane Pregnancy and Childbirth Group’s Trials Register is maintained by the Trials Search Co‐ordinator and contains trials identified from:
-
monthly searches of the Cochrane Central Register of Controlled Trials (CENTRAL);
-
weekly searches of MEDLINE;
-
weekly searches of EMBASE;
-
handsearches of 30 journals and the proceedings of major conferences;
-
weekly current awareness alerts for a further 44 journals plus monthly BioMed Central email alerts.
Details of the search strategies for CENTRAL, MEDLINE and EMBASE, the list of handsearched journals and conference proceedings, and the list of journals reviewed via the current awareness service can be found in the ‘Specialized Register’ section within the editorial information about the Cochrane Pregnancy and Childbirth Group.
Trials identified through the searching activities described above are each assigned to a review topic (or topics). The Trials Search Co‐ordinator searches the register for each review using the topic list rather than keywords.
Searching other resources
We examined secondary references and contacted experts in the field.
We did not apply any language restrictions.
Data collection and analysis
For the methods used when assessing the trials identified in the previous version of this review, seeAppendix 1. For this update we used the following methods when assessing the reports identified by the updated search.
Selection of studies
Two review authors independently assessed for inclusion all the potential studies we identified as a result of the search strategy. We resolved any uncertainties regarding the appropriateness for inclusion through discussion or consultation with a third person.
Data extraction and management
We designed a form to extract data. For eligible studies, two review authors independently extracted the data using the agreed form. We resolved discrepancies through discussion or, if required, we consulted a third person. We entered data into Review Manager software (RevMan 2011) and checked for accuracy.
When information regarding any of the above was unclear, we attempted to contact authors of the original reports to provide further details.
Assessment of risk of bias in included studies
Two review authors independently assessed the risk of bias for each study using the criteria outlined in the Cochrane Handbook for Systematic Reviews of Interventions (Higgins 2011). We resolved any disagreement by discussion or by involving a third person.
(1) Sequence generation (checking for possible selection bias)
We described for each included study the method used to generate the allocation sequence in sufficient detail to allow an assessment of whether it should produce comparable groups.
We assessed the method as:
-
low risk of bias (any truly random process, e.g., random number table; computer random number generator);
-
high risk of bias (any non‐random process, e.g., odd or even date of birth; hospital or clinic record number);
-
unclear risk of bias.
(2) Allocation concealment (checking for possible selection bias)
We described for each included study the method used to conceal the allocation sequence and determined whether intervention allocation could have been foreseen in advance of, or during recruitment, or changed after assignment.
We assessed the methods as:
-
low risk of bias (e.g., telephone or central randomisation; consecutively numbered sealed opaque envelopes);
-
high risk of bias (open random allocation; unsealed or non‐opaque envelopes, alternation; date of birth);
-
unclear risk of bias.
(3) Blinding (checking for possible performance bias)
We described for each included study the methods used, if any, to blind study participants and personnel from knowledge of which intervention a participant received. Since women and care providers cannot be easily blinded as to whether a psychosocial or psychological intervention was given, we considered blinding adequate if outcomes were recorded by outcome assessors who had no knowledge of the woman's group assignment or if the women self‐reported outcome data by mailed questionnaire. We considered studies at low risk of bias if they were blinded, or if we judged that the lack of blinding could not have affected the results. We assessed blinding separately for participants and staff and for outcome assessors.
We assessed the methods as:
-
low, high or unclear risk of bias for participants and personnel;
-
low, high or unclear risk of bias for outcome assessors.
(4) Incomplete outcome data (checking for possible attrition bias through withdrawals, dropouts, protocol deviations)
We described for each included study, and for each outcome or class of outcomes, the completeness of data including attrition and exclusions from the analysis. We stated whether attrition and exclusions were reported, the numbers included in the analysis at each stage (compared with the total randomised participants), reasons for attrition or exclusion where reported, and whether missing data were balanced across groups or were related to outcomes. Where sufficient information was reported, or could be supplied by the trial authors, we planned to include missing data in the analyses. We did not exclude any trial or outcome from the analysis based on rate of incomplete data. We performed a sensitivity analysis for those trials where 80% of data on a given outcome was available for those who were originally randomised versus those with < 80%.
We assessed methods as:
-
low risk of bias;
-
high risk of bias;
-
unclear risk of bias.
(5) Selective reporting bias
We described for each included study how we investigated the possibility of selective outcome reporting bias and what we found.
We assessed the methods as:
-
low risk of bias (where it is clear that all of the study’s pre‐specified outcomes and all expected outcomes of interest to the review have been reported);
-
high risk of bias (where not all the study’s pre‐specified outcomes have been reported; one or more reported primary outcomes were not pre‐specified; outcomes of interest were reported incompletely and so could not be used; study failed to include results of a key outcome that would have been expected to have been reported);
-
unclear risk of bias.
(6) Other sources of bias
We described for each included study any important concerns we had about other possible sources of bias.
We assessed whether each study was free of other problems that could put it at risk of bias:
-
low risk of other sources of bias;
-
high risk of other sources of bias;
-
unclear risk of other sources of bias.
For cluster‐randomised trials we described the following (as per the Cochrane Handbook for Systematic Reviews of Interventions 16.3.2 Higgins 2011).
-
Recruitment bias ‐ whether the individuals participating in the trial were blinded to the type of cluster they were in before agreeing to participate.
-
Baseline imbalances ‐ whether there were differences in baseline characteristics between the randomised groups.
-
Loss of clusters ‐ whether any complete clusters were lost to follow‐up and the reasons.
-
Incorrect analysis ‐ whether the proper statistical analysis was carried out for a cluster‐randomised design.
-
Differences in intervention effects ‐ whether the cluster‐randomisation method could have resulted in different intervention effects than an individually‐randomised trial.
(7) Overall risk of bias
We made explicit judgements about whether studies were at high risk of bias, according to the criteria given in the Cochrane Handbook for Systematic Reviews of Interventions (Higgins 2011). With reference to (1) to (6) above, we assessed the likely magnitude and direction of the bias and whether we considered it was likely to impact on the findings. We explored the impact of the level of bias through undertaking sensitivity analyses ‐ seeSensitivity analysis.
Measures of treatment effect
Dichotomous data
For dichotomous data, we presented results as summary risk ratio with 95% confidence intervals.
Continuous data
For continuous data, we used the mean difference if outcomes were measured in the same way between trials. We used the standardised mean difference to combine trials that examined the same outcome, but used different measures.
Unit of analysis issues
Cluster‐randomised trials
We included cluster‐randomised trials in the analyses along with individually‐ randomised trials. We adjusted the sample sizes using the methods described in the Cochrane Handbook for Systematic Reviews of Interventions Section 16.3.4 using an estimate of the intracluster correlation co‐efficient (ICC) derived from the trial. We synthesised the relevant information from the cluster‐randomised trials and individually‐randomised trials we identified. We considered it reasonable to combine the results from both as there was little heterogeneity between the study designs and the interaction between the effect of intervention and the choice of randomisation unit was considered to be unlikely.
We also acknowledged heterogeneity in the randomisation unit and performed a sensitivity analysis to investigate the effects of the randomisation unit.
Other unit of analysis issues
In Sen 2006, data for the mother‐infant attachment outcome were collected for each twin. We took the 'worst' score from the two twins so we did not miss a 'bad outcome'.
Dealing with missing data
For included studies, we noted levels of attrition. We explored the impact of including studies with high levels of missing data in the overall assessment of treatment effect by using sensitivity analysis. We compared those trials where 80% of data on a given outcome were available for those who were originally randomised versus those with less than 80%.
For all outcomes, we carried out analyses, as far as possible, on an intention‐to‐treat basis, i.e., we attempted to include all participants randomised to each group in the analyses, and all participants were analysed in the group to which they were allocated, regardless of whether or not they received the allocated intervention. The denominator for each outcome in each trial was the number randomised minus any participants whose outcomes were known to be missing.
Assessment of heterogeneity
We assessed statistical heterogeneity in each meta‐analysis using the T², I² and Chi² statistics. We regarded heterogeneity as substantial if T² was greater than zero and either I² was greater than 30% or there was a low P value (less than 0.10) in the Chi² test for heterogeneity.
Assessment of reporting biases
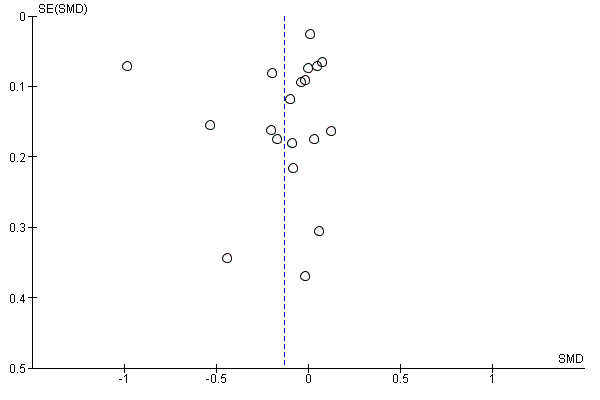
For the primary outcome (postpartum depression), if there were 10 or more studies in the meta‐analysis we investigated possible reporting biases (such as publication bias) using funnel plots. We assessed funnel plots visually, and if there had been any obvious asymmetry apparent we planned to seek statistical advice on carrying out formal tests for funnel plot asymmetry.
Data synthesis
We carried out statistical analysis using the Review Manager software (RevMan 2011). All trials were considered to include some form of 'talking therapy' and thus eligible to be combined in a meta‐analysis. We used fixed‐effect meta‐analysis for combining data where it was reasonable to assume that the studies were estimating the same underlying treatment effect: i.e., where trials examined similar interventions, and the trials’ populations and methods were judged sufficiently similar. If there was clinical heterogeneity sufficient to expect that the underlying treatment effects differed between trials, or if substantial statistical heterogeneity was detected, we used random‐effects meta‐analysis to produce an overall summary if an average treatment effect across trials was considered clinically meaningful. The random‐effects summary was treated as the average range of possible treatment effects and we discussed the clinical implications of treatment effects differing between trials. If the average treatment effect was not clinically meaningful, we did not combine trials. If we used random‐effects analyses, the results were presented as the average treatment effect with its 95% confidence interval, and the estimates of T² and I².
Subgroup analysis and investigation of heterogeneity
We planned and completed the following a priori subgroup analyses:
-
the effect of psychosocial interventions (e.g., antenatal/postnatal classes, professional home visits, lay home visits, lay telephone support, early postpartum follow‐up, continuity model of care);
-
the effect of psychological interventions (e.g., cognitive behavioural therapy, interpersonal psychotherapy, psychological debriefing);
-
the effect of intervention provider (e.g., professionally‐based and lay‐based interventions);
-
the effect of intervention mode (e.g., individual‐based and group‐based interventions);
-
the effect of intervention duration (e.g., single‐contact and multiple‐contact interventions);
-
the effect of intervention onset (e.g., antenatal‐only interventions, antenatal and postnatal interventions and postnatal‐only interventions);
-
the effects of sample selection criteria (e.g., interventions targeting women with specific risk factors and the general population).
Where data were available, the following postpartum depression outcomes were used in subgroup analysis:
-
depressive symptomatolgy (as defined by trialist, presented as dichotomous outcome;
-
mean depression scores (as defined by trialist, presented as continuous measure);
-
diagnosis of depression (as defined by trialist).
All outcomes were assessed at four time points across the postpartum period:
-
immediate (zero to eight weeks postpartum);
-
short term (nine to 16 weeks postpartum);
-
intermediate (17 to 24 weeks postpartum);
-
long term (more than 24 weeks postpartum).
For random‐effects and fixed‐effect meta‐analyses, we assessed differences between subgroups by inspection of the subgroups’ confidence intervals; non‐overlapping confidence intervals suggested a statistically significant difference in treatment effect between the subgroups. We also carried out formal sub‐group analysis available in RevMan 2011. Where data were available we set up analysis for all of the four time points described above, but in the text we have reported results only for outcomes measured at the final study assessment.
Sensitivity analysis
We performed sensitivity analyses, for the primary outcome, in instances in which any of the following occurred:
-
a high risk of bias associated with the methodological quality of included trials;
-
incomplete outcome data (more than 20% missing data) for any of the included trials.
Results
Description of studies
Please see table of Characteristics of included studies. Thirty trials, reported between 1995 and 2011, were identified and met the inclusion criteria. Two trials (Austin 2008; Heinicke 1999) that were otherwise eligible for inclusion in the review did not report usable data for our primary outcome. Further information about these studies can be found in the Characteristics of included studies tables but these trials will not be discussed below. In total, 16,912 women from 28 trials were included in the meta‐analyses.The trials were primarily conducted in Australia and the UK; four trials were conducted in the USA (Feinberg 2008; Gjerdingen 2002; Gorman 1997; Zlotnick 2001), two trials were conducted in China (Gao 2010; Tam 2003), and one trial was conducted in each of the following countries: Canada (Dennis 2009), Germany (Weidner 2010) and India (Tripathy 2010). While all trials included the outcome postpartum depression, several studies provided data on other variables including: maternal mortality (Tripathy 2010), maternal‐infant attachment (Armstrong 1999; Feinberg 2008; Sen 2006), anxiety (Dennis 2009; Gamble 2005; Gorman 1997; Lavender 1998; Sen 2006; Weidner 2010), maternal stress (Gamble 2005; Ickovics 2011), parental stress (Armstrong 1999; Cupples 2011; Sen 2006), perceived social support (Armstrong 1999; Brugha 2000; Gjerdingen 2002; Ickovics 2011; Lumley 2006; Morrell 2000; Reid 2002; Sen 2006),dissatisfaction with care provided (Armstrong 1999; MacArthur 2002; Sen 2006; Small 2000; Tam 2003; Waldenstrom 2000), infant health parameters such as full immunisation (MacArthur 2002), infant development (Cupples 2011), child abuse (Armstrong 1999), and marital discord (Gjerdingen 2002; Gorman 1997; Sen 2006).
Definition of postpartum depression
In all trials but seven (Cupples 2011; Feinberg 2008; Gjerdingen 2002; Ickovics 2011; Weidner 2010; Zlotnick 2001; Zlotnick 2006), postpartum depressive symptomatology was defined as a score above a specified cut‐off point on a self‐report measure; for the majority of studies (15) an Edinburgh Postnatal Depression Scale (EPDS) score greater than 12 (also reported as a 12/13 cut‐off score) indicated postpartum depression. Several studies also reported mean EPDS scores (Armstrong 1999; Dennis 2009; Gao 2010, Gorman 1997; Gunn 1998; Ickovics 2011; Le 2011; Lumley 2006; MacArthur 2002; Morrell 2000; Reid 2002; Sen 2006; Small 2000). Three additional trials used the EPDS to measure postpartum depression but incorporated a different cut‐off score; Brugha 2000 used a 10/11 cut‐off, while Morrell 2000 and Reid 2002 selected a 11/12 cut‐off. It is important to note that the EPDS does not diagnose postpartum depression (as this can only be accomplished through a psychiatric clinical interview) but rather it is the most frequently used instrument to assess for postpartum depressive symptomatology. Created to counter the limitations of other well‐established depression scales, the EPDS has been validated by standardised psychiatric interviews with large samples and has well‐documented reliability and validity in over 20 languages. Several other trials used a self‐report measure other than the EPDS and included the Beck Depression Inventory (BDI) (Le 2011; Zlotnick 2001; Zlotnick 2006), Center for Epidemiologic Studies Depression Scale (CES‐D) (Feinberg 2008; Ickovics 2011), Hospital Anxiety and Depression Scale (HADS) (Lavender 1998; Tam 2003; Weidner 2010), Kessler‐10 (Tripathy 2010), and the SF36 Mental Health Subscale (Cupples 2011; Gjerdingen 2002). For trials that used two self‐report measures of depression, if one was the EPDS then those data were used. Five trials incorporated a semi‐structured diagnostic interview to provide a clinical diagnosis of depression (Brugha 2000; Dennis 2009; Gorman 1997; Harris 2006; Zlotnick 2001) with four of these trials using the Structured Clinical Interview for DSM‐IV (SCID).
The timing of the outcome assessments varied considerably between studies, ranging from three (Lavender 1998) to more than 24 weeks (Armstrong 1999; Cupples 2011; Ickovics 2011; Le 2011; MacArthur 2002; Priest 2003; Sen 2006). Due to the significant differences in the timing of outcome data, we included an additional outcome assessment point that included data "at final study assessment".
Types of psychosocial interventions
The studies were subgrouped into categories to examine specific types of psychosocial interventions such as antenatal and postnatal classes/groups (Brugha 2000; Feinberg 2008; Gjerdingen 2002; Ickovics 2011; Reid 2002; Stamp 1995; Tripathy 2010), professional‐ (Armstrong 1999; MacArthur 2002) and lay‐based (Cupples 2011; Harris 2006; Morrell 2000) home visits, lay‐based telephone support (Dennis 2009), early postpartum follow‐up (e.g., routine postpartum care initiated earlier than standard practice) (Gunn 1998), continuity/models of care (Lumley 2006; Sen 2006; Waldenstrom 2000). In the majority of studies, the control group was reported to have received usual antenatal/postnatal care, which varied both between and within countries. Wherever there were individual study details on care received by the control group, these are presented in the Characteristics of included studies tables.
Types of psychological interventions
The studies were subgrouped into categories to examine specific types of psychological interventions, such as debriefing (Gamble 2005; Lavender 1998; Priest 2003; Small 2000; Tam 2003), cognitive behavioural therapy (Le 2011), interpersonal psychotherapy (Gao 2010, Gorman 1997; Weidner 2010; Zlotnick 2001; Zlotnick 2006).
Differences in intervention provider, mode of delivery, duration, and onset
The interventions were provided by a variety of professionals including nurses (Armstrong 1999; Brugha 2000; Lumley 2006; Tam 2003; Zlotnick 2006), physicians (Gunn 1998; Lumley 2006), midwives (Gamble 2005; Gao 2010; Ickovics 2011; Lavender 1998; MacArthur 2002; Priest 2003; Reid 2002; Sen 2006; Small 2000; Stamp 1995; Waldenstrom 2000), mental health specialists (Gorman 1997; Weidner 2010) including psychologists Gjerdingen 2002). In seven trials, the intervention was provided by lay individuals (Cupples 2011; Dennis 2009; Feinberg 2008; Harris 2006; Morrell 2000; Tripathy 2010) including trained research staff (Le 2011). Eleven trials (Brugha 2000; Feinberg 2008; Gao 2010; Gjerdingen 2002; Ickovics 2011; Le 2011; Reid 2002; Stamp 1995; Tripathy 2010; Zlotnick 2001; Zlotnick 2006) provided an intervention that was delivered to groups of women. If parts of the intervention were individualised and other parts were group‐based, the subgroup classification was determined by the main focus of the intervention. All trials but four (Gunn 1998; Lavender 1998; Priest 2003; Small 2000) provided multiple contacts as part of the intervention. Four trials (Gjerdingen 2002; Ickovics 2011; Weidner 2010; Zlotnick 2001) evaluated an intervention that was provided solely in the antenatal period. Twelve trials (Brugha 2000; Cupples 2011; Feinberg 2008; Gao 2010; Gorman 1997; Harris 2006; Le 2011; Sen 2006; Stamp 1995; Tripathy 2010; Waldenstrom 2000; Zlotnick 2006) incorporated an intervention that was initiated antenatally and continued into the postpartum period and 12 trials (Armstrong 1999; Dennis 2009; Gamble 2005; Gunn 1998; Lavender 1998; Lumley 2006; MacArthur 2002; Morrell 2000; Priest 2003; Reid 2002; Small 2000; Tam 2003) evaluated a postnatal‐only intervention
Differences in sample selection criteria
Twelve of the trials targeted at‐risk women based on various factors believed to put them at additional likelihood of developing postpartum depression (Armstrong 1999; Brugha 2000; Dennis 2009; Gamble 2005; Gorman 1997; Harris 2006; Le 2011; Stamp 1995; Tam 2003; Weidner 2010; Zlotnick 2001; Zlotnick 2006) while the other 16 trials enrolled women from the general population.
Risk of bias in included studies
Randomisation was performed most frequently by consecutively numbered, sealed, opaque envelopes (Gamble 2005; Gorman 1997; Harris 2006; Lavender 1998; Le 2011; Morrell 2000; Priest 2003; Reid 2002; Stamp 1995; Tam 2003; Waldenstrom 2000). Various forms of computer‐based randomisation was used by nine trials (Armstrong 1999; Brugha 2000; Cupples 2011; Feinberg 2008; Gao 2010; Gjerdingen 2002; Ickovics 2011; MacArthur 2002; Weidner 2010). Four trials incorporated a central, computerised randomisation service accessed by telephone (Gunn 1998; Small 2000) or the Web (Dennis 2009; Sen 2006) and two trials performed the randomisation of clusters at a public event (Lumley 2006; Tripathy 2010). Allocation concealment was unclear in four trials (Gao 2010; Lumley 2006; Zlotnick 2001; Zlotnick 2006). In all but three trials (Brugha 2000; Harris 2006; Le 2011) outcome data were collected by assessors blinded to group allocation or by mailed questionnaires; for three studies the method of collecting outcomes is unknown (Tam 2003; Zlotnick 2001; Zlotnick 2006). Six trials had a follow‐up rate less than 80%: Gunn 1998 (69.7% at 12 weeks); Harris 2006 (55.5% at 12 weeks); MacArthur 2002 (72.8% at 16 weeks); Reid 2002 (73.3% at 12 weeks); Waldenstrom 2000 (68.4% at eight weeks) and Weidner 2010 (47.8% at 52 weeks). It is noteworthy that follow‐up in all these trials except Harris 2006 was done by mailed questionnaires. Trials were excluded for sensitivity analyses related to high susceptibility to bias due to methodological quality (Brugha 2000; Harris 2006; Le 2011; Tam 2003; Weidner 2010; Zlotnick 2001; Zlotnick 2006) or follow‐up losses greater than 20% (Gunn 1998; Harris 2006; MacArthur 2002; Reid 2002; Waldenstrom 2000; Weidner 2010). A summary of the risk of bias for all included studies can be found in Figure 1 and Figure 2.

'Risk of bias' summary: review authors' judgements about each risk of bias item for each included study.

'Risk of bias' graph: review authors' judgements about each risk of bias item presented as percentages across all included studies.
Effects of interventions
Twenty‐eight trials, involving almost 17,000 women, were included in the meta‐analyses. The results are presented in sequential order, starting with maternal outcomes followed by infant and family outcomes. Because of the large number of outcomes in this review, the following summary of results has been restricted at times to present only final study comparisons. Please refer to the meta‐analyses graphs for the full results. According to our pre‐specified criteria, there was substantial statistical heterogeneity in many of the outcomes. We report results of random‐effects analyses for our main comparison (one) and for other comparisons for those outcomes with statistical heterogeneity. Random‐effects analyses provide an estimate of the average treatment effect and effects may differ considerably over different settings. Sensitivity analyses, conducted by removing trials with high likelihood of bias due to either methodological quality or follow‐up losses greater than 20%, altered some of the conclusions and these have been noted in the text. Sensitivity analyses were not completed for the clinical diagnosis of depression outcome for any comparison due to small trial numbers. Outcomes were categorised and presented in the results as follows:
-
zero to eight weeks ‐ immediate effects;
-
nine to 16 weeks ‐ short‐term effects;
-
17 to 24 weeks ‐ intermediate effects;
-
more than 24 weeks ‐ long‐term effects.
Main comparison one: all psychosocial and psychological interventions versus usual care ‐ various study outcomes
We considered eight maternal outcomes, three infant outcomes, and one family outcome. Between one and 20 trials contributed to the analyses of each outcome. In this comparison, we combined trials that have evaluated very different types of interventions and thus there could be substantial clinical heterogeneity. To address this, we used random‐effects analysis independent of statistical heterogeneity for all outcomes and, in view of this, we would advise caution in the interpretation of results.
A. Maternal outcomes
Primary outcome: postpartum depression at last study assessment (variously defined)
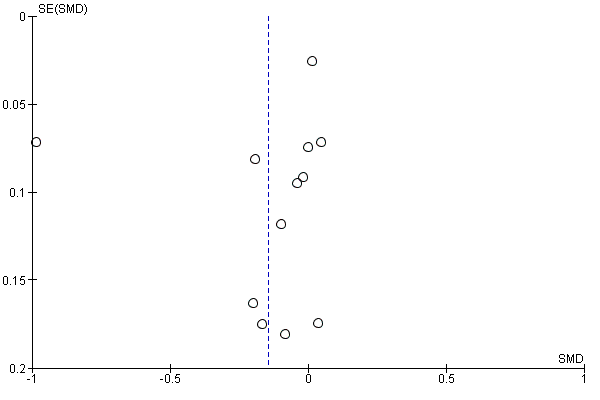
The main outcome measure for this review was postpartum depression at final study assessment. There was a beneficial effect on the prevention of depressive symptomatology in the meta‐analysis of all types of interventions (20 trials, n = 14,727, average risk ratio (RR) 0.78, 95% confidence interval (CI) 0.66 to 0.93, I² 64%, T² 0.07, I2 64%) (Analysis 1.1). The standard mean difference (SMD) among trials that provided mean scores was ‐0.13 (19 trials, n = 12,376, 95% CI ‐0.28 to 0.01, T2 0.08, I2 = 91%) (Analysis 1.2). For these outcomes we generated funnel plots to investigate possible reporting biases; visual assessment suggested no obvious plot asymmetry (Figure 3; Figure 4). A significant preventative effect was found among the few studies that included a clinical diagnosis of depression (five trials; n = 939; average RR 0.50, 95% CI 0.32 to 0.78, T2 0.00, I2 = 0%) (Analysis 1.3). When trials with high susceptibility to bias were temporarily removed (sensitivity analysis related to poor methodological quality or more than 20 loss to follow‐up rate), the direction of the effect remained the same for the depressive symptomatology (average RR 0.72, 95% CI 0.57 to 0.91) and also for the SMD in depression scores, although in this case the effect size was reduced when studies at high risk of bias were removed from the analysis (SMD ‐0.06, 95% CI ‐0.14 to 0.02) (data not shown).

Funnel plot of comparison: 1 All interventions versus usual care ‐ various study outcomes, outcome: 1.1 Depressive symptomatology at final study assessment.
Funnel plot of comparison: 1 All interventions versus usual care ‐ various study outcomes, outcome: 1.2 Mean depression scores at final study assessment.
Primary outcome: postpartum depression at eight, 16, 24 and more than 24 weeks (variously defined)
Results suggested an immediate (13 trials; n = 4,907; average RR 0.73, 95% CI 0.56 to 0.95, I² 61%, T² 0.13) and short‐term (10 trials; n = 3982; RR 0.73, 95% CI 0.56 to 0.97, I² 65%, T² 0.11) reduction in depressive symptomatology. The preventative effect appeared to weaken at the intermediate postpartum time period between 17 to 24 weeks (nine trials; n = 10,636; average RR 0.93, 95% CI 0.82 to 1.05, I² 15%, T² 0.01) and was again significant when depressive symptomatology was assessed past 24 weeks postpartum (five trials; n = 2936; average RR 0.66, 95% CI 0.54 to 0.82, I² 1%, T² 0.00) (Analysis 1.4). While no statistically significant preventative effect across the postpartum period was found among trials that examined mean depression scores a short‐term beneficial effect was found among trials that included a clinical diagnosis of depression (four trials; n = 902; average RR 0.49, 95% CI 0.31 to 0.77,T2 0.00, I2 = 0%) (Analysis 1.5; Analysis 1.6). When sensitivity analyses were performed, the short‐term effect in the reduction of depressive symptomatology was strengthened (six trials; n = 1322; RR 0.59, 95% CI 0.46 to 0.75, I² 1%, T² 0) and the difference in means scores became significant (six trials; n = 1061; SMD ‐0.19, 95% CI ‐0.31 to ‐0.07) (data not shown).
Secondary outcome: maternal mortality at more than 24 weeks
One cluster trial conducted in India evaluated maternal mortality at one year postpartum and found no beneficial effect (n = 234; RR 0.97, 95% CI 0.06 to 15.27) (Analysis 1.7).
Secondary outcome: maternal‐infant attachment at eight, 16, 24 and more than 24 weeks
No significant effect was found across the postpartum period in the one trial that dichotomised maternal‐infant attachment or the two trials that examined mean scores on a maternal‐infant measure (two trials; n = 268; SMD at final study assessment ‐0.18, 95% CI ‐0.42 to 0.06, ) (Analysis 1.8; Analysis 1.9).
Secondary outcome: anxiety at eight, 16, and more than 24 weeks
While at last study assessment, no significant effect was found when a dichotomous measure of anxiety was used (four trials; n = 959; average RR 0.40, 95% CI 0.14 to 1.14, I² 77%, T² 0.79) (Analysis 1.10), a significant decrease in mean anxiety scores was found (four trials; n = 815; SMD ‐0.16, 95% CI ‐0.30 to ‐0.03) (Analysis 1.11).
Secondary outcome: maternal stress at 16, 24, and more than 24 weeks
In a single trial (Gamble 2005), the intervention appeared to positively influence stress levels among women at any time in the postpartum period when measured as a dichotomous outcome (one trial; n = 103; RR 0.44, 95% CI 0.20 to 0.96) (Analysis 1.12). In another trial that measured mean stress scores there was no clear difference between groups for long‐term stress scores (one trial; n = 840; MD 0.50, 95% CI ‐0.51 to 1.51) (Analysis 1.13).
Secondary outcome: parental stress at eight, 24 and more than 24 weeks
At last study assessment, no significant difference in mean scores was found in relation to parental stress as measured using the Parenting Stress Index (PSI) (three trials, n = 465; SMD 0.11, 95% CI ‐0.25 to 0.48, I² 71%, T² 0.07) (Analysis 1.14). The PSI is an internationally used questionnaire to measure to identify parent‐child problem areas.
Secondary outcome: perceived social support at eight, 16, 24 and more than 24 weeks
Seven trials assessed maternal perceptions of support across the postpartum period using different measures; no beneficial effect was demonstrated at final study assessment (n = 8290; SMD 0.01, 95% CI ‐0.08 to 0.10, I² 45%, T² 0.01) (Analysis 1.16). Similar results were found when social support was measured as a dichotomous variable at final study assessment (two trials; n = 718; average RR 0.72, 95% CI 0.48 to 1.08) (Analysis 1.15).
Secondary outcome: maternal dissatisfaction with care provided at eight, 16, 24 and more than 24 weeks
At final study assessment, women in the intervention group who received some form of psychosocial or psychological intervention were less likely to be dissatisfied with the care they received than those who were provided with some form of standard care (four trials; n = 3014; average RR 0.67, 95% CI 0.44 to 1.00, I² 83%, T² 0.14) (Analysis 1.17). For trials that included a mean score of maternal dissatisfaction, no statistically significant difference was found between groups at final study assessment (two trials, n = 676; SMD 0.44, 95% CI ‐0.44 to 1.32, I² 96%, T² 0.39) (Analysis 1.18).
B. Infant outcomes
Secondary outcome: infant health parameters ‐ not fully immunised at more than 24 weeks
Only one trial reported on infant health parameters. There was no beneficial effect of protocol‐based midwifery‐led postpartum home visits on whether or not infants were fully immunised at one year postpartum (n = 884; RR 1.16, 95% CI 0.39 to 3.43) (Analysis 1.19).
Secondary outcome: infant development more than 24 weeks
One trial reported on infant development using the Bayley (BSID‐II). There was no beneficial effect identified of peer mentoring provided via home visits or the telephone on infant development measured at more than 24 weeks postpartum (n = 280; MD ‐0.90, 95% CI ‐2.90 to 1.10) (Analysis 1.20).
Secondary outcome: child abuse at eight and more than 24 weeks
One trial that evaluated the effect of a postpartum home visiting program by child health nurses among vulnerable families found a beneficial effect on child abuse potential scores in the immediate postpartum period (n = 176; MD ‐35.66, 95% CI ‐62.65 to ‐8.67) (Analysis 1.21) but not at one year postpartum (n = 66; MD ‐41.90, 95% CI ‐87.48 to 3.68) (Analysis 1.21).
C. Family outcomes
Secondary outcome: marital discord at eight, 16, and 24 weeks
There was no significant effect on marital discord scores at last study assessment (three trials, n = 291; SMD ‐0.14, 95% CI ‐0.37 to 0.09,) or across the postpartum period (Analysis 1.22).
Main comparison two: all psychosocial interventions versus usual care ‐ variations in intervention type
In total, 17 trials evaluated a psychosocial intervention. Overall, these interventions have a beneficial effect in decreasing the risk of depressive symptomatology at final study assessment (12 trials; n = 11,322; RR 0.83, 95% CI 0.70 to 0.99, I² 57%, T² 0.04) (Analysis 2.1). There was no obvious funnel plot asymmetry for this outcome at final study assessment (Figure 5; Analysis 2.4). A beneficial effect was found across the postpartum period from zero to eight weeks (six trials; n = 2138; RR 0.77, 95% CI 0.52 to 1.14, I² 63%, T² 0.14) to more than 24 weeks postpartum (three trials; n = 1385; RR 0.59, 95% CI 0.46 to 0.76, I² 0.0%, T² 0.0), although fewer trials collected longer‐term outcome data. A significant preventative effect at final study assessment was also found among the studies that included a clinical diagnosis of depression (three trials; n = 867; RR 0.52, 95% CI 0.33 to 0.83, fixed‐effect analysis) (Analysis 2.3). At final study assessment, the SMD for depression among trials that provided mean scores was ‐0.14 (12 trials, n = 10,944, 95% CI ‐0.33 to 0.04, I² 94%, T² 0.10) (Analysis 2.2); there was no obvious funnel plot asymmetry for this outcome (Analysis 2.5; Figure 6). Sensitivity analyses strengthened the preventive effect across the postpartum period in relation to depressive symptomatology but did not change any of the mean depression score conclusions.

Funnel plot of comparison: 2 All psychosocial interventions versus usual care ‐ variations in intervention type, outcome: 2.4 All psychosocial interventions: depressive symptomatology at final study assessment.
Funnel plot of comparison: 2 All psychosocial interventions versus usual care ‐ variations in intervention type, outcome: 2.5 All psychosocial interventions: mean depression scores.
Main comparison three: all psychological interventions versus usual care ‐ variations in intervention type
In total, 11 trials evaluated a psychological intervention. The average RR for depressive symptomatology at final assessment for psychological interventions was 0.61 (eight trials; n = 3405, 95% CI 0.39 to 0.96, I² 75%, T² 0.27) (Analysis 3.1). Across the postpartum period, the only time a statistically significant beneficial effect was found was at nine to 16 weeks (two trials; n = 277; average RR 0.40, 95% CI 0.18 to 0.89, I² 37%, T² 0.12). The SMD among trials that provided mean scores for depression was ‐0.10 (seven trials, n = 1432; 95% CI ‐0.32 to 0.13) (Analysis 3.2). No significant preventative effect was found among the studies that included a clinical diagnosis of depression (two trials; n = 72; average RR 0.31, 95% CI 0.04 to 2.52, I² 50%, T² 1.25) (Analysis 3.3). Sensitivity analyses weakened the preventive effect in relation to depressive symptomatology at final assessment but did not change the negative mean depression score conclusion.
Subgroup comparisons (comparisons four to 11)
Influence of variations in psychosocial interventions (comparison four)
Data were available for all types of psychosocial interventions for depressive symptomatology at final study assessment. While overall 16 trials contributed data to the pooled results, the number of trials examining specific types of interventions was limited (ranging from one to four) and the results of subgroup interaction tests should therefore be interpreted with caution. We identified some evidence of differences between subgroups for depressive symptomatology at final study assessment (X² = 16.37, P = 0.006) (Analysis 4.1). We found no statistically significant preventive effect on depressive symptomatology at final study assessment when the interventions were antenatal and postnatal classes (four trials, n = 1488; RR 1.01, 95% CI 0.77 to 1.32, I² 0%,T² 0.0), postpartum lay‐based home visits (one trial, n = 493; RR 0.88, 95% CI 0.62 to 1.25), early postpartum follow‐up (one trial, n = 446; RR 0.90, 95% CI 0.55 to 1.49), or continuity/model of care (three trials, n = 7021; RR 0.99, 95% CI 0.71 to 1.36, I² 60%,T² 0.05) (Analysis 4.1). However, we found a beneficial effect when the intervention involved postpartum professional‐based home visits (two trials, n = 1262; RR 0.56, 95% CI 0.43 to 0.73, I² 0%,T² 0.0) and for postpartum lay‐based telephone support (one trial, n = 612; RR 0.54, 95% CI 0.38 to 0.77) (Analysis 4.1). Due to the small number of trials examining specific types of interventions, sensitivity analyses were not completed.
Influence of variations in psychological interventions (comparison five)
We did not have sufficient data from all studies examining different types of psychological interventions to allow us to carry out a complete subgroup analysis for depressive symptomatology at final study assessment: only studies examining psychological debriefing and cognitive behavioural therapy contributed to this analysis. We found no statistically significant preventive effect at final study assessment for psychological debriefing (five trials, n = 3050; RR 0.57, 95% CI 0.31 to 1.03, I² 85%, T² 0.37) and cognitive behavioural therapy (one trial, n = 150; RR 0.74, 95% CI 0.29 to 1.88) (Analysis 5.1). Mean depression scores at final study assessment were reported in studies examining interpersonal psychotherapy (five trials, n = 366; SMD ‐0.27, 95% CI ‐0.52 to ‐0.01 I² 25%, T² 0.02) and cognitive behavioural therapy (one trial, n = 150; SMD 0.13, 95% CI ‐0.20 to 0.45) (Analysis 5.2). The test for subgroup differences was not significant (X² = 3.50, P = 0.06, I² 71.4%) (Analysis 5.2). Due to the small number of trials examining specific types of interventions, sensitivity analyses were not completed.
Influence of variations in intervention provider (comparison six)
Outcome: professionally‐based and lay‐based interventions
In total, 19 trials evaluated an intervention provided by a health professional. The average RR for depressive symptomatology at final assessment for professionally‐based interventions was 0.78 (15 trials; n = 6790, 95% CI 0.60 to 1.00, I² 70%, T² 0.15) (Analysis 6.7). The SMD at final assessment among trials that provided mean scores was ‐0.15 (12 trials, n = 4509; 95% CI ‐0.40 to 0.10, I² 93%, T² 0.17) (Analysis 6.8). Only two studies included a clinical diagnosis of depression (n = 227; RR 0.56, 95% CI 0.22 to 1.47, fixed‐effect analysis) (Analysis 6.9). Seven trials evaluated an intervention provided by a lay individual. The RR for depressive symptomatology at final assessment for lay‐based interventions was 0.70 (four trials; n = 1723, 95% CI 0.54 to 0.90) (Analysis 6.7). The SMD at final assessment among trials that provided mean scores was ‐0.10 (five trials, n = 1682; 95% CI ‐0.20 to 0.01, I² 8%, T² 0.0) (Analysis 6.8). Among the two studies that included a clinical diagnosis of depression between nine to 16 weeks postpartum (final study assessment for both trials) the RR was 0.52 (n = 677; 95% CI 0.32 to 0.86, fixed‐effect analysis) (Analysis 6.9). The test for subgroup differences between professionally‐based and lay‐based interventions was not significant for depressive symptomatology, mean depression scores, or clinical diagnosis of depression. Sensitivity analyses did not change any of the final conclusions.
Influence of variations in professionally‐based intervention provider (comparison seven)
Data were available for all types of professionally‐based interventions for depressive symptomatology at final study assessment. While overall 19 trials contributed data to the meta‐analyses, the number of trials examining a specific type of intervention provider was limited, ranging from one to 10. In relation to depressive symptomatology at final study assessment, we found no evidence that a specific health professional providing an intervention increased the likelihood of a preventative effect. The RR for the specific health professionals were as follows: nurses (three trials, n = 837; RR 0.73, 95% CI 0.51 to 1.04, I² 0%, T² 0.0), physicians (one trial, n = 446; RR 0.90, 95% CI 0.55 to 1.49), midwives (10 trials, n = 5477; RR 0.76, 95% CI 0.54 to 1.07, I² 80%, T² 0.22), mental health professional (one trial, n = 30; RR 1.00, 95% CI 0.24 to 4.18) (Analysis 7.1). Similar non‐significant results were found in relation to mean depression scores at final study assessment. Due to multiple health professionals providing the community‐based intervention with no clear primary provider, the trial by Lumley 2006 could not be included in this comparison. There were insufficient trials to complete an analysis in relation to a clinical diagnosis of depression. The test for subgroup differences was not significant for depressive symptomatology or mean depression scores (Analysis 7.1; Analysis 7.2).
Influence of variations in intervention mode (comparison eight)
Outcome: individually‐based and group‐based interventions
Analysis of 14 trials of interventions provided to individual women suggested a reduction in depressive symptomatology at the last study assessment (n = 12,914; RR 0.75, 95% CI 0.61 to 0.92, I² 72%, T² 0.09) (Analysis 8.7). When trials susceptible to bias (more than 20% loss to follow‐up) were removed, the direction of the effect strengthened (11 trials, n = 10,653; RR 0.71, 95% CI 0.56 to 0.91, I² 70%, T² 0.09) (data not shown). At final study assessment, the SMD among trials that provided mean scores was ‐0.15 (11 trials, n = 10,092; 95% CI ‐0.37 to 0.07, I² 94%, T² 0.11) (Analysis 8.8) and the RR for a clinical diagnosis of depression was significant (three trials; n = 714; RR 0.53, 95% CI 0.33 to 0.84) (Analysis 8.9). Sensitivity analyses did not change any of the final conclusions.
Of the six trials evaluating interventions delivered to groups of women, there was no clear reduction in depressive symptomatology at final study assessment (n = 1813; RR 0.92, 95% CI 0.71 to 1.19, I² 7%, T² 0.09) (Analysis 8.7). When sensitivity analysis was performed and trials with more than 20% loss to follow‐up were removed, there continued to be no clear beneficial effect (three trials; n = 779; RR 0.87, 95% CI 0.60 to 1.28) (data not shown). No beneficial effect was found in relation to mean depression scores at final study assessment (eight trials, n = 2284; SMD ‐0.08, 95% CI ‐0.23 to 0.06) (Analysis 8.8). Similary, no clear beneficial effect was found in relation to a clinical diagnosis of depression at final study assessment between nine to 16 weeks (two trials, n = 225; RR 0.30, 95% CI 0.05 to 1.66, I² 32%,T² 0.59) (Analysis 8.9). The test for subgroup differences between individually‐based and group‐based interventions was not significant for depressive symptomatology, mean depression scores, or clinical diagnosis of depression (Analysis 8.7; Analysis 8.8; Analysis 8.9). Sensitivity analyses did not change any of the final conclusions.
Influence of variations in intervention duration (comparison nine)
Outcome: single‐contact and multiple‐contact interventions
Only four trials evaluated a single‐contact intervention (e.g. psychological debriefing, early postpartum follow‐up). The RR related to depressive symptomatology at final assessment was 0.70 (four trials, n = 2877; 95% CI 0.38 to 1.28, I² 84%, T² 0.30) (Analysis 9.6) and the mean depression scores at final study assessment was 0.04 (two trials, n = 1362; 95% CI ‐0.07 to 0.15, I² 5%) (Analysis 9.7). Sensitivity analyses did not change any of the final conclusions.
Of the 24 trials evaluating a multiple‐contact intervention, there was a reduction in depressive symptomatology at final study assessment (16 trials, n = 11,850; average RR 0.78, 95% CI 0.66 to 0.93, I² 53%, T² 0.05) (Analysis 9.6). Similarly, the average RR for a clinical diagnosis of depression at final study assessment was significant (five trials, n = 939; RR 0.48, 95% CI 0.31 to 0.74, I² 0%) (Analysis 9.5). The SMD in the 17 trials that provided mean depression scores was ‐0.15 (n = 11,014; 95% CI ‐0.32 to 0.02, I² 92%, T² 0.10) (Analysis 9.7). Sensitivity analyses did not change any of the final conclusions.
There appears to be no strong evidence of subgroup differences for interventions involving a single contact as opposed to more intensive interventions involving multiple contacts for depressive symptomatology at final study assessment (I² = 0%, P = 0.73) (Analysis 9.6). There was a trend that mean depression scores were lower at final study assessment where interventions involved multiple rather that single contacts (test for subgroup differences I² = 71.4%, P = 0.06) (Analysis 9.7). However, this result should be interpreted with caution, as while results for this outcome were derived from 17 studies involving multiple contacts, it was measured in only two with single contacts.
Influence of variations in intervention onset (comparison 10)
Outcome: interventions with antenatal‐only component, antenatal and postnatal components, and postnatal‐only component
Four trials evaluated an intervention that was conducted only in the antenatal period and the SMD at final study assessment was 0.03 (n = 1050; 95% CI ‐0.09 to 0.16) (Analysis 10.10). Eight trials evaluated interventions that were initiated antenatally and continued postnatally. The average RR in relation to depressive symptomatology at final assessment was 0.96 (eight trials, n = 1941; 95% CI 0.75 to 1.22, I² 6%, T² 0.01) (Analysis 10.9) and the SMD was ‐0.14 (seven trials, n = 1000; 95% CI ‐0.31 to 0.02, I² 37%, T² 0.02) (Analysis 10.10). While a significant effect was found related to a clinical diagnosis of depression (three trials, n = 292; RR 0.44, 95% CI 0.24 to 0.80, fixed‐effect analysis), it is noteworthy that two out of the three trials (Brugha 2000; Harris 2006) included in this analysis were identified as high risk for bias. Of the 12 trials that evaluated an Intervention that was initiated postnatally, a significant reduction in depressive symptomatology at final study assessment was found (n = 12,786; average RR 0.73, 95% CI 0.59 to 0.90, I² 75%, T² 0.09) (Analysis 10.9). However, no preventative effects were found in relation to mean depression scores (eight trials, n = 10,326; SMD ‐0.16, 95% CI ‐0.40 to 0.08, I² 96%, T² 0.11) (Analysis 10.10) or a clinical diagnosis of depression (one trial, n = 612; RR 0.65, 95% CI 0.34 to 1.23) (Analysis 10.11) at final study assessment. There was no strong evidence of differences between subgroups for outcomes at the final study assessment. For depressive symptomatology, mean depression scores, and diagnosis of depression there was heterogeneity between subgroups, however, there was also considerable heterogeneity within some subgroups; tests for subgroup differences for these outcomes were not statistically significant. Sensitivity analyses did not change any of the final conclusions.
Influence of variations in sample selection criteria (comparison 11)
Outcome: interventions for at‐risk women and women drawn from the general population
In the eight trials that selected participants based on 'at‐risk' criteria, a reduction in postpartum depressive symptomatology at final study assessment was found (eight trials, n = 1853; average RR 0.66, 95% CI 0.50 to 0.88, I² 23%, T² 0.04) (Analysis 11.6). Participants in the intervention groups in these trials also had lower mean depression scores (seven trials, n = 1087; SMD ‐0.13, 95% CI ‐0.25 to ‐0.01, I² 0%, T² 0.00) (Analysis 11.7) and were less likely to be diagnosed with clinical depression (five trials, n = 939; RR 0.48, 95% CI 0.31 to 0.74, fixed‐effect analysis). When sensitivity analyses were performed, the direction of the effect at final study assessment in relation to depressive symptomatology remained the same but the CI widened (five trials, n = 997; RR 0.60, 95% CI 0.35 to 1.02, I² 45%, T² 0.16) (data not shown). The beneficial effect related to a diagnosis with clinical depression disappeared when three out of the five trials (Brugha 2000; Harris 2006; Zlotnick 2001) were deemed high risk for bias and were removed from the analysis (two trials, n = 649; RR 0.64, 95% CI 0.36 to 1.15, I² 0%, T² 0.0) (data not shown). Twelve trials enrolled women from the general population. The average RR related to depressive symptomatology at final study assessment was 0.83 (12 trials, n = 12,874; 95% CI 0.68 to 1.02, I² 71%, T² 0.07) (Analysis 11.6) and the SMD was ‐0.15 (12 trials, n = 11,289; 95% CI ‐0.33 to 0.04, I² 94%, T² 0.10) (Analysis 11.7). There was no strong evidence of differences between these subgroups at final study assessment for depressive symptomatology or mean scores, although there was much greater heterogeneity in the results of studies including women from the general population (I² = 94%) compared with those recruiting women at high‐risk only (I² = 0%). Sensitivity analyses did not change any of the final conclusions.
Discussion
This review summarises the results of 28 trials involving almost 17,000 women, that were conducted in seven countries under a wide variety of circumstances. The methodological quality of the included trials was good to excellent with the most frequently identified weakness being follow‐up attrition. In particular, six trials had losses to follow‐up greater than 20% with five of these trials collecting outcome data from mailed questionnaires. The removal of trials at risk of bias resulted in minimal changes to any of the conclusions. While intent‐to‐treat data analyses were performed, several trials involving group sessions had high (Brugha 2000; Reid 2002; Stamp 1995) or unknown (Tripathy 2010) levels of non‐compliance with group attendance. Further, the reporting of the trials was often not comprehensive, lacking in terms of details in the training and qualifications of the intervention providers and in the description of adherence to the intervention protocol. There was also a failure to present details of the informational element of the interventions and on the background features of the care received by the control groups.
In the primary comparison, the diversity of preventative interventions and the widely differing study end‐points should urge some caution in the interpretation of the pooled data. To partially address this issue, the meta‐analyses included immediate, short, intermediate, and longer‐term effects where appropriate. Despite this caution and the subgrouping of end‐points, this review has demonstrated that women who received a psychosocial or psychological intervention were significantly less likely to experience postpartum depression than those who received standard care (average risk ratio (RR) 0.78, 95% confidence interval (CI) 0.66 to 0.93). Psychosocial (average RR 0.83, 95% CI 0.70 to 0.99) and psychological (average RR 0.61, 95% CI 0.39 to 0.96) interventions were both effective in reducing the risk to develop depressive symptomatology at final study assessment.
Importantly, the review has assisted in specifying what interventions may be effective or not and require further investigation. Although there was no clear evidence of differences between subgroups in trials focusing on different types of psychosocial interventions, antenatal classes addressing postpartum depression have been shown in four trials to have no preventative effect (average RR 1.01, 95% CI 0.77 to 1.32) and cannot be recommended at this time. In four of five trials evaluating in‐hospital psychological debriefing there was some evidence of positive effect, but overall, pooled results showed that differences between groups were not statistically significant and more evidence is needed before this intervention is implemented into practice (RR 0.57, 95% CI 0.31 to 1.03).The effectiveness of postpartum lay‐based home visits remains uncertain. Morrell 2000 demonstrated that the addition of home visits by a community support worker had no protective effect on postpartum depression (RR 0.88, 95% CI 0.62 to 1.25). However, a review of the intervention activities revealed that the lay women spent a significant amount of their time providing instrumental support, such as housework and infant care, and limited time providing emotional and appraisal (feedback) support to the mother. The potential to positively influence health outcomes depends on predicting which supportive functions will be the most effective for a particular type of stressor (Will 2000). In qualitative studies, women from diverse cultures who have suffered from postpartum depression consistently describe their feelings of loneliness, worries about maternal competence, role conflicts, and inability to cope (Chen 1999; Nahas 1999; Ritter 2000; Small 1994); the presence or absence of instrumental support was not a highlighted factor. The preventative effect of cognitive behavioural therapy also remains uncertain, primarily due to the fact that only one study contributing data to the review (Le 2011) evaluated this type of intervention. Another trial (Austin 2008) also evaluated cognitive behaviour therapy and was included in the review but not the meta‐analysis due to the lack of usable data; this study reported no clear differences between intervention and control groups for depression outcomes. Improving the quality of perinatal care provided to women has been another postpartum depression preventative approach. Two trials have evaluated the effect of early postpartum follow‐up. Although one quasi‐experimental study was not included in this review (Serwint 1991), another well‐designed trial demonstrated no beneficial effect on maternal mental health outcomes (Gunn 1998). However, the intervention in this trial did not included a formal assessment of maternal mood during the early postpartum contact. It is well documental that without a formal assessment, most depressive symptomatology remain undetected by primary care health professionals. Three trials evaluated continuity/models of care interventions (Lumley 2006; Sen 2006; Waldenstrom 2000) without demonstrating a preventative effect. The impressive community‐based cluster trial by Lumley 2006 was particularly comprehensive where the intervention incorporated strategies at both the primary care and community levels. However, the significant changes to the local government implemented by the State government was not the ideal context for a community‐based intervention. Replicating multi‐component trials like this are warranted.
There is growing evidence to suggest the importance of additional professional‐based home visits provided postnatally (RR 0.56, 95% CI 0.43 to 0.73). While one well‐designed trial (Armstrong 1999) suggested intensive nursing home visits with at‐risk mothers was protective during the first six weeks postpartum, the beneficial effect was not maintained to 16 weeks. It is noteworthy that the 16‐week assessment coincided with a decrease in intervention intensity from weekly to monthly nursing visits. Results from a cluster‐randomised controlled trial (MacArthur 2002) demonstrated that flexible, individualised midwifery‐based postpartum care that incorporated postpartum depression screening tools also had a preventive effect. Individualised, telephone‐based lay support provided by peers postnatally (Dennis 2009) is another promising intervention (RR 0.54, 95% CI 0.38 to 0.77). Combined, these three trials decreased the risk to develop postpartum depression by almost 50% and provide accumulating evidence that additional individualised support early in the postpartum period is an effective preventative intervention. Another strategy that may assist in preventing postpartum depression is interpersonal psychotherapy (standardised mean difference (SMD) ‐0.27, 95% CI ‐0.52 to ‐0.01). Interpersonal psychotherapy is a manual‐based, time‐limited psychotherapeutic approach with a basic premise that depression, regardless of aetiology, is initiated and maintained within an interpersonal context. The goal of interpersonal psychotherapy is to achieve symptomatic relief for depression by addressing current interpersonal issues associated with its onset or perpetuation; it does not seek to attribute interpersonal problems to underlying personality characteristics or unconscious motivations. Interpersonal psychotherapy is primarily concerned with symptom functioning, presumed to have biological and psychological precipitants, and social functioning. There is a specific focus on social interactions. Given that a lack of support and marital conflict are two strong risk factors for postpartum depression (Beck 2001; O'Hara 1996), this intervention is theoretically congruent with preventing postpartum depression.
While there was diversity in the types of intervention provided, most of the trials included in this review incorporated a primary preventative intervention; only one trial (Dennis 2009) selected participants within the first two weeks postpartum based on evidence of beginning depressive symptomatology. According to Shah 1998, preventative interventions incorporate any strategy that (1) reduces the likelihood of a disease/condition affecting an individual (primary prevention); (2) interrupts or slows the progress of a disease/condition through early detection and treatment (secondary prevention); or (3) slows the progress of a disease/condition and reduces resultant disability through treatment of established disease (tertiary prevention). These preventative interventions can be further classified into different categories depending on the target population: (1) universal interventions are designed to be offered to all women; (2) selective interventions are designed to be offered to women at increased risk of developing depression; and (3) indicated interventions are designed to be offered to women who have been identified as depressed or probably depressed (Mrazek 1994). To examine the effects of universal and selective interventions, subgroup analyses were conducted. The results suggest identifying mothers 'at‐risk' may assist in the prevention of postpartum depression (average RR 0.66, 95% CI 0.50 to 0.88). However, currently there is no consistency in the identification of women 'at‐risk' and a review of 16 antenatal screening tools suggests that there are no measures with acceptable predictive validity to accurately identify asymptomatic women who will later develop postpartum depression (Austin 2003). This may partially explain why interventions initiated in the postpartum period had a beneficial effect on reducing depressive symptomatology (average RR 0.73, 95% CI 0.59 to 0.90). Other differences in intervention delivery were also examined. Women who received a multiple‐contact intervention were less likely to develop postpartum depression (RR average 0.78, 95% CI 0.66 to 0.93). It is noteworthy that all but five trials provided a multi‐contact intervention. Individually‐based interventions were effective in significantly reducing the number of women with depressive symptomatology at last study assessment and across the various assessment time periods. The decreased effect related to groups could be due to high group attrition and thus insufficient intervention dosage. It may also underpin the fact that there are many unique barriers for pregnant women and new mothers to attend sessions outside of their homes. It is noteworthy that five out of the 11 trials evaluating group‐based interventions were classified as high risk of bias. Lastly, both professionally‐based (average RR 0.78, 95% CI 0.60 to 1.00) and lay‐based (average RR 0.70, 95% CI 0.54 to 0.90) interventions appeared beneficial in reducing the risk to develop depressive symptomatology at last assessment. The majority of the interventions included in this review were professionally‐based.
There was insufficient evidence to show that the preventative interventions had an effect on other maternal outcomes including mortality, maternal‐infant attachment, stress, perceived support, and marital discord. Most of these outcomes were measured in a relatively small number of trials. It is unclear if there was an effect on anxiety. However, women who received a preventative intervention were less likely to be dissatisfied with the care they received (average RR 0.67, 95% CI 0.44 to 1.00) than those who where provided with standard care. One study (MacArthur 2002) examined infant immunisations and found no beneficial effect; similar results were found with the one study (Cupples 2011) that evaluated infant development. Another study (Armstrong 1999) examined child abuse and while there was a short‐term gain when the nursing home visits were being offered, the beneficial effect was not maintained once the intervention discontinued. Very few trials evaluated these secondary outcomes and thus additional research in this area is warranted.
The long‐term consequences of postpartum depression suggest preventive approaches are warranted. Manipulation of a risk factor may improve the associated likelihood of developing postpartum depression through many different ways. The most obvious is to decrease the amount of exposure to a given risk factor or, alternatively, reduce the strength or mechanism of the relationship between the risk factor and postpartum depression (McLennan 2002). However, translating risk factor research into predictive screening protocols and preventative interventions is challenging, as complex interactions of biopsychosocial risk factors with individual variations need to be considered. Theoretical justifications for a couple of these preventative approaches were presented by the individual researchers and there is accumulating evidence available to guide practice and policy recommendations. Details of research currently in progress are provided in the Characteristics of ongoing studies table.

'Risk of bias' summary: review authors' judgements about each risk of bias item for each included study.
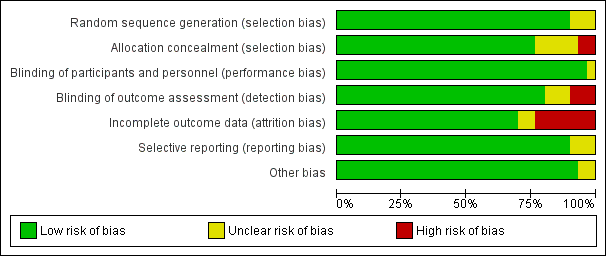
'Risk of bias' graph: review authors' judgements about each risk of bias item presented as percentages across all included studies.

Funnel plot of comparison: 1 All interventions versus usual care ‐ various study outcomes, outcome: 1.1 Depressive symptomatology at final study assessment.

Funnel plot of comparison: 1 All interventions versus usual care ‐ various study outcomes, outcome: 1.2 Mean depression scores at final study assessment.

Funnel plot of comparison: 2 All psychosocial interventions versus usual care ‐ variations in intervention type, outcome: 2.4 All psychosocial interventions: depressive symptomatology at final study assessment.

Funnel plot of comparison: 2 All psychosocial interventions versus usual care ‐ variations in intervention type, outcome: 2.5 All psychosocial interventions: mean depression scores.
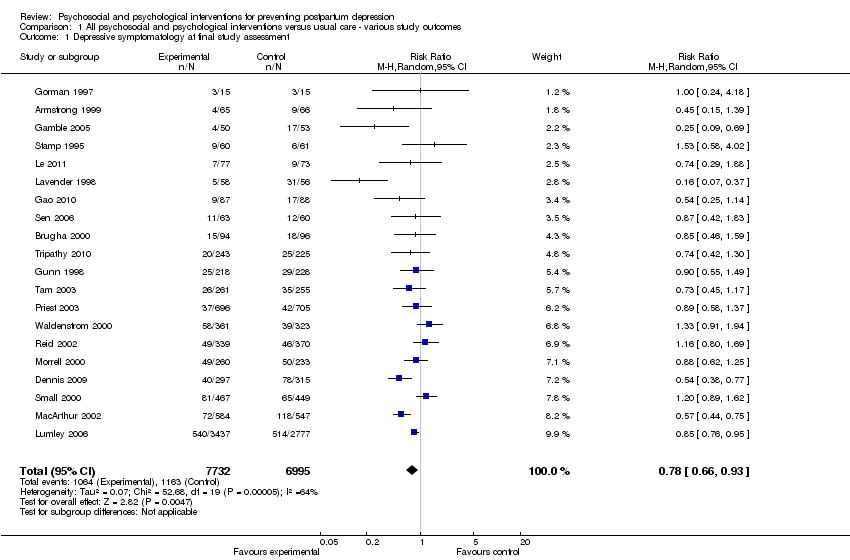
Comparison 1 All psychosocial and psychological interventions versus usual care ‐ various study outcomes, Outcome 1 Depressive symptomatology at final study assessment.

Comparison 1 All psychosocial and psychological interventions versus usual care ‐ various study outcomes, Outcome 2 Mean depression scores at final study assessment.

Comparison 1 All psychosocial and psychological interventions versus usual care ‐ various study outcomes, Outcome 3 Diagnosis of depression at final study assessment.
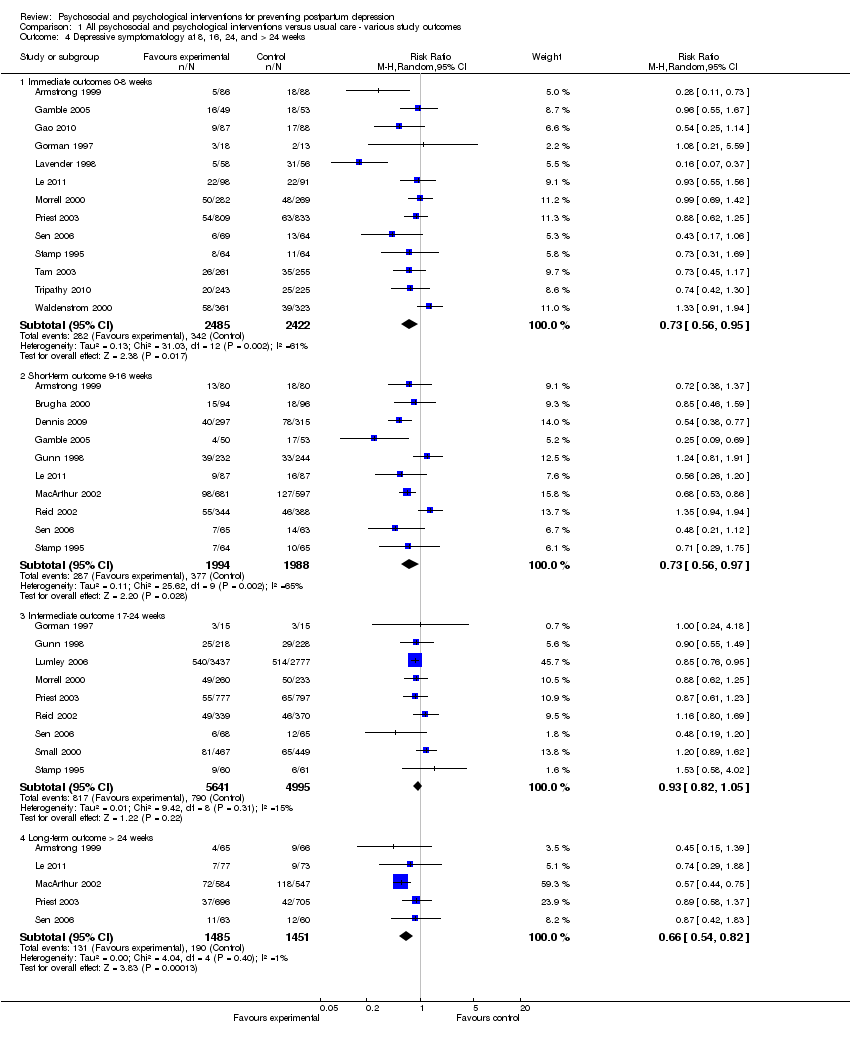
Comparison 1 All psychosocial and psychological interventions versus usual care ‐ various study outcomes, Outcome 4 Depressive symptomatology at 8, 16, 24, and > 24 weeks.
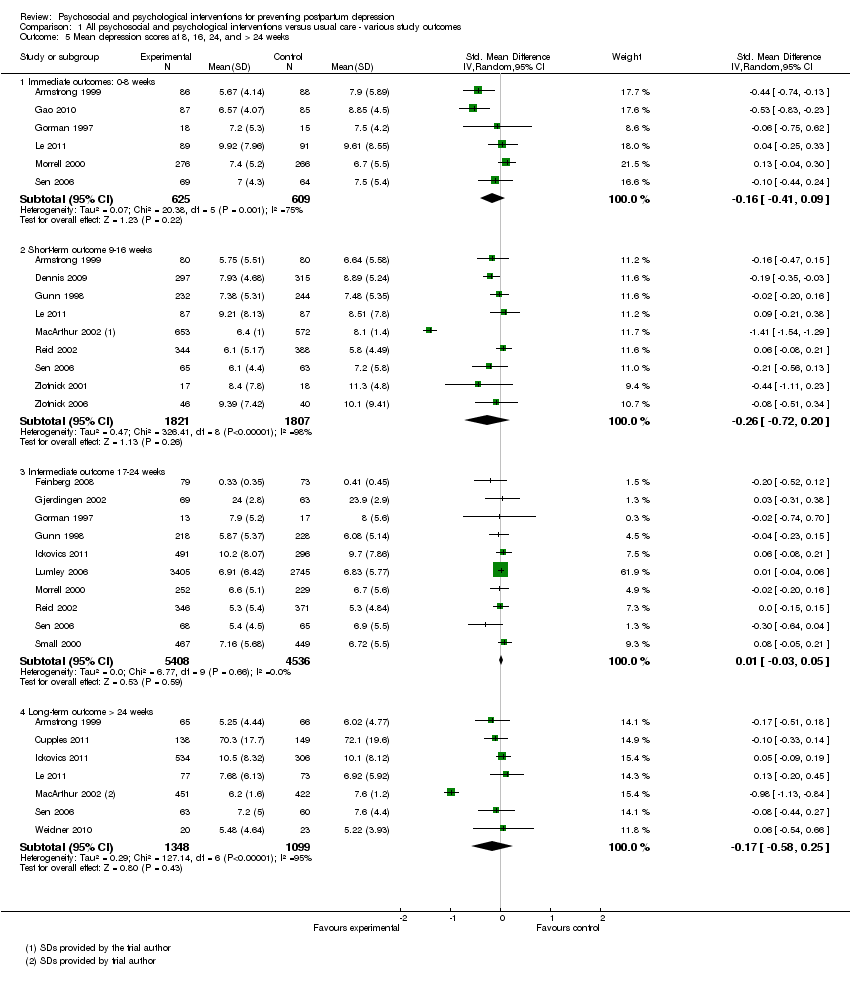
Comparison 1 All psychosocial and psychological interventions versus usual care ‐ various study outcomes, Outcome 5 Mean depression scores at 8, 16, 24, and > 24 weeks.

Comparison 1 All psychosocial and psychological interventions versus usual care ‐ various study outcomes, Outcome 6 Diagnosis of depression at 8, 16, 24, and > 24 weeks.
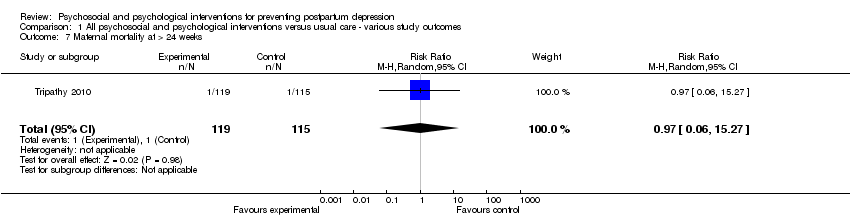
Comparison 1 All psychosocial and psychological interventions versus usual care ‐ various study outcomes, Outcome 7 Maternal mortality at > 24 weeks.

Comparison 1 All psychosocial and psychological interventions versus usual care ‐ various study outcomes, Outcome 8 Maternal‐infant attachment at 8, 16, and 24 weeks.

Comparison 1 All psychosocial and psychological interventions versus usual care ‐ various study outcomes, Outcome 9 Mean maternal‐infant attachment scores at 8, 16, 24, and > 24 weeks.

Comparison 1 All psychosocial and psychological interventions versus usual care ‐ various study outcomes, Outcome 10 Anxiety at 8, 16, and 24 weeks.

Comparison 1 All psychosocial and psychological interventions versus usual care ‐ various study outcomes, Outcome 11 Mean anxiety scores at 8, 16, 24, and > 24 weeks.

Comparison 1 All psychosocial and psychological interventions versus usual care ‐ various study outcomes, Outcome 12 Maternal stress at 16 weeks.

Comparison 1 All psychosocial and psychological interventions versus usual care ‐ various study outcomes, Outcome 13 Mean maternal stress scores at 24 and > 24 weeks.

Comparison 1 All psychosocial and psychological interventions versus usual care ‐ various study outcomes, Outcome 14 Mean parental stress scores at 8, 24, and > 24 weeks.

Comparison 1 All psychosocial and psychological interventions versus usual care ‐ various study outcomes, Outcome 15 Perceived social support at 8 and 16 weeks.

Comparison 1 All psychosocial and psychological interventions versus usual care ‐ various study outcomes, Outcome 16 Mean perceived social support scores at 8, 16, 24, and > 24 weeks.

Comparison 1 All psychosocial and psychological interventions versus usual care ‐ various study outcomes, Outcome 17 Maternal dissatisfaction with care provided at 8, 16, and 24 weeks.
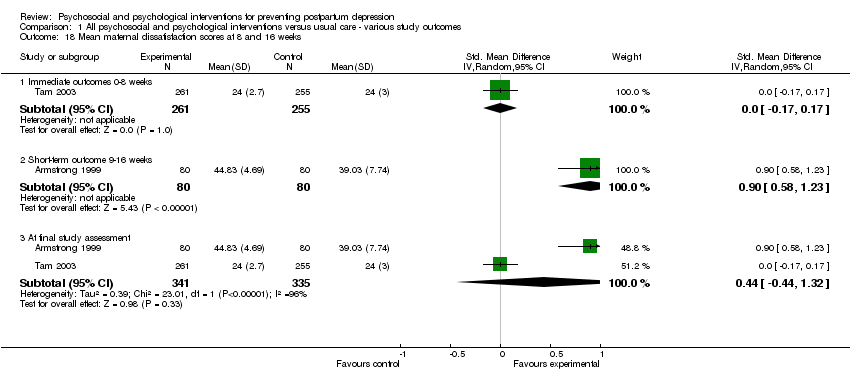
Comparison 1 All psychosocial and psychological interventions versus usual care ‐ various study outcomes, Outcome 18 Mean maternal dissatisfaction scores at 8 and 16 weeks.
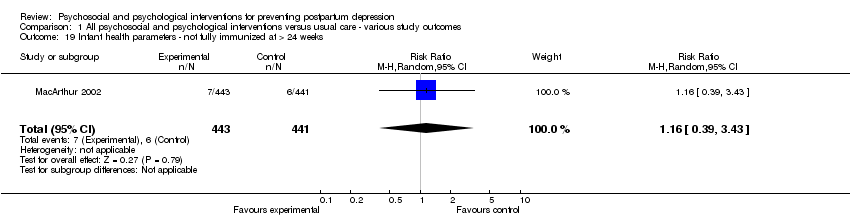
Comparison 1 All psychosocial and psychological interventions versus usual care ‐ various study outcomes, Outcome 19 Infant health parameters ‐ not fully immunized at > 24 weeks.

Comparison 1 All psychosocial and psychological interventions versus usual care ‐ various study outcomes, Outcome 20 Infant development > 24 weeks.
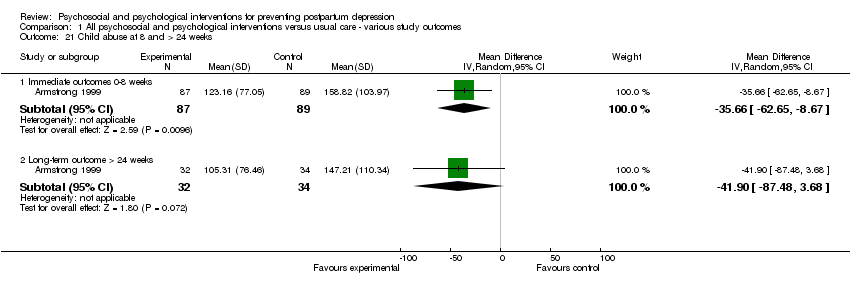
Comparison 1 All psychosocial and psychological interventions versus usual care ‐ various study outcomes, Outcome 21 Child abuse at 8 and > 24 weeks.

Comparison 1 All psychosocial and psychological interventions versus usual care ‐ various study outcomes, Outcome 22 Mean marital discord scores at 8, 16, and 24 weeks.

Comparison 2 All psychosocial interventions versus usual care ‐ variations in intervention type, Outcome 1 All psychosocial interventions ‐ depressive symptomatology.

Comparison 2 All psychosocial interventions versus usual care ‐ variations in intervention type, Outcome 2 All psychosocial interventions ‐ mean depression scores.
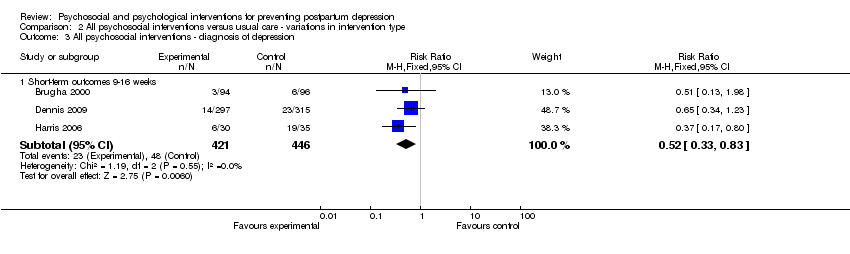
Comparison 2 All psychosocial interventions versus usual care ‐ variations in intervention type, Outcome 3 All psychosocial interventions ‐ diagnosis of depression.
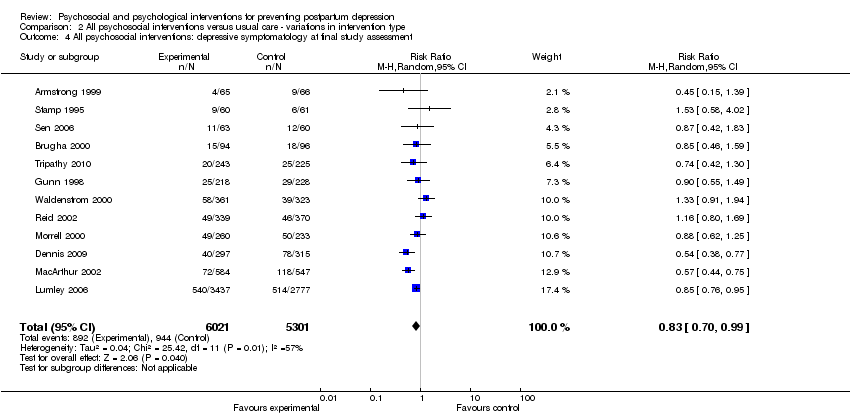
Comparison 2 All psychosocial interventions versus usual care ‐ variations in intervention type, Outcome 4 All psychosocial interventions: depressive symptomatology at final study assessment.
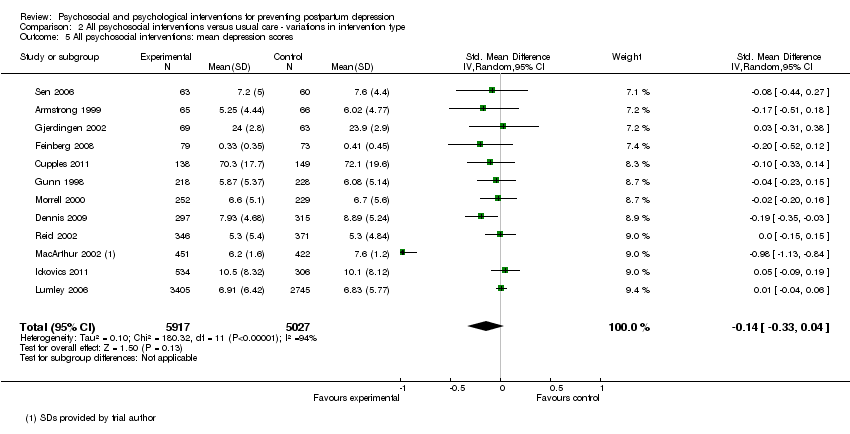
Comparison 2 All psychosocial interventions versus usual care ‐ variations in intervention type, Outcome 5 All psychosocial interventions: mean depression scores.

Comparison 3 All psychological interventions versus usual care ‐ variations in intervention type, Outcome 1 All psychological interventions ‐ depressive symptomatology.

Comparison 3 All psychological interventions versus usual care ‐ variations in intervention type, Outcome 2 All psychological interventions ‐ mean depression scores.
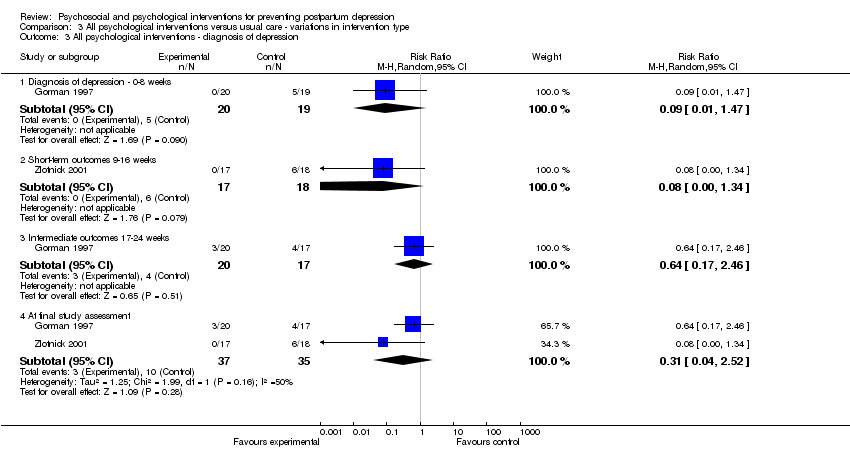
Comparison 3 All psychological interventions versus usual care ‐ variations in intervention type, Outcome 3 All psychological interventions ‐ diagnosis of depression.

Comparison 4 Subgroup analysis: variations in psychosocial interventions, Outcome 1 TEST FOR SUBGROUP DIFFERENCES: depressive symptomatology at final study assessment.
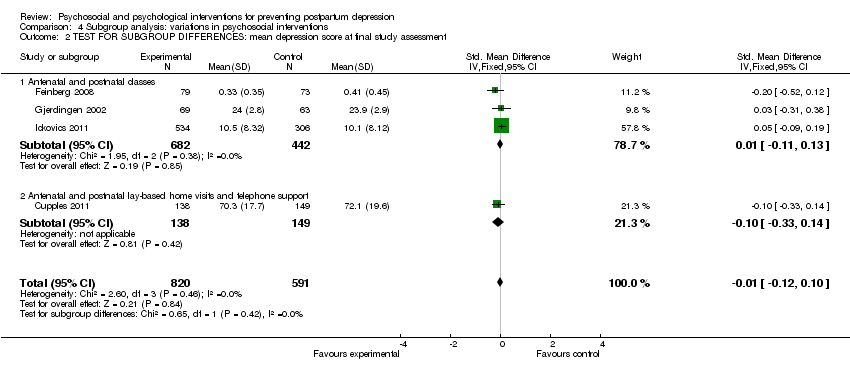
Comparison 4 Subgroup analysis: variations in psychosocial interventions, Outcome 2 TEST FOR SUBGROUP DIFFERENCES: mean depression score at final study assessment.

Comparison 5 Subgroup analysis: variations in psychological interventions, Outcome 1 TEST FOR SUBGROUP DIFFERENCES: depressive symptomatology at final study assessment.
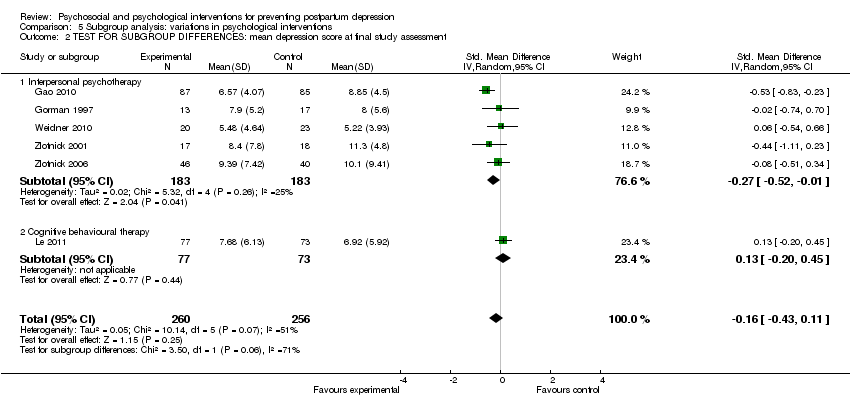
Comparison 5 Subgroup analysis: variations in psychological interventions, Outcome 2 TEST FOR SUBGROUP DIFFERENCES: mean depression score at final study assessment.
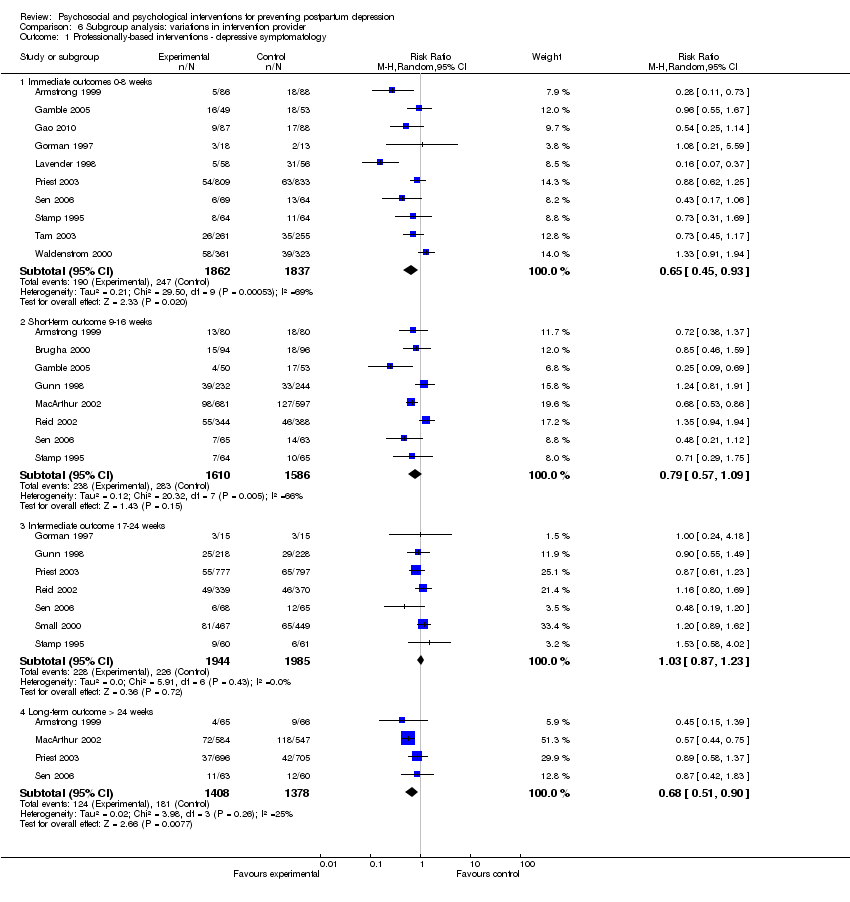
Comparison 6 Subgroup analysis: variations in intervention provider, Outcome 1 Professionally‐based interventions ‐ depressive symptomatology.

Comparison 6 Subgroup analysis: variations in intervention provider, Outcome 2 Professionally‐based interventions ‐ mean depression scores.
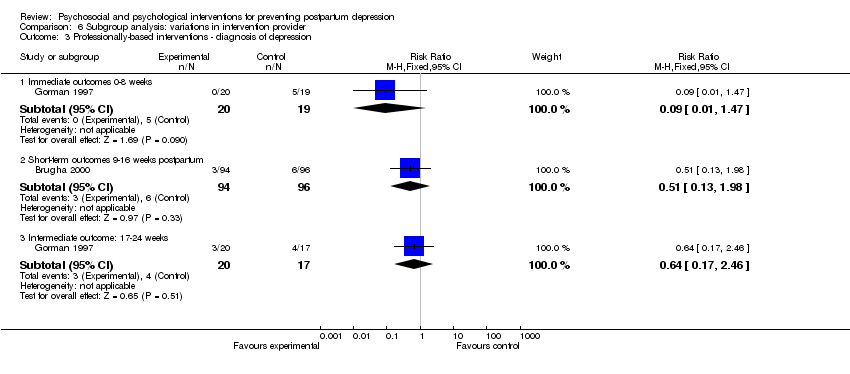
Comparison 6 Subgroup analysis: variations in intervention provider, Outcome 3 Professionally‐based interventions ‐ diagnosis of depression.
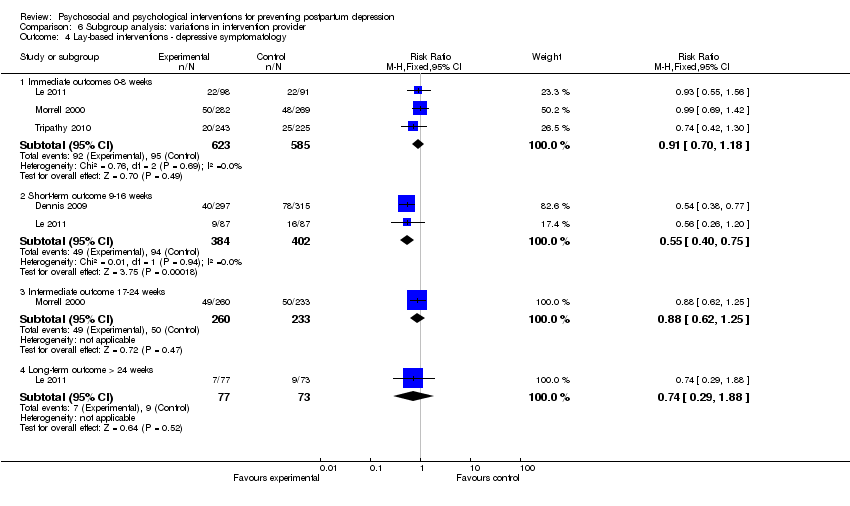
Comparison 6 Subgroup analysis: variations in intervention provider, Outcome 4 Lay‐based interventions ‐ depressive symptomatology.
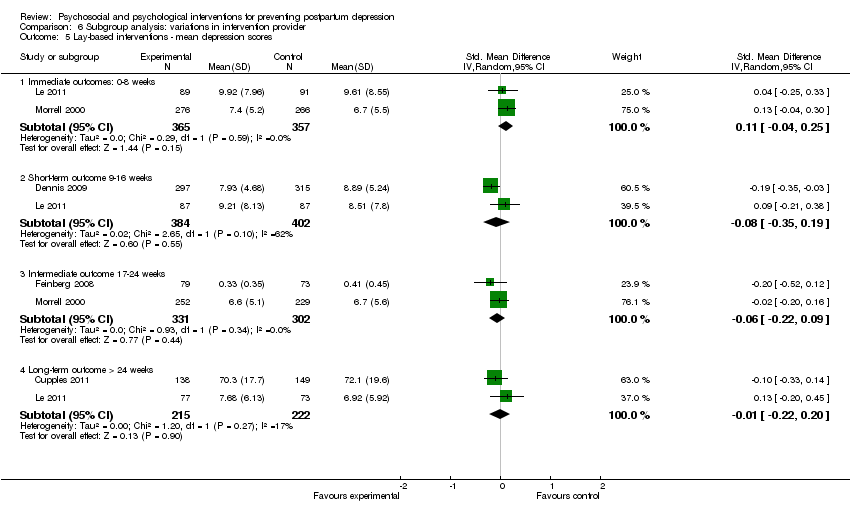
Comparison 6 Subgroup analysis: variations in intervention provider, Outcome 5 Lay‐based interventions ‐ mean depression scores.
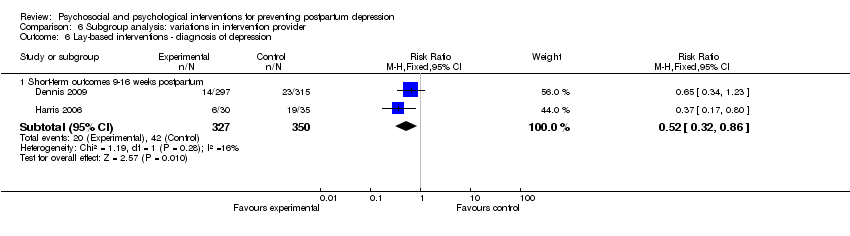
Comparison 6 Subgroup analysis: variations in intervention provider, Outcome 6 Lay‐based interventions ‐ diagnosis of depression.
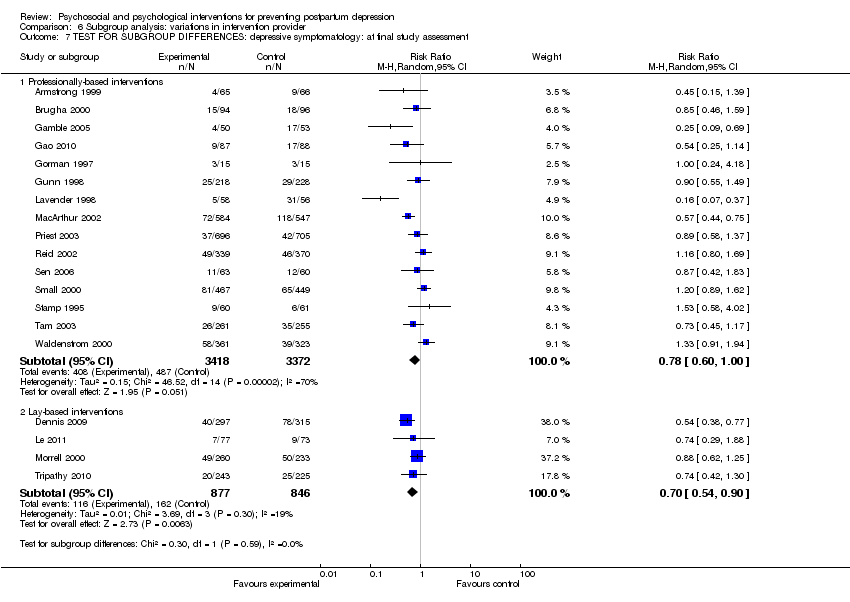
Comparison 6 Subgroup analysis: variations in intervention provider, Outcome 7 TEST FOR SUBGROUP DIFFERENCES: depressive symptomatology: at final study assessment.

Comparison 6 Subgroup analysis: variations in intervention provider, Outcome 8 TEST FOR SUBGROUP DIFFERENCES: mean depression scores: at final study assessment.
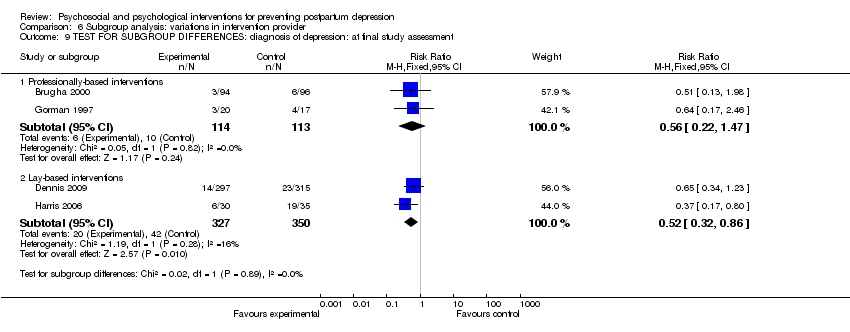
Comparison 6 Subgroup analysis: variations in intervention provider, Outcome 9 TEST FOR SUBGROUP DIFFERENCES: diagnosis of depression: at final study assessment.

Comparison 7 Subgroup analysis: variations in professionally‐based intervention provider, Outcome 1 TEST FOR SUBGROUP DIFFERENCES: depressive symptomatology at final study assessment.

Comparison 7 Subgroup analysis: variations in professionally‐based intervention provider, Outcome 2 TEST FOR SUBGROUP DIFFERENCES: mean depression score at final study assessment.

Comparison 8 Subgroup analysis: variations in intervention mode, Outcome 1 Individually‐based interventions ‐ depressive symptomatology.

Comparison 8 Subgroup analysis: variations in intervention mode, Outcome 2 Individually‐based interventions ‐ mean depression scores.

Comparison 8 Subgroup analysis: variations in intervention mode, Outcome 3 Individually‐based interventions ‐ diagnosis of depression.
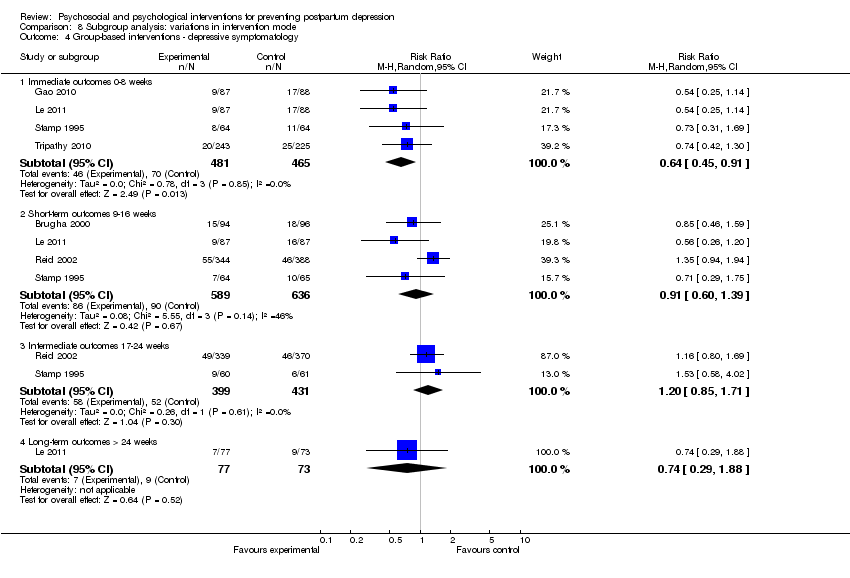
Comparison 8 Subgroup analysis: variations in intervention mode, Outcome 4 Group‐based interventions ‐ depressive symptomatology.
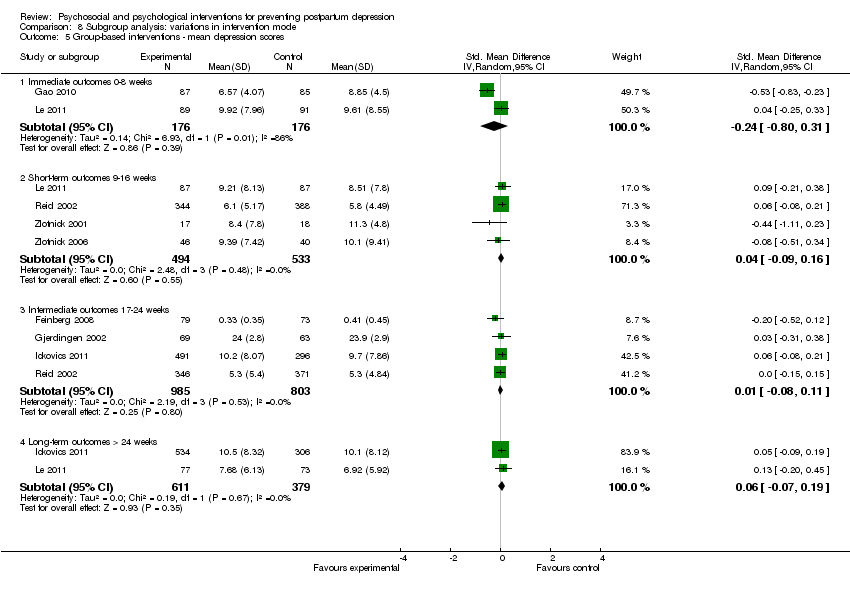
Comparison 8 Subgroup analysis: variations in intervention mode, Outcome 5 Group‐based interventions ‐ mean depression scores.

Comparison 8 Subgroup analysis: variations in intervention mode, Outcome 6 Group‐based interventions ‐ diagnosis of depression.
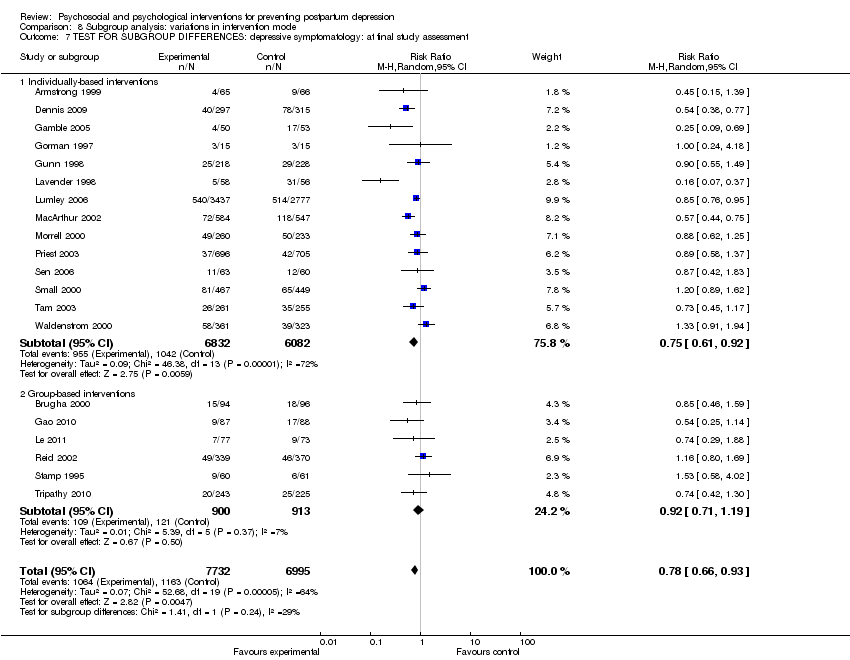
Comparison 8 Subgroup analysis: variations in intervention mode, Outcome 7 TEST FOR SUBGROUP DIFFERENCES: depressive symptomatology: at final study assessment.

Comparison 8 Subgroup analysis: variations in intervention mode, Outcome 8 TEST FOR SUBGROUP DIFFERENCES: mean depression scores: at final study assessment.

Comparison 8 Subgroup analysis: variations in intervention mode, Outcome 9 TEST FOR SUBGROUP DIFFERENCES: diagnosis of depression: at final study assessment.

Comparison 9 Subgroup analysis: variations in intervention duration, Outcome 1 Single‐contact interventions ‐ depressive symptomatology.
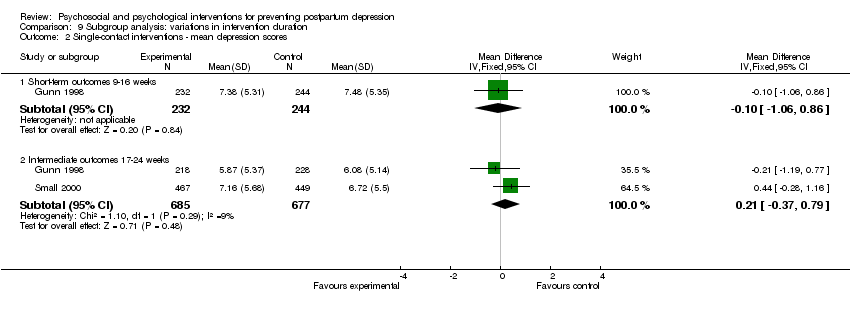
Comparison 9 Subgroup analysis: variations in intervention duration, Outcome 2 Single‐contact interventions ‐ mean depression scores.

Comparison 9 Subgroup analysis: variations in intervention duration, Outcome 3 Multiple‐contact interventions ‐ depressive symptomatology.

Comparison 9 Subgroup analysis: variations in intervention duration, Outcome 4 Multiple‐contact interventions ‐ mean depression scores.

Comparison 9 Subgroup analysis: variations in intervention duration, Outcome 5 Multiple‐contact interventions ‐ diagnosis of depression.

Comparison 9 Subgroup analysis: variations in intervention duration, Outcome 6 TEST FOR SUBGROUP DIFFERENCES: depressive symptomatology: at final study assessment.

Comparison 9 Subgroup analysis: variations in intervention duration, Outcome 7 TEST FOR SUBGROUP DIFFERENCES: mean depression scores: at final study assessment.
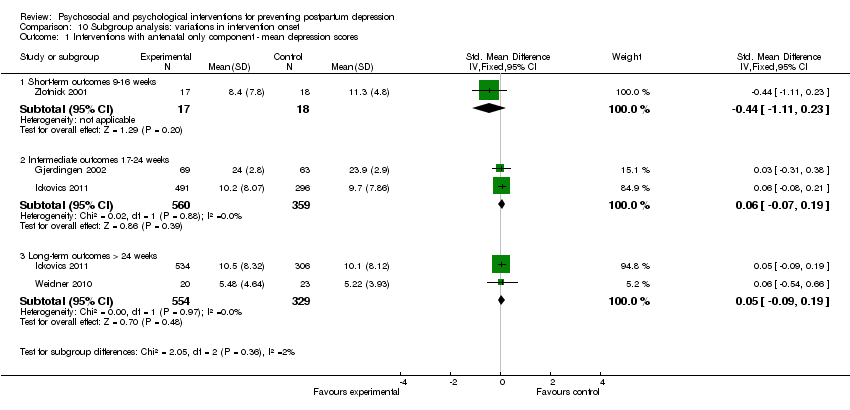
Comparison 10 Subgroup analysis: variations in intervention onset, Outcome 1 Interventions with antenatal only component ‐ mean depression scores.
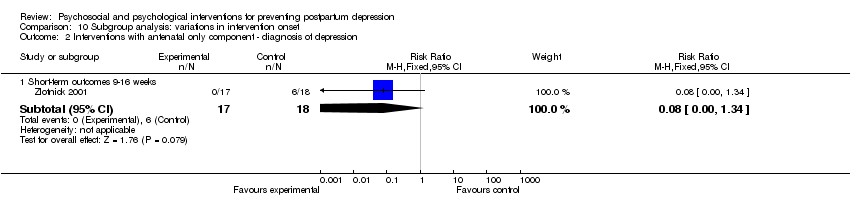
Comparison 10 Subgroup analysis: variations in intervention onset, Outcome 2 Interventions with antenatal only component ‐ diagnosis of depression.

Comparison 10 Subgroup analysis: variations in intervention onset, Outcome 3 Interventions with antenatal and postnatal components ‐ depressive symptomatology.
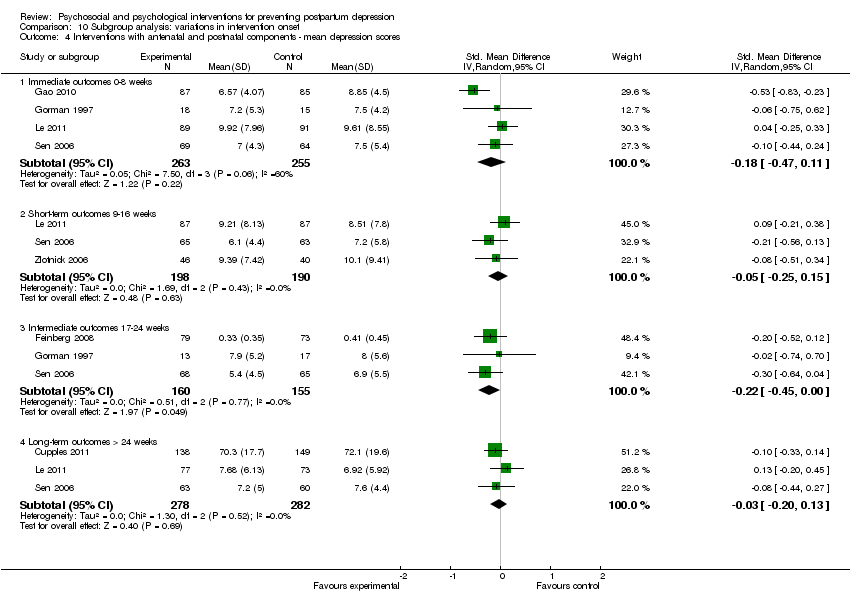
Comparison 10 Subgroup analysis: variations in intervention onset, Outcome 4 Interventions with antenatal and postnatal components ‐ mean depression scores.
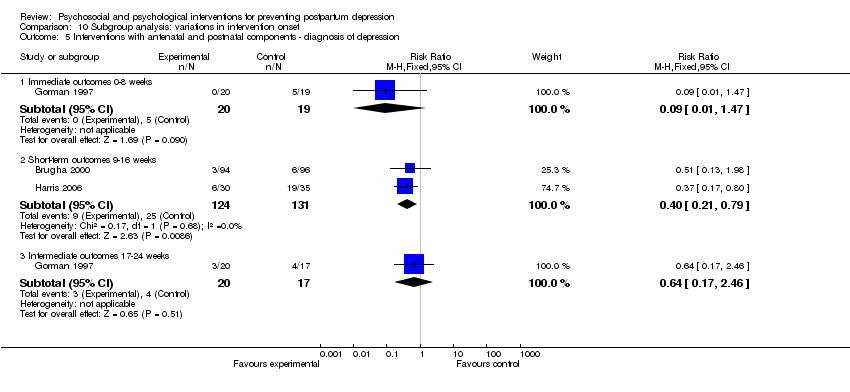
Comparison 10 Subgroup analysis: variations in intervention onset, Outcome 5 Interventions with antenatal and postnatal components ‐ diagnosis of depression.

Comparison 10 Subgroup analysis: variations in intervention onset, Outcome 6 Interventions with postnatal only component ‐ depressive symptomatology.

Comparison 10 Subgroup analysis: variations in intervention onset, Outcome 7 Interventions with postnatal only component ‐ mean depression scores.
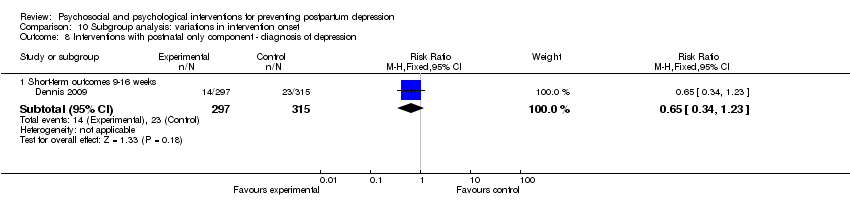
Comparison 10 Subgroup analysis: variations in intervention onset, Outcome 8 Interventions with postnatal only component ‐ diagnosis of depression.

Comparison 10 Subgroup analysis: variations in intervention onset, Outcome 9 TEST FOR SUBGROUP DIFFERENCES: depressive symptomatology: at final study assessment.
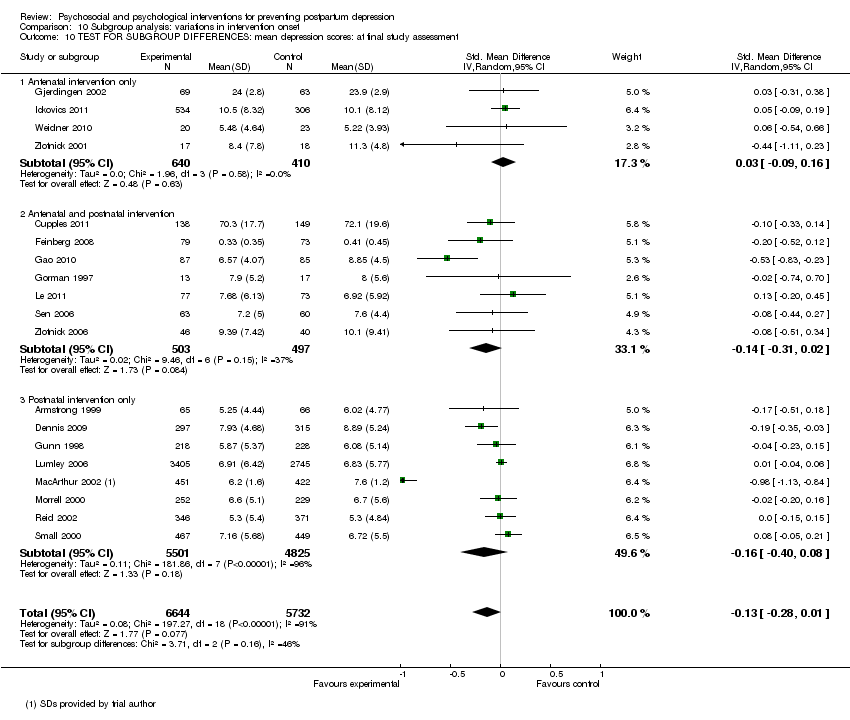
Comparison 10 Subgroup analysis: variations in intervention onset, Outcome 10 TEST FOR SUBGROUP DIFFERENCES: mean depression scores: at final study assessment.
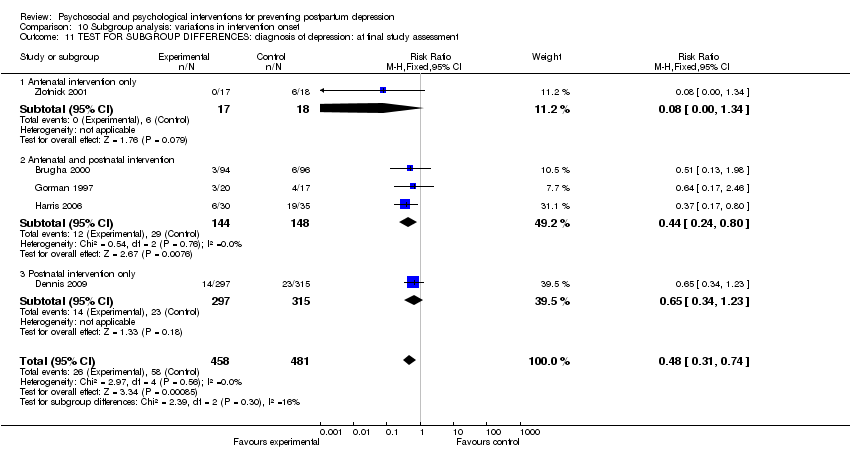
Comparison 10 Subgroup analysis: variations in intervention onset, Outcome 11 TEST FOR SUBGROUP DIFFERENCES: diagnosis of depression: at final study assessment.
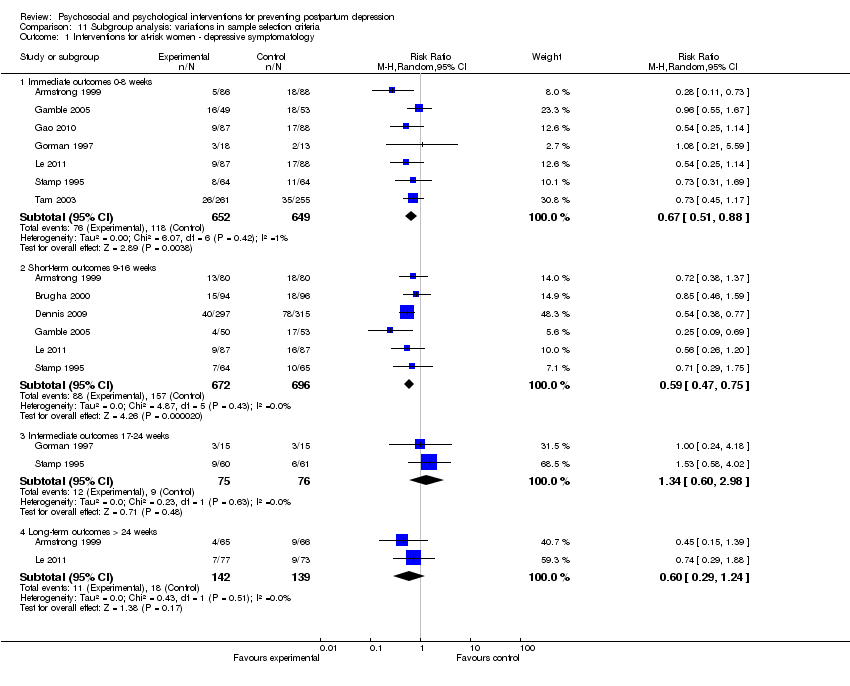
Comparison 11 Subgroup analysis: variations in sample selection criteria, Outcome 1 Interventions for at‐risk women ‐ depressive symptomatology.

Comparison 11 Subgroup analysis: variations in sample selection criteria, Outcome 2 Interventions for at‐risk women ‐ mean depression scores.

Comparison 11 Subgroup analysis: variations in sample selection criteria, Outcome 3 Interventions for at‐risk women ‐ diagnosis of depression.

Comparison 11 Subgroup analysis: variations in sample selection criteria, Outcome 4 Interventions for general population ‐ depressive symptomatology.
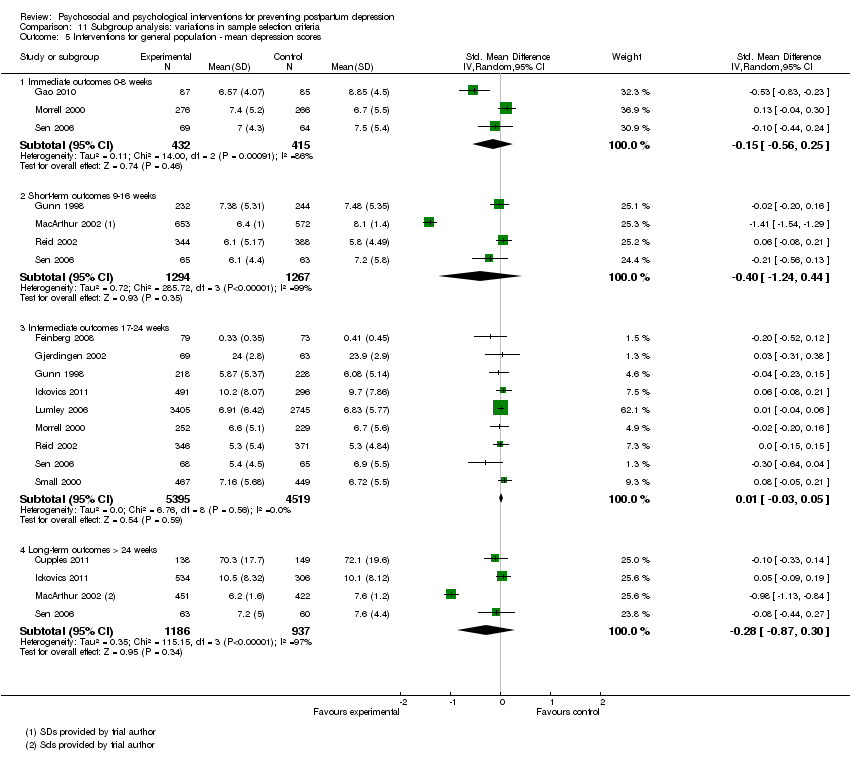
Comparison 11 Subgroup analysis: variations in sample selection criteria, Outcome 5 Interventions for general population ‐ mean depression scores.
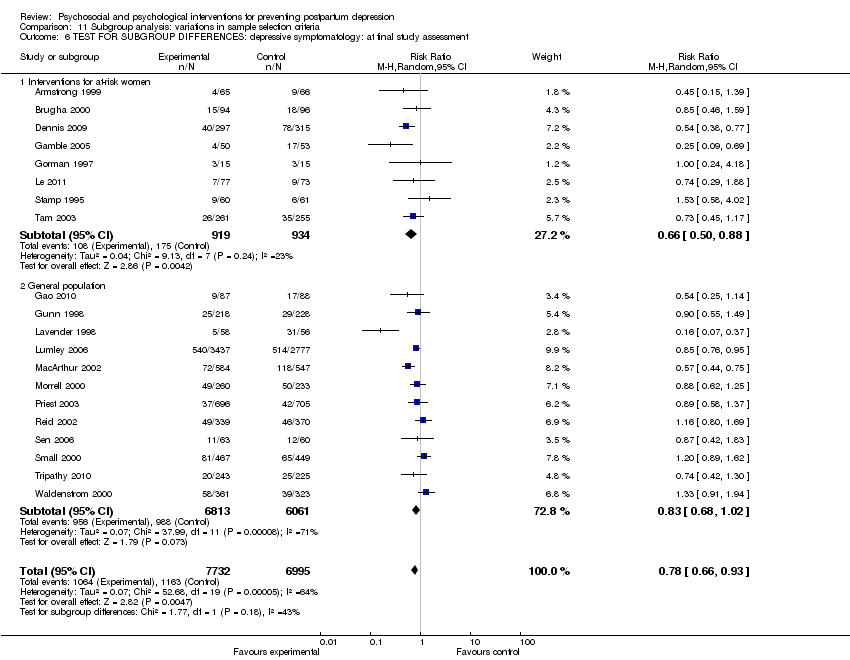
Comparison 11 Subgroup analysis: variations in sample selection criteria, Outcome 6 TEST FOR SUBGROUP DIFFERENCES: depressive symptomatology: at final study assessment.
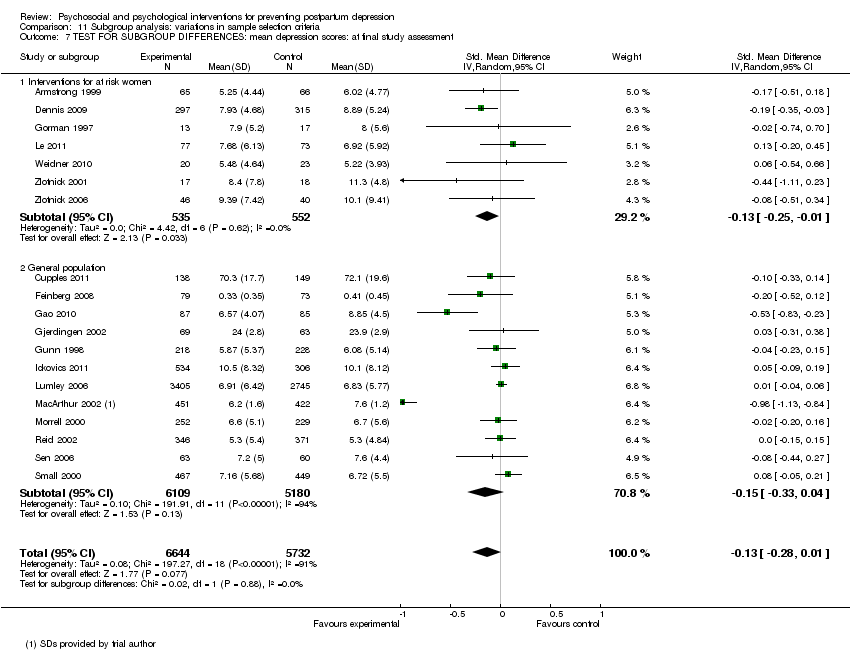
Comparison 11 Subgroup analysis: variations in sample selection criteria, Outcome 7 TEST FOR SUBGROUP DIFFERENCES: mean depression scores: at final study assessment.
| Outcome or subgroup title | No. of studies | No. of participants | Statistical method | Effect size |
| 1 Depressive symptomatology at final study assessment Show forest plot | 20 | 14727 | Risk Ratio (M‐H, Random, 95% CI) | 0.78 [0.66, 0.93] |
| 2 Mean depression scores at final study assessment Show forest plot | 19 | 12376 | Std. Mean Difference (IV, Random, 95% CI) | ‐0.13 [‐0.28, 0.01] |
| 3 Diagnosis of depression at final study assessment Show forest plot | 5 | 939 | Risk Ratio (M‐H, Random, 95% CI) | 0.50 [0.32, 0.78] |
| 4 Depressive symptomatology at 8, 16, 24, and > 24 weeks Show forest plot | 20 | Risk Ratio (M‐H, Random, 95% CI) | Subtotals only | |
| 4.1 Immediate outcomes 0‐8 weeks | 13 | 4907 | Risk Ratio (M‐H, Random, 95% CI) | 0.73 [0.56, 0.95] |
| 4.2 Short‐term outcome 9‐16 weeks | 10 | 3982 | Risk Ratio (M‐H, Random, 95% CI) | 0.73 [0.56, 0.97] |
| 4.3 Intermediate outcome 17‐24 weeks | 9 | 10636 | Risk Ratio (M‐H, Random, 95% CI) | 0.93 [0.82, 1.05] |
| 4.4 Long‐term outcome > 24 weeks | 5 | 2936 | Risk Ratio (M‐H, Random, 95% CI) | 0.66 [0.54, 0.82] |
| 5 Mean depression scores at 8, 16, 24, and > 24 weeks Show forest plot | 19 | Std. Mean Difference (IV, Random, 95% CI) | Subtotals only | |
| 5.1 Immediate outcomes: 0‐8 weeks | 6 | 1234 | Std. Mean Difference (IV, Random, 95% CI) | ‐0.16 [‐0.41, 0.09] |
| 5.2 Short‐term outcome 9‐16 weeks | 9 | 3628 | Std. Mean Difference (IV, Random, 95% CI) | ‐0.26 [‐0.72, 0.20] |
| 5.3 Intermediate outcome 17‐24 weeks | 10 | 9944 | Std. Mean Difference (IV, Random, 95% CI) | 0.01 [‐0.03, 0.05] |
| 5.4 Long‐term outcome > 24 weeks | 7 | 2447 | Std. Mean Difference (IV, Random, 95% CI) | ‐0.17 [‐0.58, 0.25] |
| 6 Diagnosis of depression at 8, 16, 24, and > 24 weeks Show forest plot | 5 | Risk Ratio (M‐H, Random, 95% CI) | Subtotals only | |
| 6.1 Immediate outcomes 0‐8 weeks | 1 | 39 | Risk Ratio (M‐H, Random, 95% CI) | 0.09 [0.01, 1.47] |
| 6.2 Short‐term outcomes 9‐16 weeks postpartum | 4 | 902 | Risk Ratio (M‐H, Random, 95% CI) | 0.49 [0.31, 0.77] |
| 6.3 Intermediate outcome: 17‐24 weeks | 1 | 37 | Risk Ratio (M‐H, Random, 95% CI) | 0.64 [0.17, 2.46] |
| 7 Maternal mortality at > 24 weeks Show forest plot | 1 | 234 | Risk Ratio (M‐H, Random, 95% CI) | 0.97 [0.06, 15.27] |
| 8 Maternal‐infant attachment at 8, 16, and 24 weeks Show forest plot | 1 | Risk Ratio (M‐H, Random, 95% CI) | Subtotals only | |
| 8.1 Immediate outcomes 0‐8 weeks | 1 | 133 | Risk Ratio (M‐H, Random, 95% CI) | 1.01 [0.64, 1.59] |
| 8.2 Short‐term outcome 9‐16 weeks | 1 | 126 | Risk Ratio (M‐H, Random, 95% CI) | 1.29 [0.78, 2.13] |
| 8.3 Intermediate outcome 17‐24 weeks | 1 | 127 | Risk Ratio (M‐H, Random, 95% CI) | 0.89 [0.59, 1.34] |
| 9 Mean maternal‐infant attachment scores at 8, 16, 24, and > 24 weeks Show forest plot | 2 | Std. Mean Difference (IV, Random, 95% CI) | Subtotals only | |
| 9.1 Immediate outcomes 0‐8 weeks | 1 | 176 | Std. Mean Difference (IV, Random, 95% CI) | ‐0.11 [‐0.40, 0.19] |
| 9.2 Short‐term outcome 9‐16 weeks | 1 | 160 | Std. Mean Difference (IV, Random, 95% CI) | ‐0.20 [‐0.51, 0.11] |
| 9.3 Intermediate outcome 17‐24 weeks | 1 | 152 | Std. Mean Difference (IV, Random, 95% CI) | ‐0.22 [‐0.54, 0.10] |
| 9.4 Long‐term outcome > 24 weeks | 1 | 116 | Std. Mean Difference (IV, Random, 95% CI) | ‐0.12 [‐0.49, 0.24] |
| 9.5 At final study assessment | 2 | 268 | Std. Mean Difference (IV, Random, 95% CI) | ‐0.18 [‐0.42, 0.06] |
| 10 Anxiety at 8, 16, and 24 weeks Show forest plot | 4 | Risk Ratio (M‐H, Random, 95% CI) | Subtotals only | |
| 10.1 Immediate outcomes 0‐8 weeks | 2 | 245 | Risk Ratio (M‐H, Random, 95% CI) | 0.35 [0.05, 2.34] |
| 10.2 Short‐term outcome 9‐16 weeks | 3 | 843 | Risk Ratio (M‐H, Random, 95% CI) | 0.41 [0.12, 1.41] |
| 10.3 Intermediate outcome 17‐24 weeks | 1 | 130 | Risk Ratio (M‐H, Random, 95% CI) | 0.94 [0.25, 3.60] |
| 10.4 At final study assessment | 4 | 959 | Risk Ratio (M‐H, Random, 95% CI) | 0.40 [0.14, 1.14] |
| 11 Mean anxiety scores at 8, 16, 24, and > 24 weeks Show forest plot | 4 | Std. Mean Difference (IV, Random, 95% CI) | Subtotals only | |
| 11.1 Immediate outcomes 0‐8 weeks | 2 | 163 | Std. Mean Difference (IV, Random, 95% CI) | ‐0.09 [‐0.39, 0.22] |
| 11.2 Short‐term outcome 9‐16 weeks | 2 | 740 | Std. Mean Difference (IV, Random, 95% CI) | ‐0.15 [‐0.30, ‐0.01] |
| 11.3 Intermediate outcome 17‐24 weeks | 2 | 160 | Std. Mean Difference (IV, Random, 95% CI) | ‐0.24 [‐0.55, 0.07] |
| 11.4 Long‐term outcome > 24 weeks | 1 | 43 | Std. Mean Difference (IV, Random, 95% CI) | ‐0.17 [‐0.77, 0.43] |
| 11.5 At final study assessment | 4 | 815 | Std. Mean Difference (IV, Random, 95% CI) | ‐0.16 [‐0.30, ‐0.03] |
| 12 Maternal stress at 16 weeks Show forest plot | 1 | Risk Ratio (M‐H, Random, 95% CI) | Subtotals only | |
| 12.1 Short‐term outcome 9‐16 weeks | 1 | 103 | Risk Ratio (M‐H, Random, 95% CI) | 0.44 [0.20, 0.96] |
| 13 Mean maternal stress scores at 24 and > 24 weeks Show forest plot | 1 | Mean Difference (IV, Random, 95% CI) | Subtotals only | |
| 13.1 Intermediate outcome 17‐24 weeks | 1 | 787 | Mean Difference (IV, Random, 95% CI) | 0.0 [‐1.02, 1.02] |
| 13.2 Long‐term outcome > 24 weeks | 1 | 840 | Mean Difference (IV, Random, 95% CI) | 0.5 [‐0.51, 1.51] |
| 14 Mean parental stress scores at 8, 24, and > 24 weeks Show forest plot | 3 | Std. Mean Difference (IV, Random, 95% CI) | Subtotals only | |
| 14.1 Immediate outcomes 0‐8 weeks | 1 | 176 | Std. Mean Difference (IV, Random, 95% CI) | ‐0.08 [‐0.37, 0.22] |
| 14.2 Intermediate outcome 17‐24 weeks | 1 | 124 | Std. Mean Difference (IV, Random, 95% CI) | ‐0.27 [‐0.62, 0.09] |
| 14.3 Long‐term outcome > 24 weeks | 2 | 341 | Std. Mean Difference (IV, Random, 95% CI) | 0.27 [0.05, 0.48] |
| 14.4 At final study assessment | 3 | 465 | Std. Mean Difference (IV, Random, 95% CI) | 0.11 [‐0.25, 0.48] |
| 15 Perceived social support at 8 and 16 weeks Show forest plot | 2 | Risk Ratio (M‐H, Random, 95% CI) | Subtotals only | |
| 15.1 Immediate outcomes 0‐8 weeks | 1 | 528 | Risk Ratio (M‐H, Random, 95% CI) | 0.68 [0.45, 1.05] |
| 15.2 Short‐term outcome 9‐16 weeks | 1 | 190 | Risk Ratio (M‐H, Random, 95% CI) | 1.02 [0.34, 3.05] |
| 15.3 At final study assessment | 2 | 718 | Risk Ratio (M‐H, Random, 95% CI) | 0.72 [0.48, 1.08] |
| 16 Mean perceived social support scores at 8, 16, 24, and > 24 weeks Show forest plot | 7 | Std. Mean Difference (IV, Random, 95% CI) | Subtotals only | |
| 16.1 Immediate outcomes 0‐8 weeks | 3 | 822 | Std. Mean Difference (IV, Random, 95% CI) | 0.02 [‐0.13, 0.17] |
| 16.2 Short‐term outcome 9‐16 weeks | 2 | 863 | Std. Mean Difference (IV, Random, 95% CI) | 0.16 [‐0.21, 0.53] |
| 16.3 Intermediate outcome 17‐24 weeks | 6 | 8122 | Std. Mean Difference (IV, Random, 95% CI) | 0.03 [‐0.06, 0.12] |
| 16.4 Long‐term outcome > 24 weeks | 2 | 955 | Std. Mean Difference (IV, Random, 95% CI) | ‐0.07 [‐0.20, 0.06] |
| 16.5 At final study assessment | 7 | 8290 | Std. Mean Difference (IV, Random, 95% CI) | 0.01 [‐0.08, 0.10] |
| 17 Maternal dissatisfaction with care provided at 8, 16, and 24 weeks Show forest plot | 4 | Risk Ratio (M‐H, Random, 95% CI) | Subtotals only | |
| 17.1 Immediate outcomes 0‐8 weeks | 2 | 825 | Risk Ratio (M‐H, Random, 95% CI) | 0.56 [0.29, 1.09] |
| 17.2 Short‐term outcome 9‐16 weeks | 1 | 1278 | Risk Ratio (M‐H, Random, 95% CI) | 0.88 [0.65, 1.19] |
| 17.3 Intermediate outcome 17‐24 weeks | 1 | 911 | Risk Ratio (M‐H, Random, 95% CI) | 0.75 [0.44, 1.25] |
| 17.4 At final study assessment | 4 | 3014 | Risk Ratio (M‐H, Random, 95% CI) | 0.67 [0.44, 1.00] |
| 18 Mean maternal dissatisfaction scores at 8 and 16 weeks Show forest plot | 2 | Std. Mean Difference (IV, Random, 95% CI) | Subtotals only | |
| 18.1 Immediate outcomes 0‐8 weeks | 1 | 516 | Std. Mean Difference (IV, Random, 95% CI) | 0.0 [‐0.17, 0.17] |
| 18.2 Short‐term outcome 9‐16 weeks | 1 | 160 | Std. Mean Difference (IV, Random, 95% CI) | 0.90 [0.58, 1.23] |
| 18.3 At final study assessment | 2 | 676 | Std. Mean Difference (IV, Random, 95% CI) | 0.44 [‐0.44, 1.32] |
| 19 Infant health parameters ‐ not fully immunized at > 24 weeks Show forest plot | 1 | 884 | Risk Ratio (M‐H, Random, 95% CI) | 1.16 [0.39, 3.43] |
| 20 Infant development > 24 weeks Show forest plot | 1 | 280 | Mean Difference (IV, Random, 95% CI) | ‐0.90 [‐2.90, 1.10] |
| 20.1 Bayley (BSID‐II) | 1 | 280 | Mean Difference (IV, Random, 95% CI) | ‐0.90 [‐2.90, 1.10] |
| 21 Child abuse at 8 and > 24 weeks Show forest plot | 1 | Mean Difference (IV, Random, 95% CI) | Subtotals only | |
| 21.1 Immediate outcomes 0‐8 weeks | 1 | 176 | Mean Difference (IV, Random, 95% CI) | ‐35.66 [‐62.65, ‐8.67] |
| 21.2 Long‐term outcome > 24 weeks | 1 | 66 | Mean Difference (IV, Random, 95% CI) | ‐41.90 [‐87.48, 3.68] |
| 22 Mean marital discord scores at 8, 16, and 24 weeks Show forest plot | 3 | Std. Mean Difference (IV, Random, 95% CI) | Subtotals only | |
| 22.1 Immediate outcomes 0‐8 weeks | 2 | 163 | Std. Mean Difference (IV, Random, 95% CI) | ‐0.03 [‐0.34, 0.28] |
| 22.2 Short‐term outcome 9‐16 weeks | 1 | 127 | Std. Mean Difference (IV, Random, 95% CI) | ‐0.28 [‐0.63, 0.07] |
| 22.3 Intermediate outcome 17‐24 weeks | 3 | 291 | Std. Mean Difference (IV, Random, 95% CI) | ‐0.14 [‐0.37, 0.09] |
| 22.4 At final study assessment | 3 | 291 | Std. Mean Difference (IV, Random, 95% CI) | ‐0.14 [‐0.37, 0.09] |
| Outcome or subgroup title | No. of studies | No. of participants | Statistical method | Effect size |
| 1 All psychosocial interventions ‐ depressive symptomatology Show forest plot | 12 | Risk Ratio (M‐H, Random, 95% CI) | Subtotals only | |
| 1.1 Immediate outcome ‐ 0‐8 weeks | 6 | 2138 | Risk Ratio (M‐H, Random, 95% CI) | 0.77 [0.52, 1.14] |
| 1.2 Short‐term outcomes 9‐16 weeks | 8 | 3705 | Risk Ratio (M‐H, Random, 95% CI) | 0.80 [0.61, 1.06] |
| 1.3 Intermediate outcomes 17‐24 weeks | 6 | 8116 | Risk Ratio (M‐H, Random, 95% CI) | 0.88 [0.78, 1.00] |
| 1.4 Long‐term outcomes >24 weeks | 3 | 1385 | Risk Ratio (M‐H, Random, 95% CI) | 0.59 [0.46, 0.76] |
| 1.5 At final study assessment | 12 | 11322 | Risk Ratio (M‐H, Random, 95% CI) | 0.83 [0.70, 0.99] |
| 2 All psychosocial interventions ‐ mean depression scores Show forest plot | 12 | Std. Mean Difference (IV, Random, 95% CI) | Subtotals only | |
| 2.1 Immediate outcomes 0‐8 weeks | 3 | 849 | Std. Mean Difference (IV, Random, 95% CI) | ‐0.12 [‐0.47, 0.23] |
| 2.2 Short‐term outcomes 9‐16 weeks | 6 | 3333 | Std. Mean Difference (IV, Random, 95% CI) | ‐0.32 [‐0.90, 0.25] |
| 2.3 Intermediate outcomes 17‐24 weeks | 8 | 8998 | Std. Mean Difference (IV, Random, 95% CI) | 0.00 [‐0.04, 0.05] |
| 2.4 Long‐term outcomes > 24 weeks | 5 | 2254 | Std. Mean Difference (IV, Random, 95% CI) | ‐0.26 [‐0.76, 0.24] |
| 2.5 At final study assessment | 12 | 10944 | Std. Mean Difference (IV, Random, 95% CI) | ‐0.14 [‐0.33, 0.04] |
| 3 All psychosocial interventions ‐ diagnosis of depression Show forest plot | 3 | Risk Ratio (M‐H, Fixed, 95% CI) | Subtotals only | |
| 3.1 Short‐term outcomes 9‐16 weeks | 3 | 867 | Risk Ratio (M‐H, Fixed, 95% CI) | 0.52 [0.33, 0.83] |
| 4 All psychosocial interventions: depressive symptomatology at final study assessment Show forest plot | 12 | 11322 | Risk Ratio (M‐H, Random, 95% CI) | 0.83 [0.70, 0.99] |
| 5 All psychosocial interventions: mean depression scores Show forest plot | 12 | 10944 | Std. Mean Difference (IV, Random, 95% CI) | ‐0.14 [‐0.33, 0.04] |
| Outcome or subgroup title | No. of studies | No. of participants | Statistical method | Effect size |
| 1 All psychological interventions ‐ depressive symptomatology Show forest plot | 8 | Risk Ratio (M‐H, Random, 95% CI) | Subtotals only | |
| 1.1 Immediate outcomes 0‐8 weeks | 7 | 2760 | Risk Ratio (M‐H, Random, 95% CI) | 0.69 [0.47, 1.02] |
| 1.2 Short‐term outcomes 9‐16 weeks | 2 | 277 | Risk Ratio (M‐H, Random, 95% CI) | 0.40 [0.18, 0.89] |
| 1.3 Intermediate outcomes 17‐24 weeks | 3 | 2520 | Risk Ratio (M‐H, Random, 95% CI) | 1.04 [0.83, 1.30] |
| 1.4 Long‐term outcomes >24 weeks | 2 | 1551 | Risk Ratio (M‐H, Random, 95% CI) | 0.86 [0.58, 1.28] |
| 1.5 At final study assessment | 8 | 3405 | Risk Ratio (M‐H, Random, 95% CI) | 0.61 [0.39, 0.96] |
| 2 All psychological interventions ‐ mean depression scores Show forest plot | 7 | Std. Mean Difference (IV, Random, 95% CI) | Subtotals only | |
| 2.1 immediate outcome 0‐8 weeks | 3 | 385 | Std. Mean Difference (IV, Random, 95% CI) | ‐0.20 [‐0.63, 0.22] |
| 2.2 Short‐term outcomes 9‐16 weeks | 3 | 295 | Std. Mean Difference (IV, Random, 95% CI) | ‐0.03 [‐0.27, 0.21] |
| 2.3 Intermediate outcomes 17‐24 weeks | 2 | 946 | Std. Mean Difference (IV, Random, 95% CI) | 0.08 [‐0.05, 0.20] |
| 2.4 Long‐term outcomes > 24 weeks | 2 | 193 | Std. Mean Difference (IV, Random, 95% CI) | 0.11 [‐0.17, 0.39] |
| 2.5 At final study assessment | 7 | 1432 | Std. Mean Difference (IV, Random, 95% CI) | ‐0.10 [‐0.32, 0.13] |
| 3 All psychological interventions ‐ diagnosis of depression Show forest plot | 2 | Risk Ratio (M‐H, Random, 95% CI) | Subtotals only | |
| 3.1 Diagnosis of depression ‐ 0‐8 weeks | 1 | 39 | Risk Ratio (M‐H, Random, 95% CI) | 0.09 [0.01, 1.47] |
| 3.2 Short‐term outcomes 9‐16 weeks | 1 | 35 | Risk Ratio (M‐H, Random, 95% CI) | 0.08 [0.00, 1.34] |
| 3.3 Intermediate outcomes 17‐24 weeks | 1 | 37 | Risk Ratio (M‐H, Random, 95% CI) | 0.64 [0.17, 2.46] |
| 3.4 At final study assessment | 2 | 72 | Risk Ratio (M‐H, Random, 95% CI) | 0.31 [0.04, 2.52] |
| Outcome or subgroup title | No. of studies | No. of participants | Statistical method | Effect size |
| 1 TEST FOR SUBGROUP DIFFERENCES: depressive symptomatology at final study assessment Show forest plot | 12 | 11322 | Risk Ratio (M‐H, Random, 95% CI) | 0.83 [0.70, 0.99] |
| 1.1 Antenatal and postnatal classes | 4 | 1488 | Risk Ratio (M‐H, Random, 95% CI) | 1.01 [0.77, 1.32] |
| 1.2 Postpartum professional‐based home visits | 2 | 1262 | Risk Ratio (M‐H, Random, 95% CI) | 0.56 [0.43, 0.73] |
| 1.3 Postpartum lay‐based home visits | 1 | 493 | Risk Ratio (M‐H, Random, 95% CI) | 0.88 [0.62, 1.25] |
| 1.4 Postpartum lay‐based telephone support | 1 | 612 | Risk Ratio (M‐H, Random, 95% CI) | 0.54 [0.38, 0.77] |
| 1.5 Early postpartum follow‐up | 1 | 446 | Risk Ratio (M‐H, Random, 95% CI) | 0.90 [0.55, 1.49] |
| 1.6 Continuity model of care | 3 | 7021 | Risk Ratio (M‐H, Random, 95% CI) | 0.99 [0.71, 1.36] |
| 2 TEST FOR SUBGROUP DIFFERENCES: mean depression score at final study assessment Show forest plot | 4 | 1411 | Std. Mean Difference (IV, Fixed, 95% CI) | ‐0.01 [‐0.12, 0.10] |
| 2.1 Antenatal and postnatal classes | 3 | 1124 | Std. Mean Difference (IV, Fixed, 95% CI) | 0.01 [‐0.11, 0.13] |
| 2.2 Antenatal and postnatal lay‐based home visits and telephone support | 1 | 287 | Std. Mean Difference (IV, Fixed, 95% CI) | ‐0.10 [‐0.33, 0.14] |
| Outcome or subgroup title | No. of studies | No. of participants | Statistical method | Effect size |
| 1 TEST FOR SUBGROUP DIFFERENCES: depressive symptomatology at final study assessment Show forest plot | 6 | 3200 | Risk Ratio (M‐H, Random, 95% CI) | 0.59 [0.35, 1.01] |
| 1.1 Psychological debriefing | 5 | 3050 | Risk Ratio (M‐H, Random, 95% CI) | 0.57 [0.31, 1.03] |
| 1.2 Cognitive behavioural therapy | 1 | 150 | Risk Ratio (M‐H, Random, 95% CI) | 0.74 [0.29, 1.88] |
| 2 TEST FOR SUBGROUP DIFFERENCES: mean depression score at final study assessment Show forest plot | 6 | 516 | Std. Mean Difference (IV, Random, 95% CI) | ‐0.16 [‐0.43, 0.11] |
| 2.1 Interpersonal psychotherapy | 5 | 366 | Std. Mean Difference (IV, Random, 95% CI) | ‐0.27 [‐0.52, ‐0.01] |
| 2.2 Cognitive behavioural therapy | 1 | 150 | Std. Mean Difference (IV, Random, 95% CI) | 0.13 [‐0.20, 0.45] |
| Outcome or subgroup title | No. of studies | No. of participants | Statistical method | Effect size |
| 1 Professionally‐based interventions ‐ depressive symptomatology Show forest plot | 15 | Risk Ratio (M‐H, Random, 95% CI) | Subtotals only | |
| 1.1 Immediate outcomes 0‐8 weeks | 10 | 3699 | Risk Ratio (M‐H, Random, 95% CI) | 0.65 [0.45, 0.93] |
| 1.2 Short‐term outcome 9‐16 weeks | 8 | 3196 | Risk Ratio (M‐H, Random, 95% CI) | 0.79 [0.57, 1.09] |
| 1.3 Intermediate outcome 17‐24 weeks | 7 | 3929 | Risk Ratio (M‐H, Random, 95% CI) | 1.03 [0.87, 1.23] |
| 1.4 Long‐term outcome > 24 weeks | 4 | 2786 | Risk Ratio (M‐H, Random, 95% CI) | 0.68 [0.51, 0.90] |
| 2 Professionally‐based interventions ‐ mean depression scores Show forest plot | 12 | Std. Mean Difference (IV, Random, 95% CI) | Subtotals only | |
| 2.1 Immediate outcomes: 0‐8 weeks | 4 | 512 | Std. Mean Difference (IV, Random, 95% CI) | ‐0.34 [‐0.56, ‐0.12] |
| 2.2 Short‐term outcome 9‐16 weeks | 6 | 2807 | Std. Mean Difference (IV, Random, 95% CI) | ‐0.31 [‐0.95, 0.34] |
| 2.3 Intermediate outcome 17‐24 weeks | 7 | 3161 | Std. Mean Difference (IV, Random, 95% CI) | 0.02 [‐0.05, 0.09] |
| 2.4 Long‐term outcome >24 weeks | 5 | 2010 | Std. Mean Difference (IV, Random, 95% CI) | ‐0.24 [‐0.79, 0.31] |
| 3 Professionally‐based interventions ‐ diagnosis of depression Show forest plot | 2 | Risk Ratio (M‐H, Fixed, 95% CI) | Subtotals only | |
| 3.1 Immediate outcomes 0‐8 weeks | 1 | 39 | Risk Ratio (M‐H, Fixed, 95% CI) | 0.09 [0.01, 1.47] |
| 3.2 Short‐term outcomes 9‐16 weeks postpartum | 1 | 190 | Risk Ratio (M‐H, Fixed, 95% CI) | 0.51 [0.13, 1.98] |
| 3.3 Intermediate outcome: 17‐24 weeks | 1 | 37 | Risk Ratio (M‐H, Fixed, 95% CI) | 0.64 [0.17, 2.46] |
| 4 Lay‐based interventions ‐ depressive symptomatology Show forest plot | 4 | Risk Ratio (M‐H, Fixed, 95% CI) | Subtotals only | |
| 4.1 Immediate outcomes 0‐8 weeks | 3 | 1208 | Risk Ratio (M‐H, Fixed, 95% CI) | 0.91 [0.70, 1.18] |
| 4.2 Short‐term outcome 9‐16 weeks | 2 | 786 | Risk Ratio (M‐H, Fixed, 95% CI) | 0.55 [0.40, 0.75] |
| 4.3 Intermediate outcome 17‐24 weeks | 1 | 493 | Risk Ratio (M‐H, Fixed, 95% CI) | 0.88 [0.62, 1.25] |
| 4.4 Long‐term outcome > 24 weeks | 1 | 150 | Risk Ratio (M‐H, Fixed, 95% CI) | 0.74 [0.29, 1.88] |
| 5 Lay‐based interventions ‐ mean depression scores Show forest plot | 5 | Std. Mean Difference (IV, Random, 95% CI) | Subtotals only | |
| 5.1 Immediate outcomes: 0‐8 weeks | 2 | 722 | Std. Mean Difference (IV, Random, 95% CI) | 0.11 [‐0.04, 0.25] |
| 5.2 Short‐term outcome 9‐16 weeks | 2 | 786 | Std. Mean Difference (IV, Random, 95% CI) | ‐0.08 [‐0.35, 0.19] |
| 5.3 Intermediate outcome 17‐24 weeks | 2 | 633 | Std. Mean Difference (IV, Random, 95% CI) | ‐0.06 [‐0.22, 0.09] |
| 5.4 Long‐term outcome > 24 weeks | 2 | 437 | Std. Mean Difference (IV, Random, 95% CI) | ‐0.01 [‐0.22, 0.20] |
| 6 Lay‐based interventions ‐ diagnosis of depression Show forest plot | 2 | Risk Ratio (M‐H, Fixed, 95% CI) | Subtotals only | |
| 6.1 Short‐term outcomes 9‐16 weeks postpartum | 2 | 677 | Risk Ratio (M‐H, Fixed, 95% CI) | 0.52 [0.32, 0.86] |
| 7 TEST FOR SUBGROUP DIFFERENCES: depressive symptomatology: at final study assessment Show forest plot | 19 | Risk Ratio (M‐H, Random, 95% CI) | Subtotals only | |
| 7.1 Professionally‐based interventions | 15 | 6790 | Risk Ratio (M‐H, Random, 95% CI) | 0.78 [0.60, 1.00] |
| 7.2 Lay‐based interventions | 4 | 1723 | Risk Ratio (M‐H, Random, 95% CI) | 0.70 [0.54, 0.90] |
| 8 TEST FOR SUBGROUP DIFFERENCES: mean depression scores: at final study assessment Show forest plot | 17 | Std. Mean Difference (IV, Random, 95% CI) | Subtotals only | |
| 8.1 Professionally‐based interventions | 12 | 4509 | Std. Mean Difference (IV, Random, 95% CI) | ‐0.15 [‐0.40, 0.10] |
| 8.2 Lay‐based interventions | 5 | 1682 | Std. Mean Difference (IV, Random, 95% CI) | ‐0.10 [‐0.20, 0.01] |
| 9 TEST FOR SUBGROUP DIFFERENCES: diagnosis of depression: at final study assessment Show forest plot | 4 | Risk Ratio (M‐H, Fixed, 95% CI) | Subtotals only | |
| 9.1 Professionally‐based interventions | 2 | 227 | Risk Ratio (M‐H, Fixed, 95% CI) | 0.56 [0.22, 1.47] |
| 9.2 Lay‐based interventions | 2 | 677 | Risk Ratio (M‐H, Fixed, 95% CI) | 0.52 [0.32, 0.86] |
| Outcome or subgroup title | No. of studies | No. of participants | Statistical method | Effect size |
| 1 TEST FOR SUBGROUP DIFFERENCES: depressive symptomatology at final study assessment Show forest plot | 15 | Risk Ratio (M‐H, Random, 95% CI) | Subtotals only | |
| 1.1 Intervention provided by nurses | 3 | 837 | Risk Ratio (M‐H, Random, 95% CI) | 0.73 [0.51, 1.04] |
| 1.2 Intervention provided by physicians | 1 | 446 | Risk Ratio (M‐H, Random, 95% CI) | 0.90 [0.55, 1.49] |
| 1.3 Intervention provided by midwives | 10 | 5477 | Risk Ratio (M‐H, Random, 95% CI) | 0.76 [0.54, 1.07] |
| 1.4 Intervention provided by mental health specialists | 1 | 30 | Risk Ratio (M‐H, Random, 95% CI) | 1.0 [0.24, 4.18] |
| 2 TEST FOR SUBGROUP DIFFERENCES: mean depression score at final study assessment Show forest plot | 4 | Std. Mean Difference (IV, Fixed, 95% CI) | Subtotals only | |
| 2.1 Intervention provided by nurses | 1 | 86 | Std. Mean Difference (IV, Fixed, 95% CI) | ‐0.08 [‐0.51, 0.34] |
| 2.2 Intervention provided by midwives | 1 | 840 | Std. Mean Difference (IV, Fixed, 95% CI) | 0.05 [‐0.09, 0.19] |
| 2.3 Intervention provided by mental health specialists | 2 | 175 | Std. Mean Difference (IV, Fixed, 95% CI) | 0.04 [‐0.26, 0.34] |
| Outcome or subgroup title | No. of studies | No. of participants | Statistical method | Effect size |
| 1 Individually‐based interventions ‐ depressive symptomatology Show forest plot | 14 | Risk Ratio (M‐H, Random, 95% CI) | Subtotals only | |
| 1.1 Immediate outcomes 0‐8 weeks | 9 | 3947 | Risk Ratio (M‐H, Random, 95% CI) | 0.70 [0.49, 1.00] |
| 1.2 Short‐term outcomes 9‐16 weeks | 6 | 2757 | Risk Ratio (M‐H, Random, 95% CI) | 0.66 [0.47, 0.91] |
| 1.3 Intermediate outcomes 17‐24 weeks | 7 | 9806 | Risk Ratio (M‐H, Random, 95% CI) | 0.88 [0.80, 0.98] |
| 1.4 Long‐term outcomes > 24 weeks | 4 | 2786 | Risk Ratio (M‐H, Random, 95% CI) | 0.68 [0.51, 0.90] |
| 2 Individually‐based interventions ‐ mean depression scores Show forest plot | 11 | Std. Mean Difference (IV, Random, 95% CI) | Subtotals only | |
| 2.1 Immediate outcomes 0‐8 weeks | 4 | 882 | Std. Mean Difference (IV, Random, 95% CI) | ‐0.11 [‐0.41, 0.19] |
| 2.2 Short‐term outcomes 9‐16 weeks | 5 | 2601 | Std. Mean Difference (IV, Random, 95% CI) | ‐0.40 [‐1.07, 0.26] |
| 2.3 Intermediate outcomes 17‐24 weeks | 6 | 8156 | Std. Mean Difference (IV, Random, 95% CI) | 0.01 [‐0.03, 0.05] |
| 2.4 Long‐term outcomes > 24 weeks | 5 | 1457 | Std. Mean Difference (IV, Random, 95% CI) | ‐0.28 [‐0.78, 0.23] |
| 3 Individually‐based interventions ‐ diagnosis of depression Show forest plot | 3 | Risk Ratio (M‐H, Fixed, 95% CI) | Subtotals only | |
| 3.1 Immediate outcomes 0‐8 weeks | 1 | 39 | Risk Ratio (M‐H, Fixed, 95% CI) | 0.09 [0.01, 1.47] |
| 3.2 Short‐term outcomes 9‐16 weeks | 2 | 677 | Risk Ratio (M‐H, Fixed, 95% CI) | 0.52 [0.32, 0.86] |
| 3.3 Intermediate outcomes 17‐24 weeks | 1 | 37 | Risk Ratio (M‐H, Fixed, 95% CI) | 0.64 [0.17, 2.46] |
| 4 Group‐based interventions ‐ depressive symptomatology Show forest plot | 6 | Risk Ratio (M‐H, Random, 95% CI) | Subtotals only | |
| 4.1 Immediate outcomes 0‐8 weeks | 4 | 946 | Risk Ratio (M‐H, Random, 95% CI) | 0.64 [0.45, 0.91] |
| 4.2 Short‐term outcomes 9‐16 weeks | 4 | 1225 | Risk Ratio (M‐H, Random, 95% CI) | 0.91 [0.60, 1.39] |
| 4.3 Intermediate outcomes 17‐24 weeks | 2 | 830 | Risk Ratio (M‐H, Random, 95% CI) | 1.20 [0.85, 1.71] |
| 4.4 Long‐term outcomes > 24 weeks | 1 | 150 | Risk Ratio (M‐H, Random, 95% CI) | 0.74 [0.29, 1.88] |
| 5 Group‐based interventions ‐ mean depression scores Show forest plot | 8 | Std. Mean Difference (IV, Random, 95% CI) | Subtotals only | |
| 5.1 Immediate outcomes 0‐8 weeks | 2 | 352 | Std. Mean Difference (IV, Random, 95% CI) | ‐0.24 [‐0.80, 0.31] |
| 5.2 Short‐term outcomes 9‐16 weeks | 4 | 1027 | Std. Mean Difference (IV, Random, 95% CI) | 0.04 [‐0.09, 0.16] |
| 5.3 Intermediate outcomes 17‐24 weeks | 4 | 1788 | Std. Mean Difference (IV, Random, 95% CI) | 0.01 [‐0.08, 0.11] |
| 5.4 Long‐term outcomes > 24 weeks | 2 | 990 | Std. Mean Difference (IV, Random, 95% CI) | 0.06 [‐0.07, 0.19] |
| 6 Group‐based interventions ‐ diagnosis of depression Show forest plot | 2 | Risk Ratio (M‐H, Random, 95% CI) | Subtotals only | |
| 6.1 Short‐term outcomes 9‐16 weeks | 2 | 225 | Risk Ratio (M‐H, Random, 95% CI) | 0.30 [0.05, 1.66] |
| 7 TEST FOR SUBGROUP DIFFERENCES: depressive symptomatology: at final study assessment Show forest plot | 20 | 14727 | Risk Ratio (M‐H, Random, 95% CI) | 0.78 [0.66, 0.93] |
| 7.1 Individually‐based interventions | 14 | 12914 | Risk Ratio (M‐H, Random, 95% CI) | 0.75 [0.61, 0.92] |
| 7.2 Group‐based interventions | 6 | 1813 | Risk Ratio (M‐H, Random, 95% CI) | 0.92 [0.71, 1.19] |
| 8 TEST FOR SUBGROUP DIFFERENCES: mean depression scores: at final study assessment Show forest plot | 19 | 12376 | Std. Mean Difference (IV, Random, 95% CI) | ‐0.13 [‐0.28, 0.01] |
| 8.1 Individually‐based interventions | 11 | 10092 | Std. Mean Difference (IV, Random, 95% CI) | ‐0.15 [‐0.37, 0.07] |
| 8.2 Group‐based interventions | 8 | 2284 | Std. Mean Difference (IV, Random, 95% CI) | ‐0.08 [‐0.23, 0.06] |
| 9 TEST FOR SUBGROUP DIFFERENCES: diagnosis of depression: at final study assessment Show forest plot | 5 | 939 | Risk Ratio (M‐H, Random, 95% CI) | 0.50 [0.32, 0.78] |
| 9.1 Individually‐based interventions | 3 | 714 | Risk Ratio (M‐H, Random, 95% CI) | 0.53 [0.33, 0.84] |
| 9.2 Group‐based interventions | 2 | 225 | Risk Ratio (M‐H, Random, 95% CI) | 0.30 [0.05, 1.66] |
| Outcome or subgroup title | No. of studies | No. of participants | Statistical method | Effect size |
| 1 Single‐contact interventions ‐ depressive symptomatology Show forest plot | 4 | Risk Ratio (M‐H, Random, 95% CI) | Subtotals only | |
| 1.1 Immediate outcomes 0‐8 weeks | 2 | 1756 | Risk Ratio (M‐H, Random, 95% CI) | 0.39 [0.07, 2.16] |
| 1.2 Short‐term outcomes 9‐16 weeks | 1 | 476 | Risk Ratio (M‐H, Random, 95% CI) | 1.24 [0.81, 1.91] |
| 1.3 Intermediate outcomes 17‐24 weeks | 3 | 2936 | Risk Ratio (M‐H, Random, 95% CI) | 1.01 [0.82, 1.26] |
| 1.4 Long‐term outcomes > 24 weeks | 1 | 1401 | Risk Ratio (M‐H, Random, 95% CI) | 0.89 [0.58, 1.37] |
| 2 Single‐contact interventions ‐ mean depression scores Show forest plot | 2 | Mean Difference (IV, Fixed, 95% CI) | Subtotals only | |
| 2.1 Short‐term outcomes 9‐16 weeks | 1 | 476 | Mean Difference (IV, Fixed, 95% CI) | ‐0.10 [‐1.06, 0.86] |
| 2.2 Intermediate outcomes 17‐24 weeks | 2 | 1362 | Mean Difference (IV, Fixed, 95% CI) | 0.21 [‐0.37, 0.79] |
| 3 Multiple‐contact interventions ‐ depressive symptomatology Show forest plot | 16 | Risk Ratio (M‐H, Random, 95% CI) | Subtotals only | |
| 3.1 Immediate outcomes 0‐8 weeks | 11 | 3137 | Risk Ratio (M‐H, Random, 95% CI) | 0.77 [0.60, 0.99] |
| 3.2 Short‐term outcomes 9‐16 weeks | 9 | 3506 | Risk Ratio (M‐H, Random, 95% CI) | 0.69 [0.52, 0.91] |
| 3.3 Intermediate outcomes 17‐24 weeks | 6 | 7700 | Risk Ratio (M‐H, Random, 95% CI) | 0.89 [0.77, 1.01] |
| 3.4 Long‐term outcomes > 24 weeks | 4 | 1535 | Risk Ratio (M‐H, Random, 95% CI) | 0.60 [0.47, 0.76] |
| 4 Multiple‐contact interventions ‐ mean depression scores Show forest plot | 17 | Std. Mean Difference (IV, Random, 95% CI) | Subtotals only | |
| 4.1 Immediate outcomes 0‐8 weeks | 6 | 1234 | Std. Mean Difference (IV, Random, 95% CI) | ‐0.16 [‐0.41, 0.09] |
| 4.2 Short‐term outcomes 9‐16 weeks | 8 | 3152 | Std. Mean Difference (IV, Random, 95% CI) | ‐0.30 [‐0.81, 0.22] |
| 4.3 Intermediate outcomes 17‐24 weeks | 8 | 8582 | Std. Mean Difference (IV, Random, 95% CI) | 0.01 [‐0.04, 0.05] |
| 4.4 Long‐term outcomes > 24 weeks | 7 | 2447 | Std. Mean Difference (IV, Random, 95% CI) | ‐0.17 [‐0.58, 0.25] |
| 5 Multiple‐contact interventions ‐ diagnosis of depression Show forest plot | 5 | Risk Ratio (M‐H, Fixed, 95% CI) | Subtotals only | |
| 5.1 Immediate outcomes 0‐8 weeks | 1 | 39 | Risk Ratio (M‐H, Fixed, 95% CI) | 0.09 [0.01, 1.47] |
| 5.2 Short‐term outcomes 9‐16 weeks | 4 | 902 | Risk Ratio (M‐H, Fixed, 95% CI) | 0.47 [0.30, 0.74] |
| 5.3 Intermediate outcomes 17‐24 weeks | 1 | 37 | Risk Ratio (M‐H, Fixed, 95% CI) | 0.64 [0.17, 2.46] |
| 5.4 At final study assessment | 5 | 939 | Risk Ratio (M‐H, Fixed, 95% CI) | 0.48 [0.31, 0.74] |
| 6 TEST FOR SUBGROUP DIFFERENCES: depressive symptomatology: at final study assessment Show forest plot | 20 | 14727 | Risk Ratio (M‐H, Random, 95% CI) | 0.78 [0.66, 0.93] |
| 6.1 Single contact intervention | 4 | 2877 | Risk Ratio (M‐H, Random, 95% CI) | 0.70 [0.38, 1.28] |
| 6.2 Multiple contact intervention | 16 | 11850 | Risk Ratio (M‐H, Random, 95% CI) | 0.78 [0.66, 0.93] |
| 7 TEST FOR SUBGROUP DIFFERENCES: mean depression scores: at final study assessment Show forest plot | 19 | 12376 | Std. Mean Difference (IV, Random, 95% CI) | ‐0.13 [‐0.28, 0.01] |
| 7.1 Single contact intervention | 2 | 1362 | Std. Mean Difference (IV, Random, 95% CI) | 0.04 [‐0.07, 0.15] |
| 7.2 Multiple contact intervention | 17 | 11014 | Std. Mean Difference (IV, Random, 95% CI) | ‐0.15 [‐0.32, 0.02] |
| Outcome or subgroup title | No. of studies | No. of participants | Statistical method | Effect size |
| 1 Interventions with antenatal only component ‐ mean depression scores Show forest plot | 4 | Std. Mean Difference (IV, Fixed, 95% CI) | Subtotals only | |
| 1.1 Short‐term outcomes 9‐16 weeks | 1 | 35 | Std. Mean Difference (IV, Fixed, 95% CI) | ‐0.44 [‐1.11, 0.23] |
| 1.2 Intermediate outcomes 17‐24 weeks | 2 | 919 | Std. Mean Difference (IV, Fixed, 95% CI) | 0.06 [‐0.07, 0.19] |
| 1.3 Long‐term outcomes > 24 weeks | 2 | 883 | Std. Mean Difference (IV, Fixed, 95% CI) | 0.05 [‐0.09, 0.19] |
| 2 Interventions with antenatal only component ‐ diagnosis of depression Show forest plot | 1 | Risk Ratio (M‐H, Fixed, 95% CI) | Subtotals only | |
| 2.1 Short‐term outcomes 9‐16 weeks | 1 | 35 | Risk Ratio (M‐H, Fixed, 95% CI) | 0.08 [0.00, 1.34] |
| 3 Interventions with antenatal and postnatal components ‐ depressive symptomatology Show forest plot | 8 | Risk Ratio (M‐H, Random, 95% CI) | Subtotals only | |
| 3.1 Immediate outcomes 0‐8 weeks | 7 | 1794 | Risk Ratio (M‐H, Random, 95% CI) | 0.75 [0.52, 1.08] |
| 3.2 Short‐term outcomes 9‐16 weeks | 4 | 621 | Risk Ratio (M‐H, Random, 95% CI) | 0.66 [0.45, 0.97] |
| 3.3 Intermediate outcomes 17‐24 weeks | 3 | 284 | Risk Ratio (M‐H, Random, 95% CI) | 0.87 [0.41, 1.85] |
| 3.4 Long‐term outcomes > 24 weeks | 2 | 273 | Risk Ratio (M‐H, Random, 95% CI) | 0.82 [0.46, 1.46] |
| 4 Interventions with antenatal and postnatal components ‐ mean depression scores Show forest plot | 7 | Std. Mean Difference (IV, Random, 95% CI) | Subtotals only | |
| 4.1 Immediate outcomes 0‐8 weeks | 4 | 518 | Std. Mean Difference (IV, Random, 95% CI) | ‐0.18 [‐0.47, 0.11] |
| 4.2 Short‐term outcomes 9‐16 weeks | 3 | 388 | Std. Mean Difference (IV, Random, 95% CI) | ‐0.05 [‐0.25, 0.15] |
| 4.3 Intermediate outcomes 17‐24 weeks | 3 | 315 | Std. Mean Difference (IV, Random, 95% CI) | ‐0.22 [‐0.45, ‐0.00] |
| 4.4 Long‐term outcomes > 24 weeks | 3 | 560 | Std. Mean Difference (IV, Random, 95% CI) | ‐0.03 [‐0.20, 0.13] |
| 5 Interventions with antenatal and postnatal components ‐ diagnosis of depression Show forest plot | 3 | Risk Ratio (M‐H, Fixed, 95% CI) | Subtotals only | |
| 5.1 Immediate outcomes 0‐8 weeks | 1 | 39 | Risk Ratio (M‐H, Fixed, 95% CI) | 0.09 [0.01, 1.47] |
| 5.2 Short‐term outcomes 9‐16 weeks | 2 | 255 | Risk Ratio (M‐H, Fixed, 95% CI) | 0.40 [0.21, 0.79] |
| 5.3 Intermediate outcomes 17‐24 weeks | 1 | 37 | Risk Ratio (M‐H, Fixed, 95% CI) | 0.64 [0.17, 2.46] |
| 6 Interventions with postnatal only component ‐ depressive symptomatology Show forest plot | 12 | Risk Ratio (M‐H, Random, 95% CI) | Subtotals only | |
| 6.1 Immediate outcomes 0‐8 weeks | 6 | 3099 | Risk Ratio (M‐H, Random, 95% CI) | 0.63 [0.41, 0.98] |
| 6.2 Short‐term outcomes 9‐16 weeks | 6 | 3361 | Risk Ratio (M‐H, Random, 95% CI) | 0.76 [0.53, 1.11] |
| 6.3 Intermediate outcomes 17‐24 weeks | 6 | 10352 | Risk Ratio (M‐H, Random, 95% CI) | 0.93 [0.82, 1.06] |
| 6.4 Long‐term outcomes >24 weeks | 3 | 2663 | Risk Ratio (M‐H, Random, 95% CI) | 0.66 [0.46, 0.93] |
| 7 Interventions with postnatal only component ‐ mean depression scores Show forest plot | 8 | Std. Mean Difference (IV, Random, 95% CI) | Subtotals only | |
| 7.1 Immediate outcomes 0‐8 weeks | 2 | 716 | Std. Mean Difference (IV, Random, 95% CI) | ‐0.14 [‐0.69, 0.42] |
| 7.2 Short‐term outcomes 9‐16 weeks | 5 | 3205 | Std. Mean Difference (IV, Random, 95% CI) | ‐0.35 [1.00, 0.31] |
| 7.3 Intermediate outcomes 17‐24 weeks | 5 | 8710 | Std. Mean Difference (IV, Random, 95% CI) | 0.01 [‐0.03, 0.06] |
| 7.4 Long‐term outcomes > 24 weeks | 2 | 1004 | Std. Mean Difference (IV, Random, 95% CI) | ‐0.59 [‐1.39, 0.21] |
| 8 Interventions with postnatal only component ‐ diagnosis of depression Show forest plot | 1 | Risk Ratio (M‐H, Fixed, 95% CI) | Subtotals only | |
| 8.1 Short‐term outcomes 9‐16 weeks | 1 | 612 | Risk Ratio (M‐H, Fixed, 95% CI) | 0.65 [0.34, 1.23] |
| 9 TEST FOR SUBGROUP DIFFERENCES: depressive symptomatology: at final study assessment Show forest plot | 20 | 14727 | Risk Ratio (M‐H, Random, 95% CI) | 0.78 [0.66, 0.93] |
| 9.1 Antenatal and postnatal intervention | 8 | 1941 | Risk Ratio (M‐H, Random, 95% CI) | 0.96 [0.75, 1.22] |
| 9.2 Postnatal intervention only | 12 | 12786 | Risk Ratio (M‐H, Random, 95% CI) | 0.73 [0.59, 0.90] |
| 10 TEST FOR SUBGROUP DIFFERENCES: mean depression scores: at final study assessment Show forest plot | 19 | 12376 | Std. Mean Difference (IV, Random, 95% CI) | ‐0.13 [‐0.28, 0.01] |
| 10.1 Antenatal intervention only | 4 | 1050 | Std. Mean Difference (IV, Random, 95% CI) | 0.03 [‐0.09, 0.16] |
| 10.2 Antenatal and postnatal intervention | 7 | 1000 | Std. Mean Difference (IV, Random, 95% CI) | ‐0.14 [‐0.31, 0.02] |
| 10.3 Postnatal intervention only | 8 | 10326 | Std. Mean Difference (IV, Random, 95% CI) | ‐0.16 [‐0.40, 0.08] |
| 11 TEST FOR SUBGROUP DIFFERENCES: diagnosis of depression: at final study assessment Show forest plot | 5 | 939 | Risk Ratio (M‐H, Fixed, 95% CI) | 0.48 [0.31, 0.74] |
| 11.1 Antenatal intervention only | 1 | 35 | Risk Ratio (M‐H, Fixed, 95% CI) | 0.08 [0.00, 1.34] |
| 11.2 Antenatal and postnatal intervention | 3 | 292 | Risk Ratio (M‐H, Fixed, 95% CI) | 0.44 [0.24, 0.80] |
| 11.3 Postnatal intervention only | 1 | 612 | Risk Ratio (M‐H, Fixed, 95% CI) | 0.65 [0.34, 1.23] |
| Outcome or subgroup title | No. of studies | No. of participants | Statistical method | Effect size |
| 1 Interventions for at‐risk women ‐ depressive symptomatology Show forest plot | 9 | Risk Ratio (M‐H, Random, 95% CI) | Subtotals only | |
| 1.1 Immediate outcomes 0‐8 weeks | 7 | 1301 | Risk Ratio (M‐H, Random, 95% CI) | 0.67 [0.51, 0.88] |
| 1.2 Short‐term outcomes 9‐16 weeks | 6 | 1368 | Risk Ratio (M‐H, Random, 95% CI) | 0.59 [0.47, 0.75] |
| 1.3 Intermediate outcomes 17‐24 weeks | 2 | 151 | Risk Ratio (M‐H, Random, 95% CI) | 1.34 [0.60, 2.98] |
| 1.4 Long‐term outcomes > 24 weeks | 2 | 281 | Risk Ratio (M‐H, Random, 95% CI) | 0.60 [0.29, 1.24] |
| 2 Interventions for at‐risk women ‐ mean depression scores Show forest plot | 7 | Std. Mean Difference (IV, Random, 95% CI) | Subtotals only | |
| 2.1 Immediate outcomes 0‐8 weeks | 3 | 387 | Std. Mean Difference (IV, Random, 95% CI) | ‐0.17 [‐0.52, 0.18] |
| 2.2 Short‐term outcomes 9‐16 weeks | 5 | 1067 | Std. Mean Difference (IV, Random, 95% CI) | ‐0.14 [‐0.26, ‐0.02] |
| 2.3 Intermediate outcomes 17‐24 weeks | 1 | 30 | Std. Mean Difference (IV, Random, 95% CI) | ‐0.02 [‐0.74, 0.70] |
| 2.4 Long‐term outcomes >24 weeks | 3 | 324 | Std. Mean Difference (IV, Random, 95% CI) | ‐0.00 [‐0.22, 0.22] |
| 3 Interventions for at‐risk women ‐ diagnosis of depression Show forest plot | 5 | Risk Ratio (M‐H, Fixed, 95% CI) | Subtotals only | |
| 3.1 Immediate outcomes 0‐8 weeks | 1 | 39 | Risk Ratio (M‐H, Fixed, 95% CI) | 0.09 [0.01, 1.47] |
| 3.2 Short‐term outcomes 9‐16 weeks | 4 | 902 | Risk Ratio (M‐H, Fixed, 95% CI) | 0.47 [0.30, 0.74] |
| 3.3 Intermediate outcomes 17‐24 weeks | 1 | 37 | Risk Ratio (M‐H, Fixed, 95% CI) | 0.64 [0.17, 2.46] |
| 3.4 At final study assessment | 5 | 939 | Risk Ratio (M‐H, Fixed, 95% CI) | 0.48 [0.31, 0.74] |
| 4 Interventions for general population ‐ depressive symptomatology Show forest plot | 12 | Risk Ratio (M‐H, Random, 95% CI) | Subtotals only | |
| 4.1 Immediate outcomes 0‐8 weeks | 7 | 3767 | Risk Ratio (M‐H, Random, 95% CI) | 0.69 [0.46, 1.03] |
| 4.2 Short‐term outcomes 9‐16 weeks | 4 | 2614 | Risk Ratio (M‐H, Random, 95% CI) | 0.91 [0.58, 1.42] |
| 4.3 Intermediate outcomes 17‐24 weeks | 7 | 10485 | Risk Ratio (M‐H, Random, 95% CI) | 0.92 [0.81, 1.06] |
| 4.4 Long‐term outcomes > 24 weeks | 3 | 2655 | Risk Ratio (M‐H, Random, 95% CI) | 0.71 [0.51, 0.99] |
| 5 Interventions for general population ‐ mean depression scores Show forest plot | 12 | Std. Mean Difference (IV, Random, 95% CI) | Subtotals only | |
| 5.1 Immediate outcomes 0‐8 weeks | 3 | 847 | Std. Mean Difference (IV, Random, 95% CI) | ‐0.15 [‐0.56, 0.25] |
| 5.2 Short‐term outcomes 9‐16 weeks | 4 | 2561 | Std. Mean Difference (IV, Random, 95% CI) | ‐0.40 [‐1.24, 0.44] |
| 5.3 Intermediate outcomes 17‐24 weeks | 9 | 9914 | Std. Mean Difference (IV, Random, 95% CI) | 0.01 [‐0.03, 0.05] |
| 5.4 Long‐term outcomes > 24 weeks | 4 | 2123 | Std. Mean Difference (IV, Random, 95% CI) | ‐0.28 [‐0.87, 0.30] |
| 6 TEST FOR SUBGROUP DIFFERENCES: depressive symptomatology: at final study assessment Show forest plot | 20 | 14727 | Risk Ratio (M‐H, Random, 95% CI) | 0.78 [0.66, 0.93] |
| 6.1 Interventions for at‐risk women | 8 | 1853 | Risk Ratio (M‐H, Random, 95% CI) | 0.66 [0.50, 0.88] |
| 6.2 General population | 12 | 12874 | Risk Ratio (M‐H, Random, 95% CI) | 0.83 [0.68, 1.02] |
| 7 TEST FOR SUBGROUP DIFFERENCES: mean depression scores: at final study assessment Show forest plot | 19 | 12376 | Std. Mean Difference (IV, Random, 95% CI) | ‐0.13 [‐0.28, 0.01] |
| 7.1 Interventions for at risk women | 7 | 1087 | Std. Mean Difference (IV, Random, 95% CI) | ‐0.13 [‐0.25, ‐0.01] |
| 7.2 General population | 12 | 11289 | Std. Mean Difference (IV, Random, 95% CI) | ‐0.15 [‐0.33, 0.04] |