Psychosocial and psychological interventions for preventing postpartum depression
Information
- DOI:
- https://doi.org/10.1002/14651858.CD001134.pub3Copy DOI

- Database:
-
- Cochrane Database of Systematic Reviews
- Version published:
-
- 28 February 2013see what's new
- Type:
-
- Intervention
- Stage:
-
- Review
- Cochrane Editorial Group:
-
Cochrane Pregnancy and Childbirth Group
- Copyright:
-
- Copyright © 2013 The Cochrane Collaboration. Published by John Wiley & Sons, Ltd.
Article metrics
Altmetric:
Cited by:
Authors
Contributions of authors
Dr Dennis independently evaluated the trials for quality, extracted and entered data, completed the meta‐analysis, and wrote the text of the review and the conclusion. T Dowswell contributed to data extraction in this update, and commented on data analysis and drafts of the text.
Sources of support
Internal sources
-
University of Toronto, Canada.
External sources
-
NIHR, UK.
TD is supported by the NIHR NHS Cochrane Collaboration Programme grant scheme award for NHS‐prioritised centrally‐managed, pregnancy and childbirth systematic reviews: CPGS 10/4001/02
Declarations of interest
Dr Dennis is a principal investigator for a multi‐site trial included in this review that evaluated the effect of telephone‐based peer (mother‐to‐mother) support in the prevention of postpartum depression among mothers identified as high‐risk (Dennis 2009).
Acknowledgements
The review authors gratefully acknowledge Dr Debra Creedy who assisted Dr Dennis with the first version of this review in 2004. The review authors also wish to thank: (1) Julie Weston for her data extraction, independent evaluation of trial quality, contacting trial authors as necessary, and data entry; (2) Danni Li for translating Sun 2004; Tang 2009; Xu 2003. Edward Plaisance Jr for translating Ajh 2006. Alison Balmfirth, Laura Wills, Ed Doragh and Nivene Raafat for translating Bittner 2009. Aoife Fogarty for translating Kleeb 2005. Francesca Gatenby, Nick Jones, Juliet Sheath for translating Urech 2009; and (3) the many study authors who were very helpful in responding to queries and providing additional data.
As part of the pre‐publication editorial process, this review has been commented on by four peers (an editor and three referees who are external to the editorial team), a member of the Pregnancy and Childbirth Group's international panel of consumers and the Group's Statistical Adviser.
Version history
| Published | Title | Stage | Authors | Version |
| 2013 Feb 28 | Psychosocial and psychological interventions for preventing postpartum depression | Review | Cindy‐Lee Dennis, Therese Dowswell | |
| 2004 Oct 18 | Psychosocial and psychological interventions for preventing postpartum depression | Review | Cindy‐Lee Dennis, Debra K Creedy | |
| 2001 Oct 23 | Psychosocial interventions for preventing postpartum depression | Protocol | Cindy‐Lee E Dennis, Josephine Kavanagh | |
Differences between protocol and review
The title of the previously published protocol was 'Psychosocial interventions for preventing postpartum depression'.
Keywords
MeSH
Medical Subject Headings (MeSH) Keywords
Medical Subject Headings Check Words
Female; Humans;
PICOs

'Risk of bias' summary: review authors' judgements about each risk of bias item for each included study.

'Risk of bias' graph: review authors' judgements about each risk of bias item presented as percentages across all included studies.

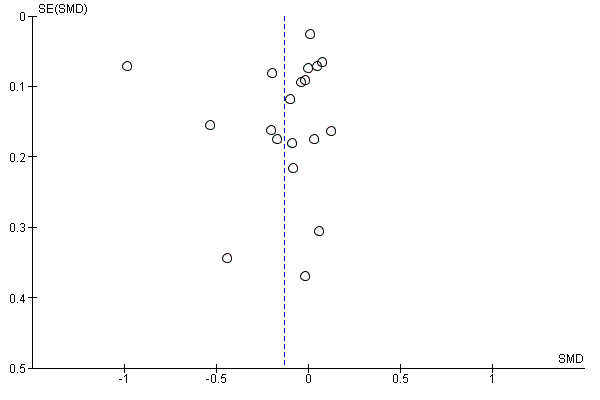
Funnel plot of comparison: 1 All interventions versus usual care ‐ various study outcomes, outcome: 1.1 Depressive symptomatology at final study assessment.
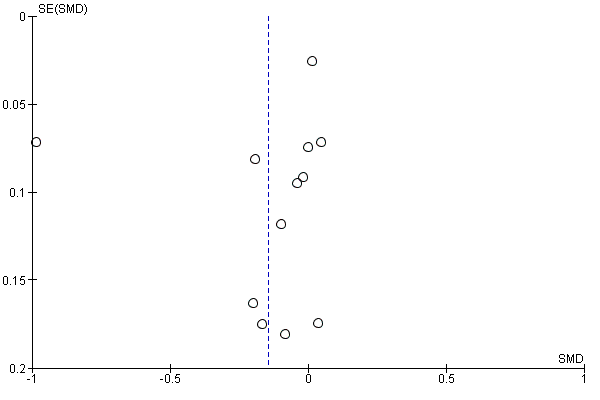
Funnel plot of comparison: 1 All interventions versus usual care ‐ various study outcomes, outcome: 1.2 Mean depression scores at final study assessment.

Funnel plot of comparison: 2 All psychosocial interventions versus usual care ‐ variations in intervention type, outcome: 2.4 All psychosocial interventions: depressive symptomatology at final study assessment.
Funnel plot of comparison: 2 All psychosocial interventions versus usual care ‐ variations in intervention type, outcome: 2.5 All psychosocial interventions: mean depression scores.

Comparison 1 All psychosocial and psychological interventions versus usual care ‐ various study outcomes, Outcome 1 Depressive symptomatology at final study assessment.

Comparison 1 All psychosocial and psychological interventions versus usual care ‐ various study outcomes, Outcome 2 Mean depression scores at final study assessment.

Comparison 1 All psychosocial and psychological interventions versus usual care ‐ various study outcomes, Outcome 3 Diagnosis of depression at final study assessment.

Comparison 1 All psychosocial and psychological interventions versus usual care ‐ various study outcomes, Outcome 4 Depressive symptomatology at 8, 16, 24, and > 24 weeks.

Comparison 1 All psychosocial and psychological interventions versus usual care ‐ various study outcomes, Outcome 5 Mean depression scores at 8, 16, 24, and > 24 weeks.

Comparison 1 All psychosocial and psychological interventions versus usual care ‐ various study outcomes, Outcome 6 Diagnosis of depression at 8, 16, 24, and > 24 weeks.

Comparison 1 All psychosocial and psychological interventions versus usual care ‐ various study outcomes, Outcome 7 Maternal mortality at > 24 weeks.

Comparison 1 All psychosocial and psychological interventions versus usual care ‐ various study outcomes, Outcome 8 Maternal‐infant attachment at 8, 16, and 24 weeks.

Comparison 1 All psychosocial and psychological interventions versus usual care ‐ various study outcomes, Outcome 9 Mean maternal‐infant attachment scores at 8, 16, 24, and > 24 weeks.

Comparison 1 All psychosocial and psychological interventions versus usual care ‐ various study outcomes, Outcome 10 Anxiety at 8, 16, and 24 weeks.

Comparison 1 All psychosocial and psychological interventions versus usual care ‐ various study outcomes, Outcome 11 Mean anxiety scores at 8, 16, 24, and > 24 weeks.

Comparison 1 All psychosocial and psychological interventions versus usual care ‐ various study outcomes, Outcome 12 Maternal stress at 16 weeks.

Comparison 1 All psychosocial and psychological interventions versus usual care ‐ various study outcomes, Outcome 13 Mean maternal stress scores at 24 and > 24 weeks.

Comparison 1 All psychosocial and psychological interventions versus usual care ‐ various study outcomes, Outcome 14 Mean parental stress scores at 8, 24, and > 24 weeks.

Comparison 1 All psychosocial and psychological interventions versus usual care ‐ various study outcomes, Outcome 15 Perceived social support at 8 and 16 weeks.

Comparison 1 All psychosocial and psychological interventions versus usual care ‐ various study outcomes, Outcome 16 Mean perceived social support scores at 8, 16, 24, and > 24 weeks.

Comparison 1 All psychosocial and psychological interventions versus usual care ‐ various study outcomes, Outcome 17 Maternal dissatisfaction with care provided at 8, 16, and 24 weeks.

Comparison 1 All psychosocial and psychological interventions versus usual care ‐ various study outcomes, Outcome 18 Mean maternal dissatisfaction scores at 8 and 16 weeks.

Comparison 1 All psychosocial and psychological interventions versus usual care ‐ various study outcomes, Outcome 19 Infant health parameters ‐ not fully immunized at > 24 weeks.

Comparison 1 All psychosocial and psychological interventions versus usual care ‐ various study outcomes, Outcome 20 Infant development > 24 weeks.

Comparison 1 All psychosocial and psychological interventions versus usual care ‐ various study outcomes, Outcome 21 Child abuse at 8 and > 24 weeks.

Comparison 1 All psychosocial and psychological interventions versus usual care ‐ various study outcomes, Outcome 22 Mean marital discord scores at 8, 16, and 24 weeks.

Comparison 2 All psychosocial interventions versus usual care ‐ variations in intervention type, Outcome 1 All psychosocial interventions ‐ depressive symptomatology.

Comparison 2 All psychosocial interventions versus usual care ‐ variations in intervention type, Outcome 2 All psychosocial interventions ‐ mean depression scores.

Comparison 2 All psychosocial interventions versus usual care ‐ variations in intervention type, Outcome 3 All psychosocial interventions ‐ diagnosis of depression.

Comparison 2 All psychosocial interventions versus usual care ‐ variations in intervention type, Outcome 4 All psychosocial interventions: depressive symptomatology at final study assessment.

Comparison 2 All psychosocial interventions versus usual care ‐ variations in intervention type, Outcome 5 All psychosocial interventions: mean depression scores.

Comparison 3 All psychological interventions versus usual care ‐ variations in intervention type, Outcome 1 All psychological interventions ‐ depressive symptomatology.

Comparison 3 All psychological interventions versus usual care ‐ variations in intervention type, Outcome 2 All psychological interventions ‐ mean depression scores.

Comparison 3 All psychological interventions versus usual care ‐ variations in intervention type, Outcome 3 All psychological interventions ‐ diagnosis of depression.

Comparison 4 Subgroup analysis: variations in psychosocial interventions, Outcome 1 TEST FOR SUBGROUP DIFFERENCES: depressive symptomatology at final study assessment.

Comparison 4 Subgroup analysis: variations in psychosocial interventions, Outcome 2 TEST FOR SUBGROUP DIFFERENCES: mean depression score at final study assessment.

Comparison 5 Subgroup analysis: variations in psychological interventions, Outcome 1 TEST FOR SUBGROUP DIFFERENCES: depressive symptomatology at final study assessment.

Comparison 5 Subgroup analysis: variations in psychological interventions, Outcome 2 TEST FOR SUBGROUP DIFFERENCES: mean depression score at final study assessment.

Comparison 6 Subgroup analysis: variations in intervention provider, Outcome 1 Professionally‐based interventions ‐ depressive symptomatology.

Comparison 6 Subgroup analysis: variations in intervention provider, Outcome 2 Professionally‐based interventions ‐ mean depression scores.

Comparison 6 Subgroup analysis: variations in intervention provider, Outcome 3 Professionally‐based interventions ‐ diagnosis of depression.

Comparison 6 Subgroup analysis: variations in intervention provider, Outcome 4 Lay‐based interventions ‐ depressive symptomatology.

Comparison 6 Subgroup analysis: variations in intervention provider, Outcome 5 Lay‐based interventions ‐ mean depression scores.

Comparison 6 Subgroup analysis: variations in intervention provider, Outcome 6 Lay‐based interventions ‐ diagnosis of depression.

Comparison 6 Subgroup analysis: variations in intervention provider, Outcome 7 TEST FOR SUBGROUP DIFFERENCES: depressive symptomatology: at final study assessment.

Comparison 6 Subgroup analysis: variations in intervention provider, Outcome 8 TEST FOR SUBGROUP DIFFERENCES: mean depression scores: at final study assessment.

Comparison 6 Subgroup analysis: variations in intervention provider, Outcome 9 TEST FOR SUBGROUP DIFFERENCES: diagnosis of depression: at final study assessment.

Comparison 7 Subgroup analysis: variations in professionally‐based intervention provider, Outcome 1 TEST FOR SUBGROUP DIFFERENCES: depressive symptomatology at final study assessment.

Comparison 7 Subgroup analysis: variations in professionally‐based intervention provider, Outcome 2 TEST FOR SUBGROUP DIFFERENCES: mean depression score at final study assessment.

Comparison 8 Subgroup analysis: variations in intervention mode, Outcome 1 Individually‐based interventions ‐ depressive symptomatology.

Comparison 8 Subgroup analysis: variations in intervention mode, Outcome 2 Individually‐based interventions ‐ mean depression scores.

Comparison 8 Subgroup analysis: variations in intervention mode, Outcome 3 Individually‐based interventions ‐ diagnosis of depression.

Comparison 8 Subgroup analysis: variations in intervention mode, Outcome 4 Group‐based interventions ‐ depressive symptomatology.

Comparison 8 Subgroup analysis: variations in intervention mode, Outcome 5 Group‐based interventions ‐ mean depression scores.

Comparison 8 Subgroup analysis: variations in intervention mode, Outcome 6 Group‐based interventions ‐ diagnosis of depression.

Comparison 8 Subgroup analysis: variations in intervention mode, Outcome 7 TEST FOR SUBGROUP DIFFERENCES: depressive symptomatology: at final study assessment.

Comparison 8 Subgroup analysis: variations in intervention mode, Outcome 8 TEST FOR SUBGROUP DIFFERENCES: mean depression scores: at final study assessment.

Comparison 8 Subgroup analysis: variations in intervention mode, Outcome 9 TEST FOR SUBGROUP DIFFERENCES: diagnosis of depression: at final study assessment.

Comparison 9 Subgroup analysis: variations in intervention duration, Outcome 1 Single‐contact interventions ‐ depressive symptomatology.

Comparison 9 Subgroup analysis: variations in intervention duration, Outcome 2 Single‐contact interventions ‐ mean depression scores.

Comparison 9 Subgroup analysis: variations in intervention duration, Outcome 3 Multiple‐contact interventions ‐ depressive symptomatology.

Comparison 9 Subgroup analysis: variations in intervention duration, Outcome 4 Multiple‐contact interventions ‐ mean depression scores.

Comparison 9 Subgroup analysis: variations in intervention duration, Outcome 5 Multiple‐contact interventions ‐ diagnosis of depression.

Comparison 9 Subgroup analysis: variations in intervention duration, Outcome 6 TEST FOR SUBGROUP DIFFERENCES: depressive symptomatology: at final study assessment.

Comparison 9 Subgroup analysis: variations in intervention duration, Outcome 7 TEST FOR SUBGROUP DIFFERENCES: mean depression scores: at final study assessment.

Comparison 10 Subgroup analysis: variations in intervention onset, Outcome 1 Interventions with antenatal only component ‐ mean depression scores.

Comparison 10 Subgroup analysis: variations in intervention onset, Outcome 2 Interventions with antenatal only component ‐ diagnosis of depression.

Comparison 10 Subgroup analysis: variations in intervention onset, Outcome 3 Interventions with antenatal and postnatal components ‐ depressive symptomatology.

Comparison 10 Subgroup analysis: variations in intervention onset, Outcome 4 Interventions with antenatal and postnatal components ‐ mean depression scores.

Comparison 10 Subgroup analysis: variations in intervention onset, Outcome 5 Interventions with antenatal and postnatal components ‐ diagnosis of depression.

Comparison 10 Subgroup analysis: variations in intervention onset, Outcome 6 Interventions with postnatal only component ‐ depressive symptomatology.

Comparison 10 Subgroup analysis: variations in intervention onset, Outcome 7 Interventions with postnatal only component ‐ mean depression scores.

Comparison 10 Subgroup analysis: variations in intervention onset, Outcome 8 Interventions with postnatal only component ‐ diagnosis of depression.

Comparison 10 Subgroup analysis: variations in intervention onset, Outcome 9 TEST FOR SUBGROUP DIFFERENCES: depressive symptomatology: at final study assessment.

Comparison 10 Subgroup analysis: variations in intervention onset, Outcome 10 TEST FOR SUBGROUP DIFFERENCES: mean depression scores: at final study assessment.

Comparison 10 Subgroup analysis: variations in intervention onset, Outcome 11 TEST FOR SUBGROUP DIFFERENCES: diagnosis of depression: at final study assessment.

Comparison 11 Subgroup analysis: variations in sample selection criteria, Outcome 1 Interventions for at‐risk women ‐ depressive symptomatology.

Comparison 11 Subgroup analysis: variations in sample selection criteria, Outcome 2 Interventions for at‐risk women ‐ mean depression scores.

Comparison 11 Subgroup analysis: variations in sample selection criteria, Outcome 3 Interventions for at‐risk women ‐ diagnosis of depression.

Comparison 11 Subgroup analysis: variations in sample selection criteria, Outcome 4 Interventions for general population ‐ depressive symptomatology.

Comparison 11 Subgroup analysis: variations in sample selection criteria, Outcome 5 Interventions for general population ‐ mean depression scores.

Comparison 11 Subgroup analysis: variations in sample selection criteria, Outcome 6 TEST FOR SUBGROUP DIFFERENCES: depressive symptomatology: at final study assessment.

Comparison 11 Subgroup analysis: variations in sample selection criteria, Outcome 7 TEST FOR SUBGROUP DIFFERENCES: mean depression scores: at final study assessment.
| Outcome or subgroup title | No. of studies | No. of participants | Statistical method | Effect size |
| 1 Depressive symptomatology at final study assessment Show forest plot | 20 | 14727 | Risk Ratio (M‐H, Random, 95% CI) | 0.78 [0.66, 0.93] |
| 2 Mean depression scores at final study assessment Show forest plot | 19 | 12376 | Std. Mean Difference (IV, Random, 95% CI) | ‐0.13 [‐0.28, 0.01] |
| 3 Diagnosis of depression at final study assessment Show forest plot | 5 | 939 | Risk Ratio (M‐H, Random, 95% CI) | 0.50 [0.32, 0.78] |
| 4 Depressive symptomatology at 8, 16, 24, and > 24 weeks Show forest plot | 20 | Risk Ratio (M‐H, Random, 95% CI) | Subtotals only | |
| 4.1 Immediate outcomes 0‐8 weeks | 13 | 4907 | Risk Ratio (M‐H, Random, 95% CI) | 0.73 [0.56, 0.95] |
| 4.2 Short‐term outcome 9‐16 weeks | 10 | 3982 | Risk Ratio (M‐H, Random, 95% CI) | 0.73 [0.56, 0.97] |
| 4.3 Intermediate outcome 17‐24 weeks | 9 | 10636 | Risk Ratio (M‐H, Random, 95% CI) | 0.93 [0.82, 1.05] |
| 4.4 Long‐term outcome > 24 weeks | 5 | 2936 | Risk Ratio (M‐H, Random, 95% CI) | 0.66 [0.54, 0.82] |
| 5 Mean depression scores at 8, 16, 24, and > 24 weeks Show forest plot | 19 | Std. Mean Difference (IV, Random, 95% CI) | Subtotals only | |
| 5.1 Immediate outcomes: 0‐8 weeks | 6 | 1234 | Std. Mean Difference (IV, Random, 95% CI) | ‐0.16 [‐0.41, 0.09] |
| 5.2 Short‐term outcome 9‐16 weeks | 9 | 3628 | Std. Mean Difference (IV, Random, 95% CI) | ‐0.26 [‐0.72, 0.20] |
| 5.3 Intermediate outcome 17‐24 weeks | 10 | 9944 | Std. Mean Difference (IV, Random, 95% CI) | 0.01 [‐0.03, 0.05] |
| 5.4 Long‐term outcome > 24 weeks | 7 | 2447 | Std. Mean Difference (IV, Random, 95% CI) | ‐0.17 [‐0.58, 0.25] |
| 6 Diagnosis of depression at 8, 16, 24, and > 24 weeks Show forest plot | 5 | Risk Ratio (M‐H, Random, 95% CI) | Subtotals only | |
| 6.1 Immediate outcomes 0‐8 weeks | 1 | 39 | Risk Ratio (M‐H, Random, 95% CI) | 0.09 [0.01, 1.47] |
| 6.2 Short‐term outcomes 9‐16 weeks postpartum | 4 | 902 | Risk Ratio (M‐H, Random, 95% CI) | 0.49 [0.31, 0.77] |
| 6.3 Intermediate outcome: 17‐24 weeks | 1 | 37 | Risk Ratio (M‐H, Random, 95% CI) | 0.64 [0.17, 2.46] |
| 7 Maternal mortality at > 24 weeks Show forest plot | 1 | 234 | Risk Ratio (M‐H, Random, 95% CI) | 0.97 [0.06, 15.27] |
| 8 Maternal‐infant attachment at 8, 16, and 24 weeks Show forest plot | 1 | Risk Ratio (M‐H, Random, 95% CI) | Subtotals only | |
| 8.1 Immediate outcomes 0‐8 weeks | 1 | 133 | Risk Ratio (M‐H, Random, 95% CI) | 1.01 [0.64, 1.59] |
| 8.2 Short‐term outcome 9‐16 weeks | 1 | 126 | Risk Ratio (M‐H, Random, 95% CI) | 1.29 [0.78, 2.13] |
| 8.3 Intermediate outcome 17‐24 weeks | 1 | 127 | Risk Ratio (M‐H, Random, 95% CI) | 0.89 [0.59, 1.34] |
| 9 Mean maternal‐infant attachment scores at 8, 16, 24, and > 24 weeks Show forest plot | 2 | Std. Mean Difference (IV, Random, 95% CI) | Subtotals only | |
| 9.1 Immediate outcomes 0‐8 weeks | 1 | 176 | Std. Mean Difference (IV, Random, 95% CI) | ‐0.11 [‐0.40, 0.19] |
| 9.2 Short‐term outcome 9‐16 weeks | 1 | 160 | Std. Mean Difference (IV, Random, 95% CI) | ‐0.20 [‐0.51, 0.11] |
| 9.3 Intermediate outcome 17‐24 weeks | 1 | 152 | Std. Mean Difference (IV, Random, 95% CI) | ‐0.22 [‐0.54, 0.10] |
| 9.4 Long‐term outcome > 24 weeks | 1 | 116 | Std. Mean Difference (IV, Random, 95% CI) | ‐0.12 [‐0.49, 0.24] |
| 9.5 At final study assessment | 2 | 268 | Std. Mean Difference (IV, Random, 95% CI) | ‐0.18 [‐0.42, 0.06] |
| 10 Anxiety at 8, 16, and 24 weeks Show forest plot | 4 | Risk Ratio (M‐H, Random, 95% CI) | Subtotals only | |
| 10.1 Immediate outcomes 0‐8 weeks | 2 | 245 | Risk Ratio (M‐H, Random, 95% CI) | 0.35 [0.05, 2.34] |
| 10.2 Short‐term outcome 9‐16 weeks | 3 | 843 | Risk Ratio (M‐H, Random, 95% CI) | 0.41 [0.12, 1.41] |
| 10.3 Intermediate outcome 17‐24 weeks | 1 | 130 | Risk Ratio (M‐H, Random, 95% CI) | 0.94 [0.25, 3.60] |
| 10.4 At final study assessment | 4 | 959 | Risk Ratio (M‐H, Random, 95% CI) | 0.40 [0.14, 1.14] |
| 11 Mean anxiety scores at 8, 16, 24, and > 24 weeks Show forest plot | 4 | Std. Mean Difference (IV, Random, 95% CI) | Subtotals only | |
| 11.1 Immediate outcomes 0‐8 weeks | 2 | 163 | Std. Mean Difference (IV, Random, 95% CI) | ‐0.09 [‐0.39, 0.22] |
| 11.2 Short‐term outcome 9‐16 weeks | 2 | 740 | Std. Mean Difference (IV, Random, 95% CI) | ‐0.15 [‐0.30, ‐0.01] |
| 11.3 Intermediate outcome 17‐24 weeks | 2 | 160 | Std. Mean Difference (IV, Random, 95% CI) | ‐0.24 [‐0.55, 0.07] |
| 11.4 Long‐term outcome > 24 weeks | 1 | 43 | Std. Mean Difference (IV, Random, 95% CI) | ‐0.17 [‐0.77, 0.43] |
| 11.5 At final study assessment | 4 | 815 | Std. Mean Difference (IV, Random, 95% CI) | ‐0.16 [‐0.30, ‐0.03] |
| 12 Maternal stress at 16 weeks Show forest plot | 1 | Risk Ratio (M‐H, Random, 95% CI) | Subtotals only | |
| 12.1 Short‐term outcome 9‐16 weeks | 1 | 103 | Risk Ratio (M‐H, Random, 95% CI) | 0.44 [0.20, 0.96] |
| 13 Mean maternal stress scores at 24 and > 24 weeks Show forest plot | 1 | Mean Difference (IV, Random, 95% CI) | Subtotals only | |
| 13.1 Intermediate outcome 17‐24 weeks | 1 | 787 | Mean Difference (IV, Random, 95% CI) | 0.0 [‐1.02, 1.02] |
| 13.2 Long‐term outcome > 24 weeks | 1 | 840 | Mean Difference (IV, Random, 95% CI) | 0.5 [‐0.51, 1.51] |
| 14 Mean parental stress scores at 8, 24, and > 24 weeks Show forest plot | 3 | Std. Mean Difference (IV, Random, 95% CI) | Subtotals only | |
| 14.1 Immediate outcomes 0‐8 weeks | 1 | 176 | Std. Mean Difference (IV, Random, 95% CI) | ‐0.08 [‐0.37, 0.22] |
| 14.2 Intermediate outcome 17‐24 weeks | 1 | 124 | Std. Mean Difference (IV, Random, 95% CI) | ‐0.27 [‐0.62, 0.09] |
| 14.3 Long‐term outcome > 24 weeks | 2 | 341 | Std. Mean Difference (IV, Random, 95% CI) | 0.27 [0.05, 0.48] |
| 14.4 At final study assessment | 3 | 465 | Std. Mean Difference (IV, Random, 95% CI) | 0.11 [‐0.25, 0.48] |
| 15 Perceived social support at 8 and 16 weeks Show forest plot | 2 | Risk Ratio (M‐H, Random, 95% CI) | Subtotals only | |
| 15.1 Immediate outcomes 0‐8 weeks | 1 | 528 | Risk Ratio (M‐H, Random, 95% CI) | 0.68 [0.45, 1.05] |
| 15.2 Short‐term outcome 9‐16 weeks | 1 | 190 | Risk Ratio (M‐H, Random, 95% CI) | 1.02 [0.34, 3.05] |
| 15.3 At final study assessment | 2 | 718 | Risk Ratio (M‐H, Random, 95% CI) | 0.72 [0.48, 1.08] |
| 16 Mean perceived social support scores at 8, 16, 24, and > 24 weeks Show forest plot | 7 | Std. Mean Difference (IV, Random, 95% CI) | Subtotals only | |
| 16.1 Immediate outcomes 0‐8 weeks | 3 | 822 | Std. Mean Difference (IV, Random, 95% CI) | 0.02 [‐0.13, 0.17] |
| 16.2 Short‐term outcome 9‐16 weeks | 2 | 863 | Std. Mean Difference (IV, Random, 95% CI) | 0.16 [‐0.21, 0.53] |
| 16.3 Intermediate outcome 17‐24 weeks | 6 | 8122 | Std. Mean Difference (IV, Random, 95% CI) | 0.03 [‐0.06, 0.12] |
| 16.4 Long‐term outcome > 24 weeks | 2 | 955 | Std. Mean Difference (IV, Random, 95% CI) | ‐0.07 [‐0.20, 0.06] |
| 16.5 At final study assessment | 7 | 8290 | Std. Mean Difference (IV, Random, 95% CI) | 0.01 [‐0.08, 0.10] |
| 17 Maternal dissatisfaction with care provided at 8, 16, and 24 weeks Show forest plot | 4 | Risk Ratio (M‐H, Random, 95% CI) | Subtotals only | |
| 17.1 Immediate outcomes 0‐8 weeks | 2 | 825 | Risk Ratio (M‐H, Random, 95% CI) | 0.56 [0.29, 1.09] |
| 17.2 Short‐term outcome 9‐16 weeks | 1 | 1278 | Risk Ratio (M‐H, Random, 95% CI) | 0.88 [0.65, 1.19] |
| 17.3 Intermediate outcome 17‐24 weeks | 1 | 911 | Risk Ratio (M‐H, Random, 95% CI) | 0.75 [0.44, 1.25] |
| 17.4 At final study assessment | 4 | 3014 | Risk Ratio (M‐H, Random, 95% CI) | 0.67 [0.44, 1.00] |
| 18 Mean maternal dissatisfaction scores at 8 and 16 weeks Show forest plot | 2 | Std. Mean Difference (IV, Random, 95% CI) | Subtotals only | |
| 18.1 Immediate outcomes 0‐8 weeks | 1 | 516 | Std. Mean Difference (IV, Random, 95% CI) | 0.0 [‐0.17, 0.17] |
| 18.2 Short‐term outcome 9‐16 weeks | 1 | 160 | Std. Mean Difference (IV, Random, 95% CI) | 0.90 [0.58, 1.23] |
| 18.3 At final study assessment | 2 | 676 | Std. Mean Difference (IV, Random, 95% CI) | 0.44 [‐0.44, 1.32] |
| 19 Infant health parameters ‐ not fully immunized at > 24 weeks Show forest plot | 1 | 884 | Risk Ratio (M‐H, Random, 95% CI) | 1.16 [0.39, 3.43] |
| 20 Infant development > 24 weeks Show forest plot | 1 | 280 | Mean Difference (IV, Random, 95% CI) | ‐0.90 [‐2.90, 1.10] |
| 20.1 Bayley (BSID‐II) | 1 | 280 | Mean Difference (IV, Random, 95% CI) | ‐0.90 [‐2.90, 1.10] |
| 21 Child abuse at 8 and > 24 weeks Show forest plot | 1 | Mean Difference (IV, Random, 95% CI) | Subtotals only | |
| 21.1 Immediate outcomes 0‐8 weeks | 1 | 176 | Mean Difference (IV, Random, 95% CI) | ‐35.66 [‐62.65, ‐8.67] |
| 21.2 Long‐term outcome > 24 weeks | 1 | 66 | Mean Difference (IV, Random, 95% CI) | ‐41.90 [‐87.48, 3.68] |
| 22 Mean marital discord scores at 8, 16, and 24 weeks Show forest plot | 3 | Std. Mean Difference (IV, Random, 95% CI) | Subtotals only | |
| 22.1 Immediate outcomes 0‐8 weeks | 2 | 163 | Std. Mean Difference (IV, Random, 95% CI) | ‐0.03 [‐0.34, 0.28] |
| 22.2 Short‐term outcome 9‐16 weeks | 1 | 127 | Std. Mean Difference (IV, Random, 95% CI) | ‐0.28 [‐0.63, 0.07] |
| 22.3 Intermediate outcome 17‐24 weeks | 3 | 291 | Std. Mean Difference (IV, Random, 95% CI) | ‐0.14 [‐0.37, 0.09] |
| 22.4 At final study assessment | 3 | 291 | Std. Mean Difference (IV, Random, 95% CI) | ‐0.14 [‐0.37, 0.09] |
| Outcome or subgroup title | No. of studies | No. of participants | Statistical method | Effect size |
| 1 All psychosocial interventions ‐ depressive symptomatology Show forest plot | 12 | Risk Ratio (M‐H, Random, 95% CI) | Subtotals only | |
| 1.1 Immediate outcome ‐ 0‐8 weeks | 6 | 2138 | Risk Ratio (M‐H, Random, 95% CI) | 0.77 [0.52, 1.14] |
| 1.2 Short‐term outcomes 9‐16 weeks | 8 | 3705 | Risk Ratio (M‐H, Random, 95% CI) | 0.80 [0.61, 1.06] |
| 1.3 Intermediate outcomes 17‐24 weeks | 6 | 8116 | Risk Ratio (M‐H, Random, 95% CI) | 0.88 [0.78, 1.00] |
| 1.4 Long‐term outcomes >24 weeks | 3 | 1385 | Risk Ratio (M‐H, Random, 95% CI) | 0.59 [0.46, 0.76] |
| 1.5 At final study assessment | 12 | 11322 | Risk Ratio (M‐H, Random, 95% CI) | 0.83 [0.70, 0.99] |
| 2 All psychosocial interventions ‐ mean depression scores Show forest plot | 12 | Std. Mean Difference (IV, Random, 95% CI) | Subtotals only | |
| 2.1 Immediate outcomes 0‐8 weeks | 3 | 849 | Std. Mean Difference (IV, Random, 95% CI) | ‐0.12 [‐0.47, 0.23] |
| 2.2 Short‐term outcomes 9‐16 weeks | 6 | 3333 | Std. Mean Difference (IV, Random, 95% CI) | ‐0.32 [‐0.90, 0.25] |
| 2.3 Intermediate outcomes 17‐24 weeks | 8 | 8998 | Std. Mean Difference (IV, Random, 95% CI) | 0.00 [‐0.04, 0.05] |
| 2.4 Long‐term outcomes > 24 weeks | 5 | 2254 | Std. Mean Difference (IV, Random, 95% CI) | ‐0.26 [‐0.76, 0.24] |
| 2.5 At final study assessment | 12 | 10944 | Std. Mean Difference (IV, Random, 95% CI) | ‐0.14 [‐0.33, 0.04] |
| 3 All psychosocial interventions ‐ diagnosis of depression Show forest plot | 3 | Risk Ratio (M‐H, Fixed, 95% CI) | Subtotals only | |
| 3.1 Short‐term outcomes 9‐16 weeks | 3 | 867 | Risk Ratio (M‐H, Fixed, 95% CI) | 0.52 [0.33, 0.83] |
| 4 All psychosocial interventions: depressive symptomatology at final study assessment Show forest plot | 12 | 11322 | Risk Ratio (M‐H, Random, 95% CI) | 0.83 [0.70, 0.99] |
| 5 All psychosocial interventions: mean depression scores Show forest plot | 12 | 10944 | Std. Mean Difference (IV, Random, 95% CI) | ‐0.14 [‐0.33, 0.04] |
| Outcome or subgroup title | No. of studies | No. of participants | Statistical method | Effect size |
| 1 All psychological interventions ‐ depressive symptomatology Show forest plot | 8 | Risk Ratio (M‐H, Random, 95% CI) | Subtotals only | |
| 1.1 Immediate outcomes 0‐8 weeks | 7 | 2760 | Risk Ratio (M‐H, Random, 95% CI) | 0.69 [0.47, 1.02] |
| 1.2 Short‐term outcomes 9‐16 weeks | 2 | 277 | Risk Ratio (M‐H, Random, 95% CI) | 0.40 [0.18, 0.89] |
| 1.3 Intermediate outcomes 17‐24 weeks | 3 | 2520 | Risk Ratio (M‐H, Random, 95% CI) | 1.04 [0.83, 1.30] |
| 1.4 Long‐term outcomes >24 weeks | 2 | 1551 | Risk Ratio (M‐H, Random, 95% CI) | 0.86 [0.58, 1.28] |
| 1.5 At final study assessment | 8 | 3405 | Risk Ratio (M‐H, Random, 95% CI) | 0.61 [0.39, 0.96] |
| 2 All psychological interventions ‐ mean depression scores Show forest plot | 7 | Std. Mean Difference (IV, Random, 95% CI) | Subtotals only | |
| 2.1 immediate outcome 0‐8 weeks | 3 | 385 | Std. Mean Difference (IV, Random, 95% CI) | ‐0.20 [‐0.63, 0.22] |
| 2.2 Short‐term outcomes 9‐16 weeks | 3 | 295 | Std. Mean Difference (IV, Random, 95% CI) | ‐0.03 [‐0.27, 0.21] |
| 2.3 Intermediate outcomes 17‐24 weeks | 2 | 946 | Std. Mean Difference (IV, Random, 95% CI) | 0.08 [‐0.05, 0.20] |
| 2.4 Long‐term outcomes > 24 weeks | 2 | 193 | Std. Mean Difference (IV, Random, 95% CI) | 0.11 [‐0.17, 0.39] |
| 2.5 At final study assessment | 7 | 1432 | Std. Mean Difference (IV, Random, 95% CI) | ‐0.10 [‐0.32, 0.13] |
| 3 All psychological interventions ‐ diagnosis of depression Show forest plot | 2 | Risk Ratio (M‐H, Random, 95% CI) | Subtotals only | |
| 3.1 Diagnosis of depression ‐ 0‐8 weeks | 1 | 39 | Risk Ratio (M‐H, Random, 95% CI) | 0.09 [0.01, 1.47] |
| 3.2 Short‐term outcomes 9‐16 weeks | 1 | 35 | Risk Ratio (M‐H, Random, 95% CI) | 0.08 [0.00, 1.34] |
| 3.3 Intermediate outcomes 17‐24 weeks | 1 | 37 | Risk Ratio (M‐H, Random, 95% CI) | 0.64 [0.17, 2.46] |
| 3.4 At final study assessment | 2 | 72 | Risk Ratio (M‐H, Random, 95% CI) | 0.31 [0.04, 2.52] |
| Outcome or subgroup title | No. of studies | No. of participants | Statistical method | Effect size |
| 1 TEST FOR SUBGROUP DIFFERENCES: depressive symptomatology at final study assessment Show forest plot | 12 | 11322 | Risk Ratio (M‐H, Random, 95% CI) | 0.83 [0.70, 0.99] |
| 1.1 Antenatal and postnatal classes | 4 | 1488 | Risk Ratio (M‐H, Random, 95% CI) | 1.01 [0.77, 1.32] |
| 1.2 Postpartum professional‐based home visits | 2 | 1262 | Risk Ratio (M‐H, Random, 95% CI) | 0.56 [0.43, 0.73] |
| 1.3 Postpartum lay‐based home visits | 1 | 493 | Risk Ratio (M‐H, Random, 95% CI) | 0.88 [0.62, 1.25] |
| 1.4 Postpartum lay‐based telephone support | 1 | 612 | Risk Ratio (M‐H, Random, 95% CI) | 0.54 [0.38, 0.77] |
| 1.5 Early postpartum follow‐up | 1 | 446 | Risk Ratio (M‐H, Random, 95% CI) | 0.90 [0.55, 1.49] |
| 1.6 Continuity model of care | 3 | 7021 | Risk Ratio (M‐H, Random, 95% CI) | 0.99 [0.71, 1.36] |
| 2 TEST FOR SUBGROUP DIFFERENCES: mean depression score at final study assessment Show forest plot | 4 | 1411 | Std. Mean Difference (IV, Fixed, 95% CI) | ‐0.01 [‐0.12, 0.10] |
| 2.1 Antenatal and postnatal classes | 3 | 1124 | Std. Mean Difference (IV, Fixed, 95% CI) | 0.01 [‐0.11, 0.13] |
| 2.2 Antenatal and postnatal lay‐based home visits and telephone support | 1 | 287 | Std. Mean Difference (IV, Fixed, 95% CI) | ‐0.10 [‐0.33, 0.14] |
| Outcome or subgroup title | No. of studies | No. of participants | Statistical method | Effect size |
| 1 TEST FOR SUBGROUP DIFFERENCES: depressive symptomatology at final study assessment Show forest plot | 6 | 3200 | Risk Ratio (M‐H, Random, 95% CI) | 0.59 [0.35, 1.01] |
| 1.1 Psychological debriefing | 5 | 3050 | Risk Ratio (M‐H, Random, 95% CI) | 0.57 [0.31, 1.03] |
| 1.2 Cognitive behavioural therapy | 1 | 150 | Risk Ratio (M‐H, Random, 95% CI) | 0.74 [0.29, 1.88] |
| 2 TEST FOR SUBGROUP DIFFERENCES: mean depression score at final study assessment Show forest plot | 6 | 516 | Std. Mean Difference (IV, Random, 95% CI) | ‐0.16 [‐0.43, 0.11] |
| 2.1 Interpersonal psychotherapy | 5 | 366 | Std. Mean Difference (IV, Random, 95% CI) | ‐0.27 [‐0.52, ‐0.01] |
| 2.2 Cognitive behavioural therapy | 1 | 150 | Std. Mean Difference (IV, Random, 95% CI) | 0.13 [‐0.20, 0.45] |
| Outcome or subgroup title | No. of studies | No. of participants | Statistical method | Effect size |
| 1 Professionally‐based interventions ‐ depressive symptomatology Show forest plot | 15 | Risk Ratio (M‐H, Random, 95% CI) | Subtotals only | |
| 1.1 Immediate outcomes 0‐8 weeks | 10 | 3699 | Risk Ratio (M‐H, Random, 95% CI) | 0.65 [0.45, 0.93] |
| 1.2 Short‐term outcome 9‐16 weeks | 8 | 3196 | Risk Ratio (M‐H, Random, 95% CI) | 0.79 [0.57, 1.09] |
| 1.3 Intermediate outcome 17‐24 weeks | 7 | 3929 | Risk Ratio (M‐H, Random, 95% CI) | 1.03 [0.87, 1.23] |
| 1.4 Long‐term outcome > 24 weeks | 4 | 2786 | Risk Ratio (M‐H, Random, 95% CI) | 0.68 [0.51, 0.90] |
| 2 Professionally‐based interventions ‐ mean depression scores Show forest plot | 12 | Std. Mean Difference (IV, Random, 95% CI) | Subtotals only | |
| 2.1 Immediate outcomes: 0‐8 weeks | 4 | 512 | Std. Mean Difference (IV, Random, 95% CI) | ‐0.34 [‐0.56, ‐0.12] |
| 2.2 Short‐term outcome 9‐16 weeks | 6 | 2807 | Std. Mean Difference (IV, Random, 95% CI) | ‐0.31 [‐0.95, 0.34] |
| 2.3 Intermediate outcome 17‐24 weeks | 7 | 3161 | Std. Mean Difference (IV, Random, 95% CI) | 0.02 [‐0.05, 0.09] |
| 2.4 Long‐term outcome >24 weeks | 5 | 2010 | Std. Mean Difference (IV, Random, 95% CI) | ‐0.24 [‐0.79, 0.31] |
| 3 Professionally‐based interventions ‐ diagnosis of depression Show forest plot | 2 | Risk Ratio (M‐H, Fixed, 95% CI) | Subtotals only | |
| 3.1 Immediate outcomes 0‐8 weeks | 1 | 39 | Risk Ratio (M‐H, Fixed, 95% CI) | 0.09 [0.01, 1.47] |
| 3.2 Short‐term outcomes 9‐16 weeks postpartum | 1 | 190 | Risk Ratio (M‐H, Fixed, 95% CI) | 0.51 [0.13, 1.98] |
| 3.3 Intermediate outcome: 17‐24 weeks | 1 | 37 | Risk Ratio (M‐H, Fixed, 95% CI) | 0.64 [0.17, 2.46] |
| 4 Lay‐based interventions ‐ depressive symptomatology Show forest plot | 4 | Risk Ratio (M‐H, Fixed, 95% CI) | Subtotals only | |
| 4.1 Immediate outcomes 0‐8 weeks | 3 | 1208 | Risk Ratio (M‐H, Fixed, 95% CI) | 0.91 [0.70, 1.18] |
| 4.2 Short‐term outcome 9‐16 weeks | 2 | 786 | Risk Ratio (M‐H, Fixed, 95% CI) | 0.55 [0.40, 0.75] |
| 4.3 Intermediate outcome 17‐24 weeks | 1 | 493 | Risk Ratio (M‐H, Fixed, 95% CI) | 0.88 [0.62, 1.25] |
| 4.4 Long‐term outcome > 24 weeks | 1 | 150 | Risk Ratio (M‐H, Fixed, 95% CI) | 0.74 [0.29, 1.88] |
| 5 Lay‐based interventions ‐ mean depression scores Show forest plot | 5 | Std. Mean Difference (IV, Random, 95% CI) | Subtotals only | |
| 5.1 Immediate outcomes: 0‐8 weeks | 2 | 722 | Std. Mean Difference (IV, Random, 95% CI) | 0.11 [‐0.04, 0.25] |
| 5.2 Short‐term outcome 9‐16 weeks | 2 | 786 | Std. Mean Difference (IV, Random, 95% CI) | ‐0.08 [‐0.35, 0.19] |
| 5.3 Intermediate outcome 17‐24 weeks | 2 | 633 | Std. Mean Difference (IV, Random, 95% CI) | ‐0.06 [‐0.22, 0.09] |
| 5.4 Long‐term outcome > 24 weeks | 2 | 437 | Std. Mean Difference (IV, Random, 95% CI) | ‐0.01 [‐0.22, 0.20] |
| 6 Lay‐based interventions ‐ diagnosis of depression Show forest plot | 2 | Risk Ratio (M‐H, Fixed, 95% CI) | Subtotals only | |
| 6.1 Short‐term outcomes 9‐16 weeks postpartum | 2 | 677 | Risk Ratio (M‐H, Fixed, 95% CI) | 0.52 [0.32, 0.86] |
| 7 TEST FOR SUBGROUP DIFFERENCES: depressive symptomatology: at final study assessment Show forest plot | 19 | Risk Ratio (M‐H, Random, 95% CI) | Subtotals only | |
| 7.1 Professionally‐based interventions | 15 | 6790 | Risk Ratio (M‐H, Random, 95% CI) | 0.78 [0.60, 1.00] |
| 7.2 Lay‐based interventions | 4 | 1723 | Risk Ratio (M‐H, Random, 95% CI) | 0.70 [0.54, 0.90] |
| 8 TEST FOR SUBGROUP DIFFERENCES: mean depression scores: at final study assessment Show forest plot | 17 | Std. Mean Difference (IV, Random, 95% CI) | Subtotals only | |
| 8.1 Professionally‐based interventions | 12 | 4509 | Std. Mean Difference (IV, Random, 95% CI) | ‐0.15 [‐0.40, 0.10] |
| 8.2 Lay‐based interventions | 5 | 1682 | Std. Mean Difference (IV, Random, 95% CI) | ‐0.10 [‐0.20, 0.01] |
| 9 TEST FOR SUBGROUP DIFFERENCES: diagnosis of depression: at final study assessment Show forest plot | 4 | Risk Ratio (M‐H, Fixed, 95% CI) | Subtotals only | |
| 9.1 Professionally‐based interventions | 2 | 227 | Risk Ratio (M‐H, Fixed, 95% CI) | 0.56 [0.22, 1.47] |
| 9.2 Lay‐based interventions | 2 | 677 | Risk Ratio (M‐H, Fixed, 95% CI) | 0.52 [0.32, 0.86] |
| Outcome or subgroup title | No. of studies | No. of participants | Statistical method | Effect size |
| 1 TEST FOR SUBGROUP DIFFERENCES: depressive symptomatology at final study assessment Show forest plot | 15 | Risk Ratio (M‐H, Random, 95% CI) | Subtotals only | |
| 1.1 Intervention provided by nurses | 3 | 837 | Risk Ratio (M‐H, Random, 95% CI) | 0.73 [0.51, 1.04] |
| 1.2 Intervention provided by physicians | 1 | 446 | Risk Ratio (M‐H, Random, 95% CI) | 0.90 [0.55, 1.49] |
| 1.3 Intervention provided by midwives | 10 | 5477 | Risk Ratio (M‐H, Random, 95% CI) | 0.76 [0.54, 1.07] |
| 1.4 Intervention provided by mental health specialists | 1 | 30 | Risk Ratio (M‐H, Random, 95% CI) | 1.0 [0.24, 4.18] |
| 2 TEST FOR SUBGROUP DIFFERENCES: mean depression score at final study assessment Show forest plot | 4 | Std. Mean Difference (IV, Fixed, 95% CI) | Subtotals only | |
| 2.1 Intervention provided by nurses | 1 | 86 | Std. Mean Difference (IV, Fixed, 95% CI) | ‐0.08 [‐0.51, 0.34] |
| 2.2 Intervention provided by midwives | 1 | 840 | Std. Mean Difference (IV, Fixed, 95% CI) | 0.05 [‐0.09, 0.19] |
| 2.3 Intervention provided by mental health specialists | 2 | 175 | Std. Mean Difference (IV, Fixed, 95% CI) | 0.04 [‐0.26, 0.34] |
| Outcome or subgroup title | No. of studies | No. of participants | Statistical method | Effect size |
| 1 Individually‐based interventions ‐ depressive symptomatology Show forest plot | 14 | Risk Ratio (M‐H, Random, 95% CI) | Subtotals only | |
| 1.1 Immediate outcomes 0‐8 weeks | 9 | 3947 | Risk Ratio (M‐H, Random, 95% CI) | 0.70 [0.49, 1.00] |
| 1.2 Short‐term outcomes 9‐16 weeks | 6 | 2757 | Risk Ratio (M‐H, Random, 95% CI) | 0.66 [0.47, 0.91] |
| 1.3 Intermediate outcomes 17‐24 weeks | 7 | 9806 | Risk Ratio (M‐H, Random, 95% CI) | 0.88 [0.80, 0.98] |
| 1.4 Long‐term outcomes > 24 weeks | 4 | 2786 | Risk Ratio (M‐H, Random, 95% CI) | 0.68 [0.51, 0.90] |
| 2 Individually‐based interventions ‐ mean depression scores Show forest plot | 11 | Std. Mean Difference (IV, Random, 95% CI) | Subtotals only | |
| 2.1 Immediate outcomes 0‐8 weeks | 4 | 882 | Std. Mean Difference (IV, Random, 95% CI) | ‐0.11 [‐0.41, 0.19] |
| 2.2 Short‐term outcomes 9‐16 weeks | 5 | 2601 | Std. Mean Difference (IV, Random, 95% CI) | ‐0.40 [‐1.07, 0.26] |
| 2.3 Intermediate outcomes 17‐24 weeks | 6 | 8156 | Std. Mean Difference (IV, Random, 95% CI) | 0.01 [‐0.03, 0.05] |
| 2.4 Long‐term outcomes > 24 weeks | 5 | 1457 | Std. Mean Difference (IV, Random, 95% CI) | ‐0.28 [‐0.78, 0.23] |
| 3 Individually‐based interventions ‐ diagnosis of depression Show forest plot | 3 | Risk Ratio (M‐H, Fixed, 95% CI) | Subtotals only | |
| 3.1 Immediate outcomes 0‐8 weeks | 1 | 39 | Risk Ratio (M‐H, Fixed, 95% CI) | 0.09 [0.01, 1.47] |
| 3.2 Short‐term outcomes 9‐16 weeks | 2 | 677 | Risk Ratio (M‐H, Fixed, 95% CI) | 0.52 [0.32, 0.86] |
| 3.3 Intermediate outcomes 17‐24 weeks | 1 | 37 | Risk Ratio (M‐H, Fixed, 95% CI) | 0.64 [0.17, 2.46] |
| 4 Group‐based interventions ‐ depressive symptomatology Show forest plot | 6 | Risk Ratio (M‐H, Random, 95% CI) | Subtotals only | |
| 4.1 Immediate outcomes 0‐8 weeks | 4 | 946 | Risk Ratio (M‐H, Random, 95% CI) | 0.64 [0.45, 0.91] |
| 4.2 Short‐term outcomes 9‐16 weeks | 4 | 1225 | Risk Ratio (M‐H, Random, 95% CI) | 0.91 [0.60, 1.39] |
| 4.3 Intermediate outcomes 17‐24 weeks | 2 | 830 | Risk Ratio (M‐H, Random, 95% CI) | 1.20 [0.85, 1.71] |
| 4.4 Long‐term outcomes > 24 weeks | 1 | 150 | Risk Ratio (M‐H, Random, 95% CI) | 0.74 [0.29, 1.88] |
| 5 Group‐based interventions ‐ mean depression scores Show forest plot | 8 | Std. Mean Difference (IV, Random, 95% CI) | Subtotals only | |
| 5.1 Immediate outcomes 0‐8 weeks | 2 | 352 | Std. Mean Difference (IV, Random, 95% CI) | ‐0.24 [‐0.80, 0.31] |
| 5.2 Short‐term outcomes 9‐16 weeks | 4 | 1027 | Std. Mean Difference (IV, Random, 95% CI) | 0.04 [‐0.09, 0.16] |
| 5.3 Intermediate outcomes 17‐24 weeks | 4 | 1788 | Std. Mean Difference (IV, Random, 95% CI) | 0.01 [‐0.08, 0.11] |
| 5.4 Long‐term outcomes > 24 weeks | 2 | 990 | Std. Mean Difference (IV, Random, 95% CI) | 0.06 [‐0.07, 0.19] |
| 6 Group‐based interventions ‐ diagnosis of depression Show forest plot | 2 | Risk Ratio (M‐H, Random, 95% CI) | Subtotals only | |
| 6.1 Short‐term outcomes 9‐16 weeks | 2 | 225 | Risk Ratio (M‐H, Random, 95% CI) | 0.30 [0.05, 1.66] |
| 7 TEST FOR SUBGROUP DIFFERENCES: depressive symptomatology: at final study assessment Show forest plot | 20 | 14727 | Risk Ratio (M‐H, Random, 95% CI) | 0.78 [0.66, 0.93] |
| 7.1 Individually‐based interventions | 14 | 12914 | Risk Ratio (M‐H, Random, 95% CI) | 0.75 [0.61, 0.92] |
| 7.2 Group‐based interventions | 6 | 1813 | Risk Ratio (M‐H, Random, 95% CI) | 0.92 [0.71, 1.19] |
| 8 TEST FOR SUBGROUP DIFFERENCES: mean depression scores: at final study assessment Show forest plot | 19 | 12376 | Std. Mean Difference (IV, Random, 95% CI) | ‐0.13 [‐0.28, 0.01] |
| 8.1 Individually‐based interventions | 11 | 10092 | Std. Mean Difference (IV, Random, 95% CI) | ‐0.15 [‐0.37, 0.07] |
| 8.2 Group‐based interventions | 8 | 2284 | Std. Mean Difference (IV, Random, 95% CI) | ‐0.08 [‐0.23, 0.06] |
| 9 TEST FOR SUBGROUP DIFFERENCES: diagnosis of depression: at final study assessment Show forest plot | 5 | 939 | Risk Ratio (M‐H, Random, 95% CI) | 0.50 [0.32, 0.78] |
| 9.1 Individually‐based interventions | 3 | 714 | Risk Ratio (M‐H, Random, 95% CI) | 0.53 [0.33, 0.84] |
| 9.2 Group‐based interventions | 2 | 225 | Risk Ratio (M‐H, Random, 95% CI) | 0.30 [0.05, 1.66] |
| Outcome or subgroup title | No. of studies | No. of participants | Statistical method | Effect size |
| 1 Single‐contact interventions ‐ depressive symptomatology Show forest plot | 4 | Risk Ratio (M‐H, Random, 95% CI) | Subtotals only | |
| 1.1 Immediate outcomes 0‐8 weeks | 2 | 1756 | Risk Ratio (M‐H, Random, 95% CI) | 0.39 [0.07, 2.16] |
| 1.2 Short‐term outcomes 9‐16 weeks | 1 | 476 | Risk Ratio (M‐H, Random, 95% CI) | 1.24 [0.81, 1.91] |
| 1.3 Intermediate outcomes 17‐24 weeks | 3 | 2936 | Risk Ratio (M‐H, Random, 95% CI) | 1.01 [0.82, 1.26] |
| 1.4 Long‐term outcomes > 24 weeks | 1 | 1401 | Risk Ratio (M‐H, Random, 95% CI) | 0.89 [0.58, 1.37] |
| 2 Single‐contact interventions ‐ mean depression scores Show forest plot | 2 | Mean Difference (IV, Fixed, 95% CI) | Subtotals only | |
| 2.1 Short‐term outcomes 9‐16 weeks | 1 | 476 | Mean Difference (IV, Fixed, 95% CI) | ‐0.10 [‐1.06, 0.86] |
| 2.2 Intermediate outcomes 17‐24 weeks | 2 | 1362 | Mean Difference (IV, Fixed, 95% CI) | 0.21 [‐0.37, 0.79] |
| 3 Multiple‐contact interventions ‐ depressive symptomatology Show forest plot | 16 | Risk Ratio (M‐H, Random, 95% CI) | Subtotals only | |
| 3.1 Immediate outcomes 0‐8 weeks | 11 | 3137 | Risk Ratio (M‐H, Random, 95% CI) | 0.77 [0.60, 0.99] |
| 3.2 Short‐term outcomes 9‐16 weeks | 9 | 3506 | Risk Ratio (M‐H, Random, 95% CI) | 0.69 [0.52, 0.91] |
| 3.3 Intermediate outcomes 17‐24 weeks | 6 | 7700 | Risk Ratio (M‐H, Random, 95% CI) | 0.89 [0.77, 1.01] |
| 3.4 Long‐term outcomes > 24 weeks | 4 | 1535 | Risk Ratio (M‐H, Random, 95% CI) | 0.60 [0.47, 0.76] |
| 4 Multiple‐contact interventions ‐ mean depression scores Show forest plot | 17 | Std. Mean Difference (IV, Random, 95% CI) | Subtotals only | |
| 4.1 Immediate outcomes 0‐8 weeks | 6 | 1234 | Std. Mean Difference (IV, Random, 95% CI) | ‐0.16 [‐0.41, 0.09] |
| 4.2 Short‐term outcomes 9‐16 weeks | 8 | 3152 | Std. Mean Difference (IV, Random, 95% CI) | ‐0.30 [‐0.81, 0.22] |
| 4.3 Intermediate outcomes 17‐24 weeks | 8 | 8582 | Std. Mean Difference (IV, Random, 95% CI) | 0.01 [‐0.04, 0.05] |
| 4.4 Long‐term outcomes > 24 weeks | 7 | 2447 | Std. Mean Difference (IV, Random, 95% CI) | ‐0.17 [‐0.58, 0.25] |
| 5 Multiple‐contact interventions ‐ diagnosis of depression Show forest plot | 5 | Risk Ratio (M‐H, Fixed, 95% CI) | Subtotals only | |
| 5.1 Immediate outcomes 0‐8 weeks | 1 | 39 | Risk Ratio (M‐H, Fixed, 95% CI) | 0.09 [0.01, 1.47] |
| 5.2 Short‐term outcomes 9‐16 weeks | 4 | 902 | Risk Ratio (M‐H, Fixed, 95% CI) | 0.47 [0.30, 0.74] |
| 5.3 Intermediate outcomes 17‐24 weeks | 1 | 37 | Risk Ratio (M‐H, Fixed, 95% CI) | 0.64 [0.17, 2.46] |
| 5.4 At final study assessment | 5 | 939 | Risk Ratio (M‐H, Fixed, 95% CI) | 0.48 [0.31, 0.74] |
| 6 TEST FOR SUBGROUP DIFFERENCES: depressive symptomatology: at final study assessment Show forest plot | 20 | 14727 | Risk Ratio (M‐H, Random, 95% CI) | 0.78 [0.66, 0.93] |
| 6.1 Single contact intervention | 4 | 2877 | Risk Ratio (M‐H, Random, 95% CI) | 0.70 [0.38, 1.28] |
| 6.2 Multiple contact intervention | 16 | 11850 | Risk Ratio (M‐H, Random, 95% CI) | 0.78 [0.66, 0.93] |
| 7 TEST FOR SUBGROUP DIFFERENCES: mean depression scores: at final study assessment Show forest plot | 19 | 12376 | Std. Mean Difference (IV, Random, 95% CI) | ‐0.13 [‐0.28, 0.01] |
| 7.1 Single contact intervention | 2 | 1362 | Std. Mean Difference (IV, Random, 95% CI) | 0.04 [‐0.07, 0.15] |
| 7.2 Multiple contact intervention | 17 | 11014 | Std. Mean Difference (IV, Random, 95% CI) | ‐0.15 [‐0.32, 0.02] |
| Outcome or subgroup title | No. of studies | No. of participants | Statistical method | Effect size |
| 1 Interventions with antenatal only component ‐ mean depression scores Show forest plot | 4 | Std. Mean Difference (IV, Fixed, 95% CI) | Subtotals only | |
| 1.1 Short‐term outcomes 9‐16 weeks | 1 | 35 | Std. Mean Difference (IV, Fixed, 95% CI) | ‐0.44 [‐1.11, 0.23] |
| 1.2 Intermediate outcomes 17‐24 weeks | 2 | 919 | Std. Mean Difference (IV, Fixed, 95% CI) | 0.06 [‐0.07, 0.19] |
| 1.3 Long‐term outcomes > 24 weeks | 2 | 883 | Std. Mean Difference (IV, Fixed, 95% CI) | 0.05 [‐0.09, 0.19] |
| 2 Interventions with antenatal only component ‐ diagnosis of depression Show forest plot | 1 | Risk Ratio (M‐H, Fixed, 95% CI) | Subtotals only | |
| 2.1 Short‐term outcomes 9‐16 weeks | 1 | 35 | Risk Ratio (M‐H, Fixed, 95% CI) | 0.08 [0.00, 1.34] |
| 3 Interventions with antenatal and postnatal components ‐ depressive symptomatology Show forest plot | 8 | Risk Ratio (M‐H, Random, 95% CI) | Subtotals only | |
| 3.1 Immediate outcomes 0‐8 weeks | 7 | 1794 | Risk Ratio (M‐H, Random, 95% CI) | 0.75 [0.52, 1.08] |
| 3.2 Short‐term outcomes 9‐16 weeks | 4 | 621 | Risk Ratio (M‐H, Random, 95% CI) | 0.66 [0.45, 0.97] |
| 3.3 Intermediate outcomes 17‐24 weeks | 3 | 284 | Risk Ratio (M‐H, Random, 95% CI) | 0.87 [0.41, 1.85] |
| 3.4 Long‐term outcomes > 24 weeks | 2 | 273 | Risk Ratio (M‐H, Random, 95% CI) | 0.82 [0.46, 1.46] |
| 4 Interventions with antenatal and postnatal components ‐ mean depression scores Show forest plot | 7 | Std. Mean Difference (IV, Random, 95% CI) | Subtotals only | |
| 4.1 Immediate outcomes 0‐8 weeks | 4 | 518 | Std. Mean Difference (IV, Random, 95% CI) | ‐0.18 [‐0.47, 0.11] |
| 4.2 Short‐term outcomes 9‐16 weeks | 3 | 388 | Std. Mean Difference (IV, Random, 95% CI) | ‐0.05 [‐0.25, 0.15] |
| 4.3 Intermediate outcomes 17‐24 weeks | 3 | 315 | Std. Mean Difference (IV, Random, 95% CI) | ‐0.22 [‐0.45, ‐0.00] |
| 4.4 Long‐term outcomes > 24 weeks | 3 | 560 | Std. Mean Difference (IV, Random, 95% CI) | ‐0.03 [‐0.20, 0.13] |
| 5 Interventions with antenatal and postnatal components ‐ diagnosis of depression Show forest plot | 3 | Risk Ratio (M‐H, Fixed, 95% CI) | Subtotals only | |
| 5.1 Immediate outcomes 0‐8 weeks | 1 | 39 | Risk Ratio (M‐H, Fixed, 95% CI) | 0.09 [0.01, 1.47] |
| 5.2 Short‐term outcomes 9‐16 weeks | 2 | 255 | Risk Ratio (M‐H, Fixed, 95% CI) | 0.40 [0.21, 0.79] |
| 5.3 Intermediate outcomes 17‐24 weeks | 1 | 37 | Risk Ratio (M‐H, Fixed, 95% CI) | 0.64 [0.17, 2.46] |
| 6 Interventions with postnatal only component ‐ depressive symptomatology Show forest plot | 12 | Risk Ratio (M‐H, Random, 95% CI) | Subtotals only | |
| 6.1 Immediate outcomes 0‐8 weeks | 6 | 3099 | Risk Ratio (M‐H, Random, 95% CI) | 0.63 [0.41, 0.98] |
| 6.2 Short‐term outcomes 9‐16 weeks | 6 | 3361 | Risk Ratio (M‐H, Random, 95% CI) | 0.76 [0.53, 1.11] |
| 6.3 Intermediate outcomes 17‐24 weeks | 6 | 10352 | Risk Ratio (M‐H, Random, 95% CI) | 0.93 [0.82, 1.06] |
| 6.4 Long‐term outcomes >24 weeks | 3 | 2663 | Risk Ratio (M‐H, Random, 95% CI) | 0.66 [0.46, 0.93] |
| 7 Interventions with postnatal only component ‐ mean depression scores Show forest plot | 8 | Std. Mean Difference (IV, Random, 95% CI) | Subtotals only | |
| 7.1 Immediate outcomes 0‐8 weeks | 2 | 716 | Std. Mean Difference (IV, Random, 95% CI) | ‐0.14 [‐0.69, 0.42] |
| 7.2 Short‐term outcomes 9‐16 weeks | 5 | 3205 | Std. Mean Difference (IV, Random, 95% CI) | ‐0.35 [1.00, 0.31] |
| 7.3 Intermediate outcomes 17‐24 weeks | 5 | 8710 | Std. Mean Difference (IV, Random, 95% CI) | 0.01 [‐0.03, 0.06] |
| 7.4 Long‐term outcomes > 24 weeks | 2 | 1004 | Std. Mean Difference (IV, Random, 95% CI) | ‐0.59 [‐1.39, 0.21] |
| 8 Interventions with postnatal only component ‐ diagnosis of depression Show forest plot | 1 | Risk Ratio (M‐H, Fixed, 95% CI) | Subtotals only | |
| 8.1 Short‐term outcomes 9‐16 weeks | 1 | 612 | Risk Ratio (M‐H, Fixed, 95% CI) | 0.65 [0.34, 1.23] |
| 9 TEST FOR SUBGROUP DIFFERENCES: depressive symptomatology: at final study assessment Show forest plot | 20 | 14727 | Risk Ratio (M‐H, Random, 95% CI) | 0.78 [0.66, 0.93] |
| 9.1 Antenatal and postnatal intervention | 8 | 1941 | Risk Ratio (M‐H, Random, 95% CI) | 0.96 [0.75, 1.22] |
| 9.2 Postnatal intervention only | 12 | 12786 | Risk Ratio (M‐H, Random, 95% CI) | 0.73 [0.59, 0.90] |
| 10 TEST FOR SUBGROUP DIFFERENCES: mean depression scores: at final study assessment Show forest plot | 19 | 12376 | Std. Mean Difference (IV, Random, 95% CI) | ‐0.13 [‐0.28, 0.01] |
| 10.1 Antenatal intervention only | 4 | 1050 | Std. Mean Difference (IV, Random, 95% CI) | 0.03 [‐0.09, 0.16] |
| 10.2 Antenatal and postnatal intervention | 7 | 1000 | Std. Mean Difference (IV, Random, 95% CI) | ‐0.14 [‐0.31, 0.02] |
| 10.3 Postnatal intervention only | 8 | 10326 | Std. Mean Difference (IV, Random, 95% CI) | ‐0.16 [‐0.40, 0.08] |
| 11 TEST FOR SUBGROUP DIFFERENCES: diagnosis of depression: at final study assessment Show forest plot | 5 | 939 | Risk Ratio (M‐H, Fixed, 95% CI) | 0.48 [0.31, 0.74] |
| 11.1 Antenatal intervention only | 1 | 35 | Risk Ratio (M‐H, Fixed, 95% CI) | 0.08 [0.00, 1.34] |
| 11.2 Antenatal and postnatal intervention | 3 | 292 | Risk Ratio (M‐H, Fixed, 95% CI) | 0.44 [0.24, 0.80] |
| 11.3 Postnatal intervention only | 1 | 612 | Risk Ratio (M‐H, Fixed, 95% CI) | 0.65 [0.34, 1.23] |
| Outcome or subgroup title | No. of studies | No. of participants | Statistical method | Effect size |
| 1 Interventions for at‐risk women ‐ depressive symptomatology Show forest plot | 9 | Risk Ratio (M‐H, Random, 95% CI) | Subtotals only | |
| 1.1 Immediate outcomes 0‐8 weeks | 7 | 1301 | Risk Ratio (M‐H, Random, 95% CI) | 0.67 [0.51, 0.88] |
| 1.2 Short‐term outcomes 9‐16 weeks | 6 | 1368 | Risk Ratio (M‐H, Random, 95% CI) | 0.59 [0.47, 0.75] |
| 1.3 Intermediate outcomes 17‐24 weeks | 2 | 151 | Risk Ratio (M‐H, Random, 95% CI) | 1.34 [0.60, 2.98] |
| 1.4 Long‐term outcomes > 24 weeks | 2 | 281 | Risk Ratio (M‐H, Random, 95% CI) | 0.60 [0.29, 1.24] |
| 2 Interventions for at‐risk women ‐ mean depression scores Show forest plot | 7 | Std. Mean Difference (IV, Random, 95% CI) | Subtotals only | |
| 2.1 Immediate outcomes 0‐8 weeks | 3 | 387 | Std. Mean Difference (IV, Random, 95% CI) | ‐0.17 [‐0.52, 0.18] |
| 2.2 Short‐term outcomes 9‐16 weeks | 5 | 1067 | Std. Mean Difference (IV, Random, 95% CI) | ‐0.14 [‐0.26, ‐0.02] |
| 2.3 Intermediate outcomes 17‐24 weeks | 1 | 30 | Std. Mean Difference (IV, Random, 95% CI) | ‐0.02 [‐0.74, 0.70] |
| 2.4 Long‐term outcomes >24 weeks | 3 | 324 | Std. Mean Difference (IV, Random, 95% CI) | ‐0.00 [‐0.22, 0.22] |
| 3 Interventions for at‐risk women ‐ diagnosis of depression Show forest plot | 5 | Risk Ratio (M‐H, Fixed, 95% CI) | Subtotals only | |
| 3.1 Immediate outcomes 0‐8 weeks | 1 | 39 | Risk Ratio (M‐H, Fixed, 95% CI) | 0.09 [0.01, 1.47] |
| 3.2 Short‐term outcomes 9‐16 weeks | 4 | 902 | Risk Ratio (M‐H, Fixed, 95% CI) | 0.47 [0.30, 0.74] |
| 3.3 Intermediate outcomes 17‐24 weeks | 1 | 37 | Risk Ratio (M‐H, Fixed, 95% CI) | 0.64 [0.17, 2.46] |
| 3.4 At final study assessment | 5 | 939 | Risk Ratio (M‐H, Fixed, 95% CI) | 0.48 [0.31, 0.74] |
| 4 Interventions for general population ‐ depressive symptomatology Show forest plot | 12 | Risk Ratio (M‐H, Random, 95% CI) | Subtotals only | |
| 4.1 Immediate outcomes 0‐8 weeks | 7 | 3767 | Risk Ratio (M‐H, Random, 95% CI) | 0.69 [0.46, 1.03] |
| 4.2 Short‐term outcomes 9‐16 weeks | 4 | 2614 | Risk Ratio (M‐H, Random, 95% CI) | 0.91 [0.58, 1.42] |
| 4.3 Intermediate outcomes 17‐24 weeks | 7 | 10485 | Risk Ratio (M‐H, Random, 95% CI) | 0.92 [0.81, 1.06] |
| 4.4 Long‐term outcomes > 24 weeks | 3 | 2655 | Risk Ratio (M‐H, Random, 95% CI) | 0.71 [0.51, 0.99] |
| 5 Interventions for general population ‐ mean depression scores Show forest plot | 12 | Std. Mean Difference (IV, Random, 95% CI) | Subtotals only | |
| 5.1 Immediate outcomes 0‐8 weeks | 3 | 847 | Std. Mean Difference (IV, Random, 95% CI) | ‐0.15 [‐0.56, 0.25] |
| 5.2 Short‐term outcomes 9‐16 weeks | 4 | 2561 | Std. Mean Difference (IV, Random, 95% CI) | ‐0.40 [‐1.24, 0.44] |
| 5.3 Intermediate outcomes 17‐24 weeks | 9 | 9914 | Std. Mean Difference (IV, Random, 95% CI) | 0.01 [‐0.03, 0.05] |
| 5.4 Long‐term outcomes > 24 weeks | 4 | 2123 | Std. Mean Difference (IV, Random, 95% CI) | ‐0.28 [‐0.87, 0.30] |
| 6 TEST FOR SUBGROUP DIFFERENCES: depressive symptomatology: at final study assessment Show forest plot | 20 | 14727 | Risk Ratio (M‐H, Random, 95% CI) | 0.78 [0.66, 0.93] |
| 6.1 Interventions for at‐risk women | 8 | 1853 | Risk Ratio (M‐H, Random, 95% CI) | 0.66 [0.50, 0.88] |
| 6.2 General population | 12 | 12874 | Risk Ratio (M‐H, Random, 95% CI) | 0.83 [0.68, 1.02] |
| 7 TEST FOR SUBGROUP DIFFERENCES: mean depression scores: at final study assessment Show forest plot | 19 | 12376 | Std. Mean Difference (IV, Random, 95% CI) | ‐0.13 [‐0.28, 0.01] |
| 7.1 Interventions for at risk women | 7 | 1087 | Std. Mean Difference (IV, Random, 95% CI) | ‐0.13 [‐0.25, ‐0.01] |
| 7.2 General population | 12 | 11289 | Std. Mean Difference (IV, Random, 95% CI) | ‐0.15 [‐0.33, 0.04] |