Intervenciones psicosociales y psicológicas para la prevención de la depresión posparto
Referencias
References to studies included in this review
References to studies excluded from this review
References to studies awaiting assessment
References to ongoing studies
Additional references
References to other published versions of this review
Characteristics of studies
Characteristics of included studies [ordered by study ID]
| Methods | RCT. | |
| Participants | 181 mothers (90 in the intervention group; 91 in the control group) who gave birth in 1 urban hospital in Queensland, Australia. Families were included where the child, for environmental (home/family) reasons, was at increased risk for poor health and developmental outcomes. Exclusion criteria included poor English literacy skills. | |
| Interventions | Intervention group: home visits by child heath nurses with support from a multidisciplinary team. The visits were weekly until 6 weeks postpartum, every 2 weeks until 12 weeks and then monthly until 52 weeks. The minimum target of 18 visits was exceeded in most cases. Control group: usual community care (which included the choice of 1 home visit from the child health nurse) and a list of community resources. Extra child care nurse visits were only done for problems, most often with the baby. Research visits were for data collection only. | |
| Outcomes | Outcomes included depression (EPDS > 12), parental stress (Parenting Stress Index ‐ PSI), breastfeeding duration, infant immunisation, utilisation of medical services, accidental injury and Child Abuse Potential Inventory at 6,16 and 52 weeks postpartum. | |
| Notes | Only 63% of mothers completed the pre‐trial screening questionnaire. The intervention group included significantly more primiparous and aboriginal mothers and fewer women (1) with a past history of depression, (2) with a partner who had a history of psychiatric illness, and (3) who reported physical forms of domestic violence. During the course of the trial women with an EPDS score > 12 were offered a referral to a healthcare professional of their choice. | |
| Risk of bias | ||
| Bias | Authors' judgement | Support for judgement |
| Random sequence generation (selection bias) | Low risk | "computer generated random numbers table." |
| Allocation concealment (selection bias) | Low risk | "completed by clerical staff not involved in the eligibility assessment." |
| Blinding of participants and personnel (performance bias) | Low risk | Blinding of participants and caregivers was not possible. |
| Blinding of outcome assessment (detection bias) | Low risk | Data collection was done in the participant's home by a researcher who was blinded to study group and not providing care to the woman. Research assistants were blind to research group when carrying out the 6‐week data collection but during that visit the participant often revealed her group assignment. A different research assistant was used for the 52‐week visit. |
| Incomplete outcome data (attrition bias) | Low risk | Follow‐up rates at 6, 16 and 52 weeks postpartum were 96.1%, 88.4% and 76.2% respectively. |
| Selective reporting (reporting bias) | Low risk | All outcomes were reported on. |
| Other bias | Low risk | No other sources of bias noted. |
| Methods | RCT. | |
| Participants | 277 pregnant women (191 in the intervention group; 86 in the control group) who attended antenatal clinics in an Australian hospital were identified, by screening at the end of their first trimester, to be at an increased risk of postpartum depression. Those with substance or alcohol abuse, organic brain disorder, bipolar disorder, schizophrenia, childhood abuse, suicidal ideation or poor command of English were excluded. | |
| Interventions | Intervention group: information booklet and cognitive behavioural therapy group sessions. There were 6 weekly 2‐hour sessions (and a later follow‐up session) that were skills based and led by a clinical psychologist. The timing of the follow‐up session was not specified by the authors. Control group: information booklet about postnatal anxiety and depression. | |
| Outcomes | Outcomes included depression (EPDS and MINI) and anxiety (STAI) at 8 and 16 weeks postpartum. | |
| Notes | All reported data analyses used imputation. Missing data were imputed using last observation carry forward. The authors were contacted for the raw data but they were not available. No data from this trial were included in the review. | |
| Risk of bias | ||
| Bias | Authors' judgement | Support for judgement |
| Random sequence generation (selection bias) | Unclear risk | "Randomization using a randomization table". No further details available from authors. Randomisation on a 2:1 basis to allow for more drop outs from the intervention group. |
| Allocation concealment (selection bias) | Unclear risk | No information available from authors about process of randomisation. |
| Blinding of participants and personnel (performance bias) | Low risk | Blinding of participants and caregivers was not possible. |
| Blinding of outcome assessment (detection bias) | Low risk | Administration of MINI done by research assistant 'blind to study allocation' |
| Incomplete outcome data (attrition bias) | High risk | The follow‐up rate at 8 and 16 weeks postpartum was 69.7% and 59.2% respectively. Missing data were imputed using 'last observation carried forward'. Raw data were not available. |
| Selective reporting (reporting bias) | Unclear risk | MINI results were reported. EPDS and STAI were not reported and not available from authors. |
| Other bias | Unclear risk | No other sources of bias noted. |
| Methods | RCT with prognostic stratification on 3 factors (level of support, screening, and ethnic group). | |
| Participants | 209 pregnant women (103 in the intervention group; 106 in the control group) who attended antenatal clinics in a UK hospital between 12 and 20 weeks' gestation are were identified, by screening, to be at an increased risk of postpartum depression. Inclusion criteria: 16 years old, primiparous, residence in reasonable driving distance to hospital, and sufficient English to complete questionnaires. | |
| Interventions | Intervention group: 'Preparing for Parenthood' ‐ 6 structured 2‐hour weekly antenatal classes (preceded by an initial introductory meeting with the participant and her partner) and 1 'reunion' class at 8 weeks postpartum. Classes were provided by a trained nurse and occupational therapist and based on established psychological models for tackling depression together with emerging models for enhancing social support. Control group: routine antenatal care. | |
| Outcomes | Outcomes included depression (EPDS > 10) and maternal health service contact since randomisation at 12 weeks postpartum. | |
| Notes | Women in the intervention group were more likely to adopt an avoidant problem‐solving style than women in the control group; using logistic modelling to adjust for this covariate at baseline did not alter the trial results. Only 45% of participants in the intervention group attended sufficient sessions to 'likely receive benefit'. | |
| Risk of bias | ||
| Bias | Authors' judgement | Support for judgement |
| Random sequence generation (selection bias) | Low risk | "performed using a computer‐based stratification process with minimisation'' |
| Allocation concealment (selection bias) | High risk | Randomisation done by research interviewer. |
| Blinding of participants and personnel (performance bias) | Low risk | Blinding of participants and caregivers was not possible. |
| Blinding of outcome assessment (detection bias) | High risk | The same researcher did the enrolment interview and collected the outcome data. After each interview the researcher was asked to mark which group she thought the participant was in. |
| Incomplete outcome data (attrition bias) | Low risk | The follow‐up rate at 12 weeks postpartum was 90.9%' |
| Selective reporting (reporting bias) | Low risk | All outcomes were reported on. |
| Other bias | Low risk | No other sources of bias noted. |
| Methods | RCT. | |
| Participants | 343 women (172 to the intervention group; 171 to the control group), pregnant with their first baby and less than 20 weeks' gestation were enrolled from Northern Ireland. They were 16‐30 years old, had no co‐morbidity and were from disadvantaged areas based on their postcode. | |
| Interventions | Intervention group: peer mentoring provided during home visits or phone calls. The peer mentors were non‐health professionals, < 40 years old with at least 1 child < 10 years old. They received an initial 2‐hour training session, follow‐up training sessions every 6‐8 weeks and ongoing supervision from a midwife. The mentoring sessions were offered twice monthly during pregnancy and monthly for the first postpartum year. The peers were matched to the participants based on age and locality. The mean number of contacts was 8.5 (SD 9.3). 29% of the participants had > 12 contacts and 16% received none. Usual care: routine antenatal and postpartum care. | |
| Outcomes | Outcomes included depression (SF36), parental stress (PSI) and the Bayley Scales of Infant Development II at 52 weeks postpartum. | |
| Notes | ||
| Risk of bias | ||
| Bias | Authors' judgement | Support for judgement |
| Random sequence generation (selection bias) | Low risk | Computer‐generated using alternate blocks of 20 and 40. |
| Allocation concealment (selection bias) | Low risk | "Randomization done by independent individuals at a remote location." |
| Blinding of participants and personnel (performance bias) | Low risk | Blinding of participants and caregivers was not possible. |
| Blinding of outcome assessment (detection bias) | Low risk | "Assessed by researcher blinded to group allocation." |
| Incomplete outcome data (attrition bias) | Low risk | Follow‐up rates at 52 weeks postpartum were 85.3% for questionnaires and 81.6% for the Bayley. |
| Selective reporting (reporting bias) | Low risk | All outcomes were reported on. Non‐imputed values used in this review. |
| Other bias | Low risk | No other sources of bias noted. |
| Methods | RCT with stratification on self reported history of depression. | |
| Participants | 701 postpartum women (349 in the intervention group; 352 in the control group) were enrolled from 7 large health regions in Ontario, Canada. During the routine postpartum phone call (24‐48 hours post hospital discharge) public health nurses administered the EPDS and those women scoring > 9 and deemed to be high risk to develop postpartum depression were referred to the study. Women taking antidepressant or antipsychotic drugs at the time of recruitment were excluded. Participants were 2 weeks postpartum or less, aged 18 years or more, able to speak English, had a live birth and were discharged home with their baby. | |
| Interventions | Intervention group: standard community postpartum care plus telephone based peer support from a mother with a history and recovery from postpartum depression. Telephone contact was initiated within 48‐72 hours of randomisation. Peer support mothers underwent a 4‐hour training session and were asked to make a minimum of 4 contacts with each mother. On average each peer supported 2 women (range 1‐7); made 8.8 contacts (SD 6.0) with each contact lasting 14.1 minutes (SD 18.5). Control group: standard community postpartum care including access to services from public health nurses and other providers (mother initiated) and drop in centres. | |
| Outcomes | Outcomes included depression (EPDS > 12 and SCID), anxiety (STAI) and UCLA Loneliness scale at 12 and 24 weeks postpartum. | |
| Notes | Women in both groups with severe depression at 12 weeks were referred for treatment. More women in the control group were referred at 12 weeks so the 24‐week results were not included in the meta‐analyses. | |
| Risk of bias | ||
| Bias | Authors' judgement | Support for judgement |
| Random sequence generation (selection bias) | Low risk | "done by web randomisation service." |
| Allocation concealment (selection bias) | Low risk | "centrally controlled with a web based randomisation service." |
| Blinding of participants and personnel (performance bias) | Low risk | Blinding of participants not possible. Community caregiver was not informed of trial participation or group allocation. |
| Blinding of outcome assessment (detection bias) | Low risk | Research nurses doing data collection were blinded to group allocation. |
| Incomplete outcome data (attrition bias) | Low risk | Follow‐up rates at 12 and 24 weeks postpartum were 87.4% and 85.6% respectively. |
| Selective reporting (reporting bias) | Low risk | All outcomes were reported on. |
| Other bias | Low risk | No other sources of bias noted. |
| Methods | RCT. | |
| Participants | 169 couples expecting their first child (89 in intervention group and 80 in control group) were recruited via antenatal education classes at 2 hospitals and doctors' offices in Pennsylvania USA. They were all heterosexual couples living together and were enrolled in the 2nd trimester of pregnancy. | |
| Interventions | Intervention group: 8 group classes (4 in the antenatal and 4 in the postnatal period), focusing on improving co‐parenting by encouraging conflict management, sharing tasks and developing supportive roles in parents. The group sessions were in addition to the regular antenatal classes, structured and led by a trained man and woman team. There were 6‐10 couples in each group and 2/3 of the couples attended 5 or more of the 8 sessions. Control group: regular antenatal classes and a mailed brochure about selecting child care. | |
| Outcomes | Outcomes included depression (CES‐D), anxiety (Taylor Manifest Anxiety Scale), parent child dysfunction, infant regulation and co‐parenting at 24 weeks postpartum. | |
| Notes | We used only the data collected from the mothers. We used the 6‐item Dysfunction Interaction Scale from the PSI for the Maternal‐Infant attachment outcome in this review. We did not use the anxiety data as the Taylor Manifest Anxiety Scale measures chronic anxiety. | |
| Risk of bias | ||
| Bias | Authors' judgement | Support for judgement |
| Random sequence generation (selection bias) | Low risk | "A staff person created a randomisation list of intervention and control assignments base on a computer program" [personal communication]. |
| Allocation concealment (selection bias) | Low risk | "After collection of baseline data a staff member, not involved in enrolment, assigned group based on the order of receipt of baseline data" [personal communication]. |
| Blinding of participants and personnel (performance bias) | Low risk | Blinding of participants and caregivers was not possible. |
| Blinding of outcome assessment (detection bias) | Low risk | Outcome assessment by participant‐completed questionnaire sent by mail. |
| Incomplete outcome data (attrition bias) | Low risk | Follow‐up rate at 24 weeks postpartum was 89.9%. |
| Selective reporting (reporting bias) | Low risk | All outcomes were reported on. |
| Other bias | Low risk | No other sources of bias noted. |
| Methods | RCT. | |
| Participants | 103 mothers (50 in the intervention group; 53 in the control group) who were assessed as having a 'distressing or traumatic birth' were enrolled in the immediate postpartum period in a Brisbane, Australia hospital. | |
| Interventions | Intervention group: 1 midwifery‐led debriefing session before hospital discharge and another at 6 to 8 weeks postpartum. Control group: standard care with no midwifery‐led debriefing session. | |
| Outcomes | Outcomes included depression (EPDS > 12) at 4‐6 and 12 weeks postpartum, maternal stress (Depression Anxiety and Stress Scale‐21) at 12 weeks. | |
| Notes | ||
| Risk of bias | ||
| Bias | Authors' judgement | Support for judgement |
| Random sequence generation (selection bias) | Low risk | "computer generated random allocations." |
| Allocation concealment (selection bias) | Low risk | "performed using sealed, opaque envelopes." Personal communication confirmed the envelopes were consecutively numbered. |
| Blinding of participants and personnel (performance bias) | Low risk | Blinding of participants and caregivers was not possible. |
| Blinding of outcome assessment (detection bias) | Low risk | A "second research midwife, blinded to group allocation, conducted the follow‐up telephone interviews". |
| Incomplete outcome data (attrition bias) | Low risk | Follow‐up rates at 4‐6 and 12 weeks postpartum were 99.0% and 100% respectively. |
| Selective reporting (reporting bias) | Low risk | All outcomes were reported on. Satisfaction information was collected only from intervention group. |
| Other bias | Low risk | No other sources of bias noted. |
| Methods | RCT. | |
| Participants | 194 low‐risk married women having their first babies and attending routine antenatal classes (96 in the intervention group; 98 in the control group) were enrolled at > 28 weeks of pregnancy in a teaching hospital in China. Women with a personal or family history of depression were excluded. | |
| Interventions | Intervention group: routine antenatal classes (as per control group); 2 2‐hour IPT‐oriented group antenatal classes by trained midwives; and 1 telephone call at 2 weeks postpartum from the same midwife.The extra classes were done immediately following the routine antenatal class and the group size was <= 10 participants. | |
| Outcomes | Outcomes included depression (EPDS > 12); psychological well‐being (General Helath Questionnaire) and satisfaction with interpersonal relationships (researcher‐developed scale) at 6 weeks postpartum. | |
| Notes | 13.4% of overall sample had EPDS scores of >= 13 at enrolment. 95.8% of women in the intervention group attended all the extra antenatal classes. | |
| Risk of bias | ||
| Bias | Authors' judgement | Support for judgement |
| Random sequence generation (selection bias) | Low risk | Computer‐generated 'table of random numbers'. |
| Allocation concealment (selection bias) | Unclear risk | Eligiblity screen by prenatal educator. Consent was obtained by the principal investigator. The list of treatment allocations were stored on the computer of the same principal investigator who obtained consent to participate. |
| Blinding of participants and personnel (performance bias) | Low risk | Blinding of participants and caregivers was not possible. |
| Blinding of outcome assessment (detection bias) | Low risk | Outcome assessment was done by "research assistant who was blinded to the treatment condition". |
| Incomplete outcome data (attrition bias) | Low risk | Follow‐up rate at 6 weeks postpartum was 90.2%. |
| Selective reporting (reporting bias) | Low risk | All outcomes were reported on. |
| Other bias | Low risk | No other sources of bias noted. |
| Methods | RCT. | |
| Participants | 151 couples having their first baby (77 in intervention group and 74 in the control group) were enrolled from prenatal classes in Minnesota, USA. | |
| Interventions | Intervention group: 2 30‐minute breakout sessions run by a psychologist that occurred during the regular prenatal class program. 1 session dealt with supportive behaviours between the couple and the other discussed planned household work tasks. Control group: regular prenatal class program which included a video about being a new parent and discussion of infant care during the breakout session times. | |
| Outcomes | Outcomes included mental health (5‐item SF36 mental health scale), parent support and work measures at 26 weeks postpartum. | |
| Notes | Only data from the mothers were used. Parent/social support was measured with 1 item ‐"How often did your partner make you feel he cared about you?" (responses from 1 = never to 7 = frequently). Marital discord was measured with 1 item ‐ "How satisfied are you with your relationship with your partner?" (responses 1 = very dissatisfied to 7 = very satisfied). | |
| Risk of bias | ||
| Bias | Authors' judgement | Support for judgement |
| Random sequence generation (selection bias) | Low risk | "computer generated permuted block random number schedule." |
| Allocation concealment (selection bias) | Low risk | "a research assistant randomly assigned couples to groups." "The participants were informed of assignment at next class." We have assumed that the group assignment was done away from the prenatal class itself. |
| Blinding of participants and personnel (performance bias) | Low risk | Blinding of participants and caregivers was not possible. |
| Blinding of outcome assessment (detection bias) | Low risk | Outcome assessment by participant‐completed questionnaire sent by mail. |
| Incomplete outcome data (attrition bias) | Low risk | Follow‐up rate at 24 weeks postpartum was 87.4%. |
| Selective reporting (reporting bias) | Low risk | All outcomes were reported on. |
| Other bias | Low risk | No other sources of bias noted. |
| Methods | RCT with stratification for past history of depression. | |
| Participants | 45 pregnant women (24 in the intervention group; 21 in the control group) at‐risk for postpartum depression who attended various obstetric clinics in Iowa City and St. Louis, USA. | |
| Interventions | Intervention group: 5 individual sessions based on interpersonal psychotherapy, beginning in late pregnancy and ending at approximately 4 weeks postpartum. The intervention was given by a PhD psychology student. | |
| Outcomes | Outcomes included depression (EPDS > 12 and SCID) at 4 and 24 weeks postpartum. | |
| Notes | ||
| Risk of bias | ||
| Bias | Authors' judgement | Support for judgement |
| Random sequence generation (selection bias) | Low risk | "using a random numbers table" with blocking. |
| Allocation concealment (selection bias) | Low risk | "allocations stored securely in student's supervisor's office. Student enrolling women would notify supervisor and he would verbally tell her the group assignment" [personal communication]. |
| Blinding of participants and personnel (performance bias) | Low risk | Blinding of participants and caregivers was not possible. |
| Blinding of outcome assessment (detection bias) | Low risk | Data collection done by advanced clinical graduate students who were blind to treatment allocation. |
| Incomplete outcome data (attrition bias) | Low risk | A questionnaire was completed and a SCID assessment was done at 4 and 24 weeks postpartum. The completion rates for the SCID were 86.6% and 82.2%, The completion rates for the questionnaire were 73.3% and 66.6%. |
| Selective reporting (reporting bias) | Low risk | All outcomes were reported on. |
| Other bias | Low risk | No other sources of bias noted. |
| Methods | RCT stratified by recruiting centre. | |
| Participants | 683 healthy mothers (number of women randomised to each group not stated) who gave birth in 1 rural and 1 metropolitan hospital in Victoria, Australia. Women were excluded if they were patients of general practitioners who were the trial reference group, attended the teenage clinic, or delivered by an emergency caesarean section. | |
| Interventions | All participants received a letter and appointment date to see a general practitioner for a check‐up: the intervention group for 1 week after hospital discharge and the control group for 6 weeks postpartum. | |
| Outcomes | Outcomes included depression (EPDS > 12), maternal physical and mental well‐being (SF‐36), and breastfeeding duration at 12 and 24 weeks postpartum. | |
| Notes | ||
| Risk of bias | ||
| Bias | Authors' judgement | Support for judgement |
| Random sequence generation (selection bias) | Low risk | "variable block randomisation schedule." |
| Allocation concealment (selection bias) | Low risk | "via telephone through a centrally controlled randomisation centre." |
| Blinding of participants and personnel (performance bias) | Low risk | Blinding of participants and caregivers was not possible. |
| Blinding of outcome assessment (detection bias) | Low risk | Outcome assessment by participant‐completed questionnaire sent by mail. |
| Incomplete outcome data (attrition bias) | High risk | Follow‐up rates at 12 and 24 weeks postpartum were 69.7% and 65.3% respectively. |
| Selective reporting (reporting bias) | Low risk | All outcomes were reported on. |
| Other bias | Low risk | No other sources of bias noted. |
| Methods | RCT. | |
| Participants | Pregnant women were screened and those thought to be at risk for depression were contacted about the study. Women with psychotic illness, serious suicidal risk or poor fluency in English were excluded. 117 were found to be at risk during screening and were randomised (61 in intervention group and 56 in control group). 71 of these women consented and completed baseline information at 30 weeks of pregnancy (range 24‐36) (32 in the intervention group and 39 in the control group). 3 women in each group had major depression at baseline (8% of total sample) and were excluded at that time. | |
| Interventions | Intervention group: NEWPIN (New Parent Infant Network). The NEWPIN program provides antenatal and postnatal social support with 1‐to‐1 befriending and psycho‐educational group meetings by trained volunteers who themselves are mothers. Control group: usual care. | |
| Outcomes | Outcome was onset of major depression; minor depression requiring medication; or if already depressed, a failure to recover during the time from baseline and follow‐up. Outcome data were measured using SCAN (Schedules for assessment in Neuropsychiatry) and yields a diagnosis of depression according to DSM‐IV criteria. Personal communication with the authors provided data from the SCAN at 12 weeks postpartum. | |
| Notes | The reference provided outlines the registration of the trial. The trial is complete and the principal investigator was Dr Tirril Harris. She provided slides that outlined many aspects of the trial. | |
| Risk of bias | ||
| Bias | Authors' judgement | Support for judgement |
| Random sequence generation (selection bias) | Low risk | The allocation sequence was created by a research assistant not involved in enrolment. S/he filled opaque envelopes with treatment allocations which were sealed, shuffled randomly and then numbered. |
| Allocation concealment (selection bias) | Low risk | Randomisation was done by a phone call to the research assistant at a site away from the location of enrolment. She opened the next envelope. |
| Blinding of participants and personnel (performance bias) | Low risk | Blinding of participants and caregivers was not possible. |
| Blinding of outcome assessment (detection bias) | High risk | Outcome assessment was done by face‐to‐face interviews and authors state that "interviewers rarely remained unblinded". |
| Incomplete outcome data (attrition bias) | High risk | 60.7% of those randomised completed the baseline interview and 55.5% of those randomised provided outcome data at 12 weeks postpartum. |
| Selective reporting (reporting bias) | Low risk | All outcomes were reported on. |
| Other bias | Low risk | No other sources of bias noted. |
| Methods | RCT. | |
| Participants | 70 women receiving prenatal care in California, USA (35 to intervention group and 35 to control group) were enrolled in the 3rd trimester of pregnancy. They were having their first baby, had no current mental illness and were identified as 'at risk' by a social history interview. All participants were poor and lacked social support. | |
| Interventions | Intervention group: home visiting by mental health professionals, possible referral to community resources and the availability of a weekly mother‐infant group. Visits were done for the first 2 years postpartum. They began at the end of pregnancy, were weekly during pregnancy and the first year, every other week in the second year and 60 minutes in length. Telephone follow‐up contacts were done in the 3rd and 4th years. Control group: paediatric follow‐up which entailed developmental evaluation, referrals as needed but no visits or access to the mother‐infant group. | |
| Outcomes | Outcomes included depression (BDI), anxiety (STAI), maternal support (Cutrona Support Inventory), marital discord (Locke‐Wallace Marital Inventory), maternal‐infant attachment (Attachment Q‐set) and infant development (Bayley Scales of Infant Development) at 4, 24 and 52 weeks postpartum. | |
| Notes | All outcomes except the Bayley were combined into factors in the publication. The authors were unable to supply the raw data. As depression data were not available (the primary outcome of this review) no data from this trial were included in the review. | |
| Risk of bias | ||
| Bias | Authors' judgement | Support for judgement |
| Random sequence generation (selection bias) | Low risk | No allocation sequence was used. A coin toss was done for every 2 families. |
| Allocation concealment (selection bias) | Low risk | "Once two consecutive families agreed to participate a coin toss by a person who had had no contact with the families determined the group. |
| Blinding of participants and personnel (performance bias) | Low risk | Blinding of participants and caregivers was not possible. |
| Blinding of outcome assessment (detection bias) | Low risk | "Assessments done by staff unaware of treatment assignment." |
| Incomplete outcome data (attrition bias) | Low risk | Follow‐up rate at 4, 24 and 52 weeks postpartum were 100%, 91.1% and 91.1% respectively. |
| Selective reporting (reporting bias) | Unclear risk | All outcomes were reported but were combined into factors. No raw data numbers except Bayley were available. |
| Other bias | Low risk | No other sources of bias noted. |
| Methods | RCT with stratification by site and expected month of delivery. | |
| Participants | 1047 medically low‐risk pregnant women (653 in the intervention group; 394 in the control group) were recruited antenatally from 2 US hospital antenatal clinics (Atlanta GA and New Haven CT). The women were 25 years old or less and < 24 weeks' gestation (mean 18 weeks SD 3.3) at enrolment. | |
| Interventions | Intervention group: group prenatal care. Each prenatal visit was done in a group setting and led by a health professional (midwife or obstetrician). It was integrative prenatal care combining assessment, education, skill building and support. There were 10 2‐hour sessions from 16‐40 weeks of gestation (20 hours in total). Usual care: individual prenatal care. Individual contact was made at the same time points as the group sessions. Each contact was 10‐15 minutes (2 hours in total). | |
| Outcomes | Outcomes included depression (CES‐D), stress (Perceived Stress Scale) and social support (Social Relationship Scale) at 24 and 52 weeks postpartum. | |
| Notes | In the trial there were 2 study groups that received group prenatal care. 1 received the standard group care and the other received more information about HIV and sexual risk reduction. For this review the 2 groups will be combined and considered to be the intervention group. | |
| Risk of bias | ||
| Bias | Authors' judgement | Support for judgement |
| Random sequence generation (selection bias) | Low risk | Computer‐generated randomisation sequence. 40% to control group and 60% to the 2 intervention groups (see notes section above). |
| Allocation concealment (selection bias) | Low risk | "Allocation was concealed from participant and research staff until eligibility screening was completed and study condition was assigned." "Randomization sequence was password protected to recruitment staff and participants." |
| Blinding of participants and personnel (performance bias) | Low risk | Blinding of participants and caregivers was not possible. |
| Blinding of outcome assessment (detection bias) | Low risk | "All measurement and data collection were conducted in blinded fashion independently of the care setting." |
| Incomplete outcome data (attrition bias) | Unclear risk | Follow‐up rate at 24 and 52 weeks postpartum were 75.2% and 80.2% respectively. |
| Selective reporting (reporting bias) | Low risk | All outcomes were reported on. |
| Other bias | Low risk | No other sources of bias noted. |
| Methods | RCT. | |
| Participants | 114 primiparous mothers (60 in the intervention group; 60 in the control group) in a UK teaching hospital. Inclusion criteria: singleton pregnancy, cephalic presentation, spontaneous labour at term, normal vaginal delivery. | |
| Interventions | Intervention group: 1 debriefing session before hospital discharge, which lasted 30 to 120 minutes, provided by a midwife who received no formal training. | |
| Outcomes | Outcomes included depression (HADS) and anxiety (HADS) at 3 weeks postpartum. | |
| Notes | 59.6% of the participants were single mothers. | |
| Risk of bias | ||
| Bias | Authors' judgement | Support for judgement |
| Random sequence generation (selection bias) | Low risk | "simple random sampling using computer generated numbers." |
| Allocation concealment (selection bias) | Low risk | "opening consecutively numbered, sealed opaque envelopes." Done by ward staff. |
| Blinding of participants and personnel (performance bias) | Low risk | Blinding of participants and caregivers was not possible. |
| Blinding of outcome assessment (detection bias) | Low risk | Outcome assessment by participant‐completed questionnaire sent by mail. |
| Incomplete outcome data (attrition bias) | Low risk | Follow‐up rate at 3 weeks postpartum was 95%. The completion rate by group was not reported. |
| Selective reporting (reporting bias) | Low risk | All outcomes were reported on. |
| Other bias | Low risk | No other sources of bias noted. |
| Methods | RCT. | |
| Participants | 217 pregnant Latino women (112 in intervention group; 105 in control group) ≤ 24 weeks' gestation were enrolled from a healthcare centre and hospital clinic in Washington DC. They were screened and considered to be at high risk of depression (CES‐D ≥ 16 or self report of personal or family history of depression) but did not currently have a major depressive illness. | |
| Interventions | Intervention group:cognitive behavioural group therapy sessions. Research staff provided 8 weekly sessions during pregnancy and 3 booster sessions at 6, 16 and 52 weeks postpartum. Participants attended a mean of 4.1 sessions during pregnancy (SD 2.9) and 2.0 (SD 1.3) booster sessions. Usual care: usual prenatal care. This may have included services that participants chose for themselves. | |
| Outcomes | Outcomes included depression (Beck and Mood Screener) measured post intervention and at 6, 16 and 52 weeks postpartum. | |
| Notes | It is unknown how many women had a CES‐D score > 16 at recruitment. | |
| Risk of bias | ||
| Bias | Authors' judgement | Support for judgement |
| Random sequence generation (selection bias) | Low risk | Allocation list prepared by principal investigator using a coin toss.[personal communication]. |
| Allocation concealment (selection bias) | Low risk | Allocations were put in consecutively numbered, sealed opaque envelopes [personal communication]. "Group membership was assigned by the first author; neither participant nor interviewer knew the result of the random assignment until this envelope was opened." |
| Blinding of participants and personnel (performance bias) | Low risk | Blinding of participants and caregivers was not possible. |
| Blinding of outcome assessment (detection bias) | High risk | Outcome assessors were not blinded. |
| Incomplete outcome data (attrition bias) | Low risk | Follow‐up rate at 6, 16 and 52 weeks postpartum were 82.9%, 80.2% and 69.1% respectively. |
| Selective reporting (reporting bias) | Low risk | All outcomes were reported on. Raw data numbers were available. |
| Other bias | Unclear risk | It is unknown how many women had a CES‐D score > 16 at recruitment. |
| Methods | RCT with cluster‐randomisation stratified on rural and metropolitan. Unit of randomisation was local government authority. | |
| Participants | Local government authorities in Victoria, Australia were matched on location (rural or metropolitan), size, rating of current and recent community activity, annual number of births and non‐contiguous boundaries. 16 local government authorities were included (8 in the intervention group and 8 in the control group). No individual consent was sought from participants. All women giving birth in the participating local government authorities over a 10 month period (19,193) were sent postal questionnaires (10,471 in the intervention group and 8722 in the control group). A pre‐paid reply envelope was included and reminder cards were sent at 2 and 4 weeks. | |
| Interventions | Intervention group: PRISM program which 'aimed to refocus the existing postnatal health care contact on maternal physical and mental health, to implement community strategies to increase the availability and accessibility of "time‐out", provide better information about common health problems and local services, with encouragement and incentives to use them'. It included an education program for general practitioners and maternal child heath nurses, an information kit given to new mothers at hospital discharge, a community information officer for 2 years, and local steering committees to help with local initiatives. Control group:usual care. No further details noted. | |
| Outcomes | Outcomes included depression (EPDS), general health status (physical and mental component score of the SF36) and women's views at 24 weeks postpartum. | |
| Notes | ||
| Risk of bias | ||
| Bias | Authors' judgement | Support for judgement |
| Random sequence generation (selection bias) | Low risk | The local government authorities were matched (see details above). "randomisation occurred within pairs assigning one to intervention and one to control." |
| Allocation concealment (selection bias) | Unclear risk | "Randomisation took place at a public event." No further details were provided. |
| Blinding of participants and personnel (performance bias) | Low risk | Blinding of participants and caregivers was not possible. |
| Blinding of outcome assessment (detection bias) | Low risk | Outcome assessment by participant‐completed questionnaire sent by mail. |
| Incomplete outcome data (attrition bias) | Low risk | The response rates at 24 weeks postpartum was 59.0% (59.9% in the intervention group and 58.0% in the control group). We assessed this as 'very high' for a community mail out. |
| Selective reporting (reporting bias) | Low risk | All outcomes were reported on. Analysis was done using logistic‐normal characterised as 'cluster‐specific'. |
| Other bias | Low risk | Bias risk for cluster trial: Community mail outs were done rather than individual consent and thus prior knowledge of cluster group is not applicable to this trial. Clusters were matched and randomisation was done in pairs. There were no differences in the social and perinatal baseline characteristics between the 2 groups. No full clusters were lost to follow‐up. |
| Methods | RCT with cluster design. Unit of randomisation was general practice. | |
| Participants | The general practices had on average 2 or more general practitioners and ≥ 2 midwives. 17 practices were randomised to the intervention group and 19 practices to the control group. 2064 UK postpartum mothers (1087 in the intervention group; 977 in the control group). Only mothers expected to move out of the general practice area were excluded. | |
| Interventions | Intervention group: flexible, individualised, extended home visits by a midwife to 28 days postpartum that included (1) screening with a symptoms checklist and the EPDS, (2) a referral to a general practitioner as necessary, and (3) a 10‐12 week discharge visit. Control group: standard care that included 7 midwifery home visits to 10‐14 days postpartum (may extend to 28 days) and care by health visitors thereafter. General practitioners completed routine home visits and a final check‐up at 6 to 8 weeks postpartum. | |
| Outcomes | Outcomes included depression (EPDS > 12) at 16 and 52 weeks postpartum. | |
| Notes | Additional information (including standard deviations for continuous outcomes) were provided by the trial authors. | |
| Risk of bias | ||
| Bias | Authors' judgement | Support for judgement |
| Random sequence generation (selection bias) | Low risk | "customised, computer program using minimization with 2 factors were included, socioeconomic deprivation and midwife caseload." |
| Allocation concealment (selection bias) | Low risk | Done by a "member of the clinical trial unit who was independent of the trial team." |
| Blinding of participants and personnel (performance bias) | Low risk | Recruitment of the participants from the clusters was done by unblinded staff. Blinding of participants and caregivers was not possible. |
| Blinding of outcome assessment (detection bias) | Low risk | Outcome assessment by participant‐completed questionnaire sent by mail. |
| Incomplete outcome data (attrition bias) | High risk | Follow‐up rates at 12 and 52 weeks postpartum were 72.8% and 73.3% respectively. |
| Selective reporting (reporting bias) | Low risk | All outcomes were reported on. |
| Other bias | Low risk | Bias risk for cluster trial: it is not stated whether participants were aware of the group allocation of their cluster before enrolling in the study. Recruitment rates did not differ between clusters. Randomisation of clusters used minimisation based on socioeconomic deprivation and midwife caseload. Mulitvariate model analysis was used to test whether baseline characteristics differed more than would be expected given cluster‐randomisation and showed no significant differences. For any proportional differences the ones generally indicative of worse health outcome were biased again the intervention group. 1 cluster was lost from the trial when the single midwife in the cluster went on long‐term sick leave and could not be replaced. |
| Methods | RCT. | |
| Participants | 623 UK postpartum mothers (311 in the intervention group; 312 in the control group). Exclusion criteria: insufficient English to complete questionnaires and an infant in the special care unit for more than 48 hours. | |
| Interventions | Intervention group: postnatal care at home by community midwives plus up to 10 home visits in the first month postpartum lasting up to 3 hours provided by a community postnatal support worker. Control group: postnatal care at home by community midwives. | |
| Outcomes | Outcomes included depression (EPDS > 12), maternal physical and mental well‐being (SF‐36), social support (Duke Functional Social Support), and breastfeeding duration at 6 and 24 weeks postpartum. | |
| Notes | There were more twins (9/311 vs 1/312) and more women had an adult living with them (87% vs 79%) in the intervention group. | |
| Risk of bias | ||
| Bias | Authors' judgement | Support for judgement |
| Random sequence generation (selection bias) | Low risk | "prepared in advance by using random digit tables in the research office." Done by a statistician. |
| Allocation concealment (selection bias) | Low risk | "opening consecutively numbered, sealed opaque envelopes." |
| Blinding of participants and personnel (performance bias) | Low risk | Blinding of participants and caregivers was not possible. |
| Blinding of outcome assessment (detection bias) | Low risk | Outcome assessment by participant‐completed questionnaire sent by mail. |
| Incomplete outcome data (attrition bias) | Low risk | Follow‐up rates at 6 and 24 weeks postpartum were 88.4% and 79.1% respectively. |
| Selective reporting (reporting bias) | Low risk | All outcomes were reported on. Satisfaction with services was not asked as a general question of all participants. Questions were asked for specific care in each group. EPDS scores were reported as ≥12, rather than the more usual > 12. |
| Other bias | Low risk | No other sources of bias noted. |
| Methods | RCT with stratification for parity and mode of delivery. | |
| Participants | 1745 postpartum mothers (875 in the intervention group; 870 in the control group) from 2 large maternity hospitals in Perth, Australia. Exclusion criteria: insufficient English to complete questionnaires, being under psychological care at the time of delivery, maternal age < 18 years, and infant needing neonatal intensive care. | |
| Interventions | Intervention group: a single, standardised debriefing session provided in‐hospital immediately after randomisation or the next day; duration ranged from 15 minutes to 1 hour and all research midwives received training in critical incident stress debriefing. | |
| Outcomes | Outcomes included depression (EPDS > 12) at 8, 24, and 52 weeks postpartum. | |
| Notes | ||
| Risk of bias | ||
| Bias | Authors' judgement | Support for judgement |
| Random sequence generation (selection bias) | Unclear risk | Not stated. |
| Allocation concealment (selection bias) | Low risk | Each woman selected an envelope from a group of at least 6 sealed, opaque envelopes containing random allocation. |
| Blinding of participants and personnel (performance bias) | Low risk | Blinding of participants and caregivers was not possible. |
| Blinding of outcome assessment (detection bias) | Low risk | Outcome assessment by participant‐completed questionnaire sent by mail. Some participants were interviewed by clinical psychologist who was blinded to study group. |
| Incomplete outcome data (attrition bias) | Low risk | Follow‐up rates at 8, 24, and 52 weeks postpartum were 94.1%, 91.2% and 80.2% respectively. |
| Selective reporting (reporting bias) | Unclear risk | Clinical interviews were used to determine depression and post traumatic stress based on DSM IV criteria. However interviews were not done for all participants. Interviews were done if: 1) the EPDS score was > 12; 2) women were currently receiving treatment or medication for a psychological disorder; and 3) for a stratified sample of women with lower EPDS scores (59% for those with scores 10‐12, 10% with scores 5‐9 and 5% with scores < 5). If a woman did not have a clinical interview she was categorised as 'not depressed'. Post traumatic stress was determined during the same clinical interview (driven mostly by the EPDS score) and women with elective caesarean delivery were excluded from the total reported. The denominator for post traumatic stress was not reported. |
| Other bias | Low risk | No other sources of bias noted. |
| Methods | RCT with a 2 x 2 factorial design, stratified by centre. | |
| Participants | 1004 UK mothers (503 in the intervention group; 501 in the control group). Inclusion criteria: all primiparous women attending antenatal clinics in 2 participating hospitals. Exclusion criteria: women whose infant subsequently died or was admitted to the special care unit for more than 2 weeks. | |
| Interventions | 2 postpartum interventions incorporating 4 groups: 1) control, 2) mailed self‐help materials, 3) invitation to support group, and 4) self‐help materials plus invitation to support group. The support groups were run on a weekly basis for 2 hours facilitated by trained midwives. | |
| Outcomes | Outcomes included depression (EPDS > 11), maternal physical and mental well‐being (SF‐36), and social support (SSQ6) at 12 and 24 weeks postpartum. | |
| Notes | For this review data were analysed by combining groups 1 and 2 vs groups 3 and 4 to achieve a comparison of support group vs no support group. Only 18% of participants in the intervention group attended a support group session. | |
| Risk of bias | ||
| Bias | Authors' judgement | Support for judgement |
| Random sequence generation (selection bias) | Low risk | "computer generated scheme with randomised permuted blocks." |
| Allocation concealment (selection bias) | Low risk | Done by trial co‐ordinator after delivery of a live baby was confirmed. The trial co‐ordinator was off‐site. |
| Blinding of participants and personnel (performance bias) | Low risk | Blinding of participants and caregivers was not possible. |
| Blinding of outcome assessment (detection bias) | Low risk | Outcome assessment by participant‐completed questionnaire sent by mail. |
| Incomplete outcome data (attrition bias) | High risk | Follow‐up rates at 12 and 24 weeks postpartum were 73.3% and 71.4% respectively. |
| Selective reporting (reporting bias) | Low risk | All outcomes were reported on. |
| Other bias | Low risk | No other sources of bias noted. |
| Methods | RCT with stratification by parity. | |
| Participants | 162 pregnant women with an uncomplicated twin pregnancy were enrolled at < 20 weeks' gestation (80 in the intervention group and 82 in the control group) from a hospital in the UK. Women having fetal or infant death were excluded (3 in each group). | |
| Interventions | Intervention group: care, advice and support from a Twin Midwife Advisor which included: at least 2 home visits (1 antenatal and 1 in the early postpartum); specially designed antenatal preparation for parenting program (4‐5 antenatal group classes and 1 postnatal class); care in‐hospital and at out‐patient hospital clinic. Control group: standard care and advice which included:shared antenatal care between general practitioner (GP) and consultant obstetrician at a twin clinic; allocation to a community midwife who may provide care in conjunction with GP; invitation to attend community‐based antenatal education sessions (normally without a focus on twins); invitation to a breastfeeding workshop (rarely with focus on twins); self‐referral to Childbirth Trust antenatal sessions (without focus on twins). | |
| Outcomes | Outcomes included depression (EPDS), anxiety (HADS subscale for anxiety); parental stress (PSI); mother‐infant attachment (Green scale), social support (subscale of Satisfaction with Motherhood scale), marital relationship (VAS developed by researcher), general outlook on life, emotional well being and satisfaction with care at 6, 12, 24 and 52 weeks postpartum. | |
| Notes | For mother‐infant attachment data were collected for each twin. We took the 'worst' score so we did not miss a 'bad outcome'. | |
| Risk of bias | ||
| Bias | Authors' judgement | Support for judgement |
| Random sequence generation (selection bias) | Low risk | "on‐line web based electronic randomisation procedure provided by Centre for Health Service Research, Newcaslte University." Used permuted block design. |
| Allocation concealment (selection bias) | Low risk | "During the enrolment home visits a laptop was connected to a mobile phone for Internet access to the randomisation service. The participant pressed the randomisation button to obtain group allocation." |
| Blinding of participants and personnel (performance bias) | Low risk | Blinding of participants and caregivers was not possible. |
| Blinding of outcome assessment (detection bias) | Low risk | Outcome assessment by participant‐completed questionnaire sent by mail. |
| Incomplete outcome data (attrition bias) | Low risk | Follow‐up rates at 6, 12, 24, and 52 weeks postpartum were 81.5%, 79.0%, 82.1% and 75.3% respectively. |
| Selective reporting (reporting bias) | Low risk | All outcomes were reported on. |
| Other bias | Low risk | No other sources of bias noted. |
| Methods | RCT stratified by research midwife who would give the intervention. | |
| Participants | 1041 mothers (520 in the intervention group; 521 in the control group) who had an operative delivery in a large maternity teaching hospital in Melbourne, Australia. | |
| Interventions | Intervention group: a midwifery‐led debriefing session before discharge to provide women with an opportunity to discuss their labour, birth, and postdelivery events and experiences. | |
| Outcomes | Outcomes included depression (EPDS > 12) and overall maternal health status (SF‐36) at 24 weeks postpartum. Depression was measured at 4‐6 years but not included in the review. | |
| Notes | ||
| Risk of bias | ||
| Bias | Authors' judgement | Support for judgement |
| Random sequence generation (selection bias) | Low risk | "allocation determined by computer generated, adaptive biased coin randomisation schedule." |
| Allocation concealment (selection bias) | Low risk | "telephone randomisation." |
| Blinding of participants and personnel (performance bias) | Low risk | Blinding of participants and caregivers was not possible. |
| Blinding of outcome assessment (detection bias) | Low risk | Outcome assessment by participant‐completed questionnaire sent by mail. |
| Incomplete outcome data (attrition bias) | Low risk | Follow‐up rate at 24 weeks was 88.1% and 51.3% at 4‐6 years. |
| Selective reporting (reporting bias) | Low risk | All outcomes were reported on. |
| Other bias | Low risk | No other sources of bias noted. |
| Methods | RCT with stratification by parity. | |
| Participants | 144 pregnant women (73 in the intervention group; 71 in the control group) who screened at‐risk for postpartum depression during antenatal clinic visits in Adelaide, Australia. Inclusion criteria: English‐speaking, singleton fetus, and < 24 weeks' gestation. | |
| Interventions | Intervention group: routine antenatal care plus 2 antenatal and 1 postnatal midwifery‐led group sessions. | |
| Outcomes | Outcomes included depression (EPDS > 12) at 6, 12, and 24 weeks postpartum. | |
| Notes | A high number of women were screened 'vulnerable' and only 31% of participants in the intervention group attended all 3 sessions. | |
| Risk of bias | ||
| Bias | Authors' judgement | Support for judgement |
| Random sequence generation (selection bias) | Low risk | "randomisation schedules were prepared in advance by a researcher not involved in the trial." Variable balanced blocks were used. |
| Allocation concealment (selection bias) | Low risk | "allocated by telephone call from clinic to independent researcher who opened the next in a series of sequentially numbered envelopes." |
| Blinding of participants and personnel (performance bias) | Low risk | Blinding of participants and caregivers was not possible. |
| Blinding of outcome assessment (detection bias) | Low risk | Outcome assessment by participant‐completed questionnaire sent by mail. |
| Incomplete outcome data (attrition bias) | Low risk | Follow‐up rates at 6, 12, and 24 weeks postpartum were 92.1%, 92.8% and 87.1% respectively. |
| Selective reporting (reporting bias) | Low risk | All outcomes were reported on. |
| Other bias | Low risk | No other sources of bias noted. |
| Methods | RCT. | |
| Participants | 560 in‐hospital mothers (280 in each group) from Hong Kong, China with at least 1 suboptimal outcome in the perinatal period ranging from antenatal complications requiring hospitalisation, elective caesarean section, labour induction, postpartum haemorrhage, infant admission to special care unit, etc. | |
| Interventions | Intervention group: routine postpartum care plus 1 to 4 sessions of "educational counselling" by a research nurse before hospital discharge that included information related to the adverse event and counselling to assist the mother to "come to terms with her losses and find solutions to specific difficulties" (median total time was 35 minutes). 24 women also received 1 session by a physician. | |
| Outcomes | Outcomes included depression (HADS > 4) at 6 and 24 weeks postpartum. | |
| Notes | ||
| Risk of bias | ||
| Bias | Authors' judgement | Support for judgement |
| Random sequence generation (selection bias) | Low risk | "computer generated numbers." |
| Allocation concealment (selection bias) | Low risk | "done by research nurse using sealed, opaque, sequentially numbered envelopes." |
| Blinding of participants and personnel (performance bias) | Unclear risk | Blinding of participants was not possible and health professionals were not blinded to group allocation. |
| Blinding of outcome assessment (detection bias) | Unclear risk | Outcome assessment done before hospital discharge, at 6 weeks postpartum during the routine postnatal follow‐up visit and at 24 weeks with a mailed questionnaire. The process of data collection in‐hospital and at the follow‐up visit is not stated. |
| Incomplete outcome data (attrition bias) | Unclear risk | The authors state that "560 patients were invited to participate, 180 declined", "1 case in the control group was excluded" and "161 participants in the counselling group and 255 in the control completed the study". The numbers at each of the follow‐up time points is not stated. The actual numbers of participants at each stage of the study are unclear based on these numbers. The authors have been contacted for clarification. |
| Selective reporting (reporting bias) | Low risk | All outcomes were reported but the time points are unclear. |
| Other bias | Low risk | No other sources of bias noted. |
| Methods | RCT with cluster design stratified by district and pre‐existence of a women's group. Unit of randomisation was geographic area. The existing women's groups carried out financial savings and credit activities. | |
| Participants | 12 clusters were identified in each of 3 contiguous districts in eastern India (36 in total) (18 in the intervention group and 18 in the control group). The mean cluster size was 6338 (range 3605‐7467) and the proportion of Adivasis (indigenous groups) was 58%‐70%. The Adivasis are an under‐serviced population with lower rates of employment, lower rates of education for children, higher mortality rates and poorer access to health services than non‐indigenous populations. Women were part of clusters based on where they lived. They attended the women's group (for those in the intervention group) during pregnancy if they wished to. Study consent was not required to attend the group. After delivery women, aged 15‐49, living in the participating regions during the study period were asked if they would consent to a study interview. Those who consented were the participants in the study. A total of 19,030 women participated (9770 in the intervention group and 9260 in the control group). | |
| Interventions | Intervention group: existing women's groups expanded their function (172 groups) and 72 groups were created. Each group had a local leader and met monthly for a total of 20 meetings. The groups took part in a participatory learning and action cycle that identified problems, planned strategies, put strategies into practice and assessed the effect. Clean obstetrics delivery practices and care‐seeking behaviour were shared through stories and games at the groups. Control group: existing women's groups maintained their financial function but did not add anything else. Clusters without women's groups did not create any. In both groups health committees were formed so that community members could express their opinions about the design and management of local health services. | |
| Outcomes | Outcomes included neonatal mortality, maternal depression (Kessler‐10), stillbirths, maternal and perinatal deaths and health resource use. Each month 'key informants' told the researchers about any births or maternal deaths that had occurred in women of reproductive age in their allocated area. The 'key informant' was usually a traditional birth attendant or active village member. A researcher interviewed all women at 6 weeks postpartum who consented and obtained all study outcomes. | |
| Notes | Maternal depression was only measured starting in Year 2 of the trial because of 'delays in identification of a contextually appropriate scale'. Group attendance in Year 1 of the study was 18% of newly pregnant women and rose to 55% in Year 3. | |
| Risk of bias | ||
| Bias | Authors' judgement | Support for judgement |
| Random sequence generation (selection bias) | Low risk | Clusters were assigned a number and these numbers were written on pieces of paper and folded. For each region the papers where separated into 2 sets, those clusters with existing women's groups and those without. Each set of numbers was put into a basket. |
| Allocation concealment (selection bias) | Low risk | An external observer drew the papers 1 after the other from the basket to assign group allocations evenly for each set. The first numbers drawn were allocated to the intervention group, the rest were allocated to the control group. The authors presented a chart showing how this process was done in each region based on the size of each set. For sets with an even number of clusters the first half were intervention and the second half were control (i.e. 8 total clusters, the first 4 were intervention, the second 4 were control). For sets with an odd number of clusters the process was the same but it varied if the larger number was in the intervention group or control (i.e. a set with 5 total clusters had 2 allocated to intervention and 3 to control; a set with 9 total clusters had 5 allocated to intervention and 4 to control). How the decision was made for each set was not stated. |
| Blinding of participants and personnel (performance bias) | Low risk | Blinding of participants and caregivers was not possible. |
| Blinding of outcome assessment (detection bias) | Low risk | The staff doing the interviews were from different villages than those giving the intervention. They had their training done separately and had review meetings on separate days. |
| Incomplete outcome data (attrition bias) | Low risk | The follow‐up rate for neonatal morbidity (done on the full sample) was 98.6%. As outlined above maternal depression started to be collected in Year 2. There is no evidence presented that the follow‐up rate changed over the course of the study so we assumed that the follow‐up rate was similar for the depression outcome. |
| Selective reporting (reporting bias) | Low risk | All outcomes were reported on. As outlined above the sample size for the depression outcome is smaller as it was only collected from Year 2 on. |
| Other bias | Low risk | Bias risk for cluster trial: it is possible that the participants were aware of the group allocation of their cluster before enrolling in the study however, this was not directly discussed during the consent process [personal communication]. Randomisation of clusters was stratified by district and existence of pre‐existing women's group. Baseline differences in household assets, maternal education, literacy and tribal membership were noted between the intervention and control groups with women in the intervention group generally poorer and more disadvantaged than those in the control group. No full clusters were lost to follow‐up. It is possible that the cluster randomisation resulted in a 'herd‐effect' where more women attended a women's group than if individual randomisation had occurred. |
| Methods | RCT. | |
| Participants | 1000 pregnant mothers (495 in the intervention group; 505 in the control group) attending an antenatal clinic in Melbourne, Australia. Inclusion criteria: > 25 weeks' gestation, English‐speaking, and low medical risk. | |
| Interventions | Intervention group: team midwifery care provided antenatally and postnatally in hospital with a focus on continuity. | |
| Outcomes | Outcomes included depression (EPDS > 12) at 8 weeks postpartum. | |
| Notes | The primary outcome of this study was satisfaction with care. Of the 1000 women randomised there were 83 unavoidable exclusions due to miscarriage, termination, transfer to another hospital and perinatal death (intervention group = 39; control group = 44). 3 of these women were excluded for psychiatric problems (2 in the intervention group and 1 in the control group). Demographic differences were found between questionnaire responders and non‐responders. | |
| Risk of bias | ||
| Bias | Authors' judgement | Support for judgement |
| Random sequence generation (selection bias) | Low risk | "based on a computerized random procedure" [personal communication]. |
| Allocation concealment (selection bias) | Low risk | "research midwife telephoned a clerk at hospital's information desk who opened an opaque numbered envelope which contained information about the allocated group." |
| Blinding of participants and personnel (performance bias) | Low risk | Blinding of participants and caregivers was not possible. |
| Blinding of outcome assessment (detection bias) | Low risk | Outcome assessment by participant‐completed questionnaire sent by mail. |
| Incomplete outcome data (attrition bias) | High risk | Follow‐up rate at 8 weeks postpartum was 68.4% |
| Selective reporting (reporting bias) | Low risk | Data about depression and satisfaction reported. No details were presented for other outcomes but the authors acknowledge this. |
| Other bias | Low risk | No other sources of bias noted. |
| Methods | RCT. | |
| Participants | 92 pregnant women admitted to a high‐risk antenatal unit in Dreseden, Germany (46 to intervention group and 46 to control group) with elevated scores on the HADS or the Giessen Subjective Complaints List. 17.4% had elevated HADS (depression) scores; 40.2% had elevated HADS (anxiety) scores and 77.2% had elevated complaints scores. The gestational age at entry was not collected (personal communication). | |
| Interventions | Intervention group: individualised psychosomatic intervention by trained psychologist or psychiatrist. `The activation of resources and the dialogue about current conflicts are central aspects of the intervention.` 1‐5 session were done while in hospital and continuation on an out‐patient basis could be done if needed. Control group: standard care. | |
| Outcomes | Outcomes included depression (HADS subscale), anxiety (HADS subscale) and physical complaints at 52 weeks post‐randomisation. The number of weeks postpartum was not collected (personal communication). | |
| Notes | 7 women in the intervention group (15%) were discharged before receiving the intervention. | |
| Risk of bias | ||
| Bias | Authors' judgement | Support for judgement |
| Random sequence generation (selection bias) | Low risk | "list was generated by an independent Institute for Informatics and Biometry in Medicine of the University Hosptial." |
| Allocation concealment (selection bias) | High risk | "according to the mail order of the incoming questionnaires, the next letter (A or B) in the list was assigned to the respective subject and scratched from the list." The person recruiting participants assigned the group. |
| Blinding of participants and personnel (performance bias) | Low risk | Blinding of participants and caregivers was not possible. |
| Blinding of outcome assessment (detection bias) | Low risk | Outcome assessment by participant‐completed questionnaire sent by mail. |
| Incomplete outcome data (attrition bias) | High risk | Follow‐up rate at 52 weeks post‐randomisation was 47.8%. |
| Selective reporting (reporting bias) | Low risk | All outcomes were reported on. |
| Other bias | Low risk | No other sources of bias noted. |
| Methods | RCT. | |
| Participants | 37 pregnant women (18 in the intervention group; 19 in the control group) on public assistance who had at least 1 risk factor for postpartum depression and were attending a prenatal clinic at a general hospital in the northeast USA. | |
| Interventions | Intervention group: "Survival Skills for New Moms", which involved 4 60‐minute group sessions over a 4‐week period based on the principles of interpersonal psychotherapy. The authors did not state who provided the intervention. Control group: standard antenatal care. | |
| Outcomes | Outcomes included depression (SCID) at 12 weeks postpartum. | |
| Notes | 50% of eligible women declined trial participation. 77% of participants were single women. | |
| Risk of bias | ||
| Bias | Authors' judgement | Support for judgement |
| Random sequence generation (selection bias) | Unclear risk | Not stated. Authors have been contacted for details. |
| Allocation concealment (selection bias) | Unclear risk | "random assignment." No further details reported. Authors have been contacted. |
| Blinding of participants and personnel (performance bias) | Low risk | Blinding of participants and caregivers was not possible. |
| Blinding of outcome assessment (detection bias) | Unclear risk | Outcome assessment was done by structured interview. Exact process not stated so assessment of blinding not possible. Authors have been contacted. |
| Incomplete outcome data (attrition bias) | Low risk | Follow‐up rate at 12 weeks postpartum was 94.6%. |
| Selective reporting (reporting bias) | Low risk | All outcomes were reported. |
| Other bias | Low risk | No other sources of bias noted. |
| Methods | RCT. | |
| Participants | 99 pregnant women (53 in the intervention group and 46 in the control group) who screened at‐risk for postpartum depression during antenatal clinic visits in Rhode Island, USA. They were 23‐32 weeks' gestation and on public assistance. Those women currently receiving mental health treatment or who met criteria for current depressive disorder or substance abuse were excluded. | |
| Interventions | Intervention group: The ROSE Program (Reach Out, Stand strong, Essentials for new mothers) which involved 4 x 60‐minute group session over 4 weeks and 1 x 50‐minute individual booster session post‐delivery. The intervention was given by nurses who had received intensive training and supervision. Control group: standard antenatal care | |
| Outcomes | Outcomes included depression (Beck) and social adjustment (Range of Impaired Functioning Tool). | |
| Notes | This is a separate trial from Zlotnick 2001. The same intervention (re‐named) was used but with a larger sample size. | |
| Risk of bias | ||
| Bias | Authors' judgement | Support for judgement |
| Random sequence generation (selection bias) | Low risk | "win randomization." Not stated who created the sequence. |
| Allocation concealment (selection bias) | Unclear risk | "randomly assigned." No details of the process stated. The authors have been contacted. |
| Blinding of participants and personnel (performance bias) | Low risk | Blinding of participants and caregivers was not possible. |
| Blinding of outcome assessment (detection bias) | Unclear risk | The process for outcome collection was not stated. The authors have been contacted. |
| Incomplete outcome data (attrition bias) | Low risk | Follow‐up rate at 12 weeks postpartum was 86.9%. |
| Selective reporting (reporting bias) | Low risk | All outcomes were reported. |
| Other bias | Low risk | No other sources of bias noted. |
BDI: Beck Depression Inventory
CES‐D: Center for Epidemiologic Studies Depression Scale
DSM‐IV: Diagnostic and Statistical Manual of Mental Disorders
EPDS: Edinburgh Postnatal Depression Scale
HADS: Hospital Anxiety and Depression Scale
MINI: Mini International Neuropsychiatric Inrterview
PSI: Parenting Stress Index
RCT: randomised controlled trial
SCID: Structured Clinical Interview for DSM‐IV
SD: standard deviation
SF36: Short Form (36) Health Survey
SSQ6‐ Social Support Questionnaire ‐ Short Form
STAI: State Trait Anxiety Inventory
VAS: visual analogue scale
vs: versus
Characteristics of excluded studies [ordered by study ID]
| Study | Reason for exclusion |
| Not an RCT. Odd and even days were used for group allocation. | |
| Intervention not targeting prevention; all participants had a depressive illness. | |
| Intervention (pram‐walking vs play group) was not psychosocial or psychological, all participants were depressed and the trial began when babies were 6 weeks to 18 months old. | |
| Not an RCT. The authors state it was a 'quasi‐experimental study'. | |
| Methodological concerns that could lead to selection and outcome bias. This was a cluster design where Home‐Start schemes (informal volunteer family support program) were the unit of randomisation. Randomisation allocation scheme was done by the project manager using a coin toss during a phone call with the Home‐Start scheme co‐ordinator. The participants were aware of the group allocation of their cluster before enrolling in the study. The study began by only following those in the intervention group that accepted the intervention. Started to follow everyone part way through the study. This resulted in a 8‐week follow‐up rate of 61.3% in the intervention group and 77.1 in the control group (overall 68.9%). At 52 weeks the rates were: intervention 66.8%, control 70.8%, overall 68.7%. | |
| Postpartum depression was not an outcome. Intervention (applied relaxation therapy) was not psychosocial or psychological. | |
| Pilot trial with unclear randomisation method. Significant group differences in baseline characteristics. No usable outcome data; published data were mean scores without standard deviations. | |
| Intervention (progressive muscle relaxation) was not psychosocial or psychological. | |
| Not an RCT. Odd versus even number group assignment was used. Data were not analysed using 'intent‐to‐treat'. | |
| Intervention was not psychosocial or psychological, but rather included a single educational session about postpartum blues, provided antenatally by a midwife. | |
| Intervention not targeting prevention; all participants had a depressive illness. | |
| Not an RCT. Study examined the impact of a mother‐infant intervention through the comparison of 2 matched groups. | |
| Postpartum depression was not a study outcome. | |
| Women were 8‐12 weeks postpartum on enrolment. | |
| 28% of participants had a depressive illness at entry. | |
| 62.5% of participants had a depressive illness at entry. | |
| 50.7% of participants had a depressive illness at entry. | |
| Not an RCT. Group allocation based on delivery date. Potential selection bias with significant differences between participating and non‐participating eligible women. Data were presented using median instead of mean results. | |
| RCT trial participants were not women. This is a descriptive report of mother's satisfaction from an RCT for fathers. | |
| Not an RCT. Inexplicit non‐random group allocation. Primary outcome was 'emotional upset' using a subjective measure. All participant characteristics were lacking and 46% of mothers were lost to follow‐up. | |
| A poor measure of postpartum depression was used that included a single item question and subscore on the mental health index of the SF‐36. In addition, 30% women were excluded post randomisation. | |
| Intervention (strategies to improve sleep) was not psychosocial or psychological. | |
| Intervention not targeting prevention; all participants had a depressive illness (EPDS > 12). | |
| Intervention was not psychosocial or psychological, but rather included a single educational session about postpartum depression, provided antenatally by a midwife. | |
| Intervention was not psychosocial or psychological but rather included only information related to postpartum depression. | |
| Intervention (strategies to improve infant sleep) was not psychosocial or psychological. Mothers were enrolled when their Infants were 6‐12 months old. | |
| Intervention was not psychosocial or psychological, but rather included discharge education, provided by the postpartum nurse, and a booklet about postpartum depression. | |
| The intervention (continuous intrapartum support) was neither psychological nor psychosocial. Postpartum depression was not the primary or secondary outcome. | |
| Not an RCT. Participants were consecutively enrolled to intervention or control group. Intervention (aromatherapy and massage) was not psychosocial or psychological. | |
| Outcomes were measured 15 years post delivery. No reliable depression measure was used. Women were asked how often they had experienced depression in the last month. | |
| Intervention not targeting prevention; all participants had a depressive illness. | |
| Intervention not targeting prevention; all participants had a depressive illness. | |
| Not an RCT. | |
| Participants were women who had given birth within 6‐26 weeks. | |
| Postpartum depression was not an outcome. Outcomes were fear of childbirth and post‐traumatic stress. | |
| Participants were women who had given birth within 12 months. 19% were currently taking medication for depression or anxiety. | |
| Intervention was not psychosocial or psychological, but rather oral and written information about baby blues and postpartum depression. | |
| The intervention (aerobic exercise) was neither psychological nor psychosocial. | |
| Methodological concerns that could lead to selection and outcome bias. Inconsistant application of inclusion criteria. The first 44% of sample were assessed before randomisation for depression and those with depressive illness (measured with SCID) were to be ineligible. Howerver, 17.4% of those with a positive SCID were included in the study as decided by researcher. The report states that 'they showed no signs of great distress during the interview, reported having social support, were accepting of their pregnancy, had low anxiety scores and were unlikely to get treatment elsewhere'. The second 55% of the sample were assessed for depression after randomisation to increase recruitment numbers. There was also a differential rate of follow‐up. At 6 weeks postpartum follow‐up data were obtained on 61.4% of those in the control group and 28.4% in the intervention group. At 4‐6 months postpartum the same difference occurred (61.4% vs 31.2%). | |
| Not an RCT. Was a 'quasi‐experimental design'. | |
| Intervention (telephone based exercise program) was not psychosocial or psychological. | |
| Premature assessment of postpartum depression (2 weeks after delivery), which was neither the primary nor secondary outcome. | |
| 56% of participants 'showed evidence of depression'. The mean CES‐D score at entry was 18.0 with standard deviation of 4.7. | |
| Approximately 25% of participants were currently suffering from depression at recruitment and 49% had a depressive episode sometime during the perinatal period. | |
| Intervention was not targeting prevention; non‐depressed women were excluded and the mean BDI‐II was 21.5 for those included. | |
| 50% of participants had a depressive illness at entry (EPDS > 12). Was the pilot trial for Milgrom 2011. | |
| 30% of participants had a depressive illness at entry (EPDS > 12). Is an RCT that followed the pilot trial (Milgrom 2010) | |
| Intervention (exercise) was not psychosocial or psychological. | |
| Women were 6 weeks postpartum at first assessment and 8 weeks at start of intervention. | |
| All participants had a depressive illness at entry (CES‐D > 16). | |
| Premature assessment of postpartum depression (4‐15 days after delivery). | |
| Improper randomisation procedure used. The characteristics of the study population and type of intervention met inclusion criteria for this review however, randomisation of women was not done. 2 hospitals were randomised to provide a childbirth psycho‐education program or not. The authors stated that 'randomisation by woman was not feasible because of potential for contamination between study groups'. We considered including this trial as a cluster design but decided against it for the following reasons: 1) the number of clusters was very low (2 hospitals); 2) cluster size was small (92 women per cluster); 3) there were large differences in the baseline characteristics of age, education and income between the groups all favouring the experimental group (older, more educated and higher income); 4) the analysis was not done taking into account the cluster randomisation; and 5) no intra‐class correlation coefficient was provided. | |
| The intervention (physical therapy exercise) was neither psychological nor psychosocial. | |
| Intervention was not targeting the prevention of postpartum depression but depression among mothers of young children. | |
| Not an RCT. Study examined an educational session retrospectively involving 2 non‐randomised groups of women who sought psychiatric care postnatally. | |
| Intervention not targeting prevention; all participants had a depressive illness. | |
| Intervention was not targeting the prevention of postpartum depression but rather the treatment of antenatal depression. | |
| 32% of participants had a depressive illness at entry (CES‐D ≥ 24). | |
| Not an RCT. Women were placed in groups based on 18 pre‐determined days of the month. | |
| Postpartum depression was neither a primary or secondary outcome; statistical results related to postpartum depression were not reported. | |
| Not an RCT. Consents were numbered as they arrived, odd numbers were treatment and even numbers were control. | |
| Not an RCT. Group allocation was based on a 2‐week period. | |
| Study reports on an element of a larger trial where the primary and secondary outcome was not postpartum depression. Furthermore, 1 EPDS item (self‐harm) was excluded rendering the clinical interpretability of the outcome data questionable. | |
| Not an RCT. A single‐group study evaluating an interpersonal psychotherapy intervention for the treatment of antenatal depression. | |
| Intervention was not targeting the prevention of postpartum depression but rather the treatment of antenatal depression. | |
| Postpartum depression was neither a primary or secondary outcome; outcome was maternal adaptation. | |
| Postpartum depression was neither a primary or secondary outcome; outcome was post‐traumatic stress. | |
| Women with a child less than 6 months old were enrolled. | |
| Not an RCT. 'Divided into two groups according to their date of hospital visit.' | |
| Not an RCT. Group allocated based on pre‐numbered questionnaires (odd vs even numbers). | |
| Not an RCT. Women were matched on BDI score, parity and education level and then placed in treatment or control group. | |
| Postpartum depression was neither a primary or secondary outcome;outcomes were anxiety and stress. The intervention (listening to music) was neither psychological nor psychosocial. | |
| Postpartum depression was neither a primary or secondary outcome;outcome was maternal affect. The intervention (progressive muscle relaxation and guided imagery) was neither psychological nor psychosocial. | |
| 31% of participants had a depressive illness at entry (CES‐D > 16). | |
| The intervention was not psychosocial or psychological but rather included antenatal identification as high‐risk, an educational booklet and discussion about the risk of developing postpartum depression, and a letter to the woman's referring general practitioner and local Child Health Nurse alerting them of the woman's risk. | |
| Intervention began at 10 weeks postpartum. | |
| The researchers significantly changed the study protocol before trial completion. Inability to assess selection bias. Trial had a 21% loss to follow‐up and a poor measure of postpartum depression (Pitt Depression Inventory) was used for the main portion of the trial. | |
| Translation of original article used. Intervention described as 'participants and husbands participate in a nursing course'; 'women visit the maternity ward'. No psychosocial or psychological component described. | |
| While the author identified the study as an RCT, no information was provided related to the randomisation process or the intervention. It is also unknown whether the outcome assessor was blinded or whether the data were analysed using 'intent‐to‐treat'. 51% of sample had depressive illness at entry. |
BDI: Beck Depression Inventory
CES‐D: Center for Epidemiologic Studies Depression Scale
EPDS: Edinburgh Postnatal Depression Scale
RCT: randomised controlled trial
SCID: Structured clinical interview for the diagnostic and statistical manual of mental disorders
SF‐36: Short Form (36) Health Survey
vs: versus
Characteristics of studies awaiting assessment [ordered by study ID]
| Methods | RCT with stratification by 3 risk categories: 1) low risk; 2) depressive risk but no psychosocial risk, and 3) psychosocial risk but no depressive risk. |
| Participants | 110 women were enrolled during the 2nd trimester of pregnancy in Rome, Italy. The number of women randomised to each group was not stated. We have contacted the authors for this information. Screening was done for depression (CES‐D > 20) and psychosocial variables (such as education level, socioeconomic status, single motherhood, lack of social support) to determine stratification categories. No participants were receiving treatment for depression. |
| Interventions | Intervention group: home visits starting in the 8th month of pregnancy and continuing up to 1 year postpartum, with weekly visits in the first half of the programme and every 2 weeks thereafter. The visits were carried out by psychologists and social workers and aimed to improve maternal‐infant interaction. Control group:standard care with home visits for data collection only. No further details provided. |
| Outcomes | Outcomes included maternal‐infant attachment (Scales of Mother‐Infant Interactional System), depression (CES‐D) and maternal representations after birth at 12, 24 and 52 weeks postpartum. ACTUAL NUMBERS FOR DEPRESSION OUTCOME NOT REPORTED. AUTHORS HAVE BEEN CONTACTED FOR THIS INFORMATION AND STUDY WILL BE INCLUDED IN THE REVIEW WHEN WE RECEIVE THE DEPRESSION DATA. |
| Notes | We used the Cooperation subscale of the Scales of Mother‐Infant Interactional System for the Maternal‐Infant attachment outcome in this review. It was collected from a videotape of the mother feeding the infant. 2 independent judges rated the behaviours on the video. The Pearson correlation coefficient between judges for this measure was 0.72 (0.55‐0.89). |
| Methods | |
| Participants | |
| Interventions | |
| Outcomes | |
| Notes |
| Methods | RCT. |
| Participants | Women were screened antenatally for stress, anxiety and depression. Those with elevated levels were enrolled. Women with a current severe psychiatric disorder where excluded. |
| Interventions | Intervention group: in second trimester of pregnancy women took part in a group programme with psycho‐educational and cognitive behavioural elements on how to deal with stress, anxiety and depression. There were 8 weekly sessions lasting 90 minutes each. Control group: standard care. |
| Outcomes | Outcomes included depression (BDI‐V), stress (Prenatal Distress Questionnaire), anxiety (STAI) and cortisol levels. Time when outcome data collected not stated. |
| Notes | Only an abstract with early enrolment numbers is available. We contact the authors for more information. They state that the trial is completed and a publication is being prepared. When data are available we will include this trial in the review. |
| Methods | |
| Participants | |
| Interventions | |
| Outcomes | |
| Notes |
| Methods | |
| Participants | |
| Interventions | |
| Outcomes | |
| Notes |
| Methods | |
| Participants | |
| Interventions | |
| Outcomes | |
| Notes |
| Methods | RCT. |
| Participants | 36 pregnant low‐income, rural, African American women (19 in intervention group and 17 in usual care group) from Mississippi, USA who screened as being at risk for postpartum depression were enrolled at 24‐31 weeks' gestation. Those women who met criteria for current depressive disorder or substance abuse were excluded. |
| Interventions | Intervention group: The ROSE Program (Reach Out, Stand strong, Essentials for new mothers) which involved 4 60‐minute group session over 4 weeks and 1 50‐minute individual booster session post‐delivery. The intervention was given by trained counsellors. Control group: standard antenatal care which included the usual information pamphlets given to all prenatal women. |
| Outcomes | The outcomes were depression (EPDS), social adjustment (Social Adjustment Scale), postpartum adjustment (Postpartum Adjustment Questionnaire) and parenting stress (Parenting Stress Index) at 2‐3 and 12 weeks postpartum. |
| Notes | The number of women providing outcome data at each time point by group was not noted in the publication. Results were presented as repeated measures of variance. The authors have been contacted for this information. If such data are available this trial will be included in the review. |
| Methods | RCT. |
| Participants | 106 pregnant women (49 in intervention group and 57 in control group) who admitted to hospital in pre‐term labour in Rochester, USA. Women with evidence of psychiatric problems were excluded. |
| Interventions | Intervention group: information and support about preterm labour, coping with role changes and strategies to seek control over their environments given in mid‐pregnancy and then again 1‐2 weeks later. The intervention included keeping an activity journal, bi‐weekly phone calls from the researcher, information was given by audiotape and written materials. Control group: audiotapes and written material about nutrition during pregnancy and when to notify healthcare providers given at the same times as intervention group. |
| Outcomes | Outcomes included depression (POMS ‐ depression subscale), Anxiety (STAI) and pregnancy anxiety (Pregnancy Anxiety Scale) twice during pregnancy and 3‐4 weeks after the baby was discharged home. |
| Notes | All data presented as adjusted means. The authors have been contacted for the raw data. If such data are available this trial will be included in the review. |
| Methods | |
| Participants | |
| Interventions | |
| Outcomes | |
| Notes |
| Methods | |
| Participants | |
| Interventions | |
| Outcomes | |
| Notes |
| Methods | |
| Participants | |
| Interventions | |
| Outcomes | |
| Notes |
| Methods | Unclear. Report states `randomised in two matched groups`. |
| Participants | 80 pregnant women (40 to intervention group and 40 to control group) in Tabriz, Iran. |
| Interventions | Education in special classes at 24‐30 weeks of pregnancy. No details about what this entailed. |
| Outcomes | Depression (BDI) at 3‐10 and 15‐21 days postpartum. |
| Notes | Short abstract that does not provide enough detail to determine eligibility for this review. The authors have been contacted for additional information about randomisation process and details of the intervention. |
| Methods | |
| Participants | |
| Interventions | |
| Outcomes | |
| Notes |
| Methods | |
| Participants | |
| Interventions | |
| Outcomes | |
| Notes |
| Methods | |
| Participants | |
| Interventions | |
| Outcomes | |
| Notes |
| Methods | Unclear. Report states `randomly assigned`. |
| Participants | Study 1: 140 pregnant women in Japan. No further details provided. |
| Interventions | Intervention: 8 1‐hour interviews during pregnancy and 5 group sessions based on interpersonal therapy (4 during pregnancy and 1 postpartum). |
| Outcomes | Depression (EPDS) at 12 weeks postpartum. |
| Notes | 2 studies were outlined in the brief abstract. Study #2 appears to be an observational study. There are insufficient details about Study #1 to determine eligibility for this review and no data were presented. The author has been contacted for additional information. |
| Methods | |
| Participants | |
| Interventions | |
| Outcomes | |
| Notes |
| Methods | RCT with cluster‐randomisation. Unit of randomisation was prenatal class. |
| Participants | 3 prenatal classes were randomised to 1 of 3 conditions (empathy class, baby play class and usual class) For the purposes of this review the empathy class will be considered the intervention group and the baby play and usual class will be combined as the control group. Thus there was 1 cluster in the intervention group and 2 in the control group. The number of classes conducted in each cluster during the 18 months of the study was not stated. 268 couples attending prenatal classes were enrolled (89 in the intervention group and 179 in the control group). Only mothers expected to move out of the general practice area were excluded. |
| Interventions | Intervention group: empathy prenatal classes which included 6 regular classes, 1 additional class focusing on postpartum psychosocial issues and mailouts reinforcing the content of the extra class. Control group: 1) baby play classes which included 6 regular classes, 1 additional class focusing on baby play with no postpartum psychosocial focus and mailouts reinforcing the content of the extra class; 2) usual classes (6 regular sessions only). |
| Outcomes | Outcomes included depression (EPDS, POMS, CES‐D, SCID), social support (Significan Others Scale), self‐esteem, parenting competence and infant care tasks at 6 and 26 weeks postpartum. |
| Notes | The researchers acknowledged the likelihood of contamination if individual couples within 1 prenatal class were randomised but stated 'there is no reason to expect that the within cluster correlation is likely to be different from the between cluster correlation and therefor sample size was not based upon cluster analysis'. No intra‐cluster correlation coefficient was provided. The data presented as adjusted scores and split by level of self‐esteem at baseline. The authors have been contacted for data split by study group only. If such data are available this trial will be included in the review as a cluster trial. |
| Methods | |
| Participants | |
| Interventions | |
| Outcomes | |
| Notes |
| Methods | |
| Participants | |
| Interventions | |
| Outcomes | |
| Notes |
| Methods | |
| Participants | |
| Interventions | |
| Outcomes | |
| Notes |
| Methods | |
| Participants | |
| Interventions | |
| Outcomes | |
| Notes | This reference is an economic analysis. A co‐author on this paper (Peter Cooper) appears to be the principal investigator of the main trial and has been contacted for information. |
| Methods | |
| Participants | |
| Interventions | |
| Outcomes | |
| Notes | This is a trial registration only. It is the same trial as Phipps 2011. |
| Methods | |
| Participants | 106 pregnant adolescent mothers < 18 years of age at first prenatal visit. |
| Interventions | 5 interpersonal psychotherapy sessions delivered during the prenatal period. |
| Outcomes | Clinical diagnosis of depression (KID‐SCID) at 6, 12, and 24 weeks postpartum. |
| Notes | Published abstract. The authors have been contacted for more information. |
| Methods | |
| Participants | |
| Interventions | |
| Outcomes | |
| Notes |
| Methods | |
| Participants | |
| Interventions | |
| Outcomes | |
| Notes |
| Methods | |
| Participants | |
| Interventions | |
| Outcomes | |
| Notes |
| Methods | |
| Participants | |
| Interventions | |
| Outcomes | |
| Notes |
| Methods | |
| Participants | |
| Interventions | |
| Outcomes | |
| Notes |
| Methods | |
| Participants | |
| Interventions | |
| Outcomes | |
| Notes | This is a trial registration only. The contact person Golda Ginsburg states the trial is complete has been asked for additional details. |
| Methods | |
| Participants | |
| Interventions | |
| Outcomes | |
| Notes |
| Methods | |
| Participants | |
| Interventions | |
| Outcomes | |
| Notes |
| Methods | ?RCT Authors state it was a 'prospective randomised controlled trial' and that women were 'divided'. No further details provided. |
| Participants | 3000 pregnant women at high risk for postpartum depression from Vienna Austria. |
| Interventions | Intervention group: offered psychotherapy. No further details provided. |
| Outcomes | Depression (EPDS) at 12 and 26 weeks postpartum. |
| Notes | This reference was a short abstract and no data were included. The author has been contacted for additional information. |
| Methods | |
| Participants | |
| Interventions | |
| Outcomes | |
| Notes |
| Methods | |
| Participants | |
| Interventions | |
| Outcomes | |
| Notes | This is a trial registration. The authors have been contacted for more information. |
BDI: Beck Depression Inventory
CES‐D: Center for Epidemiologic Studies Depression Scale
EPDS: Edinburgh Postnatal Depression Scale
POMS: Profile of Mood States
RCT: randomised controlled trial
SCID: Structured clinical interview for the diagnostic and statistical manual of mental disorders
STAI: State Trait Anxiety Inventory
Characteristics of ongoing studies [ordered by study ID]
| Trial name or title | Online cognitive behavioural therapy (MoodGYM)BDI for the prevention of postnatal depression in at‐risk mothers: a randomised controlled trial. |
| Methods | |
| Participants | 175 English‐speaking women at 1‐5 days postpartum with no clinical diagnosis of depression (as per MINI) but have an EPDS score > 9 (secondary preventative). |
| Interventions | Online cognitive behavioural therapy (MoodGYM) ‐ 5 modules which take between 20‐40 minutes to complete; mothers to complete 1 module per week at their own pace. |
| Outcomes | Clinical diagnosis of depression (MINI) at baseline and 12 months following randomisation; EPDS at baseline, 6, 24, 52 weeks post randomisation. |
| Starting date | Recruitment to start 2012. |
| Contact information | Bethany Jones, Centre for Mental Health Research, The Australian National University Email: [email protected] |
| Notes |
| Trial name or title | A randomised controlled trial of a psychological intervention given in pregnancy to reduce the risk of postnatal depression in a sample of high risk women in India. |
| Methods | |
| Participants | 423 pregnant Indian women identified as high‐risk based on a researcher developed risk score. |
| Interventions | Home‐based 'listening visits' provided from 30 weeks' gestation to 10 weeks postpartum. |
| Outcomes | Postpartum depression at 6, 12, and 24 weeks as measured using the EPDS and a revised clinical interview schedule providing a diagnosis according to ICD‐10 criteria. |
| Starting date | Data collection to end June 2004. |
| Contact information | Dr Anthony Mann, Institute of Psychiatry, De Crespigny Park, Denmark Hill, London, UK, Email: [email protected]. When contacted Dr Mann stated that the trial was completed and Dr Marcus Hughes was in charge of publication. Dr Marcus Hughes, South West London and St George's Mental Health NHS Trust, London, UK |
| Notes | Dr Hughes was contacted for additional information. |
EPDS: Edinburgh Postnatal Depression Scale
ICD: International Classification of Diseases
MINI: Mini International Neuropsychiatric Inrterview
Data and analyses
| Outcome or subgroup title | No. of studies | No. of participants | Statistical method | Effect size |
| 1 Depressive symptomatology at final study assessment Show forest plot | 20 | 14727 | Risk Ratio (M‐H, Random, 95% CI) | 0.78 [0.66, 0.93] |
| Analysis 1.1  Comparison 1 All psychosocial and psychological interventions versus usual care ‐ various study outcomes, Outcome 1 Depressive symptomatology at final study assessment. | ||||
| 2 Mean depression scores at final study assessment Show forest plot | 19 | 12376 | Std. Mean Difference (IV, Random, 95% CI) | ‐0.13 [‐0.28, 0.01] |
| Analysis 1.2  Comparison 1 All psychosocial and psychological interventions versus usual care ‐ various study outcomes, Outcome 2 Mean depression scores at final study assessment. | ||||
| 3 Diagnosis of depression at final study assessment Show forest plot | 5 | 939 | Risk Ratio (M‐H, Random, 95% CI) | 0.50 [0.32, 0.78] |
| Analysis 1.3  Comparison 1 All psychosocial and psychological interventions versus usual care ‐ various study outcomes, Outcome 3 Diagnosis of depression at final study assessment. | ||||
| 4 Depressive symptomatology at 8, 16, 24, and > 24 weeks Show forest plot | 20 | Risk Ratio (M‐H, Random, 95% CI) | Subtotals only | |
| Analysis 1.4  Comparison 1 All psychosocial and psychological interventions versus usual care ‐ various study outcomes, Outcome 4 Depressive symptomatology at 8, 16, 24, and > 24 weeks. | ||||
| 4.1 Immediate outcomes 0‐8 weeks | 13 | 4907 | Risk Ratio (M‐H, Random, 95% CI) | 0.73 [0.56, 0.95] |
| 4.2 Short‐term outcome 9‐16 weeks | 10 | 3982 | Risk Ratio (M‐H, Random, 95% CI) | 0.73 [0.56, 0.97] |
| 4.3 Intermediate outcome 17‐24 weeks | 9 | 10636 | Risk Ratio (M‐H, Random, 95% CI) | 0.93 [0.82, 1.05] |
| 4.4 Long‐term outcome > 24 weeks | 5 | 2936 | Risk Ratio (M‐H, Random, 95% CI) | 0.66 [0.54, 0.82] |
| 5 Mean depression scores at 8, 16, 24, and > 24 weeks Show forest plot | 19 | Std. Mean Difference (IV, Random, 95% CI) | Subtotals only | |
| Analysis 1.5  Comparison 1 All psychosocial and psychological interventions versus usual care ‐ various study outcomes, Outcome 5 Mean depression scores at 8, 16, 24, and > 24 weeks. | ||||
| 5.1 Immediate outcomes: 0‐8 weeks | 6 | 1234 | Std. Mean Difference (IV, Random, 95% CI) | ‐0.16 [‐0.41, 0.09] |
| 5.2 Short‐term outcome 9‐16 weeks | 9 | 3628 | Std. Mean Difference (IV, Random, 95% CI) | ‐0.26 [‐0.72, 0.20] |
| 5.3 Intermediate outcome 17‐24 weeks | 10 | 9944 | Std. Mean Difference (IV, Random, 95% CI) | 0.01 [‐0.03, 0.05] |
| 5.4 Long‐term outcome > 24 weeks | 7 | 2447 | Std. Mean Difference (IV, Random, 95% CI) | ‐0.17 [‐0.58, 0.25] |
| 6 Diagnosis of depression at 8, 16, 24, and > 24 weeks Show forest plot | 5 | Risk Ratio (M‐H, Random, 95% CI) | Subtotals only | |
| Analysis 1.6  Comparison 1 All psychosocial and psychological interventions versus usual care ‐ various study outcomes, Outcome 6 Diagnosis of depression at 8, 16, 24, and > 24 weeks. | ||||
| 6.1 Immediate outcomes 0‐8 weeks | 1 | 39 | Risk Ratio (M‐H, Random, 95% CI) | 0.09 [0.01, 1.47] |
| 6.2 Short‐term outcomes 9‐16 weeks postpartum | 4 | 902 | Risk Ratio (M‐H, Random, 95% CI) | 0.49 [0.31, 0.77] |
| 6.3 Intermediate outcome: 17‐24 weeks | 1 | 37 | Risk Ratio (M‐H, Random, 95% CI) | 0.64 [0.17, 2.46] |
| 7 Maternal mortality at > 24 weeks Show forest plot | 1 | 234 | Risk Ratio (M‐H, Random, 95% CI) | 0.97 [0.06, 15.27] |
| Analysis 1.7  Comparison 1 All psychosocial and psychological interventions versus usual care ‐ various study outcomes, Outcome 7 Maternal mortality at > 24 weeks. | ||||
| 8 Maternal‐infant attachment at 8, 16, and 24 weeks Show forest plot | 1 | Risk Ratio (M‐H, Random, 95% CI) | Subtotals only | |
| Analysis 1.8  Comparison 1 All psychosocial and psychological interventions versus usual care ‐ various study outcomes, Outcome 8 Maternal‐infant attachment at 8, 16, and 24 weeks. | ||||
| 8.1 Immediate outcomes 0‐8 weeks | 1 | 133 | Risk Ratio (M‐H, Random, 95% CI) | 1.01 [0.64, 1.59] |
| 8.2 Short‐term outcome 9‐16 weeks | 1 | 126 | Risk Ratio (M‐H, Random, 95% CI) | 1.29 [0.78, 2.13] |
| 8.3 Intermediate outcome 17‐24 weeks | 1 | 127 | Risk Ratio (M‐H, Random, 95% CI) | 0.89 [0.59, 1.34] |
| 9 Mean maternal‐infant attachment scores at 8, 16, 24, and > 24 weeks Show forest plot | 2 | Std. Mean Difference (IV, Random, 95% CI) | Subtotals only | |
| Analysis 1.9  Comparison 1 All psychosocial and psychological interventions versus usual care ‐ various study outcomes, Outcome 9 Mean maternal‐infant attachment scores at 8, 16, 24, and > 24 weeks. | ||||
| 9.1 Immediate outcomes 0‐8 weeks | 1 | 176 | Std. Mean Difference (IV, Random, 95% CI) | ‐0.11 [‐0.40, 0.19] |
| 9.2 Short‐term outcome 9‐16 weeks | 1 | 160 | Std. Mean Difference (IV, Random, 95% CI) | ‐0.20 [‐0.51, 0.11] |
| 9.3 Intermediate outcome 17‐24 weeks | 1 | 152 | Std. Mean Difference (IV, Random, 95% CI) | ‐0.22 [‐0.54, 0.10] |
| 9.4 Long‐term outcome > 24 weeks | 1 | 116 | Std. Mean Difference (IV, Random, 95% CI) | ‐0.12 [‐0.49, 0.24] |
| 9.5 At final study assessment | 2 | 268 | Std. Mean Difference (IV, Random, 95% CI) | ‐0.18 [‐0.42, 0.06] |
| 10 Anxiety at 8, 16, and 24 weeks Show forest plot | 4 | Risk Ratio (M‐H, Random, 95% CI) | Subtotals only | |
| Analysis 1.10  Comparison 1 All psychosocial and psychological interventions versus usual care ‐ various study outcomes, Outcome 10 Anxiety at 8, 16, and 24 weeks. | ||||
| 10.1 Immediate outcomes 0‐8 weeks | 2 | 245 | Risk Ratio (M‐H, Random, 95% CI) | 0.35 [0.05, 2.34] |
| 10.2 Short‐term outcome 9‐16 weeks | 3 | 843 | Risk Ratio (M‐H, Random, 95% CI) | 0.41 [0.12, 1.41] |
| 10.3 Intermediate outcome 17‐24 weeks | 1 | 130 | Risk Ratio (M‐H, Random, 95% CI) | 0.94 [0.25, 3.60] |
| 10.4 At final study assessment | 4 | 959 | Risk Ratio (M‐H, Random, 95% CI) | 0.40 [0.14, 1.14] |
| 11 Mean anxiety scores at 8, 16, 24, and > 24 weeks Show forest plot | 4 | Std. Mean Difference (IV, Random, 95% CI) | Subtotals only | |
| Analysis 1.11  Comparison 1 All psychosocial and psychological interventions versus usual care ‐ various study outcomes, Outcome 11 Mean anxiety scores at 8, 16, 24, and > 24 weeks. | ||||
| 11.1 Immediate outcomes 0‐8 weeks | 2 | 163 | Std. Mean Difference (IV, Random, 95% CI) | ‐0.09 [‐0.39, 0.22] |
| 11.2 Short‐term outcome 9‐16 weeks | 2 | 740 | Std. Mean Difference (IV, Random, 95% CI) | ‐0.15 [‐0.30, ‐0.01] |
| 11.3 Intermediate outcome 17‐24 weeks | 2 | 160 | Std. Mean Difference (IV, Random, 95% CI) | ‐0.24 [‐0.55, 0.07] |
| 11.4 Long‐term outcome > 24 weeks | 1 | 43 | Std. Mean Difference (IV, Random, 95% CI) | ‐0.17 [‐0.77, 0.43] |
| 11.5 At final study assessment | 4 | 815 | Std. Mean Difference (IV, Random, 95% CI) | ‐0.16 [‐0.30, ‐0.03] |
| 12 Maternal stress at 16 weeks Show forest plot | 1 | Risk Ratio (M‐H, Random, 95% CI) | Subtotals only | |
| Analysis 1.12  Comparison 1 All psychosocial and psychological interventions versus usual care ‐ various study outcomes, Outcome 12 Maternal stress at 16 weeks. | ||||
| 12.1 Short‐term outcome 9‐16 weeks | 1 | 103 | Risk Ratio (M‐H, Random, 95% CI) | 0.44 [0.20, 0.96] |
| 13 Mean maternal stress scores at 24 and > 24 weeks Show forest plot | 1 | Mean Difference (IV, Random, 95% CI) | Subtotals only | |
| Analysis 1.13  Comparison 1 All psychosocial and psychological interventions versus usual care ‐ various study outcomes, Outcome 13 Mean maternal stress scores at 24 and > 24 weeks. | ||||
| 13.1 Intermediate outcome 17‐24 weeks | 1 | 787 | Mean Difference (IV, Random, 95% CI) | 0.0 [‐1.02, 1.02] |
| 13.2 Long‐term outcome > 24 weeks | 1 | 840 | Mean Difference (IV, Random, 95% CI) | 0.5 [‐0.51, 1.51] |
| 14 Mean parental stress scores at 8, 24, and > 24 weeks Show forest plot | 3 | Std. Mean Difference (IV, Random, 95% CI) | Subtotals only | |
| Analysis 1.14  Comparison 1 All psychosocial and psychological interventions versus usual care ‐ various study outcomes, Outcome 14 Mean parental stress scores at 8, 24, and > 24 weeks. | ||||
| 14.1 Immediate outcomes 0‐8 weeks | 1 | 176 | Std. Mean Difference (IV, Random, 95% CI) | ‐0.08 [‐0.37, 0.22] |
| 14.2 Intermediate outcome 17‐24 weeks | 1 | 124 | Std. Mean Difference (IV, Random, 95% CI) | ‐0.27 [‐0.62, 0.09] |
| 14.3 Long‐term outcome > 24 weeks | 2 | 341 | Std. Mean Difference (IV, Random, 95% CI) | 0.27 [0.05, 0.48] |
| 14.4 At final study assessment | 3 | 465 | Std. Mean Difference (IV, Random, 95% CI) | 0.11 [‐0.25, 0.48] |
| 15 Perceived social support at 8 and 16 weeks Show forest plot | 2 | Risk Ratio (M‐H, Random, 95% CI) | Subtotals only | |
| Analysis 1.15  Comparison 1 All psychosocial and psychological interventions versus usual care ‐ various study outcomes, Outcome 15 Perceived social support at 8 and 16 weeks. | ||||
| 15.1 Immediate outcomes 0‐8 weeks | 1 | 528 | Risk Ratio (M‐H, Random, 95% CI) | 0.68 [0.45, 1.05] |
| 15.2 Short‐term outcome 9‐16 weeks | 1 | 190 | Risk Ratio (M‐H, Random, 95% CI) | 1.02 [0.34, 3.05] |
| 15.3 At final study assessment | 2 | 718 | Risk Ratio (M‐H, Random, 95% CI) | 0.72 [0.48, 1.08] |
| 16 Mean perceived social support scores at 8, 16, 24, and > 24 weeks Show forest plot | 7 | Std. Mean Difference (IV, Random, 95% CI) | Subtotals only | |
| Analysis 1.16  Comparison 1 All psychosocial and psychological interventions versus usual care ‐ various study outcomes, Outcome 16 Mean perceived social support scores at 8, 16, 24, and > 24 weeks. | ||||
| 16.1 Immediate outcomes 0‐8 weeks | 3 | 822 | Std. Mean Difference (IV, Random, 95% CI) | 0.02 [‐0.13, 0.17] |
| 16.2 Short‐term outcome 9‐16 weeks | 2 | 863 | Std. Mean Difference (IV, Random, 95% CI) | 0.16 [‐0.21, 0.53] |
| 16.3 Intermediate outcome 17‐24 weeks | 6 | 8122 | Std. Mean Difference (IV, Random, 95% CI) | 0.03 [‐0.06, 0.12] |
| 16.4 Long‐term outcome > 24 weeks | 2 | 955 | Std. Mean Difference (IV, Random, 95% CI) | ‐0.07 [‐0.20, 0.06] |
| 16.5 At final study assessment | 7 | 8290 | Std. Mean Difference (IV, Random, 95% CI) | 0.01 [‐0.08, 0.10] |
| 17 Maternal dissatisfaction with care provided at 8, 16, and 24 weeks Show forest plot | 4 | Risk Ratio (M‐H, Random, 95% CI) | Subtotals only | |
| Analysis 1.17  Comparison 1 All psychosocial and psychological interventions versus usual care ‐ various study outcomes, Outcome 17 Maternal dissatisfaction with care provided at 8, 16, and 24 weeks. | ||||
| 17.1 Immediate outcomes 0‐8 weeks | 2 | 825 | Risk Ratio (M‐H, Random, 95% CI) | 0.56 [0.29, 1.09] |
| 17.2 Short‐term outcome 9‐16 weeks | 1 | 1278 | Risk Ratio (M‐H, Random, 95% CI) | 0.88 [0.65, 1.19] |
| 17.3 Intermediate outcome 17‐24 weeks | 1 | 911 | Risk Ratio (M‐H, Random, 95% CI) | 0.75 [0.44, 1.25] |
| 17.4 At final study assessment | 4 | 3014 | Risk Ratio (M‐H, Random, 95% CI) | 0.67 [0.44, 1.00] |
| 18 Mean maternal dissatisfaction scores at 8 and 16 weeks Show forest plot | 2 | Std. Mean Difference (IV, Random, 95% CI) | Subtotals only | |
| Analysis 1.18  Comparison 1 All psychosocial and psychological interventions versus usual care ‐ various study outcomes, Outcome 18 Mean maternal dissatisfaction scores at 8 and 16 weeks. | ||||
| 18.1 Immediate outcomes 0‐8 weeks | 1 | 516 | Std. Mean Difference (IV, Random, 95% CI) | 0.0 [‐0.17, 0.17] |
| 18.2 Short‐term outcome 9‐16 weeks | 1 | 160 | Std. Mean Difference (IV, Random, 95% CI) | 0.90 [0.58, 1.23] |
| 18.3 At final study assessment | 2 | 676 | Std. Mean Difference (IV, Random, 95% CI) | 0.44 [‐0.44, 1.32] |
| 19 Infant health parameters ‐ not fully immunized at > 24 weeks Show forest plot | 1 | 884 | Risk Ratio (M‐H, Random, 95% CI) | 1.16 [0.39, 3.43] |
| Analysis 1.19  Comparison 1 All psychosocial and psychological interventions versus usual care ‐ various study outcomes, Outcome 19 Infant health parameters ‐ not fully immunized at > 24 weeks. | ||||
| 20 Infant development > 24 weeks Show forest plot | 1 | 280 | Mean Difference (IV, Random, 95% CI) | ‐0.90 [‐2.90, 1.10] |
| Analysis 1.20  Comparison 1 All psychosocial and psychological interventions versus usual care ‐ various study outcomes, Outcome 20 Infant development > 24 weeks. | ||||
| 20.1 Bayley (BSID‐II) | 1 | 280 | Mean Difference (IV, Random, 95% CI) | ‐0.90 [‐2.90, 1.10] |
| 21 Child abuse at 8 and > 24 weeks Show forest plot | 1 | Mean Difference (IV, Random, 95% CI) | Subtotals only | |
| Analysis 1.21  Comparison 1 All psychosocial and psychological interventions versus usual care ‐ various study outcomes, Outcome 21 Child abuse at 8 and > 24 weeks. | ||||
| 21.1 Immediate outcomes 0‐8 weeks | 1 | 176 | Mean Difference (IV, Random, 95% CI) | ‐35.66 [‐62.65, ‐8.67] |
| 21.2 Long‐term outcome > 24 weeks | 1 | 66 | Mean Difference (IV, Random, 95% CI) | ‐41.90 [‐87.48, 3.68] |
| 22 Mean marital discord scores at 8, 16, and 24 weeks Show forest plot | 3 | Std. Mean Difference (IV, Random, 95% CI) | Subtotals only | |
| Analysis 1.22  Comparison 1 All psychosocial and psychological interventions versus usual care ‐ various study outcomes, Outcome 22 Mean marital discord scores at 8, 16, and 24 weeks. | ||||
| 22.1 Immediate outcomes 0‐8 weeks | 2 | 163 | Std. Mean Difference (IV, Random, 95% CI) | ‐0.03 [‐0.34, 0.28] |
| 22.2 Short‐term outcome 9‐16 weeks | 1 | 127 | Std. Mean Difference (IV, Random, 95% CI) | ‐0.28 [‐0.63, 0.07] |
| 22.3 Intermediate outcome 17‐24 weeks | 3 | 291 | Std. Mean Difference (IV, Random, 95% CI) | ‐0.14 [‐0.37, 0.09] |
| 22.4 At final study assessment | 3 | 291 | Std. Mean Difference (IV, Random, 95% CI) | ‐0.14 [‐0.37, 0.09] |
| Outcome or subgroup title | No. of studies | No. of participants | Statistical method | Effect size |
| 1 All psychosocial interventions ‐ depressive symptomatology Show forest plot | 12 | Risk Ratio (M‐H, Random, 95% CI) | Subtotals only | |
| Analysis 2.1  Comparison 2 All psychosocial interventions versus usual care ‐ variations in intervention type, Outcome 1 All psychosocial interventions ‐ depressive symptomatology. | ||||
| 1.1 Immediate outcome ‐ 0‐8 weeks | 6 | 2138 | Risk Ratio (M‐H, Random, 95% CI) | 0.77 [0.52, 1.14] |
| 1.2 Short‐term outcomes 9‐16 weeks | 8 | 3705 | Risk Ratio (M‐H, Random, 95% CI) | 0.80 [0.61, 1.06] |
| 1.3 Intermediate outcomes 17‐24 weeks | 6 | 8116 | Risk Ratio (M‐H, Random, 95% CI) | 0.88 [0.78, 1.00] |
| 1.4 Long‐term outcomes >24 weeks | 3 | 1385 | Risk Ratio (M‐H, Random, 95% CI) | 0.59 [0.46, 0.76] |
| 1.5 At final study assessment | 12 | 11322 | Risk Ratio (M‐H, Random, 95% CI) | 0.83 [0.70, 0.99] |
| 2 All psychosocial interventions ‐ mean depression scores Show forest plot | 12 | Std. Mean Difference (IV, Random, 95% CI) | Subtotals only | |
| Analysis 2.2  Comparison 2 All psychosocial interventions versus usual care ‐ variations in intervention type, Outcome 2 All psychosocial interventions ‐ mean depression scores. | ||||
| 2.1 Immediate outcomes 0‐8 weeks | 3 | 849 | Std. Mean Difference (IV, Random, 95% CI) | ‐0.12 [‐0.47, 0.23] |
| 2.2 Short‐term outcomes 9‐16 weeks | 6 | 3333 | Std. Mean Difference (IV, Random, 95% CI) | ‐0.32 [‐0.90, 0.25] |
| 2.3 Intermediate outcomes 17‐24 weeks | 8 | 8998 | Std. Mean Difference (IV, Random, 95% CI) | 0.00 [‐0.04, 0.05] |
| 2.4 Long‐term outcomes > 24 weeks | 5 | 2254 | Std. Mean Difference (IV, Random, 95% CI) | ‐0.26 [‐0.76, 0.24] |
| 2.5 At final study assessment | 12 | 10944 | Std. Mean Difference (IV, Random, 95% CI) | ‐0.14 [‐0.33, 0.04] |
| 3 All psychosocial interventions ‐ diagnosis of depression Show forest plot | 3 | Risk Ratio (M‐H, Fixed, 95% CI) | Subtotals only | |
| Analysis 2.3  Comparison 2 All psychosocial interventions versus usual care ‐ variations in intervention type, Outcome 3 All psychosocial interventions ‐ diagnosis of depression. | ||||
| 3.1 Short‐term outcomes 9‐16 weeks | 3 | 867 | Risk Ratio (M‐H, Fixed, 95% CI) | 0.52 [0.33, 0.83] |
| 4 All psychosocial interventions: depressive symptomatology at final study assessment Show forest plot | 12 | 11322 | Risk Ratio (M‐H, Random, 95% CI) | 0.83 [0.70, 0.99] |
| Analysis 2.4  Comparison 2 All psychosocial interventions versus usual care ‐ variations in intervention type, Outcome 4 All psychosocial interventions: depressive symptomatology at final study assessment. | ||||
| 5 All psychosocial interventions: mean depression scores Show forest plot | 12 | 10944 | Std. Mean Difference (IV, Random, 95% CI) | ‐0.14 [‐0.33, 0.04] |
| Analysis 2.5  Comparison 2 All psychosocial interventions versus usual care ‐ variations in intervention type, Outcome 5 All psychosocial interventions: mean depression scores. | ||||
| Outcome or subgroup title | No. of studies | No. of participants | Statistical method | Effect size |
| 1 All psychological interventions ‐ depressive symptomatology Show forest plot | 8 | Risk Ratio (M‐H, Random, 95% CI) | Subtotals only | |
| Analysis 3.1  Comparison 3 All psychological interventions versus usual care ‐ variations in intervention type, Outcome 1 All psychological interventions ‐ depressive symptomatology. | ||||
| 1.1 Immediate outcomes 0‐8 weeks | 7 | 2760 | Risk Ratio (M‐H, Random, 95% CI) | 0.69 [0.47, 1.02] |
| 1.2 Short‐term outcomes 9‐16 weeks | 2 | 277 | Risk Ratio (M‐H, Random, 95% CI) | 0.40 [0.18, 0.89] |
| 1.3 Intermediate outcomes 17‐24 weeks | 3 | 2520 | Risk Ratio (M‐H, Random, 95% CI) | 1.04 [0.83, 1.30] |
| 1.4 Long‐term outcomes >24 weeks | 2 | 1551 | Risk Ratio (M‐H, Random, 95% CI) | 0.86 [0.58, 1.28] |
| 1.5 At final study assessment | 8 | 3405 | Risk Ratio (M‐H, Random, 95% CI) | 0.61 [0.39, 0.96] |
| 2 All psychological interventions ‐ mean depression scores Show forest plot | 7 | Std. Mean Difference (IV, Random, 95% CI) | Subtotals only | |
| Analysis 3.2  Comparison 3 All psychological interventions versus usual care ‐ variations in intervention type, Outcome 2 All psychological interventions ‐ mean depression scores. | ||||
| 2.1 immediate outcome 0‐8 weeks | 3 | 385 | Std. Mean Difference (IV, Random, 95% CI) | ‐0.20 [‐0.63, 0.22] |
| 2.2 Short‐term outcomes 9‐16 weeks | 3 | 295 | Std. Mean Difference (IV, Random, 95% CI) | ‐0.03 [‐0.27, 0.21] |
| 2.3 Intermediate outcomes 17‐24 weeks | 2 | 946 | Std. Mean Difference (IV, Random, 95% CI) | 0.08 [‐0.05, 0.20] |
| 2.4 Long‐term outcomes > 24 weeks | 2 | 193 | Std. Mean Difference (IV, Random, 95% CI) | 0.11 [‐0.17, 0.39] |
| 2.5 At final study assessment | 7 | 1432 | Std. Mean Difference (IV, Random, 95% CI) | ‐0.10 [‐0.32, 0.13] |
| 3 All psychological interventions ‐ diagnosis of depression Show forest plot | 2 | Risk Ratio (M‐H, Random, 95% CI) | Subtotals only | |
| Analysis 3.3  Comparison 3 All psychological interventions versus usual care ‐ variations in intervention type, Outcome 3 All psychological interventions ‐ diagnosis of depression. | ||||
| 3.1 Diagnosis of depression ‐ 0‐8 weeks | 1 | 39 | Risk Ratio (M‐H, Random, 95% CI) | 0.09 [0.01, 1.47] |
| 3.2 Short‐term outcomes 9‐16 weeks | 1 | 35 | Risk Ratio (M‐H, Random, 95% CI) | 0.08 [0.00, 1.34] |
| 3.3 Intermediate outcomes 17‐24 weeks | 1 | 37 | Risk Ratio (M‐H, Random, 95% CI) | 0.64 [0.17, 2.46] |
| 3.4 At final study assessment | 2 | 72 | Risk Ratio (M‐H, Random, 95% CI) | 0.31 [0.04, 2.52] |
| Outcome or subgroup title | No. of studies | No. of participants | Statistical method | Effect size |
| 1 TEST FOR SUBGROUP DIFFERENCES: depressive symptomatology at final study assessment Show forest plot | 12 | 11322 | Risk Ratio (M‐H, Random, 95% CI) | 0.83 [0.70, 0.99] |
| Analysis 4.1  Comparison 4 Subgroup analysis: variations in psychosocial interventions, Outcome 1 TEST FOR SUBGROUP DIFFERENCES: depressive symptomatology at final study assessment. | ||||
| 1.1 Antenatal and postnatal classes | 4 | 1488 | Risk Ratio (M‐H, Random, 95% CI) | 1.01 [0.77, 1.32] |
| 1.2 Postpartum professional‐based home visits | 2 | 1262 | Risk Ratio (M‐H, Random, 95% CI) | 0.56 [0.43, 0.73] |
| 1.3 Postpartum lay‐based home visits | 1 | 493 | Risk Ratio (M‐H, Random, 95% CI) | 0.88 [0.62, 1.25] |
| 1.4 Postpartum lay‐based telephone support | 1 | 612 | Risk Ratio (M‐H, Random, 95% CI) | 0.54 [0.38, 0.77] |
| 1.5 Early postpartum follow‐up | 1 | 446 | Risk Ratio (M‐H, Random, 95% CI) | 0.90 [0.55, 1.49] |
| 1.6 Continuity model of care | 3 | 7021 | Risk Ratio (M‐H, Random, 95% CI) | 0.99 [0.71, 1.36] |
| 2 TEST FOR SUBGROUP DIFFERENCES: mean depression score at final study assessment Show forest plot | 4 | 1411 | Std. Mean Difference (IV, Fixed, 95% CI) | ‐0.01 [‐0.12, 0.10] |
| Analysis 4.2  Comparison 4 Subgroup analysis: variations in psychosocial interventions, Outcome 2 TEST FOR SUBGROUP DIFFERENCES: mean depression score at final study assessment. | ||||
| 2.1 Antenatal and postnatal classes | 3 | 1124 | Std. Mean Difference (IV, Fixed, 95% CI) | 0.01 [‐0.11, 0.13] |
| 2.2 Antenatal and postnatal lay‐based home visits and telephone support | 1 | 287 | Std. Mean Difference (IV, Fixed, 95% CI) | ‐0.10 [‐0.33, 0.14] |
| Outcome or subgroup title | No. of studies | No. of participants | Statistical method | Effect size |
| 1 TEST FOR SUBGROUP DIFFERENCES: depressive symptomatology at final study assessment Show forest plot | 6 | 3200 | Risk Ratio (M‐H, Random, 95% CI) | 0.59 [0.35, 1.01] |
| Analysis 5.1  Comparison 5 Subgroup analysis: variations in psychological interventions, Outcome 1 TEST FOR SUBGROUP DIFFERENCES: depressive symptomatology at final study assessment. | ||||
| 1.1 Psychological debriefing | 5 | 3050 | Risk Ratio (M‐H, Random, 95% CI) | 0.57 [0.31, 1.03] |
| 1.2 Cognitive behavioural therapy | 1 | 150 | Risk Ratio (M‐H, Random, 95% CI) | 0.74 [0.29, 1.88] |
| 2 TEST FOR SUBGROUP DIFFERENCES: mean depression score at final study assessment Show forest plot | 6 | 516 | Std. Mean Difference (IV, Random, 95% CI) | ‐0.16 [‐0.43, 0.11] |
| Analysis 5.2  Comparison 5 Subgroup analysis: variations in psychological interventions, Outcome 2 TEST FOR SUBGROUP DIFFERENCES: mean depression score at final study assessment. | ||||
| 2.1 Interpersonal psychotherapy | 5 | 366 | Std. Mean Difference (IV, Random, 95% CI) | ‐0.27 [‐0.52, ‐0.01] |
| 2.2 Cognitive behavioural therapy | 1 | 150 | Std. Mean Difference (IV, Random, 95% CI) | 0.13 [‐0.20, 0.45] |
| Outcome or subgroup title | No. of studies | No. of participants | Statistical method | Effect size |
| 1 Professionally‐based interventions ‐ depressive symptomatology Show forest plot | 15 | Risk Ratio (M‐H, Random, 95% CI) | Subtotals only | |
| Analysis 6.1  Comparison 6 Subgroup analysis: variations in intervention provider, Outcome 1 Professionally‐based interventions ‐ depressive symptomatology. | ||||
| 1.1 Immediate outcomes 0‐8 weeks | 10 | 3699 | Risk Ratio (M‐H, Random, 95% CI) | 0.65 [0.45, 0.93] |
| 1.2 Short‐term outcome 9‐16 weeks | 8 | 3196 | Risk Ratio (M‐H, Random, 95% CI) | 0.79 [0.57, 1.09] |
| 1.3 Intermediate outcome 17‐24 weeks | 7 | 3929 | Risk Ratio (M‐H, Random, 95% CI) | 1.03 [0.87, 1.23] |
| 1.4 Long‐term outcome > 24 weeks | 4 | 2786 | Risk Ratio (M‐H, Random, 95% CI) | 0.68 [0.51, 0.90] |
| 2 Professionally‐based interventions ‐ mean depression scores Show forest plot | 12 | Std. Mean Difference (IV, Random, 95% CI) | Subtotals only | |
| Analysis 6.2  Comparison 6 Subgroup analysis: variations in intervention provider, Outcome 2 Professionally‐based interventions ‐ mean depression scores. | ||||
| 2.1 Immediate outcomes: 0‐8 weeks | 4 | 512 | Std. Mean Difference (IV, Random, 95% CI) | ‐0.34 [‐0.56, ‐0.12] |
| 2.2 Short‐term outcome 9‐16 weeks | 6 | 2807 | Std. Mean Difference (IV, Random, 95% CI) | ‐0.31 [‐0.95, 0.34] |
| 2.3 Intermediate outcome 17‐24 weeks | 7 | 3161 | Std. Mean Difference (IV, Random, 95% CI) | 0.02 [‐0.05, 0.09] |
| 2.4 Long‐term outcome >24 weeks | 5 | 2010 | Std. Mean Difference (IV, Random, 95% CI) | ‐0.24 [‐0.79, 0.31] |
| 3 Professionally‐based interventions ‐ diagnosis of depression Show forest plot | 2 | Risk Ratio (M‐H, Fixed, 95% CI) | Subtotals only | |
| Analysis 6.3  Comparison 6 Subgroup analysis: variations in intervention provider, Outcome 3 Professionally‐based interventions ‐ diagnosis of depression. | ||||
| 3.1 Immediate outcomes 0‐8 weeks | 1 | 39 | Risk Ratio (M‐H, Fixed, 95% CI) | 0.09 [0.01, 1.47] |
| 3.2 Short‐term outcomes 9‐16 weeks postpartum | 1 | 190 | Risk Ratio (M‐H, Fixed, 95% CI) | 0.51 [0.13, 1.98] |
| 3.3 Intermediate outcome: 17‐24 weeks | 1 | 37 | Risk Ratio (M‐H, Fixed, 95% CI) | 0.64 [0.17, 2.46] |
| 4 Lay‐based interventions ‐ depressive symptomatology Show forest plot | 4 | Risk Ratio (M‐H, Fixed, 95% CI) | Subtotals only | |
| Analysis 6.4  Comparison 6 Subgroup analysis: variations in intervention provider, Outcome 4 Lay‐based interventions ‐ depressive symptomatology. | ||||
| 4.1 Immediate outcomes 0‐8 weeks | 3 | 1208 | Risk Ratio (M‐H, Fixed, 95% CI) | 0.91 [0.70, 1.18] |
| 4.2 Short‐term outcome 9‐16 weeks | 2 | 786 | Risk Ratio (M‐H, Fixed, 95% CI) | 0.55 [0.40, 0.75] |
| 4.3 Intermediate outcome 17‐24 weeks | 1 | 493 | Risk Ratio (M‐H, Fixed, 95% CI) | 0.88 [0.62, 1.25] |
| 4.4 Long‐term outcome > 24 weeks | 1 | 150 | Risk Ratio (M‐H, Fixed, 95% CI) | 0.74 [0.29, 1.88] |
| 5 Lay‐based interventions ‐ mean depression scores Show forest plot | 5 | Std. Mean Difference (IV, Random, 95% CI) | Subtotals only | |
| Analysis 6.5  Comparison 6 Subgroup analysis: variations in intervention provider, Outcome 5 Lay‐based interventions ‐ mean depression scores. | ||||
| 5.1 Immediate outcomes: 0‐8 weeks | 2 | 722 | Std. Mean Difference (IV, Random, 95% CI) | 0.11 [‐0.04, 0.25] |
| 5.2 Short‐term outcome 9‐16 weeks | 2 | 786 | Std. Mean Difference (IV, Random, 95% CI) | ‐0.08 [‐0.35, 0.19] |
| 5.3 Intermediate outcome 17‐24 weeks | 2 | 633 | Std. Mean Difference (IV, Random, 95% CI) | ‐0.06 [‐0.22, 0.09] |
| 5.4 Long‐term outcome > 24 weeks | 2 | 437 | Std. Mean Difference (IV, Random, 95% CI) | ‐0.01 [‐0.22, 0.20] |
| 6 Lay‐based interventions ‐ diagnosis of depression Show forest plot | 2 | Risk Ratio (M‐H, Fixed, 95% CI) | Subtotals only | |
| Analysis 6.6  Comparison 6 Subgroup analysis: variations in intervention provider, Outcome 6 Lay‐based interventions ‐ diagnosis of depression. | ||||
| 6.1 Short‐term outcomes 9‐16 weeks postpartum | 2 | 677 | Risk Ratio (M‐H, Fixed, 95% CI) | 0.52 [0.32, 0.86] |
| 7 TEST FOR SUBGROUP DIFFERENCES: depressive symptomatology: at final study assessment Show forest plot | 19 | Risk Ratio (M‐H, Random, 95% CI) | Subtotals only | |
| Analysis 6.7  Comparison 6 Subgroup analysis: variations in intervention provider, Outcome 7 TEST FOR SUBGROUP DIFFERENCES: depressive symptomatology: at final study assessment. | ||||
| 7.1 Professionally‐based interventions | 15 | 6790 | Risk Ratio (M‐H, Random, 95% CI) | 0.78 [0.60, 1.00] |
| 7.2 Lay‐based interventions | 4 | 1723 | Risk Ratio (M‐H, Random, 95% CI) | 0.70 [0.54, 0.90] |
| 8 TEST FOR SUBGROUP DIFFERENCES: mean depression scores: at final study assessment Show forest plot | 17 | Std. Mean Difference (IV, Random, 95% CI) | Subtotals only | |
| Analysis 6.8  Comparison 6 Subgroup analysis: variations in intervention provider, Outcome 8 TEST FOR SUBGROUP DIFFERENCES: mean depression scores: at final study assessment. | ||||
| 8.1 Professionally‐based interventions | 12 | 4509 | Std. Mean Difference (IV, Random, 95% CI) | ‐0.15 [‐0.40, 0.10] |
| 8.2 Lay‐based interventions | 5 | 1682 | Std. Mean Difference (IV, Random, 95% CI) | ‐0.10 [‐0.20, 0.01] |
| 9 TEST FOR SUBGROUP DIFFERENCES: diagnosis of depression: at final study assessment Show forest plot | 4 | Risk Ratio (M‐H, Fixed, 95% CI) | Subtotals only | |
| Analysis 6.9  Comparison 6 Subgroup analysis: variations in intervention provider, Outcome 9 TEST FOR SUBGROUP DIFFERENCES: diagnosis of depression: at final study assessment. | ||||
| 9.1 Professionally‐based interventions | 2 | 227 | Risk Ratio (M‐H, Fixed, 95% CI) | 0.56 [0.22, 1.47] |
| 9.2 Lay‐based interventions | 2 | 677 | Risk Ratio (M‐H, Fixed, 95% CI) | 0.52 [0.32, 0.86] |
| Outcome or subgroup title | No. of studies | No. of participants | Statistical method | Effect size |
| 1 TEST FOR SUBGROUP DIFFERENCES: depressive symptomatology at final study assessment Show forest plot | 15 | Risk Ratio (M‐H, Random, 95% CI) | Subtotals only | |
| Analysis 7.1  Comparison 7 Subgroup analysis: variations in professionally‐based intervention provider, Outcome 1 TEST FOR SUBGROUP DIFFERENCES: depressive symptomatology at final study assessment. | ||||
| 1.1 Intervention provided by nurses | 3 | 837 | Risk Ratio (M‐H, Random, 95% CI) | 0.73 [0.51, 1.04] |
| 1.2 Intervention provided by physicians | 1 | 446 | Risk Ratio (M‐H, Random, 95% CI) | 0.90 [0.55, 1.49] |
| 1.3 Intervention provided by midwives | 10 | 5477 | Risk Ratio (M‐H, Random, 95% CI) | 0.76 [0.54, 1.07] |
| 1.4 Intervention provided by mental health specialists | 1 | 30 | Risk Ratio (M‐H, Random, 95% CI) | 1.0 [0.24, 4.18] |
| 2 TEST FOR SUBGROUP DIFFERENCES: mean depression score at final study assessment Show forest plot | 4 | Std. Mean Difference (IV, Fixed, 95% CI) | Subtotals only | |
| Analysis 7.2  Comparison 7 Subgroup analysis: variations in professionally‐based intervention provider, Outcome 2 TEST FOR SUBGROUP DIFFERENCES: mean depression score at final study assessment. | ||||
| 2.1 Intervention provided by nurses | 1 | 86 | Std. Mean Difference (IV, Fixed, 95% CI) | ‐0.08 [‐0.51, 0.34] |
| 2.2 Intervention provided by midwives | 1 | 840 | Std. Mean Difference (IV, Fixed, 95% CI) | 0.05 [‐0.09, 0.19] |
| 2.3 Intervention provided by mental health specialists | 2 | 175 | Std. Mean Difference (IV, Fixed, 95% CI) | 0.04 [‐0.26, 0.34] |
| Outcome or subgroup title | No. of studies | No. of participants | Statistical method | Effect size |
| 1 Individually‐based interventions ‐ depressive symptomatology Show forest plot | 14 | Risk Ratio (M‐H, Random, 95% CI) | Subtotals only | |
| Analysis 8.1  Comparison 8 Subgroup analysis: variations in intervention mode, Outcome 1 Individually‐based interventions ‐ depressive symptomatology. | ||||
| 1.1 Immediate outcomes 0‐8 weeks | 9 | 3947 | Risk Ratio (M‐H, Random, 95% CI) | 0.70 [0.49, 1.00] |
| 1.2 Short‐term outcomes 9‐16 weeks | 6 | 2757 | Risk Ratio (M‐H, Random, 95% CI) | 0.66 [0.47, 0.91] |
| 1.3 Intermediate outcomes 17‐24 weeks | 7 | 9806 | Risk Ratio (M‐H, Random, 95% CI) | 0.88 [0.80, 0.98] |
| 1.4 Long‐term outcomes > 24 weeks | 4 | 2786 | Risk Ratio (M‐H, Random, 95% CI) | 0.68 [0.51, 0.90] |
| 2 Individually‐based interventions ‐ mean depression scores Show forest plot | 11 | Std. Mean Difference (IV, Random, 95% CI) | Subtotals only | |
| Analysis 8.2  Comparison 8 Subgroup analysis: variations in intervention mode, Outcome 2 Individually‐based interventions ‐ mean depression scores. | ||||
| 2.1 Immediate outcomes 0‐8 weeks | 4 | 882 | Std. Mean Difference (IV, Random, 95% CI) | ‐0.11 [‐0.41, 0.19] |
| 2.2 Short‐term outcomes 9‐16 weeks | 5 | 2601 | Std. Mean Difference (IV, Random, 95% CI) | ‐0.40 [‐1.07, 0.26] |
| 2.3 Intermediate outcomes 17‐24 weeks | 6 | 8156 | Std. Mean Difference (IV, Random, 95% CI) | 0.01 [‐0.03, 0.05] |
| 2.4 Long‐term outcomes > 24 weeks | 5 | 1457 | Std. Mean Difference (IV, Random, 95% CI) | ‐0.28 [‐0.78, 0.23] |
| 3 Individually‐based interventions ‐ diagnosis of depression Show forest plot | 3 | Risk Ratio (M‐H, Fixed, 95% CI) | Subtotals only | |
| Analysis 8.3  Comparison 8 Subgroup analysis: variations in intervention mode, Outcome 3 Individually‐based interventions ‐ diagnosis of depression. | ||||
| 3.1 Immediate outcomes 0‐8 weeks | 1 | 39 | Risk Ratio (M‐H, Fixed, 95% CI) | 0.09 [0.01, 1.47] |
| 3.2 Short‐term outcomes 9‐16 weeks | 2 | 677 | Risk Ratio (M‐H, Fixed, 95% CI) | 0.52 [0.32, 0.86] |
| 3.3 Intermediate outcomes 17‐24 weeks | 1 | 37 | Risk Ratio (M‐H, Fixed, 95% CI) | 0.64 [0.17, 2.46] |
| 4 Group‐based interventions ‐ depressive symptomatology Show forest plot | 6 | Risk Ratio (M‐H, Random, 95% CI) | Subtotals only | |
| Analysis 8.4  Comparison 8 Subgroup analysis: variations in intervention mode, Outcome 4 Group‐based interventions ‐ depressive symptomatology. | ||||
| 4.1 Immediate outcomes 0‐8 weeks | 4 | 946 | Risk Ratio (M‐H, Random, 95% CI) | 0.64 [0.45, 0.91] |
| 4.2 Short‐term outcomes 9‐16 weeks | 4 | 1225 | Risk Ratio (M‐H, Random, 95% CI) | 0.91 [0.60, 1.39] |
| 4.3 Intermediate outcomes 17‐24 weeks | 2 | 830 | Risk Ratio (M‐H, Random, 95% CI) | 1.20 [0.85, 1.71] |
| 4.4 Long‐term outcomes > 24 weeks | 1 | 150 | Risk Ratio (M‐H, Random, 95% CI) | 0.74 [0.29, 1.88] |
| 5 Group‐based interventions ‐ mean depression scores Show forest plot | 8 | Std. Mean Difference (IV, Random, 95% CI) | Subtotals only | |
| Analysis 8.5  Comparison 8 Subgroup analysis: variations in intervention mode, Outcome 5 Group‐based interventions ‐ mean depression scores. | ||||
| 5.1 Immediate outcomes 0‐8 weeks | 2 | 352 | Std. Mean Difference (IV, Random, 95% CI) | ‐0.24 [‐0.80, 0.31] |
| 5.2 Short‐term outcomes 9‐16 weeks | 4 | 1027 | Std. Mean Difference (IV, Random, 95% CI) | 0.04 [‐0.09, 0.16] |
| 5.3 Intermediate outcomes 17‐24 weeks | 4 | 1788 | Std. Mean Difference (IV, Random, 95% CI) | 0.01 [‐0.08, 0.11] |
| 5.4 Long‐term outcomes > 24 weeks | 2 | 990 | Std. Mean Difference (IV, Random, 95% CI) | 0.06 [‐0.07, 0.19] |
| 6 Group‐based interventions ‐ diagnosis of depression Show forest plot | 2 | Risk Ratio (M‐H, Random, 95% CI) | Subtotals only | |
| Analysis 8.6  Comparison 8 Subgroup analysis: variations in intervention mode, Outcome 6 Group‐based interventions ‐ diagnosis of depression. | ||||
| 6.1 Short‐term outcomes 9‐16 weeks | 2 | 225 | Risk Ratio (M‐H, Random, 95% CI) | 0.30 [0.05, 1.66] |
| 7 TEST FOR SUBGROUP DIFFERENCES: depressive symptomatology: at final study assessment Show forest plot | 20 | 14727 | Risk Ratio (M‐H, Random, 95% CI) | 0.78 [0.66, 0.93] |
| Analysis 8.7  Comparison 8 Subgroup analysis: variations in intervention mode, Outcome 7 TEST FOR SUBGROUP DIFFERENCES: depressive symptomatology: at final study assessment. | ||||
| 7.1 Individually‐based interventions | 14 | 12914 | Risk Ratio (M‐H, Random, 95% CI) | 0.75 [0.61, 0.92] |
| 7.2 Group‐based interventions | 6 | 1813 | Risk Ratio (M‐H, Random, 95% CI) | 0.92 [0.71, 1.19] |
| 8 TEST FOR SUBGROUP DIFFERENCES: mean depression scores: at final study assessment Show forest plot | 19 | 12376 | Std. Mean Difference (IV, Random, 95% CI) | ‐0.13 [‐0.28, 0.01] |
| Analysis 8.8  Comparison 8 Subgroup analysis: variations in intervention mode, Outcome 8 TEST FOR SUBGROUP DIFFERENCES: mean depression scores: at final study assessment. | ||||
| 8.1 Individually‐based interventions | 11 | 10092 | Std. Mean Difference (IV, Random, 95% CI) | ‐0.15 [‐0.37, 0.07] |
| 8.2 Group‐based interventions | 8 | 2284 | Std. Mean Difference (IV, Random, 95% CI) | ‐0.08 [‐0.23, 0.06] |
| 9 TEST FOR SUBGROUP DIFFERENCES: diagnosis of depression: at final study assessment Show forest plot | 5 | 939 | Risk Ratio (M‐H, Random, 95% CI) | 0.50 [0.32, 0.78] |
| Analysis 8.9  Comparison 8 Subgroup analysis: variations in intervention mode, Outcome 9 TEST FOR SUBGROUP DIFFERENCES: diagnosis of depression: at final study assessment. | ||||
| 9.1 Individually‐based interventions | 3 | 714 | Risk Ratio (M‐H, Random, 95% CI) | 0.53 [0.33, 0.84] |
| 9.2 Group‐based interventions | 2 | 225 | Risk Ratio (M‐H, Random, 95% CI) | 0.30 [0.05, 1.66] |
| Outcome or subgroup title | No. of studies | No. of participants | Statistical method | Effect size |
| 1 Single‐contact interventions ‐ depressive symptomatology Show forest plot | 4 | Risk Ratio (M‐H, Random, 95% CI) | Subtotals only | |
| Analysis 9.1  Comparison 9 Subgroup analysis: variations in intervention duration, Outcome 1 Single‐contact interventions ‐ depressive symptomatology. | ||||
| 1.1 Immediate outcomes 0‐8 weeks | 2 | 1756 | Risk Ratio (M‐H, Random, 95% CI) | 0.39 [0.07, 2.16] |
| 1.2 Short‐term outcomes 9‐16 weeks | 1 | 476 | Risk Ratio (M‐H, Random, 95% CI) | 1.24 [0.81, 1.91] |
| 1.3 Intermediate outcomes 17‐24 weeks | 3 | 2936 | Risk Ratio (M‐H, Random, 95% CI) | 1.01 [0.82, 1.26] |
| 1.4 Long‐term outcomes > 24 weeks | 1 | 1401 | Risk Ratio (M‐H, Random, 95% CI) | 0.89 [0.58, 1.37] |
| 2 Single‐contact interventions ‐ mean depression scores Show forest plot | 2 | Mean Difference (IV, Fixed, 95% CI) | Subtotals only | |
| Analysis 9.2  Comparison 9 Subgroup analysis: variations in intervention duration, Outcome 2 Single‐contact interventions ‐ mean depression scores. | ||||
| 2.1 Short‐term outcomes 9‐16 weeks | 1 | 476 | Mean Difference (IV, Fixed, 95% CI) | ‐0.10 [‐1.06, 0.86] |
| 2.2 Intermediate outcomes 17‐24 weeks | 2 | 1362 | Mean Difference (IV, Fixed, 95% CI) | 0.21 [‐0.37, 0.79] |
| 3 Multiple‐contact interventions ‐ depressive symptomatology Show forest plot | 16 | Risk Ratio (M‐H, Random, 95% CI) | Subtotals only | |
| Analysis 9.3  Comparison 9 Subgroup analysis: variations in intervention duration, Outcome 3 Multiple‐contact interventions ‐ depressive symptomatology. | ||||
| 3.1 Immediate outcomes 0‐8 weeks | 11 | 3137 | Risk Ratio (M‐H, Random, 95% CI) | 0.77 [0.60, 0.99] |
| 3.2 Short‐term outcomes 9‐16 weeks | 9 | 3506 | Risk Ratio (M‐H, Random, 95% CI) | 0.69 [0.52, 0.91] |
| 3.3 Intermediate outcomes 17‐24 weeks | 6 | 7700 | Risk Ratio (M‐H, Random, 95% CI) | 0.89 [0.77, 1.01] |
| 3.4 Long‐term outcomes > 24 weeks | 4 | 1535 | Risk Ratio (M‐H, Random, 95% CI) | 0.60 [0.47, 0.76] |
| 4 Multiple‐contact interventions ‐ mean depression scores Show forest plot | 17 | Std. Mean Difference (IV, Random, 95% CI) | Subtotals only | |
| Analysis 9.4  Comparison 9 Subgroup analysis: variations in intervention duration, Outcome 4 Multiple‐contact interventions ‐ mean depression scores. | ||||
| 4.1 Immediate outcomes 0‐8 weeks | 6 | 1234 | Std. Mean Difference (IV, Random, 95% CI) | ‐0.16 [‐0.41, 0.09] |
| 4.2 Short‐term outcomes 9‐16 weeks | 8 | 3152 | Std. Mean Difference (IV, Random, 95% CI) | ‐0.30 [‐0.81, 0.22] |
| 4.3 Intermediate outcomes 17‐24 weeks | 8 | 8582 | Std. Mean Difference (IV, Random, 95% CI) | 0.01 [‐0.04, 0.05] |
| 4.4 Long‐term outcomes > 24 weeks | 7 | 2447 | Std. Mean Difference (IV, Random, 95% CI) | ‐0.17 [‐0.58, 0.25] |
| 5 Multiple‐contact interventions ‐ diagnosis of depression Show forest plot | 5 | Risk Ratio (M‐H, Fixed, 95% CI) | Subtotals only | |
| Analysis 9.5  Comparison 9 Subgroup analysis: variations in intervention duration, Outcome 5 Multiple‐contact interventions ‐ diagnosis of depression. | ||||
| 5.1 Immediate outcomes 0‐8 weeks | 1 | 39 | Risk Ratio (M‐H, Fixed, 95% CI) | 0.09 [0.01, 1.47] |
| 5.2 Short‐term outcomes 9‐16 weeks | 4 | 902 | Risk Ratio (M‐H, Fixed, 95% CI) | 0.47 [0.30, 0.74] |
| 5.3 Intermediate outcomes 17‐24 weeks | 1 | 37 | Risk Ratio (M‐H, Fixed, 95% CI) | 0.64 [0.17, 2.46] |
| 5.4 At final study assessment | 5 | 939 | Risk Ratio (M‐H, Fixed, 95% CI) | 0.48 [0.31, 0.74] |
| 6 TEST FOR SUBGROUP DIFFERENCES: depressive symptomatology: at final study assessment Show forest plot | 20 | 14727 | Risk Ratio (M‐H, Random, 95% CI) | 0.78 [0.66, 0.93] |
| Analysis 9.6  Comparison 9 Subgroup analysis: variations in intervention duration, Outcome 6 TEST FOR SUBGROUP DIFFERENCES: depressive symptomatology: at final study assessment. | ||||
| 6.1 Single contact intervention | 4 | 2877 | Risk Ratio (M‐H, Random, 95% CI) | 0.70 [0.38, 1.28] |
| 6.2 Multiple contact intervention | 16 | 11850 | Risk Ratio (M‐H, Random, 95% CI) | 0.78 [0.66, 0.93] |
| 7 TEST FOR SUBGROUP DIFFERENCES: mean depression scores: at final study assessment Show forest plot | 19 | 12376 | Std. Mean Difference (IV, Random, 95% CI) | ‐0.13 [‐0.28, 0.01] |
| Analysis 9.7  Comparison 9 Subgroup analysis: variations in intervention duration, Outcome 7 TEST FOR SUBGROUP DIFFERENCES: mean depression scores: at final study assessment. | ||||
| 7.1 Single contact intervention | 2 | 1362 | Std. Mean Difference (IV, Random, 95% CI) | 0.04 [‐0.07, 0.15] |
| 7.2 Multiple contact intervention | 17 | 11014 | Std. Mean Difference (IV, Random, 95% CI) | ‐0.15 [‐0.32, 0.02] |
| Outcome or subgroup title | No. of studies | No. of participants | Statistical method | Effect size |
| 1 Interventions with antenatal only component ‐ mean depression scores Show forest plot | 4 | Std. Mean Difference (IV, Fixed, 95% CI) | Subtotals only | |
| Analysis 10.1  Comparison 10 Subgroup analysis: variations in intervention onset, Outcome 1 Interventions with antenatal only component ‐ mean depression scores. | ||||
| 1.1 Short‐term outcomes 9‐16 weeks | 1 | 35 | Std. Mean Difference (IV, Fixed, 95% CI) | ‐0.44 [‐1.11, 0.23] |
| 1.2 Intermediate outcomes 17‐24 weeks | 2 | 919 | Std. Mean Difference (IV, Fixed, 95% CI) | 0.06 [‐0.07, 0.19] |
| 1.3 Long‐term outcomes > 24 weeks | 2 | 883 | Std. Mean Difference (IV, Fixed, 95% CI) | 0.05 [‐0.09, 0.19] |
| 2 Interventions with antenatal only component ‐ diagnosis of depression Show forest plot | 1 | Risk Ratio (M‐H, Fixed, 95% CI) | Subtotals only | |
| Analysis 10.2  Comparison 10 Subgroup analysis: variations in intervention onset, Outcome 2 Interventions with antenatal only component ‐ diagnosis of depression. | ||||
| 2.1 Short‐term outcomes 9‐16 weeks | 1 | 35 | Risk Ratio (M‐H, Fixed, 95% CI) | 0.08 [0.00, 1.34] |
| 3 Interventions with antenatal and postnatal components ‐ depressive symptomatology Show forest plot | 8 | Risk Ratio (M‐H, Random, 95% CI) | Subtotals only | |
| Analysis 10.3  Comparison 10 Subgroup analysis: variations in intervention onset, Outcome 3 Interventions with antenatal and postnatal components ‐ depressive symptomatology. | ||||
| 3.1 Immediate outcomes 0‐8 weeks | 7 | 1794 | Risk Ratio (M‐H, Random, 95% CI) | 0.75 [0.52, 1.08] |
| 3.2 Short‐term outcomes 9‐16 weeks | 4 | 621 | Risk Ratio (M‐H, Random, 95% CI) | 0.66 [0.45, 0.97] |
| 3.3 Intermediate outcomes 17‐24 weeks | 3 | 284 | Risk Ratio (M‐H, Random, 95% CI) | 0.87 [0.41, 1.85] |
| 3.4 Long‐term outcomes > 24 weeks | 2 | 273 | Risk Ratio (M‐H, Random, 95% CI) | 0.82 [0.46, 1.46] |
| 4 Interventions with antenatal and postnatal components ‐ mean depression scores Show forest plot | 7 | Std. Mean Difference (IV, Random, 95% CI) | Subtotals only | |
| Analysis 10.4  Comparison 10 Subgroup analysis: variations in intervention onset, Outcome 4 Interventions with antenatal and postnatal components ‐ mean depression scores. | ||||
| 4.1 Immediate outcomes 0‐8 weeks | 4 | 518 | Std. Mean Difference (IV, Random, 95% CI) | ‐0.18 [‐0.47, 0.11] |
| 4.2 Short‐term outcomes 9‐16 weeks | 3 | 388 | Std. Mean Difference (IV, Random, 95% CI) | ‐0.05 [‐0.25, 0.15] |
| 4.3 Intermediate outcomes 17‐24 weeks | 3 | 315 | Std. Mean Difference (IV, Random, 95% CI) | ‐0.22 [‐0.45, ‐0.00] |
| 4.4 Long‐term outcomes > 24 weeks | 3 | 560 | Std. Mean Difference (IV, Random, 95% CI) | ‐0.03 [‐0.20, 0.13] |
| 5 Interventions with antenatal and postnatal components ‐ diagnosis of depression Show forest plot | 3 | Risk Ratio (M‐H, Fixed, 95% CI) | Subtotals only | |
| Analysis 10.5  Comparison 10 Subgroup analysis: variations in intervention onset, Outcome 5 Interventions with antenatal and postnatal components ‐ diagnosis of depression. | ||||
| 5.1 Immediate outcomes 0‐8 weeks | 1 | 39 | Risk Ratio (M‐H, Fixed, 95% CI) | 0.09 [0.01, 1.47] |
| 5.2 Short‐term outcomes 9‐16 weeks | 2 | 255 | Risk Ratio (M‐H, Fixed, 95% CI) | 0.40 [0.21, 0.79] |
| 5.3 Intermediate outcomes 17‐24 weeks | 1 | 37 | Risk Ratio (M‐H, Fixed, 95% CI) | 0.64 [0.17, 2.46] |
| 6 Interventions with postnatal only component ‐ depressive symptomatology Show forest plot | 12 | Risk Ratio (M‐H, Random, 95% CI) | Subtotals only | |
| Analysis 10.6  Comparison 10 Subgroup analysis: variations in intervention onset, Outcome 6 Interventions with postnatal only component ‐ depressive symptomatology. | ||||
| 6.1 Immediate outcomes 0‐8 weeks | 6 | 3099 | Risk Ratio (M‐H, Random, 95% CI) | 0.63 [0.41, 0.98] |
| 6.2 Short‐term outcomes 9‐16 weeks | 6 | 3361 | Risk Ratio (M‐H, Random, 95% CI) | 0.76 [0.53, 1.11] |
| 6.3 Intermediate outcomes 17‐24 weeks | 6 | 10352 | Risk Ratio (M‐H, Random, 95% CI) | 0.93 [0.82, 1.06] |
| 6.4 Long‐term outcomes >24 weeks | 3 | 2663 | Risk Ratio (M‐H, Random, 95% CI) | 0.66 [0.46, 0.93] |
| 7 Interventions with postnatal only component ‐ mean depression scores Show forest plot | 8 | Std. Mean Difference (IV, Random, 95% CI) | Subtotals only | |
| Analysis 10.7  Comparison 10 Subgroup analysis: variations in intervention onset, Outcome 7 Interventions with postnatal only component ‐ mean depression scores. | ||||
| 7.1 Immediate outcomes 0‐8 weeks | 2 | 716 | Std. Mean Difference (IV, Random, 95% CI) | ‐0.14 [‐0.69, 0.42] |
| 7.2 Short‐term outcomes 9‐16 weeks | 5 | 3205 | Std. Mean Difference (IV, Random, 95% CI) | ‐0.35 [1.00, 0.31] |
| 7.3 Intermediate outcomes 17‐24 weeks | 5 | 8710 | Std. Mean Difference (IV, Random, 95% CI) | 0.01 [‐0.03, 0.06] |
| 7.4 Long‐term outcomes > 24 weeks | 2 | 1004 | Std. Mean Difference (IV, Random, 95% CI) | ‐0.59 [‐1.39, 0.21] |
| 8 Interventions with postnatal only component ‐ diagnosis of depression Show forest plot | 1 | Risk Ratio (M‐H, Fixed, 95% CI) | Subtotals only | |
| Analysis 10.8  Comparison 10 Subgroup analysis: variations in intervention onset, Outcome 8 Interventions with postnatal only component ‐ diagnosis of depression. | ||||
| 8.1 Short‐term outcomes 9‐16 weeks | 1 | 612 | Risk Ratio (M‐H, Fixed, 95% CI) | 0.65 [0.34, 1.23] |
| 9 TEST FOR SUBGROUP DIFFERENCES: depressive symptomatology: at final study assessment Show forest plot | 20 | 14727 | Risk Ratio (M‐H, Random, 95% CI) | 0.78 [0.66, 0.93] |
| Analysis 10.9  Comparison 10 Subgroup analysis: variations in intervention onset, Outcome 9 TEST FOR SUBGROUP DIFFERENCES: depressive symptomatology: at final study assessment. | ||||
| 9.1 Antenatal and postnatal intervention | 8 | 1941 | Risk Ratio (M‐H, Random, 95% CI) | 0.96 [0.75, 1.22] |
| 9.2 Postnatal intervention only | 12 | 12786 | Risk Ratio (M‐H, Random, 95% CI) | 0.73 [0.59, 0.90] |
| 10 TEST FOR SUBGROUP DIFFERENCES: mean depression scores: at final study assessment Show forest plot | 19 | 12376 | Std. Mean Difference (IV, Random, 95% CI) | ‐0.13 [‐0.28, 0.01] |
| Analysis 10.10  Comparison 10 Subgroup analysis: variations in intervention onset, Outcome 10 TEST FOR SUBGROUP DIFFERENCES: mean depression scores: at final study assessment. | ||||
| 10.1 Antenatal intervention only | 4 | 1050 | Std. Mean Difference (IV, Random, 95% CI) | 0.03 [‐0.09, 0.16] |
| 10.2 Antenatal and postnatal intervention | 7 | 1000 | Std. Mean Difference (IV, Random, 95% CI) | ‐0.14 [‐0.31, 0.02] |
| 10.3 Postnatal intervention only | 8 | 10326 | Std. Mean Difference (IV, Random, 95% CI) | ‐0.16 [‐0.40, 0.08] |
| 11 TEST FOR SUBGROUP DIFFERENCES: diagnosis of depression: at final study assessment Show forest plot | 5 | 939 | Risk Ratio (M‐H, Fixed, 95% CI) | 0.48 [0.31, 0.74] |
| Analysis 10.11  Comparison 10 Subgroup analysis: variations in intervention onset, Outcome 11 TEST FOR SUBGROUP DIFFERENCES: diagnosis of depression: at final study assessment. | ||||
| 11.1 Antenatal intervention only | 1 | 35 | Risk Ratio (M‐H, Fixed, 95% CI) | 0.08 [0.00, 1.34] |
| 11.2 Antenatal and postnatal intervention | 3 | 292 | Risk Ratio (M‐H, Fixed, 95% CI) | 0.44 [0.24, 0.80] |
| 11.3 Postnatal intervention only | 1 | 612 | Risk Ratio (M‐H, Fixed, 95% CI) | 0.65 [0.34, 1.23] |
| Outcome or subgroup title | No. of studies | No. of participants | Statistical method | Effect size |
| 1 Interventions for at‐risk women ‐ depressive symptomatology Show forest plot | 9 | Risk Ratio (M‐H, Random, 95% CI) | Subtotals only | |
| Analysis 11.1  Comparison 11 Subgroup analysis: variations in sample selection criteria, Outcome 1 Interventions for at‐risk women ‐ depressive symptomatology. | ||||
| 1.1 Immediate outcomes 0‐8 weeks | 7 | 1301 | Risk Ratio (M‐H, Random, 95% CI) | 0.67 [0.51, 0.88] |
| 1.2 Short‐term outcomes 9‐16 weeks | 6 | 1368 | Risk Ratio (M‐H, Random, 95% CI) | 0.59 [0.47, 0.75] |
| 1.3 Intermediate outcomes 17‐24 weeks | 2 | 151 | Risk Ratio (M‐H, Random, 95% CI) | 1.34 [0.60, 2.98] |
| 1.4 Long‐term outcomes > 24 weeks | 2 | 281 | Risk Ratio (M‐H, Random, 95% CI) | 0.60 [0.29, 1.24] |
| 2 Interventions for at‐risk women ‐ mean depression scores Show forest plot | 7 | Std. Mean Difference (IV, Random, 95% CI) | Subtotals only | |
| Analysis 11.2  Comparison 11 Subgroup analysis: variations in sample selection criteria, Outcome 2 Interventions for at‐risk women ‐ mean depression scores. | ||||
| 2.1 Immediate outcomes 0‐8 weeks | 3 | 387 | Std. Mean Difference (IV, Random, 95% CI) | ‐0.17 [‐0.52, 0.18] |
| 2.2 Short‐term outcomes 9‐16 weeks | 5 | 1067 | Std. Mean Difference (IV, Random, 95% CI) | ‐0.14 [‐0.26, ‐0.02] |
| 2.3 Intermediate outcomes 17‐24 weeks | 1 | 30 | Std. Mean Difference (IV, Random, 95% CI) | ‐0.02 [‐0.74, 0.70] |
| 2.4 Long‐term outcomes >24 weeks | 3 | 324 | Std. Mean Difference (IV, Random, 95% CI) | ‐0.00 [‐0.22, 0.22] |
| 3 Interventions for at‐risk women ‐ diagnosis of depression Show forest plot | 5 | Risk Ratio (M‐H, Fixed, 95% CI) | Subtotals only | |
| Analysis 11.3  Comparison 11 Subgroup analysis: variations in sample selection criteria, Outcome 3 Interventions for at‐risk women ‐ diagnosis of depression. | ||||
| 3.1 Immediate outcomes 0‐8 weeks | 1 | 39 | Risk Ratio (M‐H, Fixed, 95% CI) | 0.09 [0.01, 1.47] |
| 3.2 Short‐term outcomes 9‐16 weeks | 4 | 902 | Risk Ratio (M‐H, Fixed, 95% CI) | 0.47 [0.30, 0.74] |
| 3.3 Intermediate outcomes 17‐24 weeks | 1 | 37 | Risk Ratio (M‐H, Fixed, 95% CI) | 0.64 [0.17, 2.46] |
| 3.4 At final study assessment | 5 | 939 | Risk Ratio (M‐H, Fixed, 95% CI) | 0.48 [0.31, 0.74] |
| 4 Interventions for general population ‐ depressive symptomatology Show forest plot | 12 | Risk Ratio (M‐H, Random, 95% CI) | Subtotals only | |
| Analysis 11.4  Comparison 11 Subgroup analysis: variations in sample selection criteria, Outcome 4 Interventions for general population ‐ depressive symptomatology. | ||||
| 4.1 Immediate outcomes 0‐8 weeks | 7 | 3767 | Risk Ratio (M‐H, Random, 95% CI) | 0.69 [0.46, 1.03] |
| 4.2 Short‐term outcomes 9‐16 weeks | 4 | 2614 | Risk Ratio (M‐H, Random, 95% CI) | 0.91 [0.58, 1.42] |
| 4.3 Intermediate outcomes 17‐24 weeks | 7 | 10485 | Risk Ratio (M‐H, Random, 95% CI) | 0.92 [0.81, 1.06] |
| 4.4 Long‐term outcomes > 24 weeks | 3 | 2655 | Risk Ratio (M‐H, Random, 95% CI) | 0.71 [0.51, 0.99] |
| 5 Interventions for general population ‐ mean depression scores Show forest plot | 12 | Std. Mean Difference (IV, Random, 95% CI) | Subtotals only | |
| Analysis 11.5  Comparison 11 Subgroup analysis: variations in sample selection criteria, Outcome 5 Interventions for general population ‐ mean depression scores. | ||||
| 5.1 Immediate outcomes 0‐8 weeks | 3 | 847 | Std. Mean Difference (IV, Random, 95% CI) | ‐0.15 [‐0.56, 0.25] |
| 5.2 Short‐term outcomes 9‐16 weeks | 4 | 2561 | Std. Mean Difference (IV, Random, 95% CI) | ‐0.40 [‐1.24, 0.44] |
| 5.3 Intermediate outcomes 17‐24 weeks | 9 | 9914 | Std. Mean Difference (IV, Random, 95% CI) | 0.01 [‐0.03, 0.05] |
| 5.4 Long‐term outcomes > 24 weeks | 4 | 2123 | Std. Mean Difference (IV, Random, 95% CI) | ‐0.28 [‐0.87, 0.30] |
| 6 TEST FOR SUBGROUP DIFFERENCES: depressive symptomatology: at final study assessment Show forest plot | 20 | 14727 | Risk Ratio (M‐H, Random, 95% CI) | 0.78 [0.66, 0.93] |
| Analysis 11.6  Comparison 11 Subgroup analysis: variations in sample selection criteria, Outcome 6 TEST FOR SUBGROUP DIFFERENCES: depressive symptomatology: at final study assessment. | ||||
| 6.1 Interventions for at‐risk women | 8 | 1853 | Risk Ratio (M‐H, Random, 95% CI) | 0.66 [0.50, 0.88] |
| 6.2 General population | 12 | 12874 | Risk Ratio (M‐H, Random, 95% CI) | 0.83 [0.68, 1.02] |
| 7 TEST FOR SUBGROUP DIFFERENCES: mean depression scores: at final study assessment Show forest plot | 19 | 12376 | Std. Mean Difference (IV, Random, 95% CI) | ‐0.13 [‐0.28, 0.01] |
| Analysis 11.7  Comparison 11 Subgroup analysis: variations in sample selection criteria, Outcome 7 TEST FOR SUBGROUP DIFFERENCES: mean depression scores: at final study assessment. | ||||
| 7.1 Interventions for at risk women | 7 | 1087 | Std. Mean Difference (IV, Random, 95% CI) | ‐0.13 [‐0.25, ‐0.01] |
| 7.2 General population | 12 | 11289 | Std. Mean Difference (IV, Random, 95% CI) | ‐0.15 [‐0.33, 0.04] |

'Risk of bias' summary: review authors' judgements about each risk of bias item for each included study.
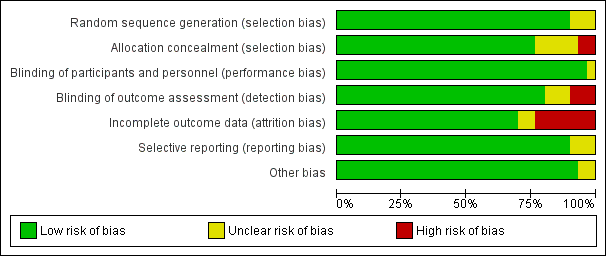
'Risk of bias' graph: review authors' judgements about each risk of bias item presented as percentages across all included studies.

Funnel plot of comparison: 1 All interventions versus usual care ‐ various study outcomes, outcome: 1.1 Depressive symptomatology at final study assessment.

Funnel plot of comparison: 1 All interventions versus usual care ‐ various study outcomes, outcome: 1.2 Mean depression scores at final study assessment.

Funnel plot of comparison: 2 All psychosocial interventions versus usual care ‐ variations in intervention type, outcome: 2.4 All psychosocial interventions: depressive symptomatology at final study assessment.
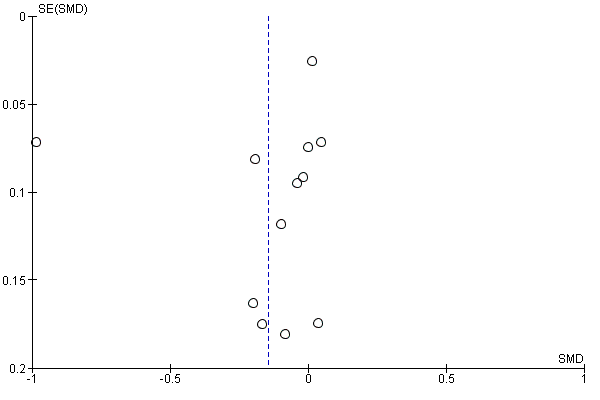
Funnel plot of comparison: 2 All psychosocial interventions versus usual care ‐ variations in intervention type, outcome: 2.5 All psychosocial interventions: mean depression scores.
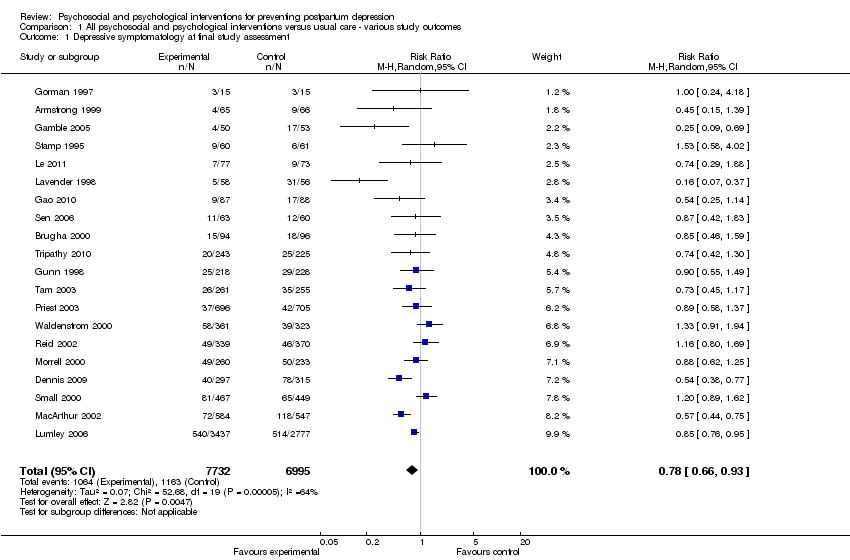
Comparison 1 All psychosocial and psychological interventions versus usual care ‐ various study outcomes, Outcome 1 Depressive symptomatology at final study assessment.

Comparison 1 All psychosocial and psychological interventions versus usual care ‐ various study outcomes, Outcome 2 Mean depression scores at final study assessment.

Comparison 1 All psychosocial and psychological interventions versus usual care ‐ various study outcomes, Outcome 3 Diagnosis of depression at final study assessment.
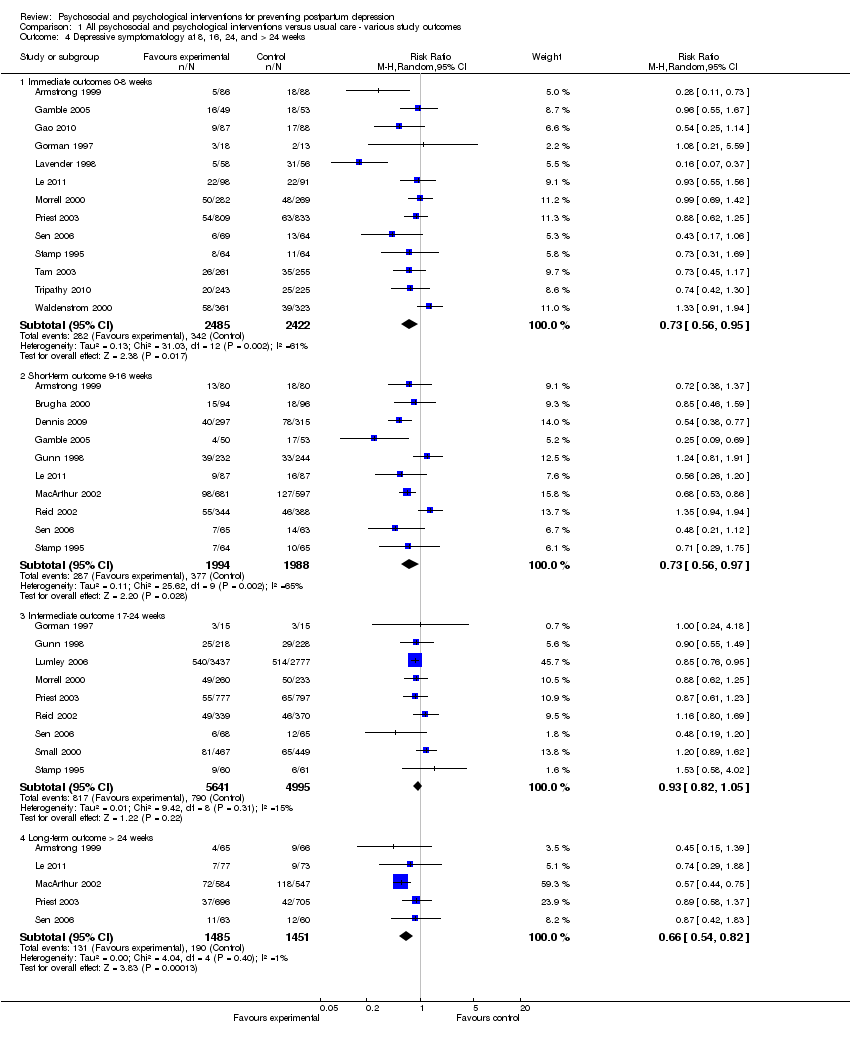
Comparison 1 All psychosocial and psychological interventions versus usual care ‐ various study outcomes, Outcome 4 Depressive symptomatology at 8, 16, 24, and > 24 weeks.
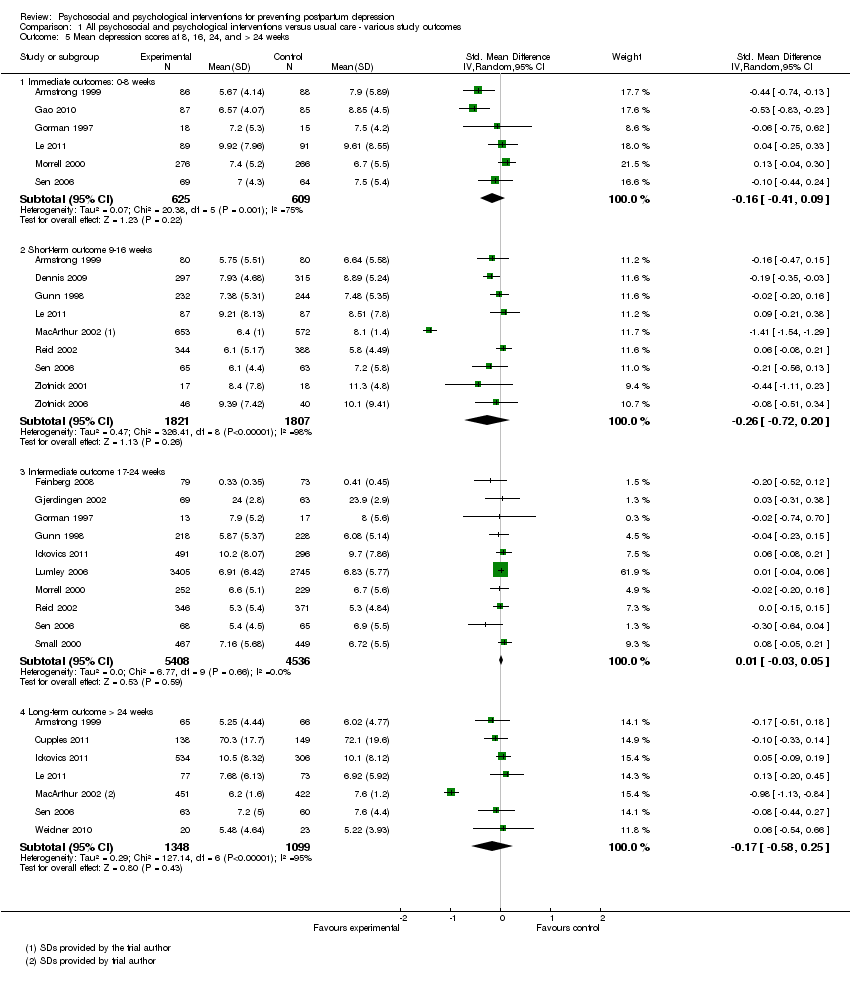
Comparison 1 All psychosocial and psychological interventions versus usual care ‐ various study outcomes, Outcome 5 Mean depression scores at 8, 16, 24, and > 24 weeks.

Comparison 1 All psychosocial and psychological interventions versus usual care ‐ various study outcomes, Outcome 6 Diagnosis of depression at 8, 16, 24, and > 24 weeks.
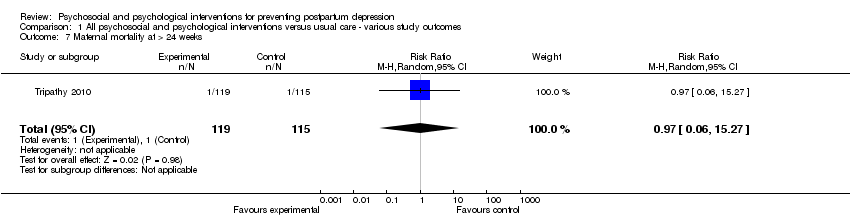
Comparison 1 All psychosocial and psychological interventions versus usual care ‐ various study outcomes, Outcome 7 Maternal mortality at > 24 weeks.

Comparison 1 All psychosocial and psychological interventions versus usual care ‐ various study outcomes, Outcome 8 Maternal‐infant attachment at 8, 16, and 24 weeks.

Comparison 1 All psychosocial and psychological interventions versus usual care ‐ various study outcomes, Outcome 9 Mean maternal‐infant attachment scores at 8, 16, 24, and > 24 weeks.

Comparison 1 All psychosocial and psychological interventions versus usual care ‐ various study outcomes, Outcome 10 Anxiety at 8, 16, and 24 weeks.

Comparison 1 All psychosocial and psychological interventions versus usual care ‐ various study outcomes, Outcome 11 Mean anxiety scores at 8, 16, 24, and > 24 weeks.

Comparison 1 All psychosocial and psychological interventions versus usual care ‐ various study outcomes, Outcome 12 Maternal stress at 16 weeks.

Comparison 1 All psychosocial and psychological interventions versus usual care ‐ various study outcomes, Outcome 13 Mean maternal stress scores at 24 and > 24 weeks.

Comparison 1 All psychosocial and psychological interventions versus usual care ‐ various study outcomes, Outcome 14 Mean parental stress scores at 8, 24, and > 24 weeks.

Comparison 1 All psychosocial and psychological interventions versus usual care ‐ various study outcomes, Outcome 15 Perceived social support at 8 and 16 weeks.

Comparison 1 All psychosocial and psychological interventions versus usual care ‐ various study outcomes, Outcome 16 Mean perceived social support scores at 8, 16, 24, and > 24 weeks.

Comparison 1 All psychosocial and psychological interventions versus usual care ‐ various study outcomes, Outcome 17 Maternal dissatisfaction with care provided at 8, 16, and 24 weeks.
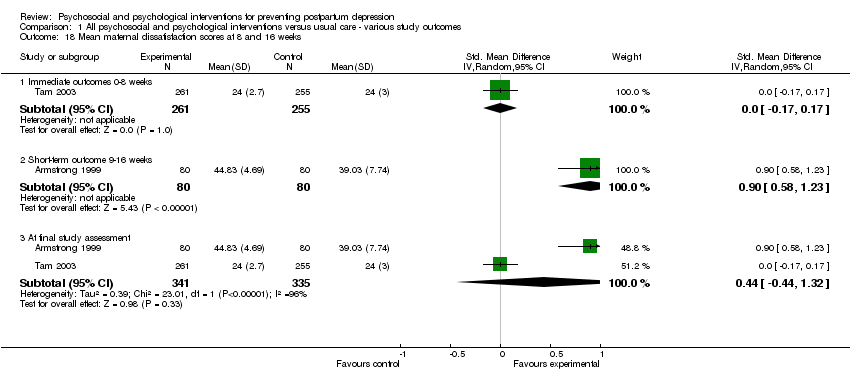
Comparison 1 All psychosocial and psychological interventions versus usual care ‐ various study outcomes, Outcome 18 Mean maternal dissatisfaction scores at 8 and 16 weeks.
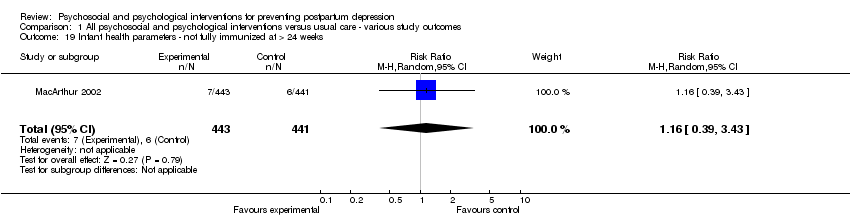
Comparison 1 All psychosocial and psychological interventions versus usual care ‐ various study outcomes, Outcome 19 Infant health parameters ‐ not fully immunized at > 24 weeks.

Comparison 1 All psychosocial and psychological interventions versus usual care ‐ various study outcomes, Outcome 20 Infant development > 24 weeks.
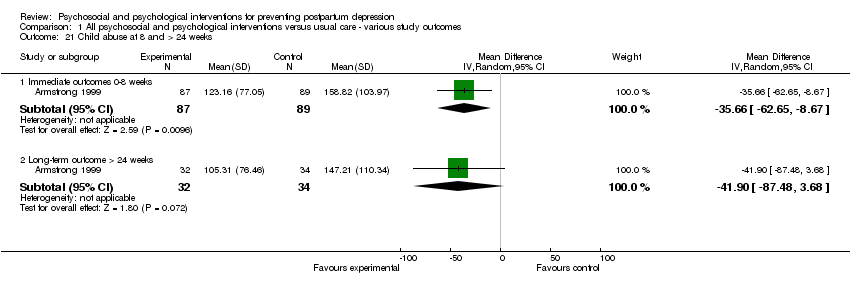
Comparison 1 All psychosocial and psychological interventions versus usual care ‐ various study outcomes, Outcome 21 Child abuse at 8 and > 24 weeks.

Comparison 1 All psychosocial and psychological interventions versus usual care ‐ various study outcomes, Outcome 22 Mean marital discord scores at 8, 16, and 24 weeks.

Comparison 2 All psychosocial interventions versus usual care ‐ variations in intervention type, Outcome 1 All psychosocial interventions ‐ depressive symptomatology.

Comparison 2 All psychosocial interventions versus usual care ‐ variations in intervention type, Outcome 2 All psychosocial interventions ‐ mean depression scores.
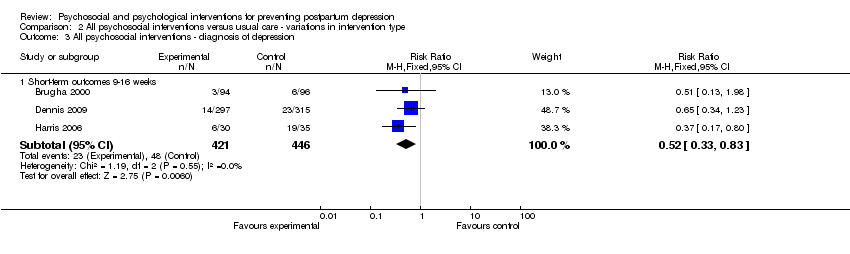
Comparison 2 All psychosocial interventions versus usual care ‐ variations in intervention type, Outcome 3 All psychosocial interventions ‐ diagnosis of depression.
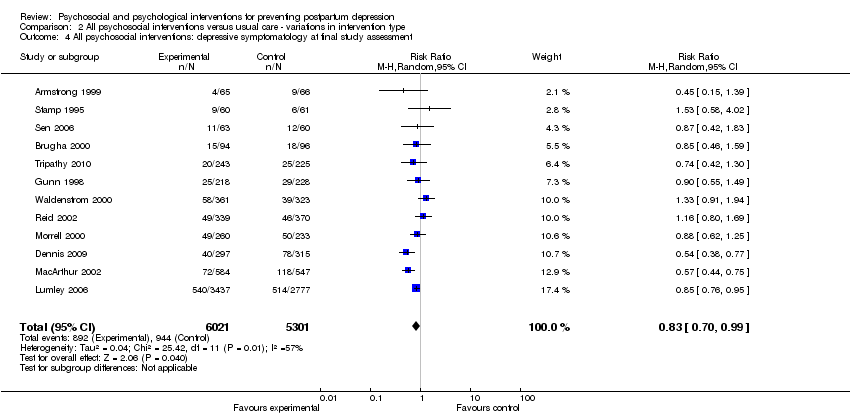
Comparison 2 All psychosocial interventions versus usual care ‐ variations in intervention type, Outcome 4 All psychosocial interventions: depressive symptomatology at final study assessment.
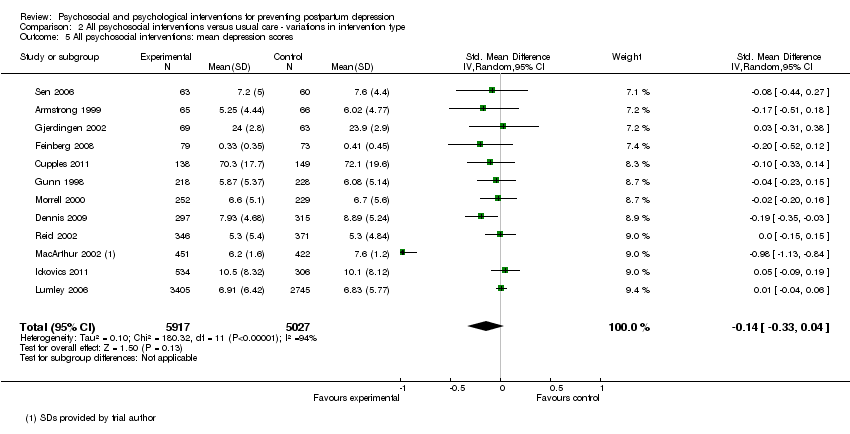
Comparison 2 All psychosocial interventions versus usual care ‐ variations in intervention type, Outcome 5 All psychosocial interventions: mean depression scores.

Comparison 3 All psychological interventions versus usual care ‐ variations in intervention type, Outcome 1 All psychological interventions ‐ depressive symptomatology.

Comparison 3 All psychological interventions versus usual care ‐ variations in intervention type, Outcome 2 All psychological interventions ‐ mean depression scores.
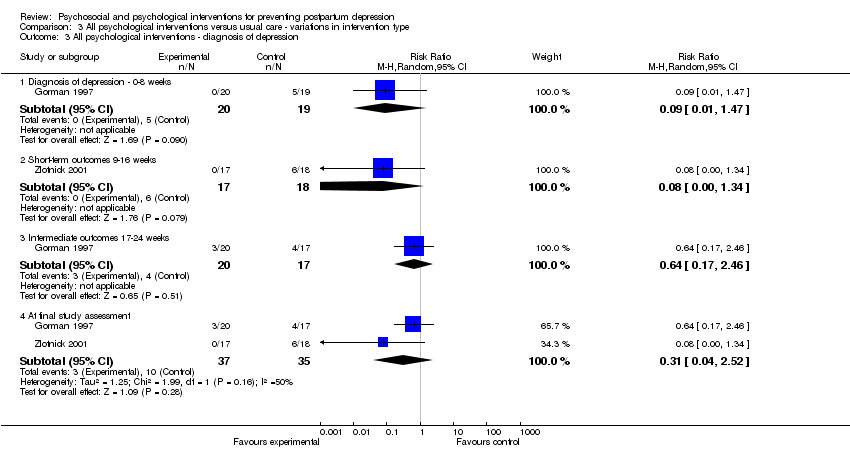
Comparison 3 All psychological interventions versus usual care ‐ variations in intervention type, Outcome 3 All psychological interventions ‐ diagnosis of depression.

Comparison 4 Subgroup analysis: variations in psychosocial interventions, Outcome 1 TEST FOR SUBGROUP DIFFERENCES: depressive symptomatology at final study assessment.
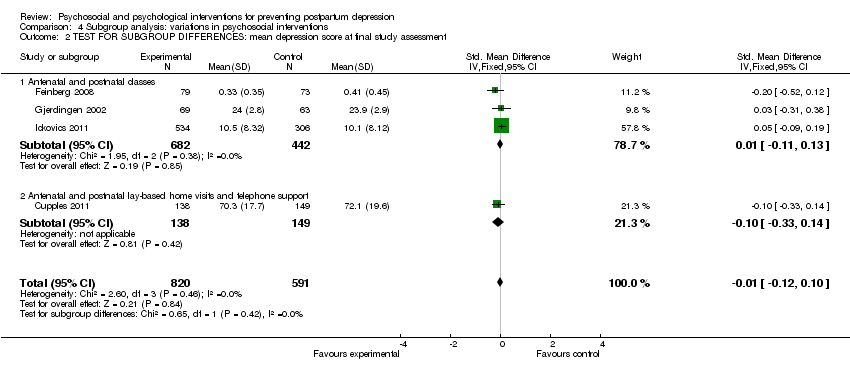
Comparison 4 Subgroup analysis: variations in psychosocial interventions, Outcome 2 TEST FOR SUBGROUP DIFFERENCES: mean depression score at final study assessment.

Comparison 5 Subgroup analysis: variations in psychological interventions, Outcome 1 TEST FOR SUBGROUP DIFFERENCES: depressive symptomatology at final study assessment.
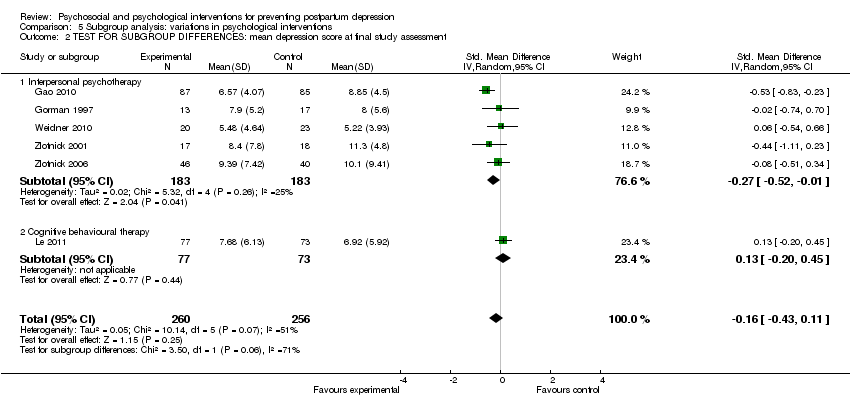
Comparison 5 Subgroup analysis: variations in psychological interventions, Outcome 2 TEST FOR SUBGROUP DIFFERENCES: mean depression score at final study assessment.
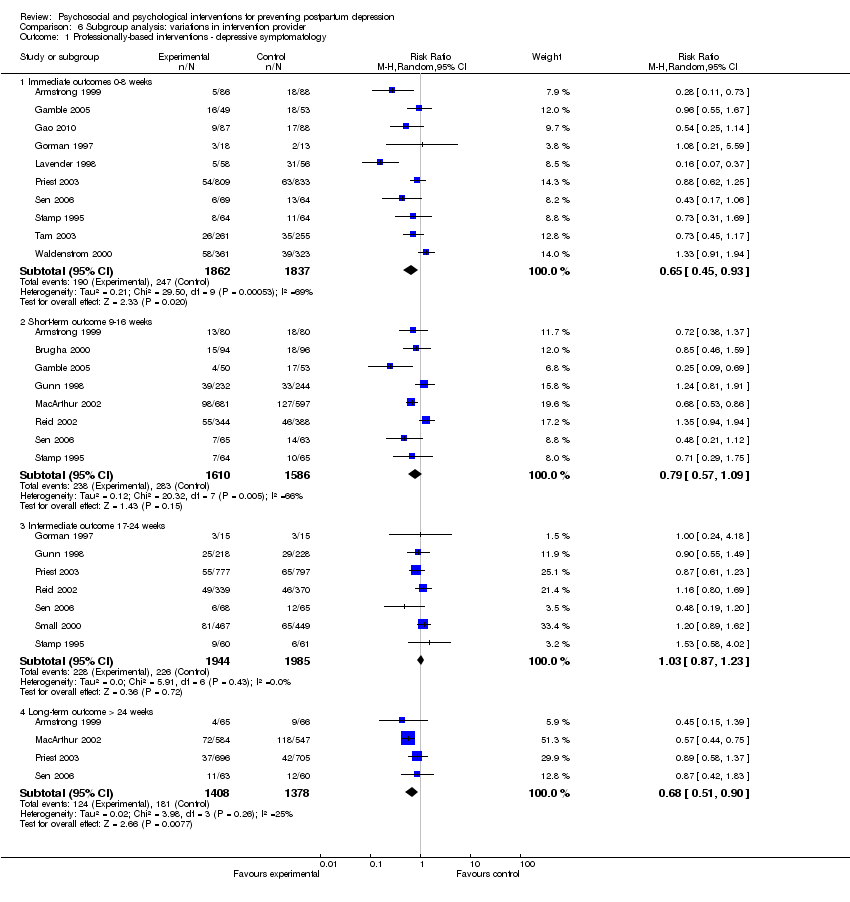
Comparison 6 Subgroup analysis: variations in intervention provider, Outcome 1 Professionally‐based interventions ‐ depressive symptomatology.

Comparison 6 Subgroup analysis: variations in intervention provider, Outcome 2 Professionally‐based interventions ‐ mean depression scores.
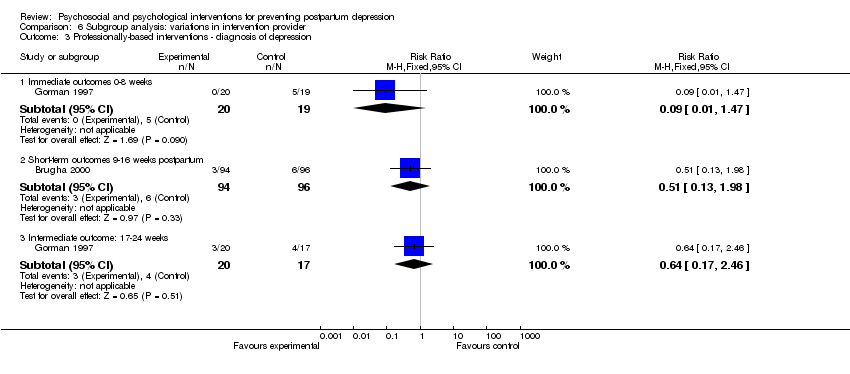
Comparison 6 Subgroup analysis: variations in intervention provider, Outcome 3 Professionally‐based interventions ‐ diagnosis of depression.
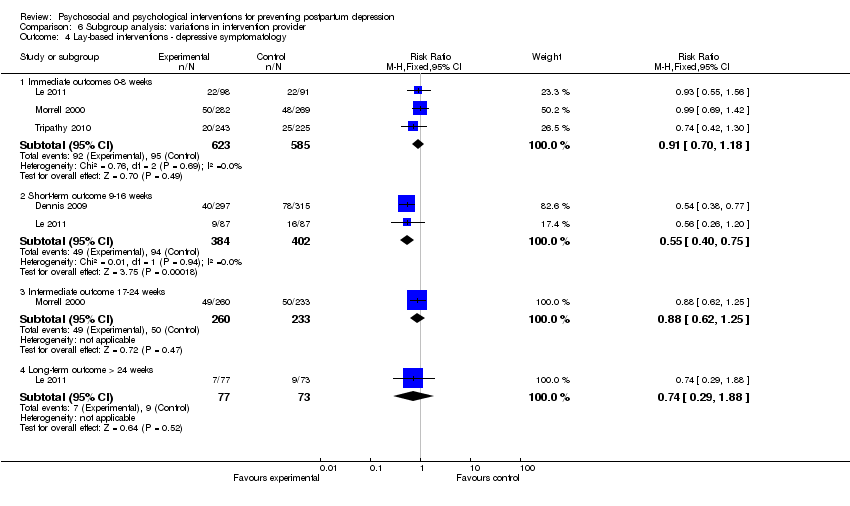
Comparison 6 Subgroup analysis: variations in intervention provider, Outcome 4 Lay‐based interventions ‐ depressive symptomatology.
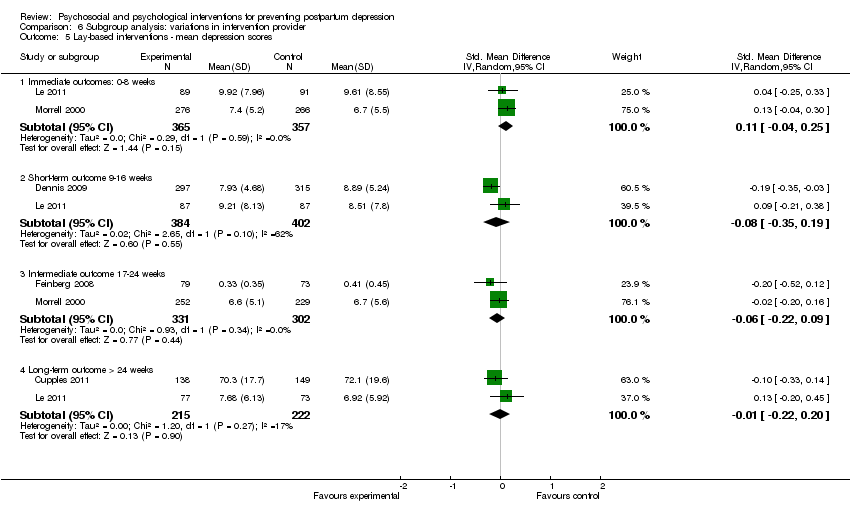
Comparison 6 Subgroup analysis: variations in intervention provider, Outcome 5 Lay‐based interventions ‐ mean depression scores.
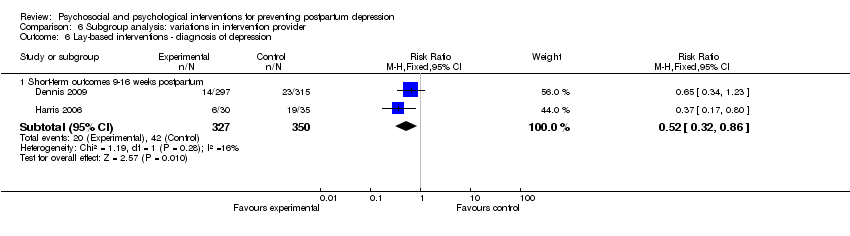
Comparison 6 Subgroup analysis: variations in intervention provider, Outcome 6 Lay‐based interventions ‐ diagnosis of depression.
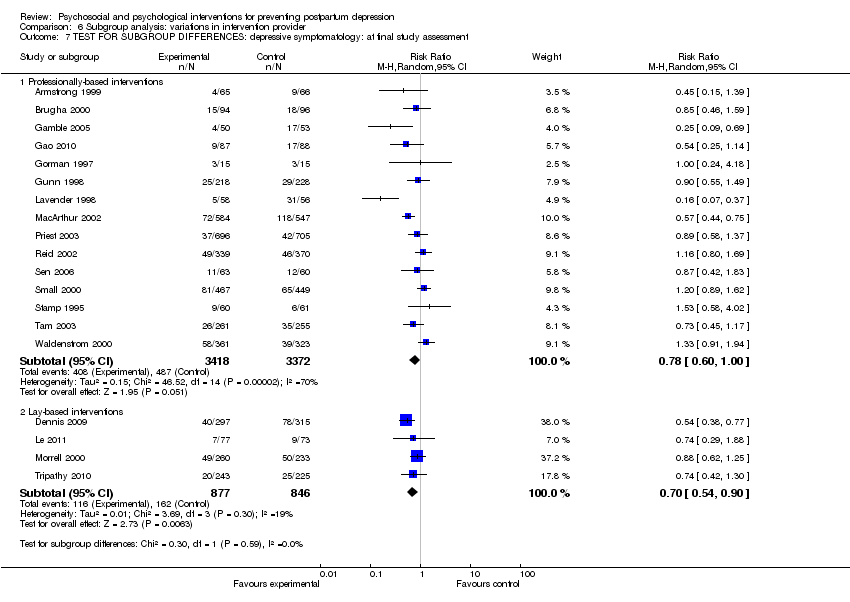
Comparison 6 Subgroup analysis: variations in intervention provider, Outcome 7 TEST FOR SUBGROUP DIFFERENCES: depressive symptomatology: at final study assessment.

Comparison 6 Subgroup analysis: variations in intervention provider, Outcome 8 TEST FOR SUBGROUP DIFFERENCES: mean depression scores: at final study assessment.
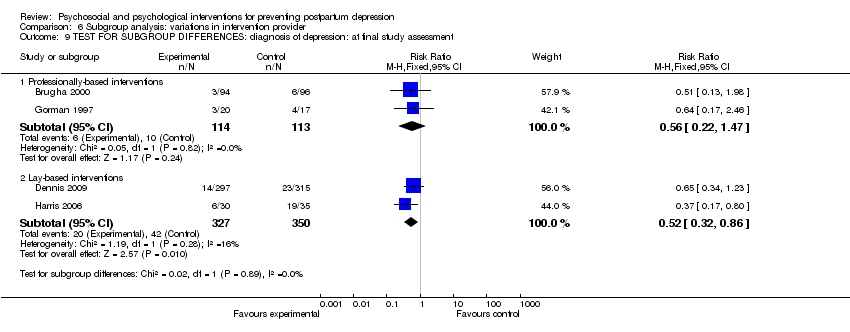
Comparison 6 Subgroup analysis: variations in intervention provider, Outcome 9 TEST FOR SUBGROUP DIFFERENCES: diagnosis of depression: at final study assessment.

Comparison 7 Subgroup analysis: variations in professionally‐based intervention provider, Outcome 1 TEST FOR SUBGROUP DIFFERENCES: depressive symptomatology at final study assessment.

Comparison 7 Subgroup analysis: variations in professionally‐based intervention provider, Outcome 2 TEST FOR SUBGROUP DIFFERENCES: mean depression score at final study assessment.

Comparison 8 Subgroup analysis: variations in intervention mode, Outcome 1 Individually‐based interventions ‐ depressive symptomatology.

Comparison 8 Subgroup analysis: variations in intervention mode, Outcome 2 Individually‐based interventions ‐ mean depression scores.

Comparison 8 Subgroup analysis: variations in intervention mode, Outcome 3 Individually‐based interventions ‐ diagnosis of depression.
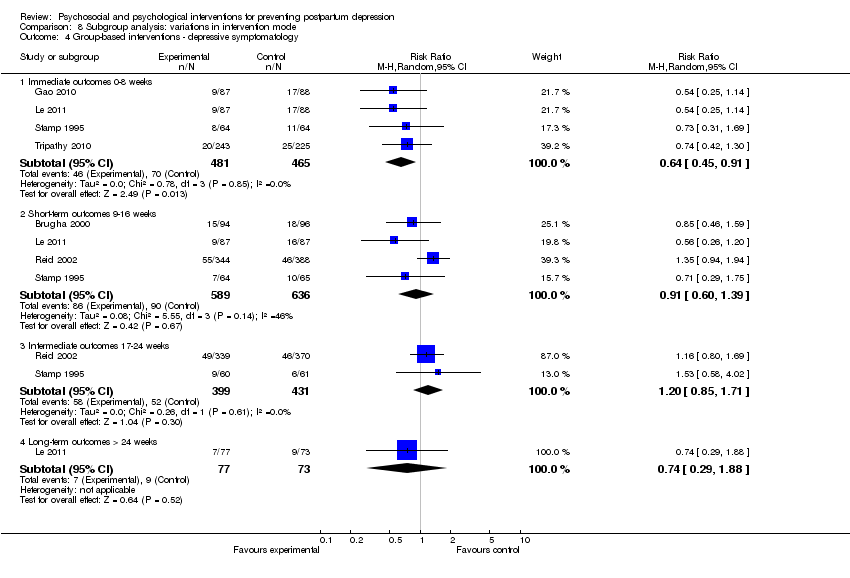
Comparison 8 Subgroup analysis: variations in intervention mode, Outcome 4 Group‐based interventions ‐ depressive symptomatology.
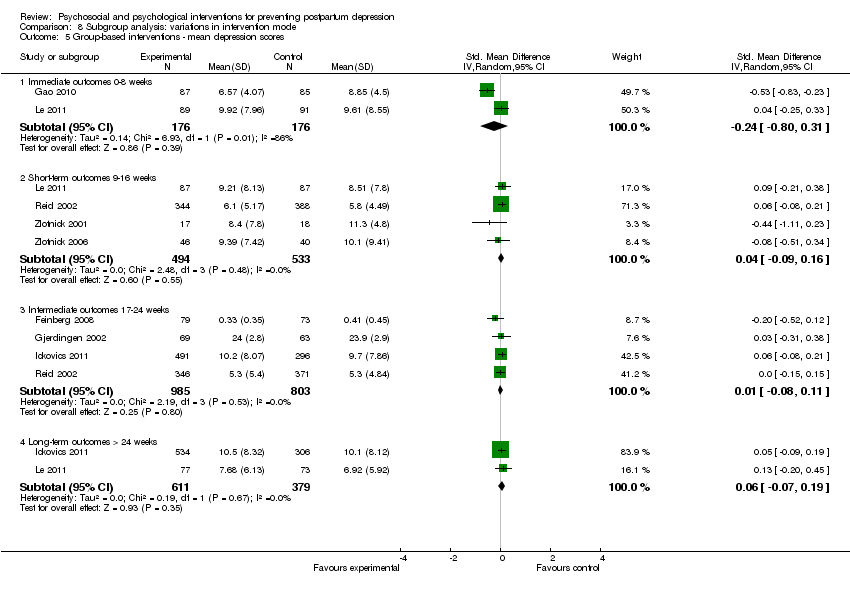
Comparison 8 Subgroup analysis: variations in intervention mode, Outcome 5 Group‐based interventions ‐ mean depression scores.

Comparison 8 Subgroup analysis: variations in intervention mode, Outcome 6 Group‐based interventions ‐ diagnosis of depression.
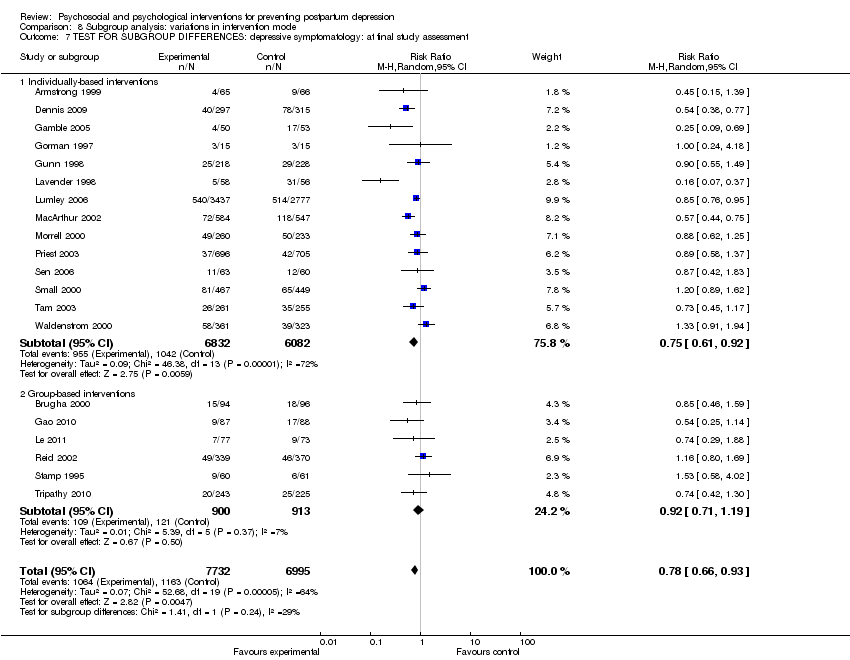
Comparison 8 Subgroup analysis: variations in intervention mode, Outcome 7 TEST FOR SUBGROUP DIFFERENCES: depressive symptomatology: at final study assessment.

Comparison 8 Subgroup analysis: variations in intervention mode, Outcome 8 TEST FOR SUBGROUP DIFFERENCES: mean depression scores: at final study assessment.

Comparison 8 Subgroup analysis: variations in intervention mode, Outcome 9 TEST FOR SUBGROUP DIFFERENCES: diagnosis of depression: at final study assessment.

Comparison 9 Subgroup analysis: variations in intervention duration, Outcome 1 Single‐contact interventions ‐ depressive symptomatology.
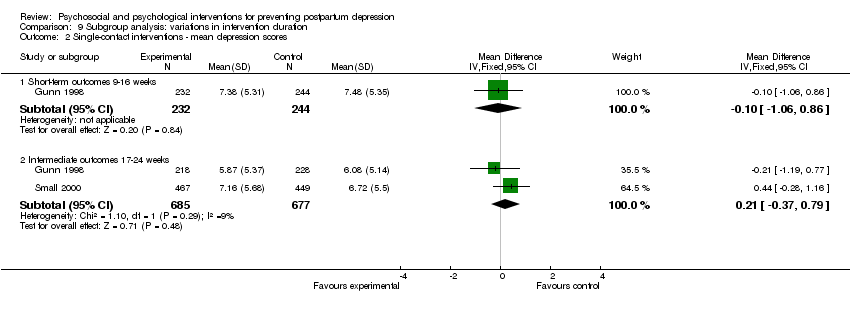
Comparison 9 Subgroup analysis: variations in intervention duration, Outcome 2 Single‐contact interventions ‐ mean depression scores.

Comparison 9 Subgroup analysis: variations in intervention duration, Outcome 3 Multiple‐contact interventions ‐ depressive symptomatology.

Comparison 9 Subgroup analysis: variations in intervention duration, Outcome 4 Multiple‐contact interventions ‐ mean depression scores.

Comparison 9 Subgroup analysis: variations in intervention duration, Outcome 5 Multiple‐contact interventions ‐ diagnosis of depression.

Comparison 9 Subgroup analysis: variations in intervention duration, Outcome 6 TEST FOR SUBGROUP DIFFERENCES: depressive symptomatology: at final study assessment.

Comparison 9 Subgroup analysis: variations in intervention duration, Outcome 7 TEST FOR SUBGROUP DIFFERENCES: mean depression scores: at final study assessment.
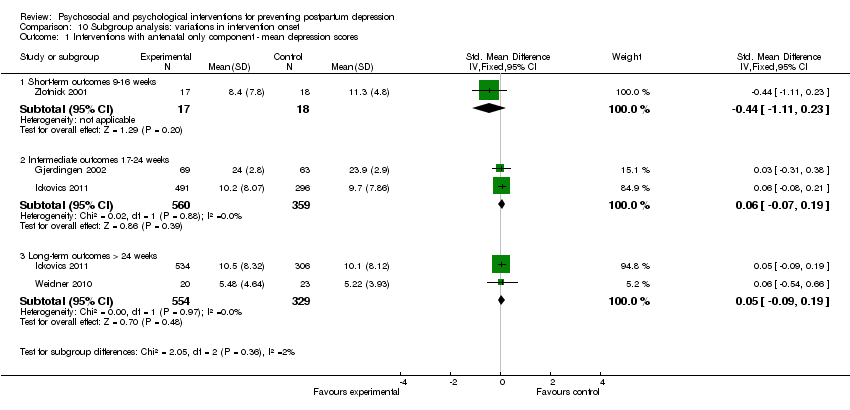
Comparison 10 Subgroup analysis: variations in intervention onset, Outcome 1 Interventions with antenatal only component ‐ mean depression scores.
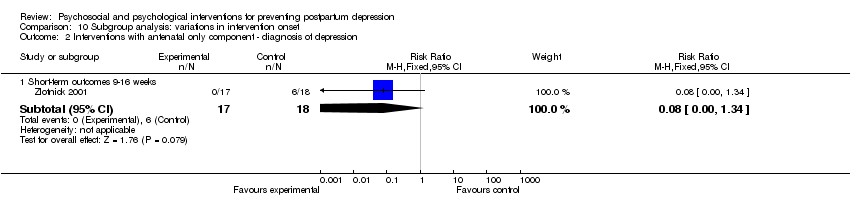
Comparison 10 Subgroup analysis: variations in intervention onset, Outcome 2 Interventions with antenatal only component ‐ diagnosis of depression.

Comparison 10 Subgroup analysis: variations in intervention onset, Outcome 3 Interventions with antenatal and postnatal components ‐ depressive symptomatology.
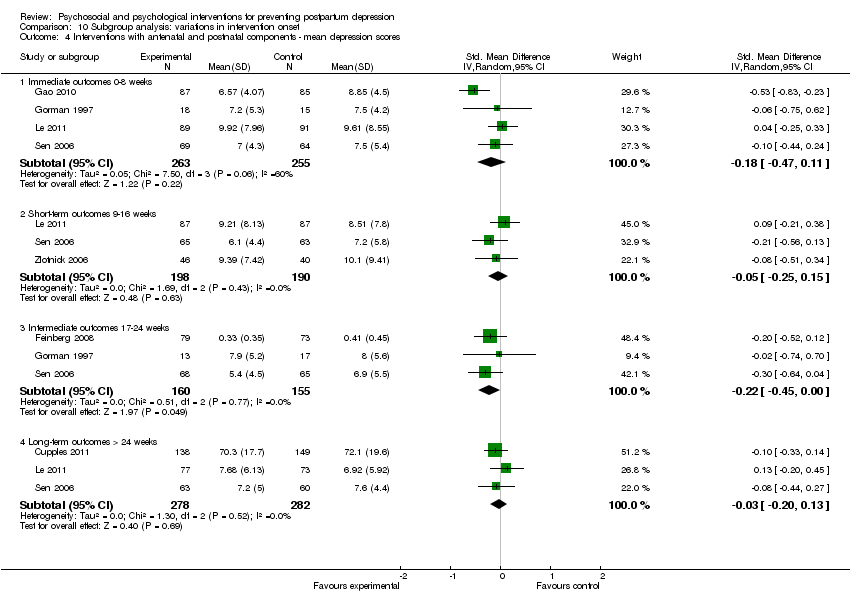
Comparison 10 Subgroup analysis: variations in intervention onset, Outcome 4 Interventions with antenatal and postnatal components ‐ mean depression scores.
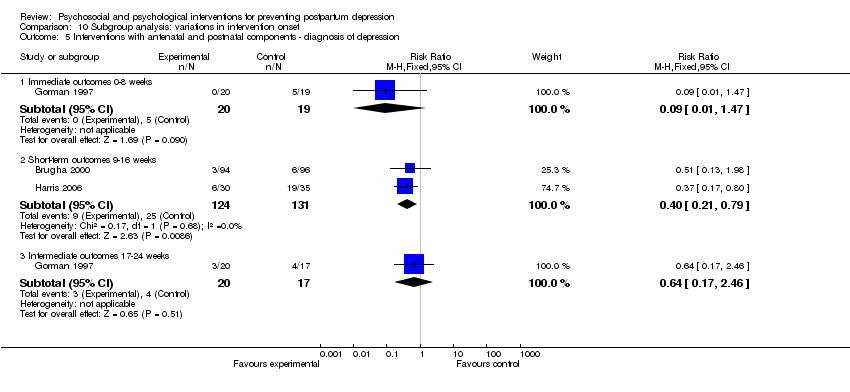
Comparison 10 Subgroup analysis: variations in intervention onset, Outcome 5 Interventions with antenatal and postnatal components ‐ diagnosis of depression.

Comparison 10 Subgroup analysis: variations in intervention onset, Outcome 6 Interventions with postnatal only component ‐ depressive symptomatology.

Comparison 10 Subgroup analysis: variations in intervention onset, Outcome 7 Interventions with postnatal only component ‐ mean depression scores.
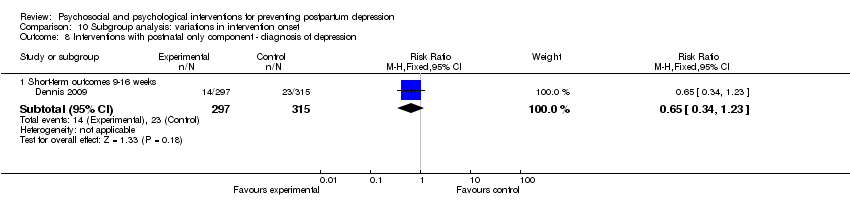
Comparison 10 Subgroup analysis: variations in intervention onset, Outcome 8 Interventions with postnatal only component ‐ diagnosis of depression.

Comparison 10 Subgroup analysis: variations in intervention onset, Outcome 9 TEST FOR SUBGROUP DIFFERENCES: depressive symptomatology: at final study assessment.
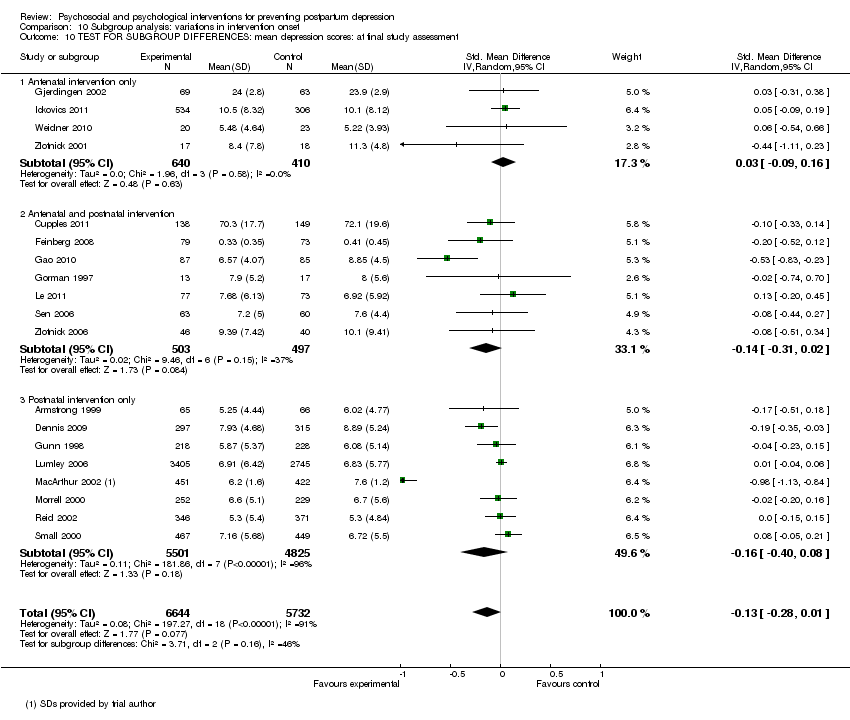
Comparison 10 Subgroup analysis: variations in intervention onset, Outcome 10 TEST FOR SUBGROUP DIFFERENCES: mean depression scores: at final study assessment.
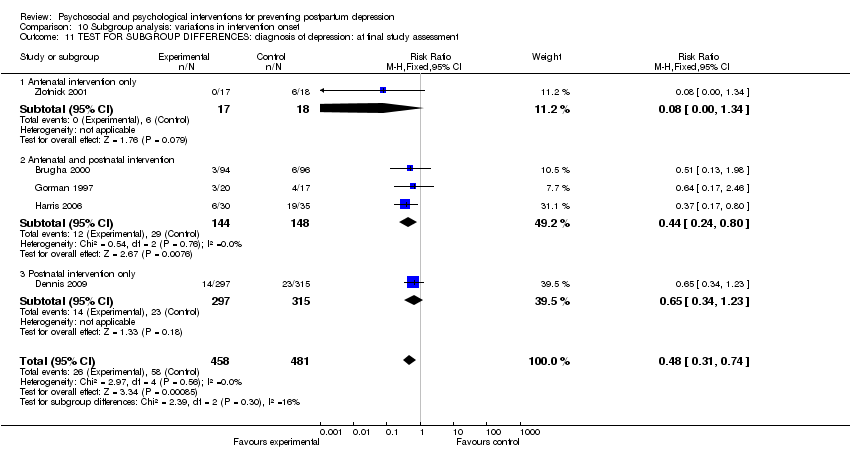
Comparison 10 Subgroup analysis: variations in intervention onset, Outcome 11 TEST FOR SUBGROUP DIFFERENCES: diagnosis of depression: at final study assessment.
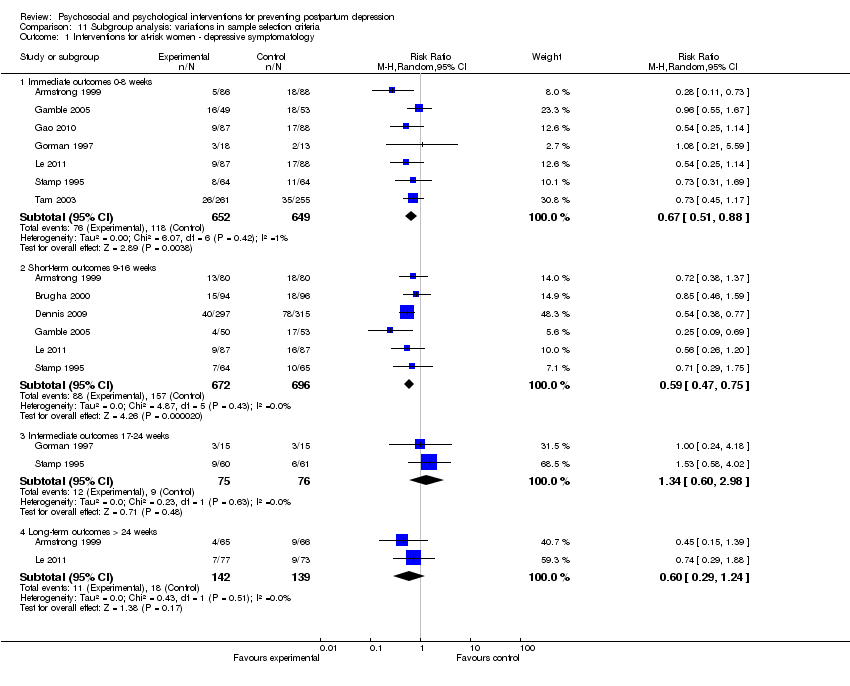
Comparison 11 Subgroup analysis: variations in sample selection criteria, Outcome 1 Interventions for at‐risk women ‐ depressive symptomatology.

Comparison 11 Subgroup analysis: variations in sample selection criteria, Outcome 2 Interventions for at‐risk women ‐ mean depression scores.

Comparison 11 Subgroup analysis: variations in sample selection criteria, Outcome 3 Interventions for at‐risk women ‐ diagnosis of depression.

Comparison 11 Subgroup analysis: variations in sample selection criteria, Outcome 4 Interventions for general population ‐ depressive symptomatology.
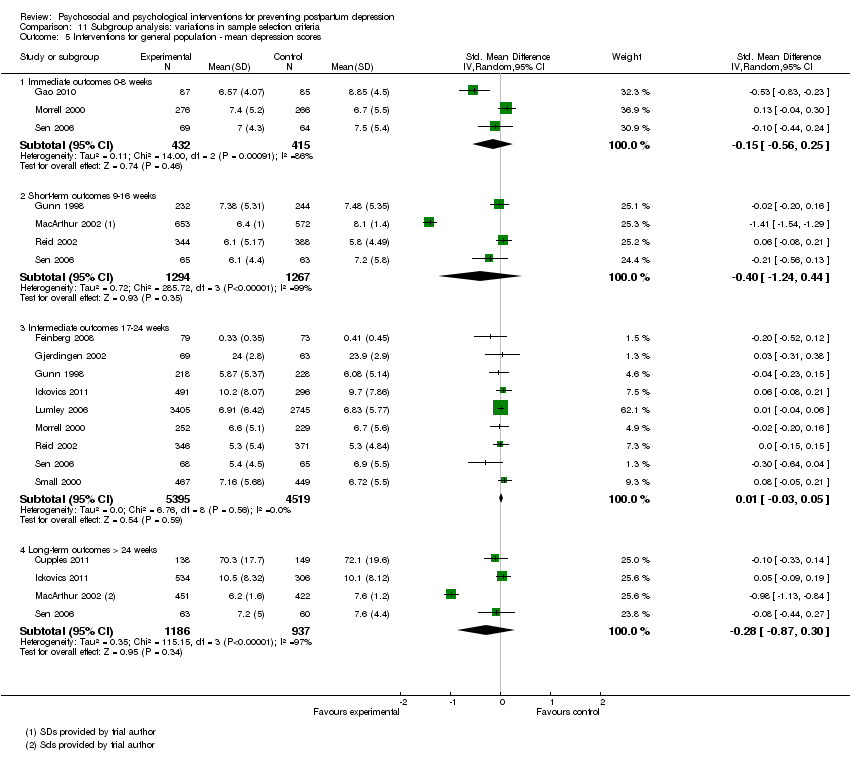
Comparison 11 Subgroup analysis: variations in sample selection criteria, Outcome 5 Interventions for general population ‐ mean depression scores.
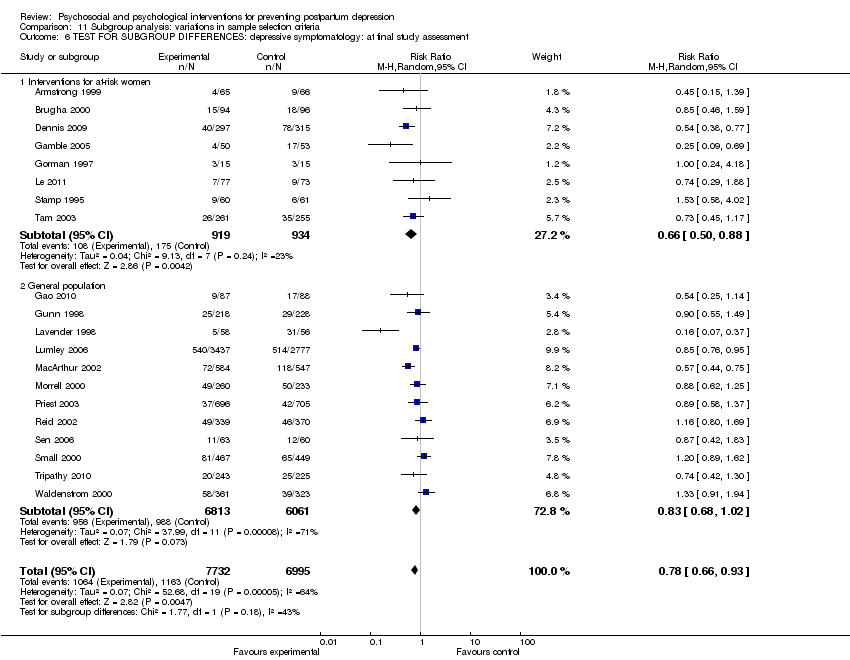
Comparison 11 Subgroup analysis: variations in sample selection criteria, Outcome 6 TEST FOR SUBGROUP DIFFERENCES: depressive symptomatology: at final study assessment.
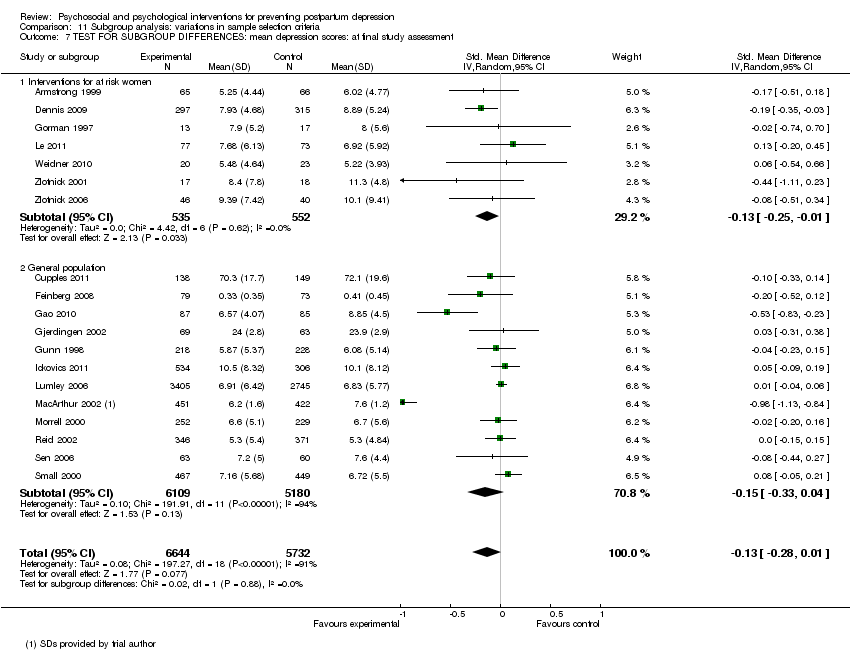
Comparison 11 Subgroup analysis: variations in sample selection criteria, Outcome 7 TEST FOR SUBGROUP DIFFERENCES: mean depression scores: at final study assessment.
| Outcome or subgroup title | No. of studies | No. of participants | Statistical method | Effect size |
| 1 Depressive symptomatology at final study assessment Show forest plot | 20 | 14727 | Risk Ratio (M‐H, Random, 95% CI) | 0.78 [0.66, 0.93] |
| 2 Mean depression scores at final study assessment Show forest plot | 19 | 12376 | Std. Mean Difference (IV, Random, 95% CI) | ‐0.13 [‐0.28, 0.01] |
| 3 Diagnosis of depression at final study assessment Show forest plot | 5 | 939 | Risk Ratio (M‐H, Random, 95% CI) | 0.50 [0.32, 0.78] |
| 4 Depressive symptomatology at 8, 16, 24, and > 24 weeks Show forest plot | 20 | Risk Ratio (M‐H, Random, 95% CI) | Subtotals only | |
| 4.1 Immediate outcomes 0‐8 weeks | 13 | 4907 | Risk Ratio (M‐H, Random, 95% CI) | 0.73 [0.56, 0.95] |
| 4.2 Short‐term outcome 9‐16 weeks | 10 | 3982 | Risk Ratio (M‐H, Random, 95% CI) | 0.73 [0.56, 0.97] |
| 4.3 Intermediate outcome 17‐24 weeks | 9 | 10636 | Risk Ratio (M‐H, Random, 95% CI) | 0.93 [0.82, 1.05] |
| 4.4 Long‐term outcome > 24 weeks | 5 | 2936 | Risk Ratio (M‐H, Random, 95% CI) | 0.66 [0.54, 0.82] |
| 5 Mean depression scores at 8, 16, 24, and > 24 weeks Show forest plot | 19 | Std. Mean Difference (IV, Random, 95% CI) | Subtotals only | |
| 5.1 Immediate outcomes: 0‐8 weeks | 6 | 1234 | Std. Mean Difference (IV, Random, 95% CI) | ‐0.16 [‐0.41, 0.09] |
| 5.2 Short‐term outcome 9‐16 weeks | 9 | 3628 | Std. Mean Difference (IV, Random, 95% CI) | ‐0.26 [‐0.72, 0.20] |
| 5.3 Intermediate outcome 17‐24 weeks | 10 | 9944 | Std. Mean Difference (IV, Random, 95% CI) | 0.01 [‐0.03, 0.05] |
| 5.4 Long‐term outcome > 24 weeks | 7 | 2447 | Std. Mean Difference (IV, Random, 95% CI) | ‐0.17 [‐0.58, 0.25] |
| 6 Diagnosis of depression at 8, 16, 24, and > 24 weeks Show forest plot | 5 | Risk Ratio (M‐H, Random, 95% CI) | Subtotals only | |
| 6.1 Immediate outcomes 0‐8 weeks | 1 | 39 | Risk Ratio (M‐H, Random, 95% CI) | 0.09 [0.01, 1.47] |
| 6.2 Short‐term outcomes 9‐16 weeks postpartum | 4 | 902 | Risk Ratio (M‐H, Random, 95% CI) | 0.49 [0.31, 0.77] |
| 6.3 Intermediate outcome: 17‐24 weeks | 1 | 37 | Risk Ratio (M‐H, Random, 95% CI) | 0.64 [0.17, 2.46] |
| 7 Maternal mortality at > 24 weeks Show forest plot | 1 | 234 | Risk Ratio (M‐H, Random, 95% CI) | 0.97 [0.06, 15.27] |
| 8 Maternal‐infant attachment at 8, 16, and 24 weeks Show forest plot | 1 | Risk Ratio (M‐H, Random, 95% CI) | Subtotals only | |
| 8.1 Immediate outcomes 0‐8 weeks | 1 | 133 | Risk Ratio (M‐H, Random, 95% CI) | 1.01 [0.64, 1.59] |
| 8.2 Short‐term outcome 9‐16 weeks | 1 | 126 | Risk Ratio (M‐H, Random, 95% CI) | 1.29 [0.78, 2.13] |
| 8.3 Intermediate outcome 17‐24 weeks | 1 | 127 | Risk Ratio (M‐H, Random, 95% CI) | 0.89 [0.59, 1.34] |
| 9 Mean maternal‐infant attachment scores at 8, 16, 24, and > 24 weeks Show forest plot | 2 | Std. Mean Difference (IV, Random, 95% CI) | Subtotals only | |
| 9.1 Immediate outcomes 0‐8 weeks | 1 | 176 | Std. Mean Difference (IV, Random, 95% CI) | ‐0.11 [‐0.40, 0.19] |
| 9.2 Short‐term outcome 9‐16 weeks | 1 | 160 | Std. Mean Difference (IV, Random, 95% CI) | ‐0.20 [‐0.51, 0.11] |
| 9.3 Intermediate outcome 17‐24 weeks | 1 | 152 | Std. Mean Difference (IV, Random, 95% CI) | ‐0.22 [‐0.54, 0.10] |
| 9.4 Long‐term outcome > 24 weeks | 1 | 116 | Std. Mean Difference (IV, Random, 95% CI) | ‐0.12 [‐0.49, 0.24] |
| 9.5 At final study assessment | 2 | 268 | Std. Mean Difference (IV, Random, 95% CI) | ‐0.18 [‐0.42, 0.06] |
| 10 Anxiety at 8, 16, and 24 weeks Show forest plot | 4 | Risk Ratio (M‐H, Random, 95% CI) | Subtotals only | |
| 10.1 Immediate outcomes 0‐8 weeks | 2 | 245 | Risk Ratio (M‐H, Random, 95% CI) | 0.35 [0.05, 2.34] |
| 10.2 Short‐term outcome 9‐16 weeks | 3 | 843 | Risk Ratio (M‐H, Random, 95% CI) | 0.41 [0.12, 1.41] |
| 10.3 Intermediate outcome 17‐24 weeks | 1 | 130 | Risk Ratio (M‐H, Random, 95% CI) | 0.94 [0.25, 3.60] |
| 10.4 At final study assessment | 4 | 959 | Risk Ratio (M‐H, Random, 95% CI) | 0.40 [0.14, 1.14] |
| 11 Mean anxiety scores at 8, 16, 24, and > 24 weeks Show forest plot | 4 | Std. Mean Difference (IV, Random, 95% CI) | Subtotals only | |
| 11.1 Immediate outcomes 0‐8 weeks | 2 | 163 | Std. Mean Difference (IV, Random, 95% CI) | ‐0.09 [‐0.39, 0.22] |
| 11.2 Short‐term outcome 9‐16 weeks | 2 | 740 | Std. Mean Difference (IV, Random, 95% CI) | ‐0.15 [‐0.30, ‐0.01] |
| 11.3 Intermediate outcome 17‐24 weeks | 2 | 160 | Std. Mean Difference (IV, Random, 95% CI) | ‐0.24 [‐0.55, 0.07] |
| 11.4 Long‐term outcome > 24 weeks | 1 | 43 | Std. Mean Difference (IV, Random, 95% CI) | ‐0.17 [‐0.77, 0.43] |
| 11.5 At final study assessment | 4 | 815 | Std. Mean Difference (IV, Random, 95% CI) | ‐0.16 [‐0.30, ‐0.03] |
| 12 Maternal stress at 16 weeks Show forest plot | 1 | Risk Ratio (M‐H, Random, 95% CI) | Subtotals only | |
| 12.1 Short‐term outcome 9‐16 weeks | 1 | 103 | Risk Ratio (M‐H, Random, 95% CI) | 0.44 [0.20, 0.96] |
| 13 Mean maternal stress scores at 24 and > 24 weeks Show forest plot | 1 | Mean Difference (IV, Random, 95% CI) | Subtotals only | |
| 13.1 Intermediate outcome 17‐24 weeks | 1 | 787 | Mean Difference (IV, Random, 95% CI) | 0.0 [‐1.02, 1.02] |
| 13.2 Long‐term outcome > 24 weeks | 1 | 840 | Mean Difference (IV, Random, 95% CI) | 0.5 [‐0.51, 1.51] |
| 14 Mean parental stress scores at 8, 24, and > 24 weeks Show forest plot | 3 | Std. Mean Difference (IV, Random, 95% CI) | Subtotals only | |
| 14.1 Immediate outcomes 0‐8 weeks | 1 | 176 | Std. Mean Difference (IV, Random, 95% CI) | ‐0.08 [‐0.37, 0.22] |
| 14.2 Intermediate outcome 17‐24 weeks | 1 | 124 | Std. Mean Difference (IV, Random, 95% CI) | ‐0.27 [‐0.62, 0.09] |
| 14.3 Long‐term outcome > 24 weeks | 2 | 341 | Std. Mean Difference (IV, Random, 95% CI) | 0.27 [0.05, 0.48] |
| 14.4 At final study assessment | 3 | 465 | Std. Mean Difference (IV, Random, 95% CI) | 0.11 [‐0.25, 0.48] |
| 15 Perceived social support at 8 and 16 weeks Show forest plot | 2 | Risk Ratio (M‐H, Random, 95% CI) | Subtotals only | |
| 15.1 Immediate outcomes 0‐8 weeks | 1 | 528 | Risk Ratio (M‐H, Random, 95% CI) | 0.68 [0.45, 1.05] |
| 15.2 Short‐term outcome 9‐16 weeks | 1 | 190 | Risk Ratio (M‐H, Random, 95% CI) | 1.02 [0.34, 3.05] |
| 15.3 At final study assessment | 2 | 718 | Risk Ratio (M‐H, Random, 95% CI) | 0.72 [0.48, 1.08] |
| 16 Mean perceived social support scores at 8, 16, 24, and > 24 weeks Show forest plot | 7 | Std. Mean Difference (IV, Random, 95% CI) | Subtotals only | |
| 16.1 Immediate outcomes 0‐8 weeks | 3 | 822 | Std. Mean Difference (IV, Random, 95% CI) | 0.02 [‐0.13, 0.17] |
| 16.2 Short‐term outcome 9‐16 weeks | 2 | 863 | Std. Mean Difference (IV, Random, 95% CI) | 0.16 [‐0.21, 0.53] |
| 16.3 Intermediate outcome 17‐24 weeks | 6 | 8122 | Std. Mean Difference (IV, Random, 95% CI) | 0.03 [‐0.06, 0.12] |
| 16.4 Long‐term outcome > 24 weeks | 2 | 955 | Std. Mean Difference (IV, Random, 95% CI) | ‐0.07 [‐0.20, 0.06] |
| 16.5 At final study assessment | 7 | 8290 | Std. Mean Difference (IV, Random, 95% CI) | 0.01 [‐0.08, 0.10] |
| 17 Maternal dissatisfaction with care provided at 8, 16, and 24 weeks Show forest plot | 4 | Risk Ratio (M‐H, Random, 95% CI) | Subtotals only | |
| 17.1 Immediate outcomes 0‐8 weeks | 2 | 825 | Risk Ratio (M‐H, Random, 95% CI) | 0.56 [0.29, 1.09] |
| 17.2 Short‐term outcome 9‐16 weeks | 1 | 1278 | Risk Ratio (M‐H, Random, 95% CI) | 0.88 [0.65, 1.19] |
| 17.3 Intermediate outcome 17‐24 weeks | 1 | 911 | Risk Ratio (M‐H, Random, 95% CI) | 0.75 [0.44, 1.25] |
| 17.4 At final study assessment | 4 | 3014 | Risk Ratio (M‐H, Random, 95% CI) | 0.67 [0.44, 1.00] |
| 18 Mean maternal dissatisfaction scores at 8 and 16 weeks Show forest plot | 2 | Std. Mean Difference (IV, Random, 95% CI) | Subtotals only | |
| 18.1 Immediate outcomes 0‐8 weeks | 1 | 516 | Std. Mean Difference (IV, Random, 95% CI) | 0.0 [‐0.17, 0.17] |
| 18.2 Short‐term outcome 9‐16 weeks | 1 | 160 | Std. Mean Difference (IV, Random, 95% CI) | 0.90 [0.58, 1.23] |
| 18.3 At final study assessment | 2 | 676 | Std. Mean Difference (IV, Random, 95% CI) | 0.44 [‐0.44, 1.32] |
| 19 Infant health parameters ‐ not fully immunized at > 24 weeks Show forest plot | 1 | 884 | Risk Ratio (M‐H, Random, 95% CI) | 1.16 [0.39, 3.43] |
| 20 Infant development > 24 weeks Show forest plot | 1 | 280 | Mean Difference (IV, Random, 95% CI) | ‐0.90 [‐2.90, 1.10] |
| 20.1 Bayley (BSID‐II) | 1 | 280 | Mean Difference (IV, Random, 95% CI) | ‐0.90 [‐2.90, 1.10] |
| 21 Child abuse at 8 and > 24 weeks Show forest plot | 1 | Mean Difference (IV, Random, 95% CI) | Subtotals only | |
| 21.1 Immediate outcomes 0‐8 weeks | 1 | 176 | Mean Difference (IV, Random, 95% CI) | ‐35.66 [‐62.65, ‐8.67] |
| 21.2 Long‐term outcome > 24 weeks | 1 | 66 | Mean Difference (IV, Random, 95% CI) | ‐41.90 [‐87.48, 3.68] |
| 22 Mean marital discord scores at 8, 16, and 24 weeks Show forest plot | 3 | Std. Mean Difference (IV, Random, 95% CI) | Subtotals only | |
| 22.1 Immediate outcomes 0‐8 weeks | 2 | 163 | Std. Mean Difference (IV, Random, 95% CI) | ‐0.03 [‐0.34, 0.28] |
| 22.2 Short‐term outcome 9‐16 weeks | 1 | 127 | Std. Mean Difference (IV, Random, 95% CI) | ‐0.28 [‐0.63, 0.07] |
| 22.3 Intermediate outcome 17‐24 weeks | 3 | 291 | Std. Mean Difference (IV, Random, 95% CI) | ‐0.14 [‐0.37, 0.09] |
| 22.4 At final study assessment | 3 | 291 | Std. Mean Difference (IV, Random, 95% CI) | ‐0.14 [‐0.37, 0.09] |
| Outcome or subgroup title | No. of studies | No. of participants | Statistical method | Effect size |
| 1 All psychosocial interventions ‐ depressive symptomatology Show forest plot | 12 | Risk Ratio (M‐H, Random, 95% CI) | Subtotals only | |
| 1.1 Immediate outcome ‐ 0‐8 weeks | 6 | 2138 | Risk Ratio (M‐H, Random, 95% CI) | 0.77 [0.52, 1.14] |
| 1.2 Short‐term outcomes 9‐16 weeks | 8 | 3705 | Risk Ratio (M‐H, Random, 95% CI) | 0.80 [0.61, 1.06] |
| 1.3 Intermediate outcomes 17‐24 weeks | 6 | 8116 | Risk Ratio (M‐H, Random, 95% CI) | 0.88 [0.78, 1.00] |
| 1.4 Long‐term outcomes >24 weeks | 3 | 1385 | Risk Ratio (M‐H, Random, 95% CI) | 0.59 [0.46, 0.76] |
| 1.5 At final study assessment | 12 | 11322 | Risk Ratio (M‐H, Random, 95% CI) | 0.83 [0.70, 0.99] |
| 2 All psychosocial interventions ‐ mean depression scores Show forest plot | 12 | Std. Mean Difference (IV, Random, 95% CI) | Subtotals only | |
| 2.1 Immediate outcomes 0‐8 weeks | 3 | 849 | Std. Mean Difference (IV, Random, 95% CI) | ‐0.12 [‐0.47, 0.23] |
| 2.2 Short‐term outcomes 9‐16 weeks | 6 | 3333 | Std. Mean Difference (IV, Random, 95% CI) | ‐0.32 [‐0.90, 0.25] |
| 2.3 Intermediate outcomes 17‐24 weeks | 8 | 8998 | Std. Mean Difference (IV, Random, 95% CI) | 0.00 [‐0.04, 0.05] |
| 2.4 Long‐term outcomes > 24 weeks | 5 | 2254 | Std. Mean Difference (IV, Random, 95% CI) | ‐0.26 [‐0.76, 0.24] |
| 2.5 At final study assessment | 12 | 10944 | Std. Mean Difference (IV, Random, 95% CI) | ‐0.14 [‐0.33, 0.04] |
| 3 All psychosocial interventions ‐ diagnosis of depression Show forest plot | 3 | Risk Ratio (M‐H, Fixed, 95% CI) | Subtotals only | |
| 3.1 Short‐term outcomes 9‐16 weeks | 3 | 867 | Risk Ratio (M‐H, Fixed, 95% CI) | 0.52 [0.33, 0.83] |
| 4 All psychosocial interventions: depressive symptomatology at final study assessment Show forest plot | 12 | 11322 | Risk Ratio (M‐H, Random, 95% CI) | 0.83 [0.70, 0.99] |
| 5 All psychosocial interventions: mean depression scores Show forest plot | 12 | 10944 | Std. Mean Difference (IV, Random, 95% CI) | ‐0.14 [‐0.33, 0.04] |
| Outcome or subgroup title | No. of studies | No. of participants | Statistical method | Effect size |
| 1 All psychological interventions ‐ depressive symptomatology Show forest plot | 8 | Risk Ratio (M‐H, Random, 95% CI) | Subtotals only | |
| 1.1 Immediate outcomes 0‐8 weeks | 7 | 2760 | Risk Ratio (M‐H, Random, 95% CI) | 0.69 [0.47, 1.02] |
| 1.2 Short‐term outcomes 9‐16 weeks | 2 | 277 | Risk Ratio (M‐H, Random, 95% CI) | 0.40 [0.18, 0.89] |
| 1.3 Intermediate outcomes 17‐24 weeks | 3 | 2520 | Risk Ratio (M‐H, Random, 95% CI) | 1.04 [0.83, 1.30] |
| 1.4 Long‐term outcomes >24 weeks | 2 | 1551 | Risk Ratio (M‐H, Random, 95% CI) | 0.86 [0.58, 1.28] |
| 1.5 At final study assessment | 8 | 3405 | Risk Ratio (M‐H, Random, 95% CI) | 0.61 [0.39, 0.96] |
| 2 All psychological interventions ‐ mean depression scores Show forest plot | 7 | Std. Mean Difference (IV, Random, 95% CI) | Subtotals only | |
| 2.1 immediate outcome 0‐8 weeks | 3 | 385 | Std. Mean Difference (IV, Random, 95% CI) | ‐0.20 [‐0.63, 0.22] |
| 2.2 Short‐term outcomes 9‐16 weeks | 3 | 295 | Std. Mean Difference (IV, Random, 95% CI) | ‐0.03 [‐0.27, 0.21] |
| 2.3 Intermediate outcomes 17‐24 weeks | 2 | 946 | Std. Mean Difference (IV, Random, 95% CI) | 0.08 [‐0.05, 0.20] |
| 2.4 Long‐term outcomes > 24 weeks | 2 | 193 | Std. Mean Difference (IV, Random, 95% CI) | 0.11 [‐0.17, 0.39] |
| 2.5 At final study assessment | 7 | 1432 | Std. Mean Difference (IV, Random, 95% CI) | ‐0.10 [‐0.32, 0.13] |
| 3 All psychological interventions ‐ diagnosis of depression Show forest plot | 2 | Risk Ratio (M‐H, Random, 95% CI) | Subtotals only | |
| 3.1 Diagnosis of depression ‐ 0‐8 weeks | 1 | 39 | Risk Ratio (M‐H, Random, 95% CI) | 0.09 [0.01, 1.47] |
| 3.2 Short‐term outcomes 9‐16 weeks | 1 | 35 | Risk Ratio (M‐H, Random, 95% CI) | 0.08 [0.00, 1.34] |
| 3.3 Intermediate outcomes 17‐24 weeks | 1 | 37 | Risk Ratio (M‐H, Random, 95% CI) | 0.64 [0.17, 2.46] |
| 3.4 At final study assessment | 2 | 72 | Risk Ratio (M‐H, Random, 95% CI) | 0.31 [0.04, 2.52] |
| Outcome or subgroup title | No. of studies | No. of participants | Statistical method | Effect size |
| 1 TEST FOR SUBGROUP DIFFERENCES: depressive symptomatology at final study assessment Show forest plot | 12 | 11322 | Risk Ratio (M‐H, Random, 95% CI) | 0.83 [0.70, 0.99] |
| 1.1 Antenatal and postnatal classes | 4 | 1488 | Risk Ratio (M‐H, Random, 95% CI) | 1.01 [0.77, 1.32] |
| 1.2 Postpartum professional‐based home visits | 2 | 1262 | Risk Ratio (M‐H, Random, 95% CI) | 0.56 [0.43, 0.73] |
| 1.3 Postpartum lay‐based home visits | 1 | 493 | Risk Ratio (M‐H, Random, 95% CI) | 0.88 [0.62, 1.25] |
| 1.4 Postpartum lay‐based telephone support | 1 | 612 | Risk Ratio (M‐H, Random, 95% CI) | 0.54 [0.38, 0.77] |
| 1.5 Early postpartum follow‐up | 1 | 446 | Risk Ratio (M‐H, Random, 95% CI) | 0.90 [0.55, 1.49] |
| 1.6 Continuity model of care | 3 | 7021 | Risk Ratio (M‐H, Random, 95% CI) | 0.99 [0.71, 1.36] |
| 2 TEST FOR SUBGROUP DIFFERENCES: mean depression score at final study assessment Show forest plot | 4 | 1411 | Std. Mean Difference (IV, Fixed, 95% CI) | ‐0.01 [‐0.12, 0.10] |
| 2.1 Antenatal and postnatal classes | 3 | 1124 | Std. Mean Difference (IV, Fixed, 95% CI) | 0.01 [‐0.11, 0.13] |
| 2.2 Antenatal and postnatal lay‐based home visits and telephone support | 1 | 287 | Std. Mean Difference (IV, Fixed, 95% CI) | ‐0.10 [‐0.33, 0.14] |
| Outcome or subgroup title | No. of studies | No. of participants | Statistical method | Effect size |
| 1 TEST FOR SUBGROUP DIFFERENCES: depressive symptomatology at final study assessment Show forest plot | 6 | 3200 | Risk Ratio (M‐H, Random, 95% CI) | 0.59 [0.35, 1.01] |
| 1.1 Psychological debriefing | 5 | 3050 | Risk Ratio (M‐H, Random, 95% CI) | 0.57 [0.31, 1.03] |
| 1.2 Cognitive behavioural therapy | 1 | 150 | Risk Ratio (M‐H, Random, 95% CI) | 0.74 [0.29, 1.88] |
| 2 TEST FOR SUBGROUP DIFFERENCES: mean depression score at final study assessment Show forest plot | 6 | 516 | Std. Mean Difference (IV, Random, 95% CI) | ‐0.16 [‐0.43, 0.11] |
| 2.1 Interpersonal psychotherapy | 5 | 366 | Std. Mean Difference (IV, Random, 95% CI) | ‐0.27 [‐0.52, ‐0.01] |
| 2.2 Cognitive behavioural therapy | 1 | 150 | Std. Mean Difference (IV, Random, 95% CI) | 0.13 [‐0.20, 0.45] |
| Outcome or subgroup title | No. of studies | No. of participants | Statistical method | Effect size |
| 1 Professionally‐based interventions ‐ depressive symptomatology Show forest plot | 15 | Risk Ratio (M‐H, Random, 95% CI) | Subtotals only | |
| 1.1 Immediate outcomes 0‐8 weeks | 10 | 3699 | Risk Ratio (M‐H, Random, 95% CI) | 0.65 [0.45, 0.93] |
| 1.2 Short‐term outcome 9‐16 weeks | 8 | 3196 | Risk Ratio (M‐H, Random, 95% CI) | 0.79 [0.57, 1.09] |
| 1.3 Intermediate outcome 17‐24 weeks | 7 | 3929 | Risk Ratio (M‐H, Random, 95% CI) | 1.03 [0.87, 1.23] |
| 1.4 Long‐term outcome > 24 weeks | 4 | 2786 | Risk Ratio (M‐H, Random, 95% CI) | 0.68 [0.51, 0.90] |
| 2 Professionally‐based interventions ‐ mean depression scores Show forest plot | 12 | Std. Mean Difference (IV, Random, 95% CI) | Subtotals only | |
| 2.1 Immediate outcomes: 0‐8 weeks | 4 | 512 | Std. Mean Difference (IV, Random, 95% CI) | ‐0.34 [‐0.56, ‐0.12] |
| 2.2 Short‐term outcome 9‐16 weeks | 6 | 2807 | Std. Mean Difference (IV, Random, 95% CI) | ‐0.31 [‐0.95, 0.34] |
| 2.3 Intermediate outcome 17‐24 weeks | 7 | 3161 | Std. Mean Difference (IV, Random, 95% CI) | 0.02 [‐0.05, 0.09] |
| 2.4 Long‐term outcome >24 weeks | 5 | 2010 | Std. Mean Difference (IV, Random, 95% CI) | ‐0.24 [‐0.79, 0.31] |
| 3 Professionally‐based interventions ‐ diagnosis of depression Show forest plot | 2 | Risk Ratio (M‐H, Fixed, 95% CI) | Subtotals only | |
| 3.1 Immediate outcomes 0‐8 weeks | 1 | 39 | Risk Ratio (M‐H, Fixed, 95% CI) | 0.09 [0.01, 1.47] |
| 3.2 Short‐term outcomes 9‐16 weeks postpartum | 1 | 190 | Risk Ratio (M‐H, Fixed, 95% CI) | 0.51 [0.13, 1.98] |
| 3.3 Intermediate outcome: 17‐24 weeks | 1 | 37 | Risk Ratio (M‐H, Fixed, 95% CI) | 0.64 [0.17, 2.46] |
| 4 Lay‐based interventions ‐ depressive symptomatology Show forest plot | 4 | Risk Ratio (M‐H, Fixed, 95% CI) | Subtotals only | |
| 4.1 Immediate outcomes 0‐8 weeks | 3 | 1208 | Risk Ratio (M‐H, Fixed, 95% CI) | 0.91 [0.70, 1.18] |
| 4.2 Short‐term outcome 9‐16 weeks | 2 | 786 | Risk Ratio (M‐H, Fixed, 95% CI) | 0.55 [0.40, 0.75] |
| 4.3 Intermediate outcome 17‐24 weeks | 1 | 493 | Risk Ratio (M‐H, Fixed, 95% CI) | 0.88 [0.62, 1.25] |
| 4.4 Long‐term outcome > 24 weeks | 1 | 150 | Risk Ratio (M‐H, Fixed, 95% CI) | 0.74 [0.29, 1.88] |
| 5 Lay‐based interventions ‐ mean depression scores Show forest plot | 5 | Std. Mean Difference (IV, Random, 95% CI) | Subtotals only | |
| 5.1 Immediate outcomes: 0‐8 weeks | 2 | 722 | Std. Mean Difference (IV, Random, 95% CI) | 0.11 [‐0.04, 0.25] |
| 5.2 Short‐term outcome 9‐16 weeks | 2 | 786 | Std. Mean Difference (IV, Random, 95% CI) | ‐0.08 [‐0.35, 0.19] |
| 5.3 Intermediate outcome 17‐24 weeks | 2 | 633 | Std. Mean Difference (IV, Random, 95% CI) | ‐0.06 [‐0.22, 0.09] |
| 5.4 Long‐term outcome > 24 weeks | 2 | 437 | Std. Mean Difference (IV, Random, 95% CI) | ‐0.01 [‐0.22, 0.20] |
| 6 Lay‐based interventions ‐ diagnosis of depression Show forest plot | 2 | Risk Ratio (M‐H, Fixed, 95% CI) | Subtotals only | |
| 6.1 Short‐term outcomes 9‐16 weeks postpartum | 2 | 677 | Risk Ratio (M‐H, Fixed, 95% CI) | 0.52 [0.32, 0.86] |
| 7 TEST FOR SUBGROUP DIFFERENCES: depressive symptomatology: at final study assessment Show forest plot | 19 | Risk Ratio (M‐H, Random, 95% CI) | Subtotals only | |
| 7.1 Professionally‐based interventions | 15 | 6790 | Risk Ratio (M‐H, Random, 95% CI) | 0.78 [0.60, 1.00] |
| 7.2 Lay‐based interventions | 4 | 1723 | Risk Ratio (M‐H, Random, 95% CI) | 0.70 [0.54, 0.90] |
| 8 TEST FOR SUBGROUP DIFFERENCES: mean depression scores: at final study assessment Show forest plot | 17 | Std. Mean Difference (IV, Random, 95% CI) | Subtotals only | |
| 8.1 Professionally‐based interventions | 12 | 4509 | Std. Mean Difference (IV, Random, 95% CI) | ‐0.15 [‐0.40, 0.10] |
| 8.2 Lay‐based interventions | 5 | 1682 | Std. Mean Difference (IV, Random, 95% CI) | ‐0.10 [‐0.20, 0.01] |
| 9 TEST FOR SUBGROUP DIFFERENCES: diagnosis of depression: at final study assessment Show forest plot | 4 | Risk Ratio (M‐H, Fixed, 95% CI) | Subtotals only | |
| 9.1 Professionally‐based interventions | 2 | 227 | Risk Ratio (M‐H, Fixed, 95% CI) | 0.56 [0.22, 1.47] |
| 9.2 Lay‐based interventions | 2 | 677 | Risk Ratio (M‐H, Fixed, 95% CI) | 0.52 [0.32, 0.86] |
| Outcome or subgroup title | No. of studies | No. of participants | Statistical method | Effect size |
| 1 TEST FOR SUBGROUP DIFFERENCES: depressive symptomatology at final study assessment Show forest plot | 15 | Risk Ratio (M‐H, Random, 95% CI) | Subtotals only | |
| 1.1 Intervention provided by nurses | 3 | 837 | Risk Ratio (M‐H, Random, 95% CI) | 0.73 [0.51, 1.04] |
| 1.2 Intervention provided by physicians | 1 | 446 | Risk Ratio (M‐H, Random, 95% CI) | 0.90 [0.55, 1.49] |
| 1.3 Intervention provided by midwives | 10 | 5477 | Risk Ratio (M‐H, Random, 95% CI) | 0.76 [0.54, 1.07] |
| 1.4 Intervention provided by mental health specialists | 1 | 30 | Risk Ratio (M‐H, Random, 95% CI) | 1.0 [0.24, 4.18] |
| 2 TEST FOR SUBGROUP DIFFERENCES: mean depression score at final study assessment Show forest plot | 4 | Std. Mean Difference (IV, Fixed, 95% CI) | Subtotals only | |
| 2.1 Intervention provided by nurses | 1 | 86 | Std. Mean Difference (IV, Fixed, 95% CI) | ‐0.08 [‐0.51, 0.34] |
| 2.2 Intervention provided by midwives | 1 | 840 | Std. Mean Difference (IV, Fixed, 95% CI) | 0.05 [‐0.09, 0.19] |
| 2.3 Intervention provided by mental health specialists | 2 | 175 | Std. Mean Difference (IV, Fixed, 95% CI) | 0.04 [‐0.26, 0.34] |
| Outcome or subgroup title | No. of studies | No. of participants | Statistical method | Effect size |
| 1 Individually‐based interventions ‐ depressive symptomatology Show forest plot | 14 | Risk Ratio (M‐H, Random, 95% CI) | Subtotals only | |
| 1.1 Immediate outcomes 0‐8 weeks | 9 | 3947 | Risk Ratio (M‐H, Random, 95% CI) | 0.70 [0.49, 1.00] |
| 1.2 Short‐term outcomes 9‐16 weeks | 6 | 2757 | Risk Ratio (M‐H, Random, 95% CI) | 0.66 [0.47, 0.91] |
| 1.3 Intermediate outcomes 17‐24 weeks | 7 | 9806 | Risk Ratio (M‐H, Random, 95% CI) | 0.88 [0.80, 0.98] |
| 1.4 Long‐term outcomes > 24 weeks | 4 | 2786 | Risk Ratio (M‐H, Random, 95% CI) | 0.68 [0.51, 0.90] |
| 2 Individually‐based interventions ‐ mean depression scores Show forest plot | 11 | Std. Mean Difference (IV, Random, 95% CI) | Subtotals only | |
| 2.1 Immediate outcomes 0‐8 weeks | 4 | 882 | Std. Mean Difference (IV, Random, 95% CI) | ‐0.11 [‐0.41, 0.19] |
| 2.2 Short‐term outcomes 9‐16 weeks | 5 | 2601 | Std. Mean Difference (IV, Random, 95% CI) | ‐0.40 [‐1.07, 0.26] |
| 2.3 Intermediate outcomes 17‐24 weeks | 6 | 8156 | Std. Mean Difference (IV, Random, 95% CI) | 0.01 [‐0.03, 0.05] |
| 2.4 Long‐term outcomes > 24 weeks | 5 | 1457 | Std. Mean Difference (IV, Random, 95% CI) | ‐0.28 [‐0.78, 0.23] |
| 3 Individually‐based interventions ‐ diagnosis of depression Show forest plot | 3 | Risk Ratio (M‐H, Fixed, 95% CI) | Subtotals only | |
| 3.1 Immediate outcomes 0‐8 weeks | 1 | 39 | Risk Ratio (M‐H, Fixed, 95% CI) | 0.09 [0.01, 1.47] |
| 3.2 Short‐term outcomes 9‐16 weeks | 2 | 677 | Risk Ratio (M‐H, Fixed, 95% CI) | 0.52 [0.32, 0.86] |
| 3.3 Intermediate outcomes 17‐24 weeks | 1 | 37 | Risk Ratio (M‐H, Fixed, 95% CI) | 0.64 [0.17, 2.46] |
| 4 Group‐based interventions ‐ depressive symptomatology Show forest plot | 6 | Risk Ratio (M‐H, Random, 95% CI) | Subtotals only | |
| 4.1 Immediate outcomes 0‐8 weeks | 4 | 946 | Risk Ratio (M‐H, Random, 95% CI) | 0.64 [0.45, 0.91] |
| 4.2 Short‐term outcomes 9‐16 weeks | 4 | 1225 | Risk Ratio (M‐H, Random, 95% CI) | 0.91 [0.60, 1.39] |
| 4.3 Intermediate outcomes 17‐24 weeks | 2 | 830 | Risk Ratio (M‐H, Random, 95% CI) | 1.20 [0.85, 1.71] |
| 4.4 Long‐term outcomes > 24 weeks | 1 | 150 | Risk Ratio (M‐H, Random, 95% CI) | 0.74 [0.29, 1.88] |
| 5 Group‐based interventions ‐ mean depression scores Show forest plot | 8 | Std. Mean Difference (IV, Random, 95% CI) | Subtotals only | |
| 5.1 Immediate outcomes 0‐8 weeks | 2 | 352 | Std. Mean Difference (IV, Random, 95% CI) | ‐0.24 [‐0.80, 0.31] |
| 5.2 Short‐term outcomes 9‐16 weeks | 4 | 1027 | Std. Mean Difference (IV, Random, 95% CI) | 0.04 [‐0.09, 0.16] |
| 5.3 Intermediate outcomes 17‐24 weeks | 4 | 1788 | Std. Mean Difference (IV, Random, 95% CI) | 0.01 [‐0.08, 0.11] |
| 5.4 Long‐term outcomes > 24 weeks | 2 | 990 | Std. Mean Difference (IV, Random, 95% CI) | 0.06 [‐0.07, 0.19] |
| 6 Group‐based interventions ‐ diagnosis of depression Show forest plot | 2 | Risk Ratio (M‐H, Random, 95% CI) | Subtotals only | |
| 6.1 Short‐term outcomes 9‐16 weeks | 2 | 225 | Risk Ratio (M‐H, Random, 95% CI) | 0.30 [0.05, 1.66] |
| 7 TEST FOR SUBGROUP DIFFERENCES: depressive symptomatology: at final study assessment Show forest plot | 20 | 14727 | Risk Ratio (M‐H, Random, 95% CI) | 0.78 [0.66, 0.93] |
| 7.1 Individually‐based interventions | 14 | 12914 | Risk Ratio (M‐H, Random, 95% CI) | 0.75 [0.61, 0.92] |
| 7.2 Group‐based interventions | 6 | 1813 | Risk Ratio (M‐H, Random, 95% CI) | 0.92 [0.71, 1.19] |
| 8 TEST FOR SUBGROUP DIFFERENCES: mean depression scores: at final study assessment Show forest plot | 19 | 12376 | Std. Mean Difference (IV, Random, 95% CI) | ‐0.13 [‐0.28, 0.01] |
| 8.1 Individually‐based interventions | 11 | 10092 | Std. Mean Difference (IV, Random, 95% CI) | ‐0.15 [‐0.37, 0.07] |
| 8.2 Group‐based interventions | 8 | 2284 | Std. Mean Difference (IV, Random, 95% CI) | ‐0.08 [‐0.23, 0.06] |
| 9 TEST FOR SUBGROUP DIFFERENCES: diagnosis of depression: at final study assessment Show forest plot | 5 | 939 | Risk Ratio (M‐H, Random, 95% CI) | 0.50 [0.32, 0.78] |
| 9.1 Individually‐based interventions | 3 | 714 | Risk Ratio (M‐H, Random, 95% CI) | 0.53 [0.33, 0.84] |
| 9.2 Group‐based interventions | 2 | 225 | Risk Ratio (M‐H, Random, 95% CI) | 0.30 [0.05, 1.66] |
| Outcome or subgroup title | No. of studies | No. of participants | Statistical method | Effect size |
| 1 Single‐contact interventions ‐ depressive symptomatology Show forest plot | 4 | Risk Ratio (M‐H, Random, 95% CI) | Subtotals only | |
| 1.1 Immediate outcomes 0‐8 weeks | 2 | 1756 | Risk Ratio (M‐H, Random, 95% CI) | 0.39 [0.07, 2.16] |
| 1.2 Short‐term outcomes 9‐16 weeks | 1 | 476 | Risk Ratio (M‐H, Random, 95% CI) | 1.24 [0.81, 1.91] |
| 1.3 Intermediate outcomes 17‐24 weeks | 3 | 2936 | Risk Ratio (M‐H, Random, 95% CI) | 1.01 [0.82, 1.26] |
| 1.4 Long‐term outcomes > 24 weeks | 1 | 1401 | Risk Ratio (M‐H, Random, 95% CI) | 0.89 [0.58, 1.37] |
| 2 Single‐contact interventions ‐ mean depression scores Show forest plot | 2 | Mean Difference (IV, Fixed, 95% CI) | Subtotals only | |
| 2.1 Short‐term outcomes 9‐16 weeks | 1 | 476 | Mean Difference (IV, Fixed, 95% CI) | ‐0.10 [‐1.06, 0.86] |
| 2.2 Intermediate outcomes 17‐24 weeks | 2 | 1362 | Mean Difference (IV, Fixed, 95% CI) | 0.21 [‐0.37, 0.79] |
| 3 Multiple‐contact interventions ‐ depressive symptomatology Show forest plot | 16 | Risk Ratio (M‐H, Random, 95% CI) | Subtotals only | |
| 3.1 Immediate outcomes 0‐8 weeks | 11 | 3137 | Risk Ratio (M‐H, Random, 95% CI) | 0.77 [0.60, 0.99] |
| 3.2 Short‐term outcomes 9‐16 weeks | 9 | 3506 | Risk Ratio (M‐H, Random, 95% CI) | 0.69 [0.52, 0.91] |
| 3.3 Intermediate outcomes 17‐24 weeks | 6 | 7700 | Risk Ratio (M‐H, Random, 95% CI) | 0.89 [0.77, 1.01] |
| 3.4 Long‐term outcomes > 24 weeks | 4 | 1535 | Risk Ratio (M‐H, Random, 95% CI) | 0.60 [0.47, 0.76] |
| 4 Multiple‐contact interventions ‐ mean depression scores Show forest plot | 17 | Std. Mean Difference (IV, Random, 95% CI) | Subtotals only | |
| 4.1 Immediate outcomes 0‐8 weeks | 6 | 1234 | Std. Mean Difference (IV, Random, 95% CI) | ‐0.16 [‐0.41, 0.09] |
| 4.2 Short‐term outcomes 9‐16 weeks | 8 | 3152 | Std. Mean Difference (IV, Random, 95% CI) | ‐0.30 [‐0.81, 0.22] |
| 4.3 Intermediate outcomes 17‐24 weeks | 8 | 8582 | Std. Mean Difference (IV, Random, 95% CI) | 0.01 [‐0.04, 0.05] |
| 4.4 Long‐term outcomes > 24 weeks | 7 | 2447 | Std. Mean Difference (IV, Random, 95% CI) | ‐0.17 [‐0.58, 0.25] |
| 5 Multiple‐contact interventions ‐ diagnosis of depression Show forest plot | 5 | Risk Ratio (M‐H, Fixed, 95% CI) | Subtotals only | |
| 5.1 Immediate outcomes 0‐8 weeks | 1 | 39 | Risk Ratio (M‐H, Fixed, 95% CI) | 0.09 [0.01, 1.47] |
| 5.2 Short‐term outcomes 9‐16 weeks | 4 | 902 | Risk Ratio (M‐H, Fixed, 95% CI) | 0.47 [0.30, 0.74] |
| 5.3 Intermediate outcomes 17‐24 weeks | 1 | 37 | Risk Ratio (M‐H, Fixed, 95% CI) | 0.64 [0.17, 2.46] |
| 5.4 At final study assessment | 5 | 939 | Risk Ratio (M‐H, Fixed, 95% CI) | 0.48 [0.31, 0.74] |
| 6 TEST FOR SUBGROUP DIFFERENCES: depressive symptomatology: at final study assessment Show forest plot | 20 | 14727 | Risk Ratio (M‐H, Random, 95% CI) | 0.78 [0.66, 0.93] |
| 6.1 Single contact intervention | 4 | 2877 | Risk Ratio (M‐H, Random, 95% CI) | 0.70 [0.38, 1.28] |
| 6.2 Multiple contact intervention | 16 | 11850 | Risk Ratio (M‐H, Random, 95% CI) | 0.78 [0.66, 0.93] |
| 7 TEST FOR SUBGROUP DIFFERENCES: mean depression scores: at final study assessment Show forest plot | 19 | 12376 | Std. Mean Difference (IV, Random, 95% CI) | ‐0.13 [‐0.28, 0.01] |
| 7.1 Single contact intervention | 2 | 1362 | Std. Mean Difference (IV, Random, 95% CI) | 0.04 [‐0.07, 0.15] |
| 7.2 Multiple contact intervention | 17 | 11014 | Std. Mean Difference (IV, Random, 95% CI) | ‐0.15 [‐0.32, 0.02] |
| Outcome or subgroup title | No. of studies | No. of participants | Statistical method | Effect size |
| 1 Interventions with antenatal only component ‐ mean depression scores Show forest plot | 4 | Std. Mean Difference (IV, Fixed, 95% CI) | Subtotals only | |
| 1.1 Short‐term outcomes 9‐16 weeks | 1 | 35 | Std. Mean Difference (IV, Fixed, 95% CI) | ‐0.44 [‐1.11, 0.23] |
| 1.2 Intermediate outcomes 17‐24 weeks | 2 | 919 | Std. Mean Difference (IV, Fixed, 95% CI) | 0.06 [‐0.07, 0.19] |
| 1.3 Long‐term outcomes > 24 weeks | 2 | 883 | Std. Mean Difference (IV, Fixed, 95% CI) | 0.05 [‐0.09, 0.19] |
| 2 Interventions with antenatal only component ‐ diagnosis of depression Show forest plot | 1 | Risk Ratio (M‐H, Fixed, 95% CI) | Subtotals only | |
| 2.1 Short‐term outcomes 9‐16 weeks | 1 | 35 | Risk Ratio (M‐H, Fixed, 95% CI) | 0.08 [0.00, 1.34] |
| 3 Interventions with antenatal and postnatal components ‐ depressive symptomatology Show forest plot | 8 | Risk Ratio (M‐H, Random, 95% CI) | Subtotals only | |
| 3.1 Immediate outcomes 0‐8 weeks | 7 | 1794 | Risk Ratio (M‐H, Random, 95% CI) | 0.75 [0.52, 1.08] |
| 3.2 Short‐term outcomes 9‐16 weeks | 4 | 621 | Risk Ratio (M‐H, Random, 95% CI) | 0.66 [0.45, 0.97] |
| 3.3 Intermediate outcomes 17‐24 weeks | 3 | 284 | Risk Ratio (M‐H, Random, 95% CI) | 0.87 [0.41, 1.85] |
| 3.4 Long‐term outcomes > 24 weeks | 2 | 273 | Risk Ratio (M‐H, Random, 95% CI) | 0.82 [0.46, 1.46] |
| 4 Interventions with antenatal and postnatal components ‐ mean depression scores Show forest plot | 7 | Std. Mean Difference (IV, Random, 95% CI) | Subtotals only | |
| 4.1 Immediate outcomes 0‐8 weeks | 4 | 518 | Std. Mean Difference (IV, Random, 95% CI) | ‐0.18 [‐0.47, 0.11] |
| 4.2 Short‐term outcomes 9‐16 weeks | 3 | 388 | Std. Mean Difference (IV, Random, 95% CI) | ‐0.05 [‐0.25, 0.15] |
| 4.3 Intermediate outcomes 17‐24 weeks | 3 | 315 | Std. Mean Difference (IV, Random, 95% CI) | ‐0.22 [‐0.45, ‐0.00] |
| 4.4 Long‐term outcomes > 24 weeks | 3 | 560 | Std. Mean Difference (IV, Random, 95% CI) | ‐0.03 [‐0.20, 0.13] |
| 5 Interventions with antenatal and postnatal components ‐ diagnosis of depression Show forest plot | 3 | Risk Ratio (M‐H, Fixed, 95% CI) | Subtotals only | |
| 5.1 Immediate outcomes 0‐8 weeks | 1 | 39 | Risk Ratio (M‐H, Fixed, 95% CI) | 0.09 [0.01, 1.47] |
| 5.2 Short‐term outcomes 9‐16 weeks | 2 | 255 | Risk Ratio (M‐H, Fixed, 95% CI) | 0.40 [0.21, 0.79] |
| 5.3 Intermediate outcomes 17‐24 weeks | 1 | 37 | Risk Ratio (M‐H, Fixed, 95% CI) | 0.64 [0.17, 2.46] |
| 6 Interventions with postnatal only component ‐ depressive symptomatology Show forest plot | 12 | Risk Ratio (M‐H, Random, 95% CI) | Subtotals only | |
| 6.1 Immediate outcomes 0‐8 weeks | 6 | 3099 | Risk Ratio (M‐H, Random, 95% CI) | 0.63 [0.41, 0.98] |
| 6.2 Short‐term outcomes 9‐16 weeks | 6 | 3361 | Risk Ratio (M‐H, Random, 95% CI) | 0.76 [0.53, 1.11] |
| 6.3 Intermediate outcomes 17‐24 weeks | 6 | 10352 | Risk Ratio (M‐H, Random, 95% CI) | 0.93 [0.82, 1.06] |
| 6.4 Long‐term outcomes >24 weeks | 3 | 2663 | Risk Ratio (M‐H, Random, 95% CI) | 0.66 [0.46, 0.93] |
| 7 Interventions with postnatal only component ‐ mean depression scores Show forest plot | 8 | Std. Mean Difference (IV, Random, 95% CI) | Subtotals only | |
| 7.1 Immediate outcomes 0‐8 weeks | 2 | 716 | Std. Mean Difference (IV, Random, 95% CI) | ‐0.14 [‐0.69, 0.42] |
| 7.2 Short‐term outcomes 9‐16 weeks | 5 | 3205 | Std. Mean Difference (IV, Random, 95% CI) | ‐0.35 [1.00, 0.31] |
| 7.3 Intermediate outcomes 17‐24 weeks | 5 | 8710 | Std. Mean Difference (IV, Random, 95% CI) | 0.01 [‐0.03, 0.06] |
| 7.4 Long‐term outcomes > 24 weeks | 2 | 1004 | Std. Mean Difference (IV, Random, 95% CI) | ‐0.59 [‐1.39, 0.21] |
| 8 Interventions with postnatal only component ‐ diagnosis of depression Show forest plot | 1 | Risk Ratio (M‐H, Fixed, 95% CI) | Subtotals only | |
| 8.1 Short‐term outcomes 9‐16 weeks | 1 | 612 | Risk Ratio (M‐H, Fixed, 95% CI) | 0.65 [0.34, 1.23] |
| 9 TEST FOR SUBGROUP DIFFERENCES: depressive symptomatology: at final study assessment Show forest plot | 20 | 14727 | Risk Ratio (M‐H, Random, 95% CI) | 0.78 [0.66, 0.93] |
| 9.1 Antenatal and postnatal intervention | 8 | 1941 | Risk Ratio (M‐H, Random, 95% CI) | 0.96 [0.75, 1.22] |
| 9.2 Postnatal intervention only | 12 | 12786 | Risk Ratio (M‐H, Random, 95% CI) | 0.73 [0.59, 0.90] |
| 10 TEST FOR SUBGROUP DIFFERENCES: mean depression scores: at final study assessment Show forest plot | 19 | 12376 | Std. Mean Difference (IV, Random, 95% CI) | ‐0.13 [‐0.28, 0.01] |
| 10.1 Antenatal intervention only | 4 | 1050 | Std. Mean Difference (IV, Random, 95% CI) | 0.03 [‐0.09, 0.16] |
| 10.2 Antenatal and postnatal intervention | 7 | 1000 | Std. Mean Difference (IV, Random, 95% CI) | ‐0.14 [‐0.31, 0.02] |
| 10.3 Postnatal intervention only | 8 | 10326 | Std. Mean Difference (IV, Random, 95% CI) | ‐0.16 [‐0.40, 0.08] |
| 11 TEST FOR SUBGROUP DIFFERENCES: diagnosis of depression: at final study assessment Show forest plot | 5 | 939 | Risk Ratio (M‐H, Fixed, 95% CI) | 0.48 [0.31, 0.74] |
| 11.1 Antenatal intervention only | 1 | 35 | Risk Ratio (M‐H, Fixed, 95% CI) | 0.08 [0.00, 1.34] |
| 11.2 Antenatal and postnatal intervention | 3 | 292 | Risk Ratio (M‐H, Fixed, 95% CI) | 0.44 [0.24, 0.80] |
| 11.3 Postnatal intervention only | 1 | 612 | Risk Ratio (M‐H, Fixed, 95% CI) | 0.65 [0.34, 1.23] |
| Outcome or subgroup title | No. of studies | No. of participants | Statistical method | Effect size |
| 1 Interventions for at‐risk women ‐ depressive symptomatology Show forest plot | 9 | Risk Ratio (M‐H, Random, 95% CI) | Subtotals only | |
| 1.1 Immediate outcomes 0‐8 weeks | 7 | 1301 | Risk Ratio (M‐H, Random, 95% CI) | 0.67 [0.51, 0.88] |
| 1.2 Short‐term outcomes 9‐16 weeks | 6 | 1368 | Risk Ratio (M‐H, Random, 95% CI) | 0.59 [0.47, 0.75] |
| 1.3 Intermediate outcomes 17‐24 weeks | 2 | 151 | Risk Ratio (M‐H, Random, 95% CI) | 1.34 [0.60, 2.98] |
| 1.4 Long‐term outcomes > 24 weeks | 2 | 281 | Risk Ratio (M‐H, Random, 95% CI) | 0.60 [0.29, 1.24] |
| 2 Interventions for at‐risk women ‐ mean depression scores Show forest plot | 7 | Std. Mean Difference (IV, Random, 95% CI) | Subtotals only | |
| 2.1 Immediate outcomes 0‐8 weeks | 3 | 387 | Std. Mean Difference (IV, Random, 95% CI) | ‐0.17 [‐0.52, 0.18] |
| 2.2 Short‐term outcomes 9‐16 weeks | 5 | 1067 | Std. Mean Difference (IV, Random, 95% CI) | ‐0.14 [‐0.26, ‐0.02] |
| 2.3 Intermediate outcomes 17‐24 weeks | 1 | 30 | Std. Mean Difference (IV, Random, 95% CI) | ‐0.02 [‐0.74, 0.70] |
| 2.4 Long‐term outcomes >24 weeks | 3 | 324 | Std. Mean Difference (IV, Random, 95% CI) | ‐0.00 [‐0.22, 0.22] |
| 3 Interventions for at‐risk women ‐ diagnosis of depression Show forest plot | 5 | Risk Ratio (M‐H, Fixed, 95% CI) | Subtotals only | |
| 3.1 Immediate outcomes 0‐8 weeks | 1 | 39 | Risk Ratio (M‐H, Fixed, 95% CI) | 0.09 [0.01, 1.47] |
| 3.2 Short‐term outcomes 9‐16 weeks | 4 | 902 | Risk Ratio (M‐H, Fixed, 95% CI) | 0.47 [0.30, 0.74] |
| 3.3 Intermediate outcomes 17‐24 weeks | 1 | 37 | Risk Ratio (M‐H, Fixed, 95% CI) | 0.64 [0.17, 2.46] |
| 3.4 At final study assessment | 5 | 939 | Risk Ratio (M‐H, Fixed, 95% CI) | 0.48 [0.31, 0.74] |
| 4 Interventions for general population ‐ depressive symptomatology Show forest plot | 12 | Risk Ratio (M‐H, Random, 95% CI) | Subtotals only | |
| 4.1 Immediate outcomes 0‐8 weeks | 7 | 3767 | Risk Ratio (M‐H, Random, 95% CI) | 0.69 [0.46, 1.03] |
| 4.2 Short‐term outcomes 9‐16 weeks | 4 | 2614 | Risk Ratio (M‐H, Random, 95% CI) | 0.91 [0.58, 1.42] |
| 4.3 Intermediate outcomes 17‐24 weeks | 7 | 10485 | Risk Ratio (M‐H, Random, 95% CI) | 0.92 [0.81, 1.06] |
| 4.4 Long‐term outcomes > 24 weeks | 3 | 2655 | Risk Ratio (M‐H, Random, 95% CI) | 0.71 [0.51, 0.99] |
| 5 Interventions for general population ‐ mean depression scores Show forest plot | 12 | Std. Mean Difference (IV, Random, 95% CI) | Subtotals only | |
| 5.1 Immediate outcomes 0‐8 weeks | 3 | 847 | Std. Mean Difference (IV, Random, 95% CI) | ‐0.15 [‐0.56, 0.25] |
| 5.2 Short‐term outcomes 9‐16 weeks | 4 | 2561 | Std. Mean Difference (IV, Random, 95% CI) | ‐0.40 [‐1.24, 0.44] |
| 5.3 Intermediate outcomes 17‐24 weeks | 9 | 9914 | Std. Mean Difference (IV, Random, 95% CI) | 0.01 [‐0.03, 0.05] |
| 5.4 Long‐term outcomes > 24 weeks | 4 | 2123 | Std. Mean Difference (IV, Random, 95% CI) | ‐0.28 [‐0.87, 0.30] |
| 6 TEST FOR SUBGROUP DIFFERENCES: depressive symptomatology: at final study assessment Show forest plot | 20 | 14727 | Risk Ratio (M‐H, Random, 95% CI) | 0.78 [0.66, 0.93] |
| 6.1 Interventions for at‐risk women | 8 | 1853 | Risk Ratio (M‐H, Random, 95% CI) | 0.66 [0.50, 0.88] |
| 6.2 General population | 12 | 12874 | Risk Ratio (M‐H, Random, 95% CI) | 0.83 [0.68, 1.02] |
| 7 TEST FOR SUBGROUP DIFFERENCES: mean depression scores: at final study assessment Show forest plot | 19 | 12376 | Std. Mean Difference (IV, Random, 95% CI) | ‐0.13 [‐0.28, 0.01] |
| 7.1 Interventions for at risk women | 7 | 1087 | Std. Mean Difference (IV, Random, 95% CI) | ‐0.13 [‐0.25, ‐0.01] |
| 7.2 General population | 12 | 11289 | Std. Mean Difference (IV, Random, 95% CI) | ‐0.15 [‐0.33, 0.04] |